Download to read offline
![M. Mayor et al.: The HARPS search for southern extra-solar planets
(including measurement frequency, exposure time long enough 6
to diminish the different intrinsic stellar noises, and photon
Velocity semi−amplitude [m/s]
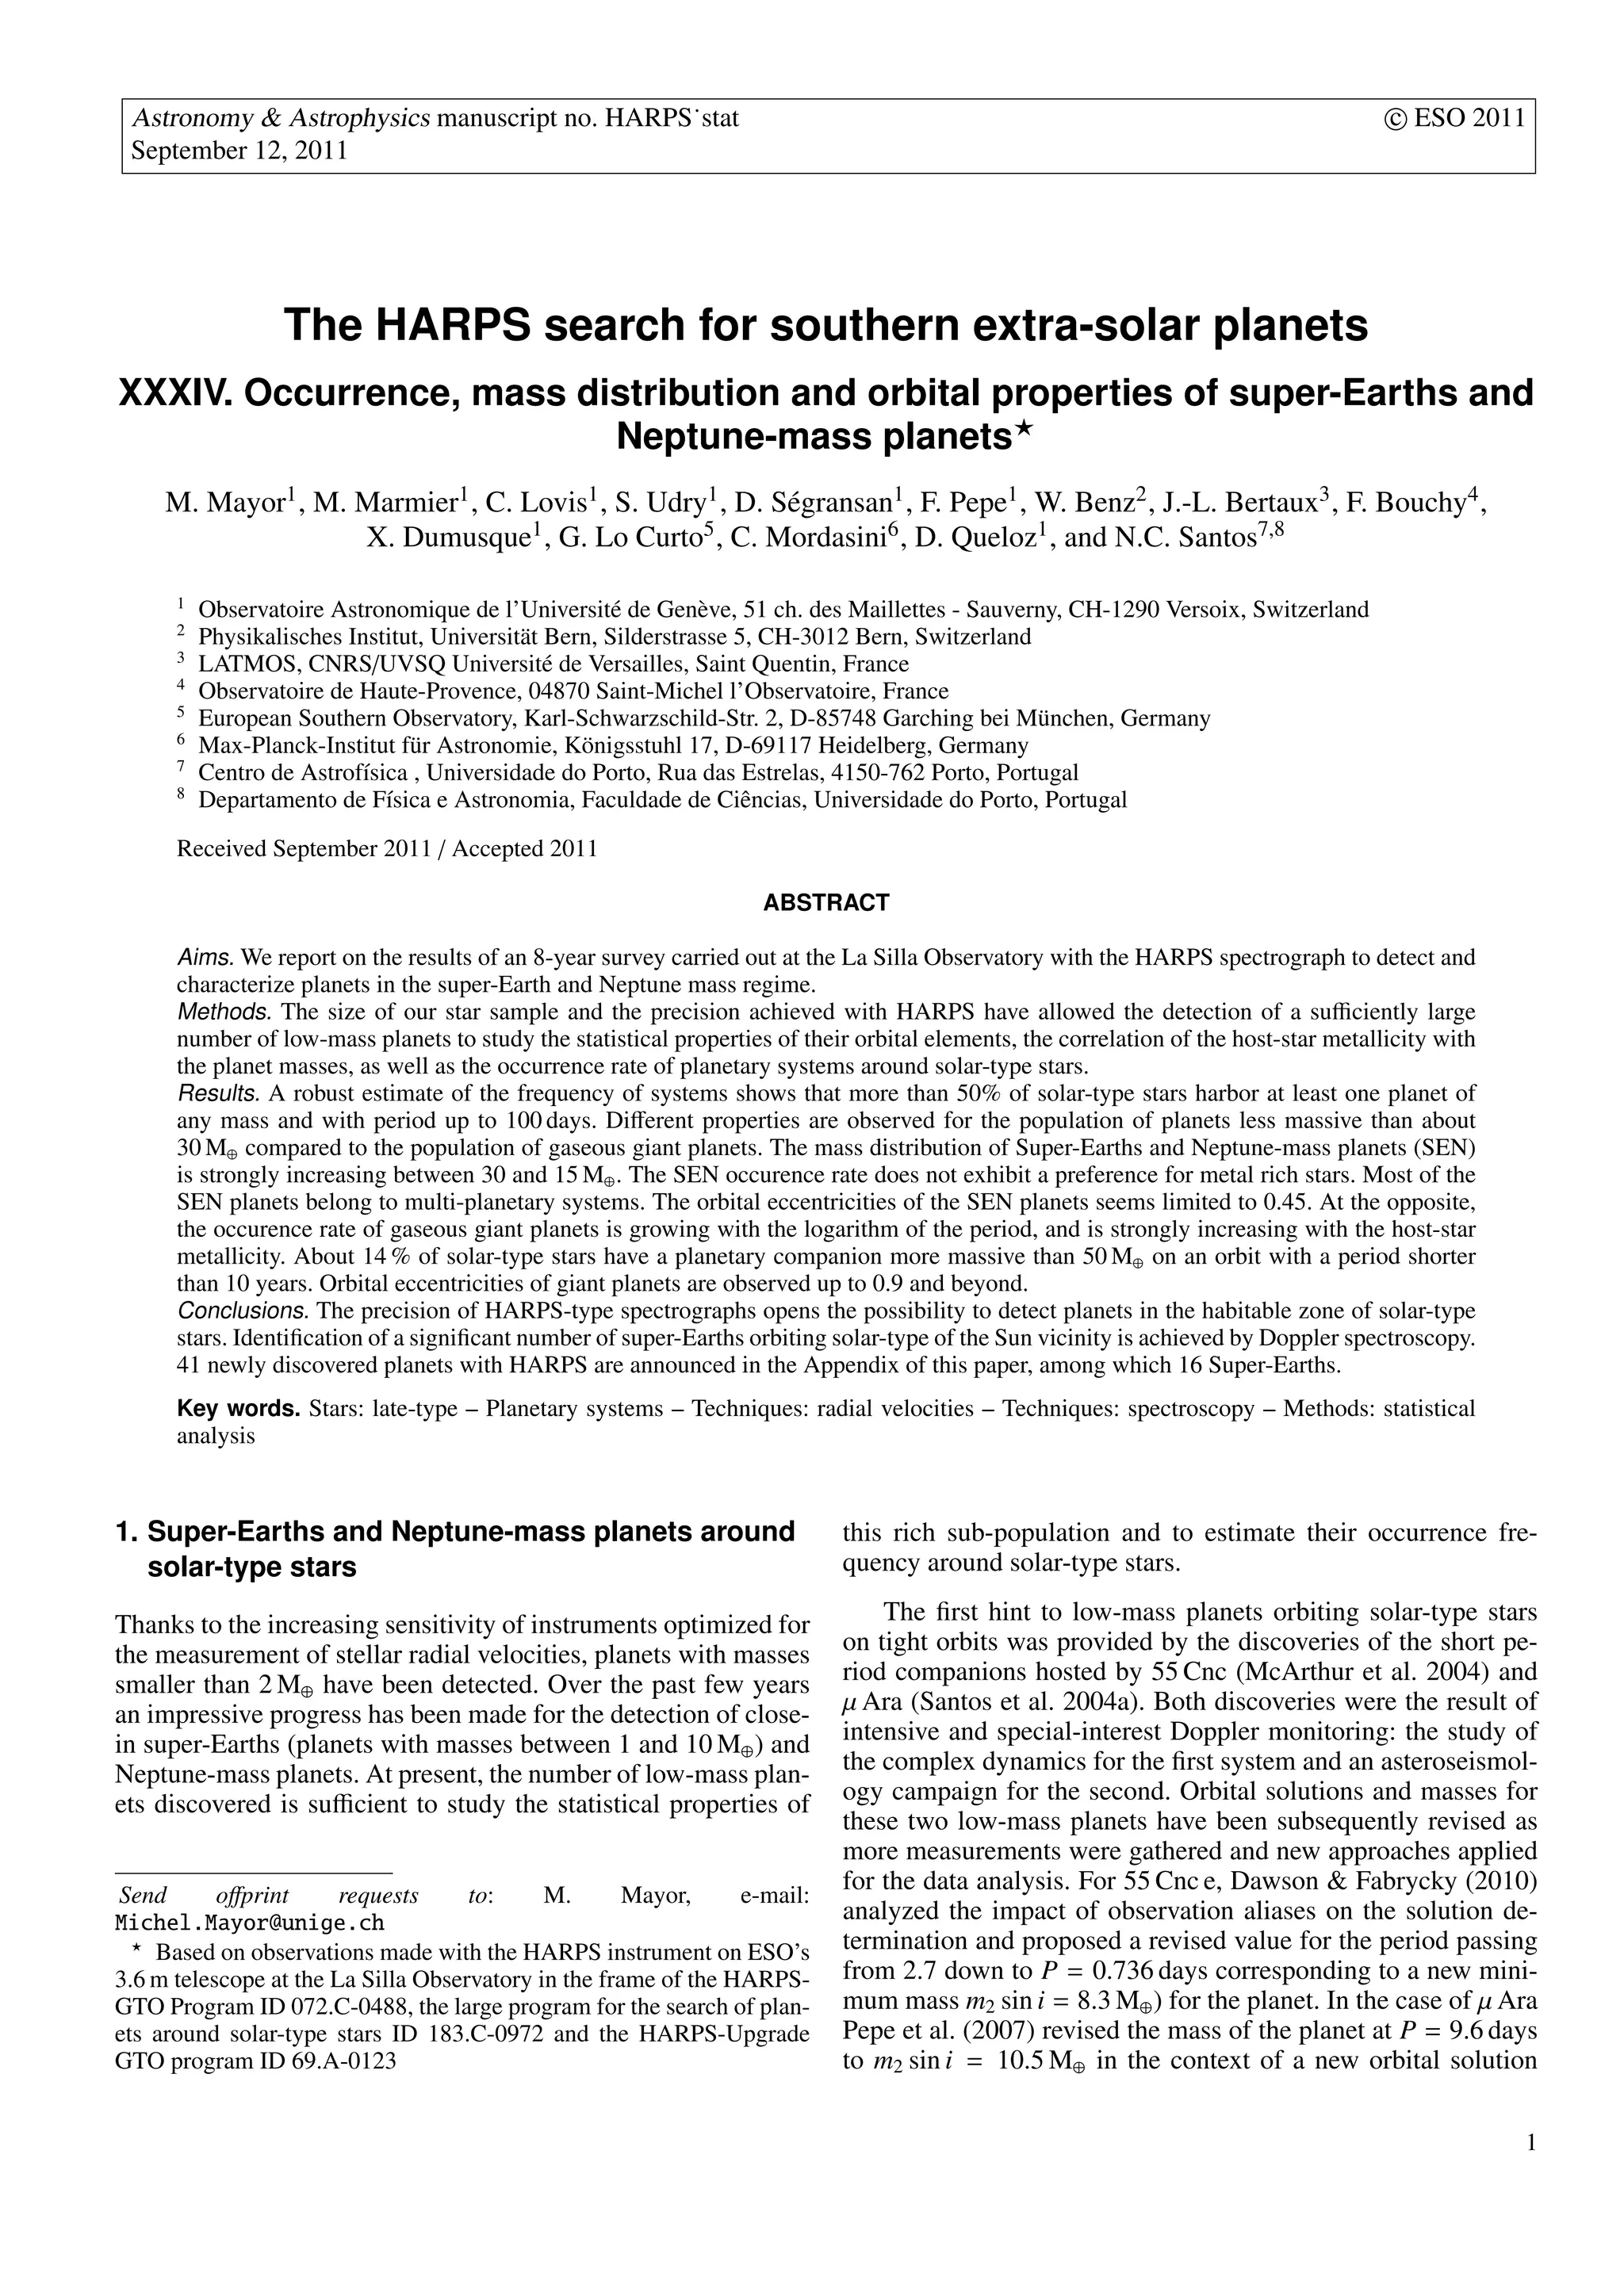
noise). In Fig. 2, we plot the representative points of the radial-
velocity semi-amplitudes K as a function of the logarithm of the
period log P for all super-Earths orbiting solar-type stars. Planets
detected in the frame of other surveys are identified by red sym-
bols and those of our surveys by blue dots. This plot is a straight- 4
forward illustration of the contribution of HARPS in this field.
The number of the newly detected super-Earths is impressive, as
well as the very small amplitudes presently detected by the in-
strument. This diagram shows how important the measurement
precision turns out to be for the correct estimation of the occur-
rence of low-mass planets, which may be strongly biased if the
low-mass planet detections delivered by HARPS were lacking. 2
Figure 3 presents the radial-velocity raw dispersion mea-
sured on the HARPS targets (only the histogram of rms less than
10 ms−1 is displayed). Superimposed, we have also illustrated
the histogram of the rms for stars with detected planetary sys-
tems. We should note that some planetary systems are detected
around stars having quite modest raw radial-velocity scatter, in 0
some cases smaller than 2 ms−1 . Once again, the importance of 1.0 10.0 100.0
the measurement precision turns out to be of fundamental impor-
tance when exploring the domain of super-Earth masses. After Period [days]
fitting planetary orbit(s) to our set of measurements we derive
the residuals around the orbital solutions (O − C). These residu- Fig. 2. Radial-velocity semi-amplitude K as a function of orbital period
als include all potential sources of noise, as instrumental errors, for super-Earths (M < 10 M⊕ ) hosted by solar-type stars. HARPS de-
photon noise, stellar intrinsic noise (acoustic oscillation, granu- tection are plotted as blue dots and objects from the literature in red
symbols (circles for the southern sky and square for the northern sky).
lation, activity, magnetic cycle), as well as still undetected small-
mass planets. Magnetic cycles, analogues to the Sun’s 11-year
cycle, can furthermore induce variations of the radial velocities
30
over several years and amplitudes up to 10 ms−1 (Lovis et al.
2011a). This effect is observed also for some stars with rather
low activity level. Conveniently however, several spectral signa-
tures (log RHK , width of the cross-correlation function (CCF) or
spectral line and CCF bisectors) can and must be used to identify
magnetic cycles and correct for their influences on the velocities
20
(Lovis et al. 2011a; Dumusque et al. 2011a). These spectral sig-
# stars
natures can also be used to test velocity variations on shorter
time scales (days or weeks) to detect the possible influence of
spots or other anisotropic features on the stellar surface. These
diagnostics are of particular importance when searching for low-
amplitude velocity variations, typical of low-mass planets. All
these tests have been applied to the HARPS and CORALIE 10
planet-host stars and are described in the corresponding discov-
ery papers. The histogram of the O − C (Fig. 4 for the HARPS
planetary systems is certainly the most significant estimation of
the global precision of the program. The mode of the O − C dis-
tribution lies at 1.4 ms−1 but many planetary systems show O−C
smaller than 1 ms−1 even with a large number of measurements 0
0 5 10
spanning several years of observations.
sigma RV [m/s]
4. Statistical analysis of the sample Fig. 3. Histogram of the radial-velocity dispersion for the stars of
the HARPS sample (black line). Only the part of the histogram with
4.1. The mass-period distribution
rms < 10 ms−1 is displayed. The red histogram represents the raw
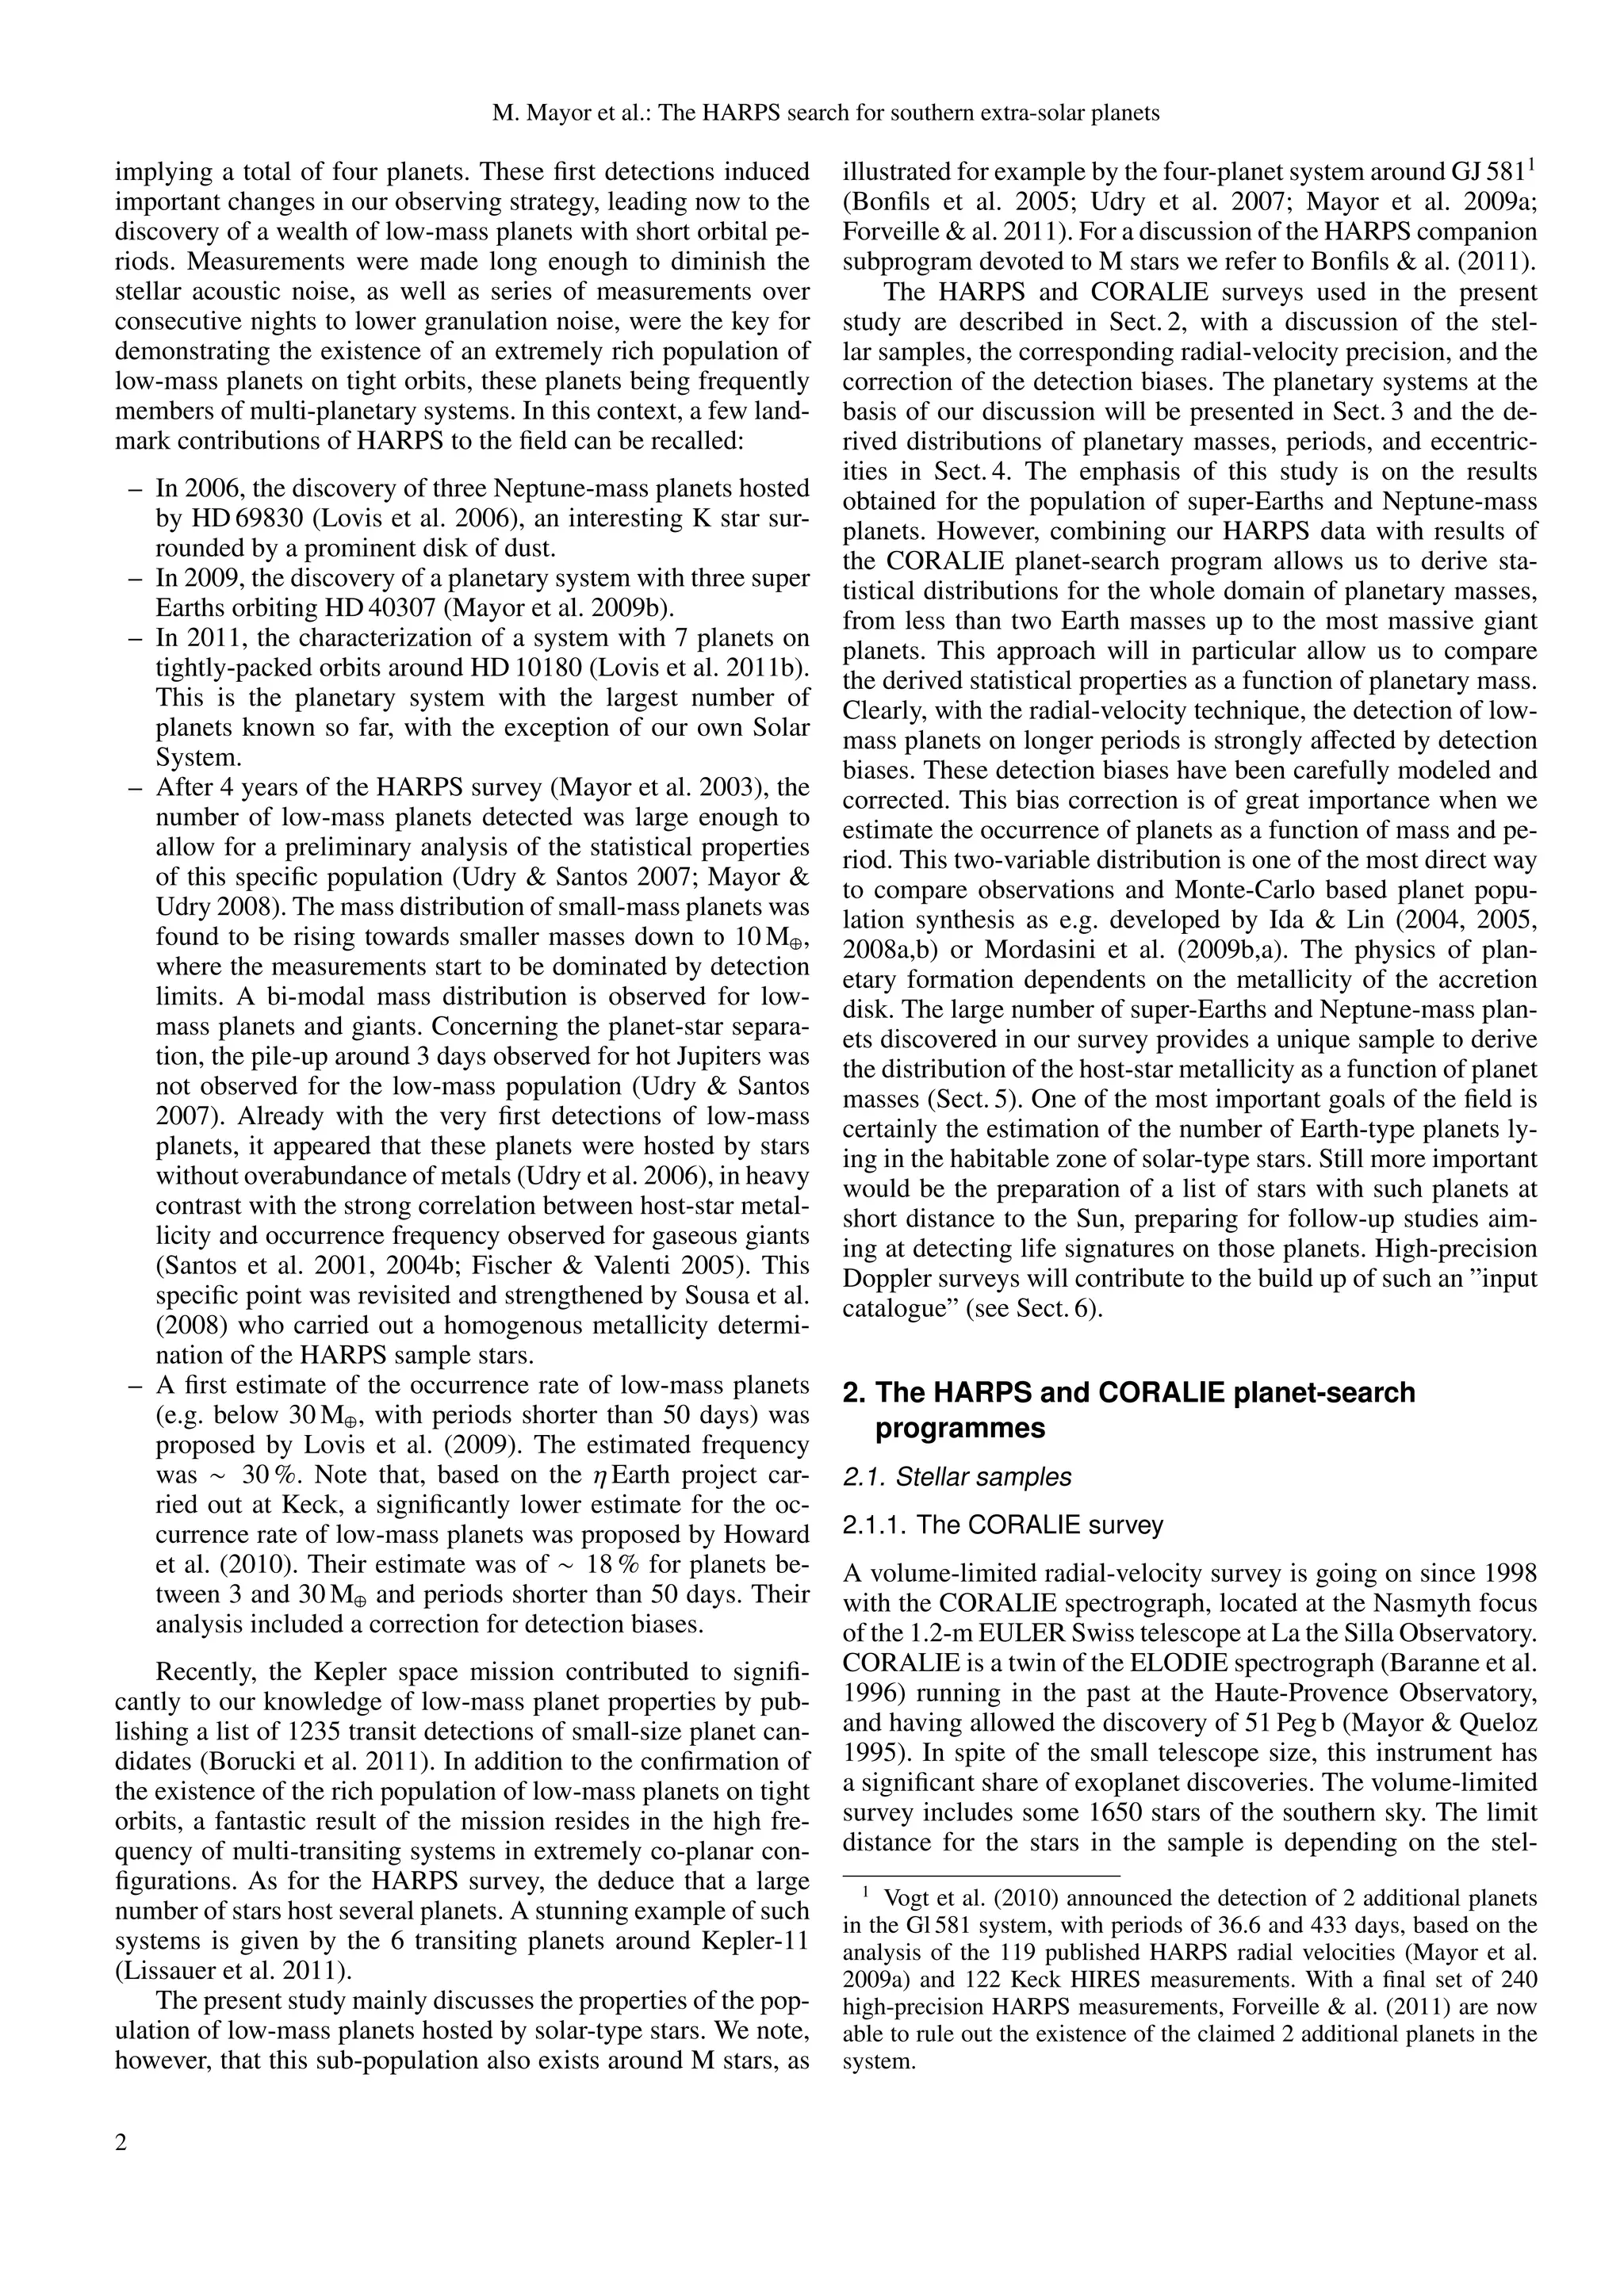
The (m2 sin i, log P) diagram for the planetary systems and can- radial-velocity dispersion for stars with detected exoplanets.
didates detected in our survey is displayed in Fig. 5. Fig. 6 illus-
trates the same information, including lines of detection prob-
ability at various levels of completeness for the global sample. in a region of very low-detection probability. The discovery
Several remarks can be made: of 9 planets close to the 2 % detection probability line was
only possible thanks to an extremely large number of radial-
– Objects with masses of about 1 ms−1 at very short period, and velocity measurements of these stars. The detection of these
about 5 ms−1 at one year define a lower envelope of the dis- planets is already a strong hint to the high occurrence rate of
played planets. The planets at this lower envelope are located low-mass super-Earths.
5](https://image.slidesharecdn.com/eso1134b-110912142134-phpapp02/75/Eso1134b-5-2048.jpg)
![M. Mayor et al.: The HARPS search for southern extra-solar planets
15
[Earth Mass]
1000.
10
# stars
100.0
M2sini
5
10.0
0 1.0
0 5 10 10+0 10+1 10+2 10+3 10+4
RV O−C [m/s] Period [days]
Fig. 4. Histogram of the O − C residuals after fitting the (multi-) Fig. 5. Plot of the 155 planets (dots) and 6 candidates (triangles) of the
Keplerian model to the velocity measurements of a star with planets. considered HARPS+CORALIE sample in the m2 sin i − log P plane .
The O − C dispersions include all possible sources of noises (photon
noise, instrumental errors and stellar jitter), as well as the signal from
still undetected planets. Note that a significant fraction of the O − C lies with the logarithm of the orbital period, a feature already
below 1 ms−1 . noticed in several giant planet searches (Marcy et al. 2005;
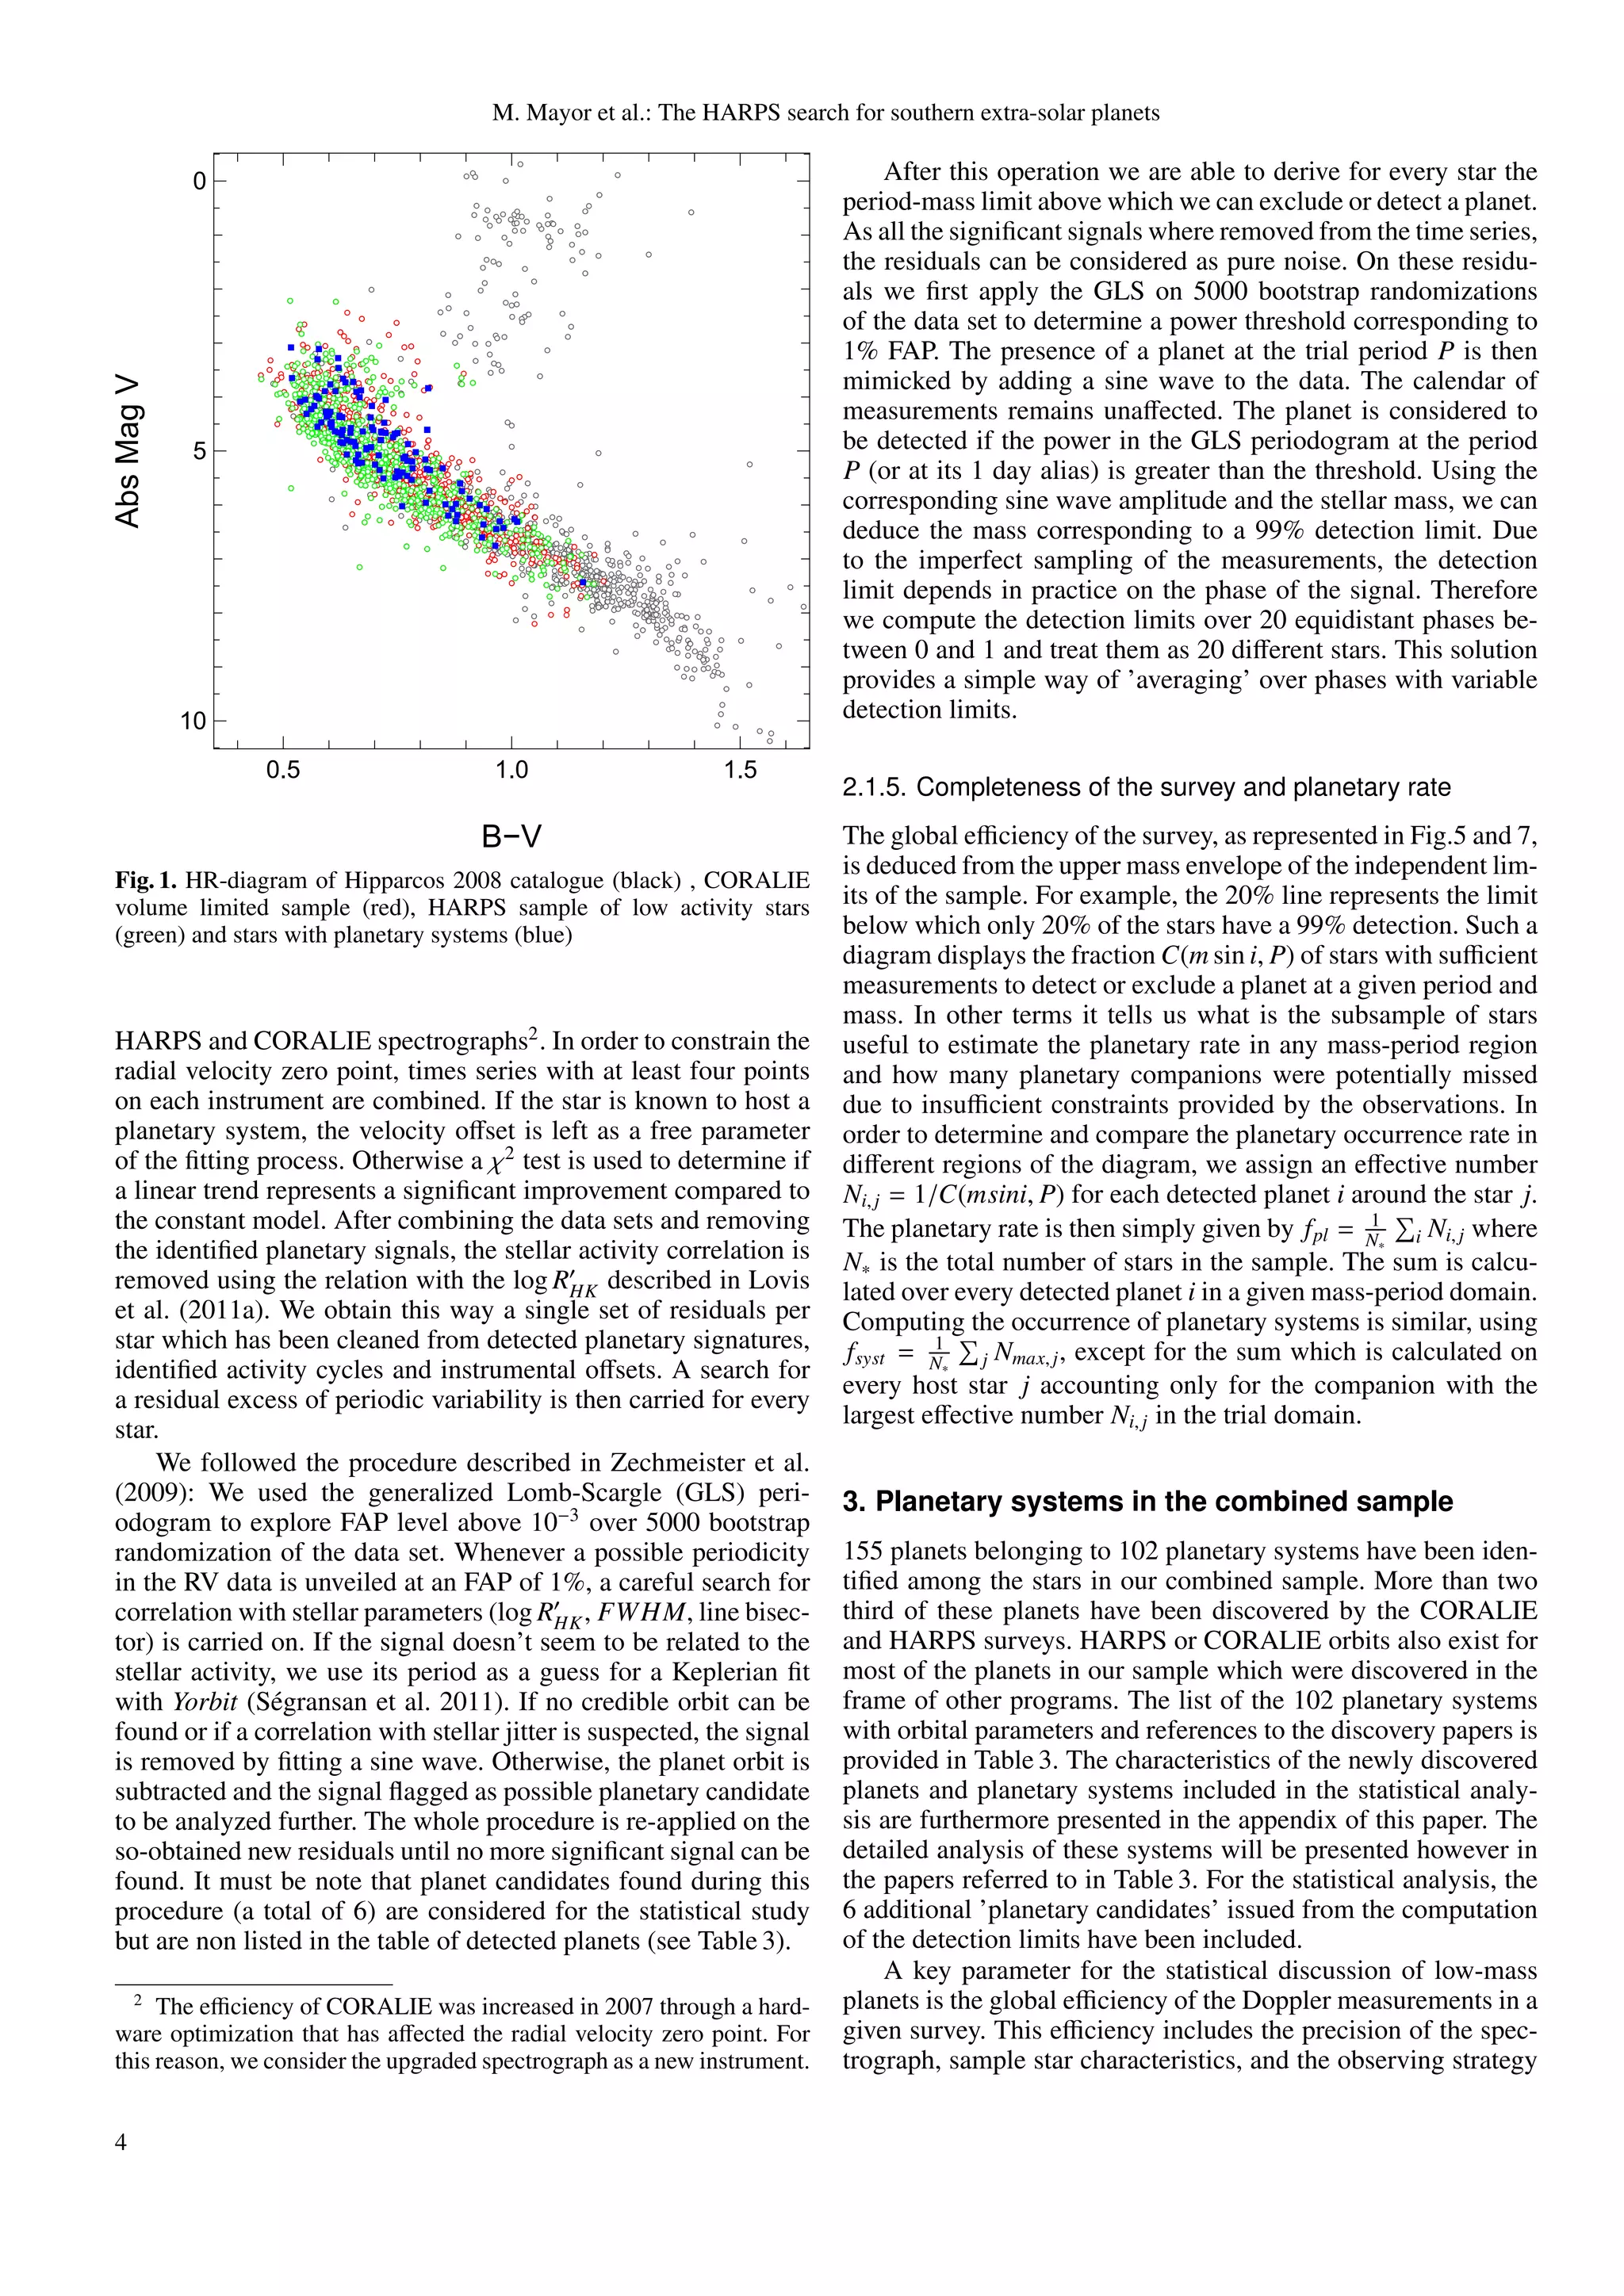
Udry & Santos 2007). Figure 8 illustrates the histogram of
the masses of planets with m2 sin i > 50 M⊕ as a a function of
– The density of massive super-Earths seems to exhibit a orbital period. The observed distribution (continuous black
”mass-period” relation. The extremum of the density appears line) as well as the bias-corrected distribution (dashed red
to drift from about 6 M⊕ at 10 days to more than 10 M⊕ at line) illustrate the rising occurrence of gaseous planets with
100 days. We do not believe that observation biases can ex- orbital periods. Setting the low-mass limit of the considered
plain the upper envelope of this feature relation, since heavy subsample to 100 M⊕ does not change the general shape of
planets at sorter periods would be detected more easily (as the distribution.
indicated by the detection limits). Given the fact that the low-
mass planets are all issued from the HARPS sample, it is
interesting to consider the detection limits achieved for the 4.2. Occurrence rate of planets as a function of planetary
376 HARPS-stars only measured. The (m2 sin i, log P) distri- masses
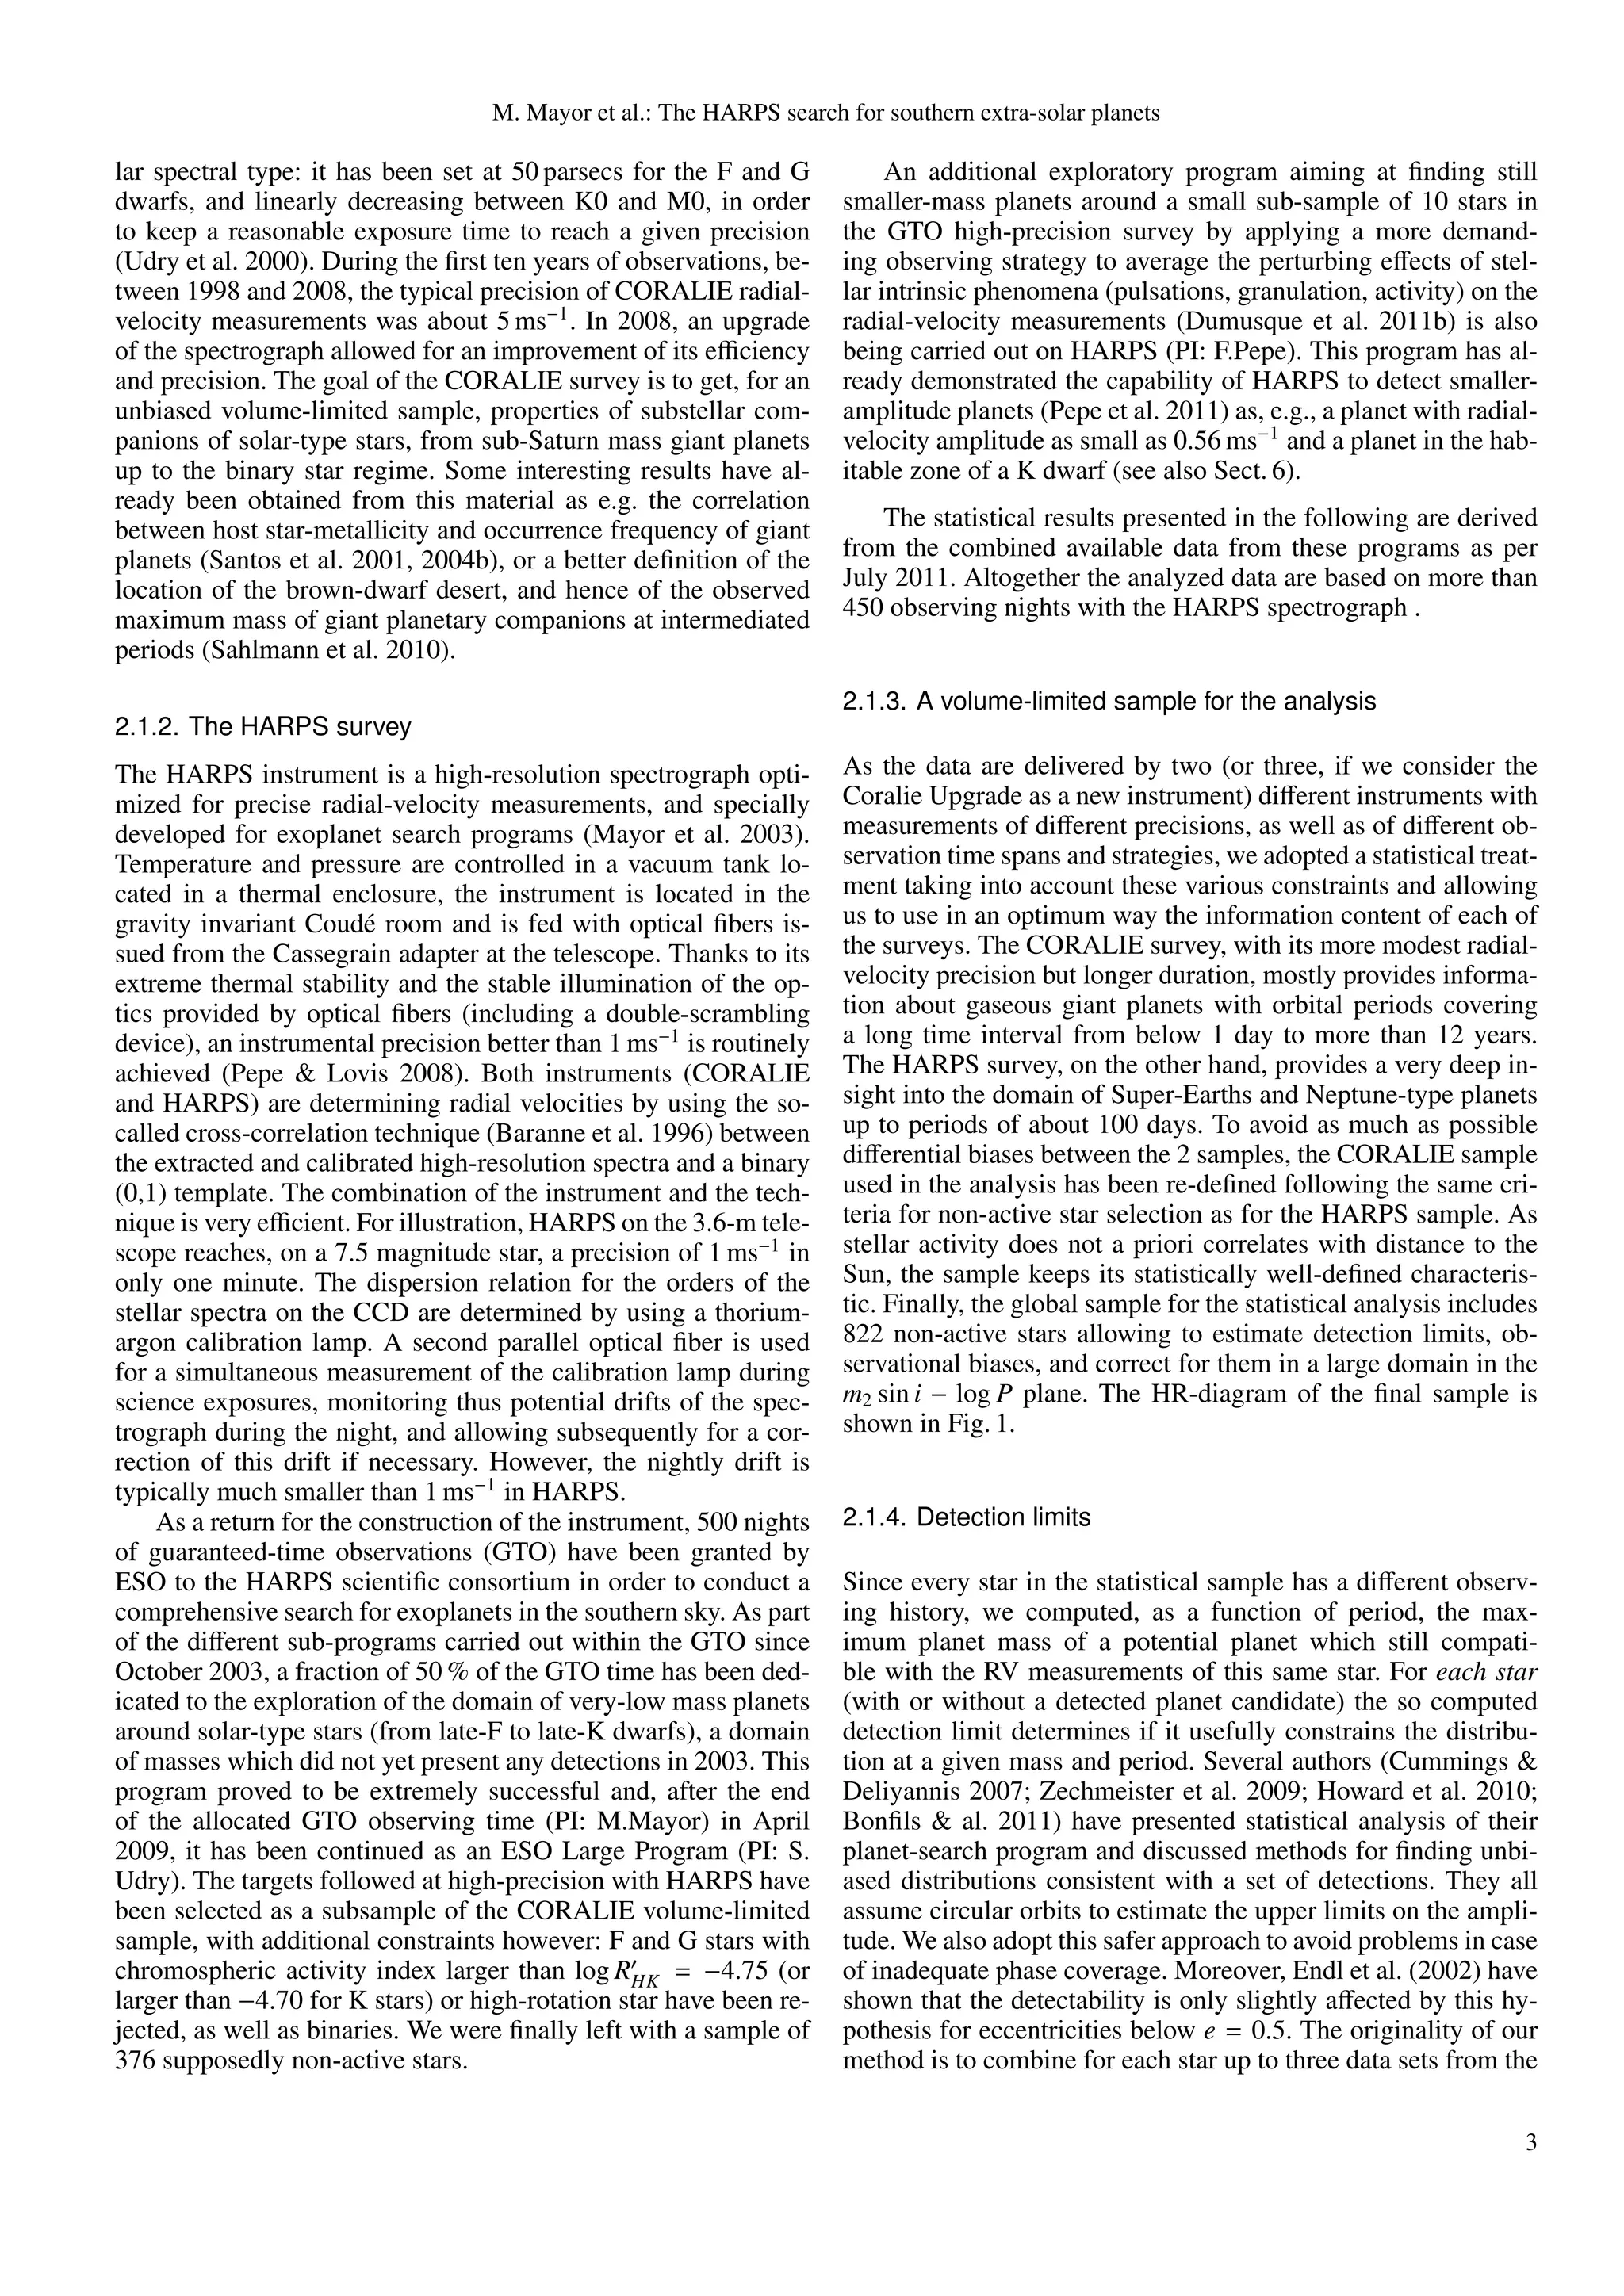
bution for the HARPS subsample only is displayed on Fig. 7.
We note that the average detection probability of a Neptune- The estimation of the frequency of stars with a planet in a spe-
mass planet with a period of 100 days is still 60 %. The cific domain of the m2 sin i − log P parameter space requires the
strongly decreasing density of super-Earths and Neptune- correction of observations from the detection incompleteness.
mass planets (almost coincident with the red line correspond- Actually as explained in Sect. 2.1.4, it is more taking into ac-
ing to a detection of 60 percent) seems to be a highly signif- count the incompleteness determination in our occurrence esti-
icant feature. mate. In the case we consider a large zone in the m2 sin i − log P
– We do not have Neptune-mass planets (and objects up to plane, the presence of multi-planetary systems in the zone makes
50 M⊕ ) with periods larger than about 1000 days, despite the this operation ambiguous. For those systems, we have adopted
still non-neglectable detection probability in that domain of the correction associated with the planet the most difficult to
mass-period. For the moment this feature is not clearly un- detect, as its higher statistical weight dominates the area. We
derstood. It could be the result of a detection bias related present in Table 1 the occurrence rate for different domains of
to the lack of measurements done for these low-amplitude masses and periods. We do not try to do any extrapolation of our
and long-period objects, or simply due to the paucity of such results out of the range of the observed parameters, as e.g. to-
planets beyond 1 or 2 AU. For the moment we do not con- wards smaller masses or longer periods. For example, as we do
sider this feature as being significant. not have any knowledge of the distribution of orbital periods of
– An ”upper mass–log P” relation is observed in the diagram, super-Earths above ∼ 100 days, we consider an extrapolation out
as already pointed out in (Udry et al. 2003). The diagram to the habitable zone around the stars as being of no significance
suggests that the upper mass for jovian planets on short pe- the time being. This is also true for the distribution towards very
riods (10 days) is close to one Jupiter and rises to 15 Jupiter low masses, at any given period. An exponential extrapolation of
masses at orbital periods of 10 years. the mass distribution towards very low mass planets is not jus-
– Not only the upper mass of planets is period dependent but tified if, for instance, a third, distinct population of Earth-mass
the frequency of gaseous giant planets is strongly increasing planets is supposed, as suggested by Monte-Carlo simulations of
6](https://image.slidesharecdn.com/eso1134b-110912142134-phpapp02/75/Eso1134b-6-2048.jpg)
![M. Mayor et al.: The HARPS search for southern extra-solar planets
planetary rate: 14% ± 2 100.0
100% 95%
47% ± 7
95% 80%
[Earth Mass]
[Earth Mass]
80% 60%
1000.
60% 40%
40% 20%
20% 10%
10% 5%
100.0 5% 10.0 2%
2%
M2sini
M2sini
10.0
1.0
1.0
10+0 10+1 10+2 10+3 10+4 1.0 10.0 100.0
Period [days] Period [days]
Fig. 6. Same as Fig. 5 with detection probability curves superimposed. Fig. 7. Same as Fig. 5 but only for the HARPS subsample. The occur-
These detection probabilities are valid for the whole sample of 822 rence rate of planetary systems in the limited region between 3 and
stars. After correcting for the detection bias, the fraction of stars with 100 M⊕ , and with P < 1 year, is 47 ± 7 %. Again, only the red dots and
at least one planet more massive than 50 M⊕ and with a period smaller the blue triangles (candidates) have been considered for the computa-
than 10 years is estimated to be 14 ± 2 %. The red points represent the tion of the occurrence rate.
planets which have been used to compute the corrected occurrence rate
in the box indicated by the dashed line. The planets lying outside the
box or being part of a system already taken into account are excluded;
they are shown in black.
# Jupiter & cumulative rate [%]
20
planet population synthesis based on the core-accretion scenario
(e.g. Mordasini et al. 2009b,a).
Based on the η-Earth survey carried out at Keck observa-
tory, Howard et al. (2010) have derived an estimate of the oc- 15
currence rate of low-mass planets on tight orbits (≤ 50 days) as
well as their mass distribution. The comparison of our results
in the same range of parameter space with the eta-Earth esti-
mate is given in Table 2. The results are also shown graphically 10
in Fig. 9, where the occurrence rate is indicated for the boxes
defined by Howard et al. (2010). As a result of our much larger
stellar sample, but also due to the better sensitivity of HARPS
with regard to low-mass planets, the number of detected plan-
5
ets is significantly larger than the one issued from the Keck sur-
vey. This is specifically important for super-Earths and Neptune-
mass planets (see Fig. 2. Our estimate for the occurrence rate
of planetary systems is stunningly large. Table 1 lists the esti-
mation of the frequency of planetary systems for different part 0
1.0 10.0 100.0 1000.
of the m2 sin i − log P plane. We should emphasize for example
that 75 % of solar type stars have a planet with a period smaller
than 10 years. This result is limited to the domain of detectable Period [days]
planets, and does not involve extrapolations out of that domain. Fig. 8. Histogram of the planet frequency for planets with masses
Another interesting result is obtained for the low-mass planets (m2 sin i > 50 M⊕ ). The occurrence rate for gaseous giant planets is
on tight orbits: about half of solar-type stars is an host of this strongly increasing with the logarithm of the period log P.
type of planets.
Despite the significant size of our sample of 822 stars, the
number of hot Jupiters is quite small (5 planets with P < (Bonfils & al. 2011). Despite the rather limited range of stel-
11 days). The estimated frequency, 0.9 ± 0.4% is compatible lar masses in our sample, we have tried a comparison of the
with previous estimates. (For a more complete discussion of the (m2 sin i − log P) distribution for dwarf stars of spectral type F
CORALIE-alone sample we refer to Marmier et al. (in prep). We and G versus the distribution for K dwarfs. The observed differ-
know that the mass distribution of planets hosted by G dwarfs ence of planetary rate (for periods smaller than 100 days) for the
is different from its equivalent for planets hosted by M dwarfs two spectral types is however not significant (Table 1).
7](https://image.slidesharecdn.com/eso1134b-110912142134-phpapp02/75/Eso1134b-7-2048.jpg)
![M. Mayor et al.: The HARPS search for southern extra-solar planets
Table 1. Occurrence frequency of stars with at least one planet in the defined region. The results for various regions of the m2 sin i − log P plane
are given.
Mass limits Period limit Planetary rate based on Planetary rate Comments
published planets including candidates
> 50 M⊕ < 10 years 13.9 ± 1.7 % 13.9 ± 1.7 % Gaseous giant planets
> 100 M⊕ < 10 years 9.7 ± 1.3 % 9.7 ± 1.3 % Gaseous giant planets
> 50 M⊕ < 11 days 0.89 ± 0.36 % 0.89 ± 0.36 % Hot gaseous giant planets
Any masses < 10 years 65.2 ± 6.6 % 75.1 ± 7.4 % All ”detectable” planets with P < 10 years
Any masses < 100 days 50.6 ± 7.4 % 57.1 ± 8.0 % At least 1 planet with P < 100 days
Any masses < 100 days 68.0 ± 11.7 % 68.9 ± 11.6 % F and G stars only
Any masses < 100 days 41.1 ± 11.4 % 52.7 ± 13.2 % K stars only
< 30 M⊕ < 100 days 47.9 ± 8.5 % 54.1 ± 9.1 % Super-Earths and Neptune-mass planets on tight orbits
< 30 M⊕ < 50 days 38.8 ± 7.1 % 45.0 ± 7.8 % As defined in Lovis et al. (2009)
Table 2. Comparison of detected planets detected and occurrence rate of the η Earth survey (Howard et al. 2010) and HARPS-CORALIE survey.
The comparison is restricted to planets with orbital periods smaller than 50 days. N1 stands for the numbers of detected planets, N2 stands for the
number of candidates, and N3 represents the estimated occurrence rate of planets in the given mass range.
Mass range HARPS & CORALIE survey η Earth survey
Nb of planets Planetary rate Nb of planets Planetary rate
M⊕ N1 N2 N3 [%] N1 N2 N3 [%]
3-10 19 2 48.5 16.6 ± 4.4 5 3 10.2 11.8 ± 4.3
10-30 25 1 20.6 11.1 ± 2.4 4 1 4.6 6.5 ± 3.0
30-100 5 1 4.6 1.17 ± 0.52 2 1.6 ± 1.2
100-300 4 0 0.8 0.58 ± 0.29 2 1.6 ± 1.2
300-1000 2 0 0 0.24 ± 0.17 2 1.6 ± 1.2
rection of detection biases (Fig. 12), we see even more clearly the
100%
importance of the population of low-mass planets on tight orbits,
95%
with a sharp decrease of the distribution between a few Earth
[Earth Mass]
1000. 80%
0.2% ± 0.2 masses and ∼ 40 M⊕ . We note that the planet population synthe-
60%
sis models by Mordasini et al. (2009b) predicted such a mini-
40%
mum in the mass-distribution at precisely this mass range. They
0.6% ± 0.3 20% also pointed out that a radial-velocity measurement precision of
100.0
10% about 1 ms−1 was required in order to detect this minimum. In the
1.2% ± 0.5 5% framework of the core accretion model, this can be understood
2% by the fact that this mass range corresponds to the runaway gas
11% ± 2 accretion phase during which planets acquire mass on very short
timescales. Therefore, unless timing is such that the gaseous disk
M2sini
10.0 vanishes at this moment, forming planet transits quickly through
17% ± 4
this mass range and the probability to detect these types of plan-
24% ± 12
ets is reduced correspondingly. In Fig. 12 the importance of the
correction of the detection biases below 20 M⊕ is only the re-
1.0 flection of the present observing situation for which only a lim-
ited fraction of the sample has benefited from the large enough
10+0 10+1 10+2 10+3 10+4 number of HARPS measurements, required to detect small-mass
objects. Part of this correction is also related to the growing im-
Period [days] portance of the sin i effect with decreasing masses.
Fig. 9. Same as Fig. 6. The dashed lines represent the boxes in which
the occurrence rate is computed as defined by Howard et al. (2010). An
additional box is shown for masses between 1 and 3 M⊕ . 4.4. The period distribution of Super-Earth and
Neptune-mass planets
4.3. The mass distribution The observed distribution of orbital periods for planets less mas-
sive than 30 M⊕ is illustrated in Fig.13. In Fig.14, the same dis-
On Fig.10 we have plotted the histogram of masses of the plan- tribution is reproduced with a black histogram, to be compared
ets detected in our sample. We observe a drastic decline of with the histogram after correction for detection incompleteness
the observed mass distribution from about 15 to 30 M⊕ . If we (red histogram). In agreement with Kepler’s preliminary find-
limit the range of orbital periods and only consider planets with ings (Borucki et al. 2011), the sub-population of low-mass planet
P < 100 days (Fig. 11), a region where the detection bias are not appears mostly confined to tight orbits. The majority of these
too important for low-mass planets, we immediately observe the low-mass planets have periods shorter than 100 days. Low-mass
preponderant importance of the sub-population of super-Earths planets on longer periods are of course more affected by detec-
and Neptune-mass planets in that domain of periods. After cor- tion limits, this is however, at least partly, taken into account in
8](https://image.slidesharecdn.com/eso1134b-110912142134-phpapp02/75/Eso1134b-8-2048.jpg)
![M. Mayor et al.: The HARPS search for southern extra-solar planets
100
20
# planets
# planets
50
10
0 0
10.0 100.0 1000. 10.0 100.0
M2sini [Earth Mass] M2sini [Earth Mass]
Fig. 10. Observed mass histogram for the planets in the combined sam- Fig. 12. Histograms of planetary masses, comparing the observed his-
ple. Before any bias correction, we can already notice the importance togram (black line) and the equivalent histogram after correction for the
of the sub-population of low-mass planets. We also remark a gap in the detection bias (red line).
histogram between planets with masses above and below ∼30 M⊕ .
20
10
15
# planets
# planets
10
5
5
0
10.0 100.0
0
10.0 100.0 1000.
Period [days]
M2sini [Earth Mass] Fig. 13. Observed period distribution for low-mass planets (m2 sin i <
30 M⊕ )
Fig. 11. Same as Fig. 10 but for planets with periods smaller than
100 days. We see the dominance of low-mass planet with short orbital
periods. 4.5. Orbital eccentricities of Super-Earth and Neptune-type
planets
Figure 15 displays the orbital eccentricities as a function of the
planetary mass. We can remark the very large scatter of orbital
eccentricities measured for gaseous giant planets, some of them
our bias estimate and correction. We conclude that this feature having eccentricities as large as 0.93. Such very large eccentric-
must be real. ities are not observed for planets with masses smaller than about
30 M⊕ for which the most extrem values are limited around 0.45.
9](https://image.slidesharecdn.com/eso1134b-110912142134-phpapp02/75/Eso1134b-9-2048.jpg)
![M. Mayor et al.: The HARPS search for southern extra-solar planets
4.6. Fraction of multiplanetary systems with low mass
planets
80 For systems with planets less massive than 30 M⊕ , the fraction
of multi-planetary systems is extremely high. For the 24 con-
cerned systems this fraction exceeds 70 %. It is tempting to have
a rate of multi-planetary systems hosting at least one gaseous
60 giant planets. Unfortunately, the optimum observing strategy
# planets
needed to detect low-mass planets has not been applied to every
stars with giant planets in past. Presently, we observe a multi-
planetary rate of only 26 % for these planets. This point will
have to be revisited with additional precise velocities. For the
40
formation of planetary systems, the existence of systems with
one gaseous giant planet with large period and a low-mass planet
on a tight orbit could be of interest. A few systems having these
characteristics can be listed: HD 10180, HD 11964, HD 134060,
20
HD 160691, HD 181433, HD 204313, and HD 215456.
5. Host star metallicities as a function of planetary
0 masses
10.0 100.0
The occurrence rate of giant gaseous planets strongly correlates
Period [days] with the host star metallicity. Large unbiased studies have pro-
vided a robust and well-defined relationship between the fre-
Fig. 14. Observed period distributions for low-mass planets (m2 sin i < quency of gaseous giant planets and the metallicity of their host
30 M⊕ ) before (black histogram) and after (red histogram) correction for star (e.g. Santos et al. 2001, 2004b; Fischer & Valenti 2005).
the detection bias. Most of the low-mass planets are confined on short
The lack of correlation between the overabundance of heavy el-
period orbits. The mode of the distribution appears just over 40 days.
ements and the mass of the convective zone of the star (Santos
et al. 2004b) is seen as a strong argument in favour of an origin
1.0 of the planet-metallicity correlation linked with the primordial
abundance of the molecular cloud.
For lower-mass planets, already after the very few first de-
tections (Udry et al. 2006) suggested the absence of correlation
between the host star metallicity and the presence of low-mass
planets. This first claim was later confirmed by (Sousa et al.
2008) on a larger but still limited sample. The present analy-
sis of a statistically well-defined, much larger sample of low-
Ecentricity
mass planets, offers the opportunity to have a much more ro-
bust insight in the relation between planet occurrence frequency,
0.5 host star metallicity, and planet mass. For the analysis, multi-
planetary systems will be only characterized by their most mas-
sive planet. In Fig. 16, we can compare the histograms of host-
star metallicities for planets with masses smaller than 30 M⊕ and
its equivalent for gaseous giant planets. On the same plot, the
metallicity distribution for the stars in the global combined sam-
ple is illustrated for an enlightening comparison. It is however
not clear whether we observe a discontinuity in the-host star
metallicity distributions with an increasing planetary mass. On
Fig.17, the ([Fe/H], m2 sin i) diagram can be used to set a limit
0.0
between the two regimes of host star metallicity (if such a limit
10.0 100.0 1000. proves to be meaningful!). On the diagram, such a limit can be
set at about 30-40 M⊕ . At the exception of a single star, all the
M2sini [Earth Mass] stars hosting planets less massive than 40 M⊕ have metallicities
below [Fe/H] = 0.20. This is well in contrast with the situation
Fig. 15. Mass-eccentricity diagram for the planets in the combined sam-
ple. for stars hosting more massive planets. Interestingly this mass
corresponds about to local the minimum in the mass distribu-
tion between Neptunes and gaseous giants (see e.g. Fig. 10 or
Fig. 11).
The correlation between the occurrence of giant planets and
the metallicity of the host star (i.e. the metallicity of the ma-
For low-mass planets the estimation of small orbital eccentricites terial in the proto-planetary disc) is a natural outcome of the
of the best keplerian fit is biased. For the moment, the eccentric- core accretion planet formation theory. In this paradigm, mas-
ities below 0.2 (and small masses) have to be considered with sive gaseous planets form by runaway gas accretion onto cores
caution . exceeding a critical mass, typically of the order of 10 − 20 M⊕ .
10](https://image.slidesharecdn.com/eso1134b-110912142134-phpapp02/75/Eso1134b-10-2048.jpg)
![M. Mayor et al.: The HARPS search for southern extra-solar planets
15
10
Fe/H [dex]
0.0
# planets
5
−0.5
0
−0.5 0.0 0.5 10.0 100.0 1000.
Fe/H [dex] M2sini [Earth Mass]
Fig. 16. Histograms of host star metallicities ([Fe/H]) for giant gaseous Fig. 17. Estimation of the planetary-mass limit between the two regimes
planets (black), for planets less massive than 30 M⊕ (red), and for the for the metallicity dependance of host stars. A vertical line at 30 M⊕
global combined sample stars (blue). The latter histogram has been mul- distinguishes the two populations. We should note that such a limit also
tiplied by 0.1 for visual comparison reason. corresponds to the gap in the mass distribution (see Fig.10 and 12). On
the right side of the vertical line we do not observe significant changes
of the metallicity distribution above 30 M⊕. We remark that stars with
The gas accretion from the disc goes on until the disc vanishes, metallicity exceeding 0.15 are for their huge majority associated with
typically after a few million years. Hence, the sooner in the evo- planets more massive than 30 M⊕ .
lution of the disk a critical-mass core can form, the larger the
amount of gas that will still be available for accretion. A high
metallicity (interpreted as a large dust-to-gas ratio in the mod- 2009a). The minimum mass and orbital period of Gl 581 d are
els) and/or massive discs favors the early growth of such critical 7 M⊕ and 66 days. Despite its rather short period the planet ap-
cores. Conversely, lower-mass planets that do not accrete signifi- pears as the first super-Earth discovered in the habitable zone
cant amount of gas, can grow their cores over a longer timescale due to the very late spectral type and low mass of Gl 581 (M5V,
and therefore do not depend as critically upon the metallicity. 0.3 M⊕ ). Models of the atmosphere of Gl 581 d have demon-
These effects have been born out in the population synthesis strated the possibility of habitability (Kaltenegger et al. 2011a;
models by Mordasini & al. (2011). Wordsworth et al. 2011; Hu & Ding 2011). The discovery
of another super-Earth in the habitable zone of the same star
6. Planets in the habitable zone of solar-type stars (G 581 g) was claimed by (Vogt et al. 2010). Statistical reanalysis
of the published velocity data could unfortunately not confirm
All the very specific properties of the population of low-mass the detection (Andrae et al. 2010; Gregory 2011; Tuomi 2011).
planets (super-Earths and Neptune-mass planets) are of special Doubling the number of available precise HARPS measurements
interest for constraining the formation of planetary systems. In Forveille & al. (2011) ruled out the existence of Gl 581 g.
addition to this, the surveys targeting low-mass planets, in the A new program to explore the possibility to detect habitable
same way as the parallel efforts aiming to increase the precision planets orbiting solar-type stars with HARPS started 2 years ago
of spectrographs optimized for Doppler measurements are pur- (Pepe et al. 2011). A measurement strategy is applied to limit the
suing a still more difficult challenge, the detection of Earth twins, influence of stellar noises (acoustic and granulation noises) and
rocky planets orbiting stars in the so-called habitable zone, and observations are carried out as often as possible, ideally over sev-
possibly around stars as close as possible to the Sun. This last eral years, in order to extract a potential planetary signal possibly
condition is of special importance for future experiments aiming hampered by lower frequency noise sources (spots etc). This ob-
at the spectroscopic follow-up of the planet, in order to e.g. char- serving strategy is quite demanding in terms of telescope time,
acterize its atmosphere. For this long-term goal we would like and forced us to limit the size of this precursor sample to only
to contribute to an ”input catalogue” with a significant number 10 solar-type stars. These 10 stars where selected according to
of entries. Would Doppler spectroscopy have a chance to fulfill their proximity (< 16 pcs) and for having a low level of chromo-
such an ambitious goal? spheric activity. After only 2 years, already 5 low-mass planets
At present, already 2 super-Earths located in the habitable have been discovered orbiting three stars among the ten (Pepe
zone of their host star have been detected with the HARPS in- et al. 2011). We should first mention a 3-planet system hosted
strument. The first one, Gl 581 d is part of a multi-planetary sys- by the metal deficient ([Fe/H]= -0.40) star G4V HD 20794. For
tem hosting 4 low-mass planets. Gl 581 d has been detected by these three planets the detected very-low radial-velocity ampli-
Udry et al. (2007). As a result of the aliasing with the sideral tudes (0.83, 0.56 and 0.85 ms−1 ) are already impressively small
year, its orbital period had to be corrected later (Mayor et al. and correspond to masses of (2.7, 2.4 and 4.8 M⊕ ), respectively.
11](https://image.slidesharecdn.com/eso1134b-110912142134-phpapp02/75/Eso1134b-11-2048.jpg)
![M. Mayor et al.: The HARPS search for southern extra-solar planets
Another low-mass planet has also been detected (Pepe et al.
100%
2011); it is hosted by the metal-deficient ([Fe/H] = - 0.33) K5V
80%
star HD 85512. Once again, the velocity amplitude is smaller
[Earth Mass]
60%
than the meter per second (0.77 ± 0.09 ms−1 ). With an orbital pe-
40%
riod of 58.4 days and a minimum mass of 3.6 M⊕ , HD 85512 b
10.0 20%
seems to be located inside, but close to the inner boundary, of
the habitable zone of this K5 star (Kaltenegger et al. 2011b). 10%
Let us notice the proximity to the solar system of Gl 581
(6.06 pcs) and HD 85512 (11.15 pcs), and their age very similar
to the Sun’s one (5.8 and 5.6 Gyr). The detection of HD 85512 d
is close to the HARPS limit of detectability but demonstrates
the possibility of detecting super-Earths in the habitable zone
M2sini
of solar-type stars. To evaluate the sensitivity of Doppler spec-
troscopy to detect super-Earths in the habitable zone we have 1.0
selected the 10 stars measured with HARPS and having the
largest number of measurements. When multiple measurements
are done on the same night, with the purpose to reduce the granu-
lation noise influence, these measurements are counted for a sin-
gle data point. All these stars have been measured more than 165 1.0 10.0 100.0
times during several years. Altogether 29 planets have been dis-
covered orbiting these ten stars. We have evaluated the detection Period [days]
limits for these 10 stars, and sketched them in the m2 sin i − log P
plane (see Fig.18). Consodering the actual calendar of measure- Fig. 18. The figure illustrates the limits of detection for very low-mass
ments of the ongoing HARPS survey, if the number of measure- planets based on only the 10 stars of the HARPS sample with more than
165 HARPS measurements per star. Mote that 29 planets have been
ments is large enough (let say larger than 165 per star), we obtain discovered orbiting these ten stars!
a detection sensitivity close to 100 % for a 10 M⊕ super-Earth up
to orbital periods of one year. The corresponding detection prob-
ability is still close to 20 % for a 3 M⊕ planet. arated by a ”gap” in the mass distribution at about 30 Earth-
A new spectrograph called ESPRESSO is presently devel- masses, which cannot be the consequence of a detection bias.
oped for ESO’s VLT at the Paranal Observatory. We can also These populations have quite different characteristics:
mention the development of a northern copy of HARPS to be
installed on the TNG (3.5-m telescope) at La Palma, Canary – The population of gaseous giant planets (GGP) with masses
Islands. This project should contribute to the radial velocity mea- above 50 Earth-masses covers the range of periods from days
surements and mass determination of Kepler mission’s planet to several thousands of days, but the frequency is rising with
candidates. Part of the HARPS-N observing time will also be the logarithm of the period log P (Fig. 7). These planets ex-
devoted to the detection of Earth twins orbiting solar-type stars hibit an upper-mass limit which increases with the orbital
in the solar vicinity. We can be confident that in the coming ten period (Fig. 6). The occurrence rate of GGP is about 14%
to twenty years we should have, by the radial-velocity measure- (m2 sin i > 50 M⊕ , P < 10 years). Furthermore, the occur-
ments, an important contribution to a first list of solar-type stars rence rate of GGP is strongly correlated with the host star
with habitable planets and an estimation of their frequency. metallicity (see black histogram in Fig. 12). In a systematic
survey to search for planets orbiting metal deficient stars,
7. Conclusions Santos et al. (2011) have detected only three GGP among
120 observed stars. All the three GGP have host star metal-
The (still continuing) HARPS survey has already allowed a de- licities close to -0.5 dex, which was the upper limit set to the
tailed study of statistical properties of planetary systems over the metallicity of the host stars in that survey. It seems that the
mass domain from a few Earth masses to several Jupiter masses. observations set some lower limit to the host star metallicity
This survey provides information over three orders of magnitude (and supposingly to the accretion disk) to allow for the for-
of planetary masses. Thanks to the sub-meter-per-second preci- mation of GGP. Finally, we observe in this sample that the
sion of HARPS and the significant number of observing nights distribution of orbital eccentricities exhibits a large scatter
dedicated to this survey over the last 8 years, exceptional results and may attain values even larger than 0.9.
have been obtained. The overwhelming importance of the pop- – The population of Super-Earth and Neptune-type planets
ulation of low mass planets on tight orbit has been quantified. (SEN) with masses less than about 30 to 40 Earth-masses be-
About 50% of solar-type stars host planets with mass lower that haves quite differently. About 50 percents of solar-type stars
30 M⊕ on orbits with period shorter than 100 days. The lower host at least one super-Earth or Neptune. The mass distri-
limit for this frequency value is set by a residual detection bias bution is strongly decreasing from 15 to 30 M⊕ despite the
below two to five Earth-masses at periods from few to 100 days. fact that they would be detected much more easily (Fig. 8
Quite obviously any extrapolation to lower masses in that range and Fig. 10). Also, the SEN population seems to prefer inter-
of periods would further increase this occurrence rate. On the mediate orbital periods from 40 to 80 days once corrected
other hand, because of the possible existence of a population for (Fig. 12), their frequency decreasing on both ends to-
of solid planets with rising density below a few Earth-masses ward shorter and longer periods. Opposite to GGP, the oc-
(Mordasini et al. 2009b) any extrapolation to lower masses is currence rate of SEN does not exhibit a preference for metal
highly speculative. rich host stars. The difference between both populations of
The time being, the presented mass distribution indicates that planets is striking (see the host-star metallicity histogram
we are in presence of two populations of planets. They are sep- in Fig. 16). The median metallicity for solar-type stars host
12](https://image.slidesharecdn.com/eso1134b-110912142134-phpapp02/75/Eso1134b-12-2048.jpg)
![M. Mayor et al.: The HARPS search for southern extra-solar planets
Table 3. Characteristics of the planetary systems orbiting stars in our sample.
Name Period Ecc K M2sin(i) Reference Special remarks
[days] [ms−1 ] [Earth Mass]
HD142 b 350.3 0.25 33.90 415.0 Tinney2002
HD1461 b 5.77 0.00 2.44 6.94 Rivera2010
HD1461 c 13.50 0.00 1.57 5.92 This paper & Segransan2011
HD4113 b 526.62 0.90 97.09 523.9 Tamuz2008
HD4208 b 828.0 0.05 19.05 256.6 Vogt2002
HD4308 b 15.62 0.08 4.00 13.45 Udry2008
HD6434 b 21.99 0.17 34.20 126.2 Mayor2004
HD7199 b 615 0.19 7.8 92 Dumusque2011
HD7449 b 1275 0.82 41.6 353 Dumusque2011
HD7449 c 4046 0.53 30 636 Dumusque2011
HD10180 b 1.17 0.00 0.89 1.52 Lovis2010
HD10180 c 5.75 0.07 4.53 13.2 Lovis2010
HD10180 d 16.36 0.16 2.92 11.9 Lovis2010
HD10180 e 49.75 0.06 4.16 24.8 Lovis2010
HD10180 f 122.7 0.13 2.94 23.4 Lovis2010
HD10180 g 595 0.00 1.62 22.1 Lovis2010
HD10180 h 2149 0.15 3.21 67 Lovis2010
HD10647 b 1003.0 0.15 17.89 294.0 Butler2006
HD11964A b 37.94 0.21 3.56 16.8 Wright2009
HD11964A c 2010 0.07 9.74 176 Wright2009
HD13808 b 14.18 0.17 3.53 10.33 This paper & Queloz2011
HD13808 c 53.83 0.43 2.81 11.55 This paper & Queloz2011
HD16141 b 75.52 0.25 11.98 79.3 Marcy2000
HD16417 b 16.43 0.22 3.33 14.7 O’Toole2009
HD19994 b 466.2 0.26 29.29 421.7 Mayor2004
HD20003 b 11.84 0.40 4.03 12.00 This paper & Udry2011
HD20003 c 33.82 0.16 2.95 13.42 This paper & Udry2011
HD20781 b 29.15 0.11 3.03 12.04 This paper & Udry2011
HD20781 c 85.13 0.28 2.88 15.78 This paper & Udry2011
HD20782 b 596.2 0.93 78.7 361 Jones2006
HD20794 b 18.31 0.0 0.83 2.7 Pepe2011
HD20794 c 40.11 0.0 0.56 2.4 Pepe2011
HD20794 d 90.30 0.0 0.85 4.8 Pepe2011
HD21693 b 22.65 0.26 2.73 10.22 This paper & Udry2011
HD21693 c 53.88 0.24 4.02 20.57 This paper & Udry2011
HD23079 b 730.6 0.10 54.90 776.6 Tinney2002
HD27631 b 2220 0.17 27 540.3 Marmier2011
HD28185 b 379.0 0.05 163.5 1842.5 Santos2001
HD30562 b 1157.0 0.75 33.70 423.5 Fischer2009
HD31527 b 16.54 0.13 3.01 11.55 This paper & Udry2011
HD31527 c 51.28 0.11 2.83 15.82 This paper & Udry2011
HD31527 d 274.49 0.38 1.79 16.50 This paper & Udry2011
HD38858 b 407.15 0.27 2.99 30.55 This paper & Benz2011
HD39091 b 2151.0 0.64 196.39 3206.3 Jones2002
HD39194 b 5.63 0.20 1.95 3.71 This paper & Queloz2011
HD39194 c 14.02 0.11 2.26 5.94 This paper & Queloz2011
HD39194 d 33.94 0.20 1.49 5.13 This paper & Queloz2011 [5]
HD40307 b 4.31 0.19 1.94 4.07 Mayor2009
HD40307 c 9.62 0.08 2.34 6.51 Mayor2009
HD40307 d 20.43 0.11 2.48 8.85 Mayor2009
HD45184 b 5.88 0.18 4.09 11.59 This paper & Udry2011
HD45364 b 226.0 0.18 7.44 61.1 Correia2009
HD45364 c 344.3 0.12 22.97 219 Correia2009
[1] Excess residuals.
[2] Poor coverage or sampling inducing poorly constrained orbital parameters, in particular eccentricity.
[3] Peak in the RV GLS at periods corresponding to stellar rotation but not overlapping with orbital period of planetary
companions. Most probably responsible for excess jitter.
[4] Peak at orbital period in the RV GLS has correspondence with peak at the same period in the R’HK GLS. However,
after subtraction of the other companions, no correlation is detected between the RV residuals and R’HK.
[5] Semi-amplitude value of same level than (o-c) rms.
14](https://image.slidesharecdn.com/eso1134b-110912142134-phpapp02/75/Eso1134b-14-2048.jpg)
![M. Mayor et al.: The HARPS search for southern extra-solar planets
Table 3. continued.
Name Period Ecc K M2sin(i) Reference Special remarks
[days] [ms−1 ] [Earth Mass]
HD47186 b 4.08 0.04 9.28 23.0 Bouchy2009
HD47186 c 3552 0.28 8.12 185 Bouchy2009
HD50499 b 2457.87 0.25 23.02 554.5 Vogt2005
HD51608 b 14.07 0.15 4.10 13.14 This paper & Udry2011
HD51608 c 95.41 0.41 3.25 17.97 This paper & Udry2011 [1],[3]
HD52265 b 119.29 0.32 42.09 340.5 Butler2000
HD65216 b 579 0.26 37.8 449 Mayor2004
HD65216 c 5542 0.15 27.5 712 Marmier2011
HD69830 b 8.66 0.10 3.53 9.86 Lovis2006
HD69830 c 31.58 0.10 2.77 11.98 Lovis2006
HD69830 d 199.56 0.16 2.12 16.73 Lovis2006
HD70642 b 2068.0 0.03 30.39 606.9 Carter2003
HD75289 b 3.50 0.03 54.90 146.2 Udry2000
HD82943 c 219.5 0.35 66.0 632.2 Mayor2004
HD82943 b 441.2 0.21 43.59 551.0 Mayor2004
HD83443 b 2.98 0.01 56.20 125.8 Butler2002
HD85390 b 809.4 0.44 3.95 43.1 Mordasini2010
HD85512 b 58.43 0.11 0.76 3.6 Pepe2011
HD86226 b 1681 0.11 17.2 322 Arriagada2010
HD90156 b 49.88 0.46 3.66 16.7 Mordasini2010
HD92788 b 325.81 0.33 106.0 1132.7 Fischer2001
HD93083 b 144.2 0.07 19.9 136.5 Lovis2005
HD93385 b 13.18 0.15 2.21 8.36 This paper & Queloz2011
HD93385 c 46.02 0.24 1.82 10.12 This paper & Queloz2011
HD96700 b 8.12 0.10 3.02 9.02 This paper & Queloz2011 [1],[3]
HD96700 c 103.49 0.37 1.98 12.76 This paper & Queloz2011 [1],[3]
HD98649 b 10400 0.86 135 2225 Marmier2011
HD101930 b 70.49 0.07 19.1 104.2 Lovis2005
HD102117 b 20.82 0.07 11.1 48.0 Lovis2005
HD102365 b 122.1 0.34 2.40 16.2 Tinney2011
HD104067 b 55.83 0.06 10.9 51.4 Segransan2011
HD106515A b 3630 0.60 174 3337 Marmier2011
HD108147 b 10.89 0.52 25.10 82.0 Pepe2002
HD111232 b 1118.0 0.18 162.0 2199.7 Mayor2004
HD114386 b 445 0.12 11.9 119 Mayor2004
HD114386 c 1046 0.06 28.1 377 Marmier2011
HD114729 b 1114.0 0.16 18.79 300.3 Butler2003
HD114783 b 493.7 0.14 31.89 351.2 Vogt2002
HD115617 b 4.21 0.20 2.59 5.83 Vogt2010
HD115617 c 38.07 0.18 4.68 22.20 Vogt2010
HD115617 d 123.01 0.34 3.25 22.8 Vogt2010
HD117207 b 2597.0 0.14 26.60 578.1 Marcy2005
HD117618 b 25.82 0.41 12.80 56.1 Tinney2005
HD121504 b 63.33 0.02 55.79 388.5 Mayor2004
HD126525 b 948.12 0.13 5.11 71.33 This paper & Benz2011
HD134060 b 3.27 0.40 4.97 11.17 This paper & Udry2011
HD134060 c 1160.97 0.75 4.06 47.87 This paper & Udry2011
HD134606 b 12.08 0.15 2.68 9.27 This paper & Queloz2011
HD134606 c 59.51 0.29 2.17 12.14 This paper & Queloz2011 [4]
HD134606 d 459.26 0.46 3.66 38.52 This paper & Queloz2011
HD134987 b 258.18 0.23 49.5 496.9 Vogt2000
HD134987 c 5000.0 0.11 9.30 255.8 Vogt2000
HD136352 b 11.57 0.18 1.77 5.28 This paper & Udry2011 [5]
[1] Excess residuals.
[2] Poor coverage or sampling inducing poorly constrained orbital parameters, in particular eccentricity.
[3] Peak in the RV GLS at periods corresponding to stellar rotation but not overlapping with orbital period of planetary
companions. Most probably responsible for excess jitter.
[4] Peak at orbital period in the RV GLS has correspondence with peak at the same period in the R’HK GLS. However,
after subtraction of the other companions, no correlation is detected between the RV residuals and R’HK.
[5] Semi-amplitude value of same level than (o-c) rms.
15](https://image.slidesharecdn.com/eso1134b-110912142134-phpapp02/75/Eso1134b-15-2048.jpg)
![M. Mayor et al.: The HARPS search for southern extra-solar planets
Table 3. continued.
Name Period Ecc K M2sin(i) Reference Special remarks
[days] [ms−1 ] [Earth Mass]
HD136352 c 27.58 0.16 2.82 11.38 This paper & Udry2011 [5]
HD136352 d 106.72 0.43 1.68 9.58 This paper & Udry2011 [5]
HD137388 b 330 0.36 7.9 71 Dumusque2011
HD141937 b 653.21 0.40 234.5 3011.5 Udry2002
HD142022A b 1928.0 0.52 92.0 1419.9 Eggenberger2006
HD147018 b 44.23 0.46 145.33 676.1 Segransan2010
HD147018 c 1008.0 0.13 141.19 2095.6 Segransan2010
HD150433 b 1096.27 -0.00 3.85 53.48 This paper & Benz2011 [2]
HD154088 b 18.59 0.38 1.78 6.14 This paper & Queloz2011
HD156846 b 359.51 0.84 464.29 3498.5 Tamuz2008
HD157172 b 105.0 0.33 5.46 34.6 This paper & Benz2011
HD160691 b 9.64 0.12 3.05 10.6 Pepe2007
HD160691 c 313.2 0.04 16.9 189.1 Pepe2007
HD160691 d 648.7 0.18 39.0 546.9 Pepe2007
HD160691 e 8723 0.43 25.8 790 Pepe2007
HD166724 b 8100 0.77 72 1310 Marmier2011
HD168443 b 58.11 0.52 475.53 2465.3 Marcy1999
HD168443 c 1748.15 0.21 298.13 5571.5 Marcy2001
HD168746 b 6.40 0.10 28.60 77.9 Pepe2002
HD169830 b 225.62 0.31 80.69 918.4 Naef2001
HD169830 c 2100.0 0.33 54.29 1291.3 Mayor2004
HD179949 b 3.09 0.02 112.59 286.7 Tinney2001
HD181433 b 9.37 0.42 2.89 7.32 Bouchy2009
HD181433 c 1019 0.25 17.2 222 Bouchy2009
HD181433 d 3201 0.11 9.49 184 Bouchy2009
HD187085 b 986.0 0.46 17.0 255.4 Jones2006
HD189567 b 14.27 0.23 3.02 10.03 This paper & Queloz2011
HD192310 b 74.72 0.13 3.00 16.9 Howard2010
HD192310 c 525.8 0.32 2.27 24 Pepe2011
HD196050 b 1378.0 0.22 49.70 903.7 Jones2002
HD196067 b 4100 0.63 112 2257 Marmier2011
HD204313 c 34.88 0.13 3.28 16.9 This paper & Segransan2011 [4]
HD204313 b 2132 0.11 72.9 1479 Segransan2009
HD204941 b 1733 0.37 5.94 85 Dumusque2011
HD208487 b 130.08 0.23 19.70 162.8 Tinney2005
HD210277 b 442.19 0.47 38.93 404.5 Marcy1999
HD213240 b 882.7 0.42 96.59 1440.6 Santos2001
HD215152 b 7.28 0.34 1.26 2.77 This paper & Queloz2011 [5]
HD215152 c 10.86 0.38 1.26 3.09 This paper & Queloz2011 [5]
HD215456 b 192.0 0.13 3.62 32.6 This paper & Benz2011
HD215456 c 2268 0.17 3.77 76.8 This paper & Benz2011
HD216435 b 1311.0 0.07 19.60 386.1 Jones2003
HD216437 b 1353.0 0.31 39.0 689.1 Jones2002
HD216770 b 118.45 0.37 30.89 205.6 Mayor2004
HD217107 b 7.12 0.12 139.20 445.3 Fischer1999
HD217107 c 4270.0 0.51 35.70 831.3 Vogt2005
HD218566 b 225.7 0.30 8.30 67.7 Meschiari2011
HD220689 b 2191 0.2 19. 377 Marmier2011
HD222582 b 572.38 0.72 276.29 2425.1 Vogt2000
[1] Excess residuals.
[2] Poor coverage or sampling inducing poorly constrained orbital parameters, in particular eccentricity.
[3] Peak in the RV GLS at periods corresponding to stellar rotation but not overlapping with orbital period of planetary
companions. Most probably responsible for excess jitter.
[4] Peak at orbital period in the RV GLS has correspondence with peak at the same period in the R’HK GLS. However,
after subtraction of the other companions, no correlation is detected between the RV residuals and R’HK.
[5] Semi-amplitude value of same level than (o-c) rms.
16](https://image.slidesharecdn.com/eso1134b-110912142134-phpapp02/75/Eso1134b-16-2048.jpg)
![M. Mayor et al.: The HARPS search for southern extra-solar planets
Table 4. Orbital and physical parameters of the planets orbiting HD 1461 as obtained from a Keplerian fit to the data.
Parameter [unit] HD 1461 c
−1
V [km s ] −10.0670 (±0.0002)
P [days] 13.505
(±0.004)
e 0.0
( f ixed)
K [m s−1 ] 1.57
(±0.19)
m sin i [M⊕ ] 5.92
(±0.76)
a [AU] 0.1117
(±0.0018)
Nmeas 167
Span [days] 2856
rms [m s−1 ] 1.70
χ2
r 3.61
Table 5. Orbital and physical parameters of the planets orbiting HD 13808 as obtained from a Keplerian fit to the data.
Parameter [unit] HD 13808 b HD 13808 c
−1
V [km s ] 41.0949 (±0.0005)
P [days] 14.182 53.83
(±0.005) (±0.11)
e 0.17 0.43
(±0.07) (±0.20)
K [m s−1 ] 3.53 2.81
(±0.29) (±0.46)
m sin i [M⊕ ] 10.33 11.55
(±0.92) (±1.62)
a [AU] 0.1017 0.2476
(±0.0016) (±0.0041)
Nmeas 133
Span [days] 2770
rms [m s−1 ] 1.93
χ2
r 4.10
Table 6. Orbital and physical parameters of the planets orbiting HD 20003 as obtained from a Keplerian fit to the data.
Parameter [unit] HD 20003 b HD 20003 c
V [km s−1 ] −16.1040 (±0.0006)
P [days] 11.849 33.823
(±0.003) (±0.065)
e 0.40 0.16
(±0.08) (±0.09)
K [m s−1 ] 4.03 2.95
(±0.33) (±0.28)
m sin i [M⊕ ] 12.00 13.42
(±0.97) (±1.28)
a [AU] 0.0974 0.1961
(±0.0016) (±0.0032)
Nmeas 104
Span [days] 2770
rms [m s−1 ] 1.56
χ2
r 2.59
17](https://image.slidesharecdn.com/eso1134b-110912142134-phpapp02/75/Eso1134b-17-2048.jpg)
![M. Mayor et al.: The HARPS search for southern extra-solar planets
Table 7. Orbital and physical parameters of the planets orbiting HD 20781 as obtained from a Keplerian fit to the data.
Parameter [unit] HD 20781 b HD 20781 c
−1
V [km s ] 40.3671 (±0.0005)
P [days] 29.15 85.13
(±0.02) (±0.12)
e 0.11 0.28
(±0.06) (±0.09)
K [m s−1 ] 3.03 2.88
(±0.26) (±0.23)
m sin i [M⊕ ] 12.04 15.78
(±1.12) (±1.21)
a [AU] 0.1690 0.3456
(±0.0028) (±0.0057)
Nmeas 96
Span [days] 2647
rms [m s−1 ] 1.12
χ2
r 1.39
Table 8. Orbital and physical parameters of the planets orbiting HD 21693 as obtained from a Keplerian fit to the data.
Parameter [unit] HD 21693 b HD 21693 c
−1
V [km s ] 39.7685 (±0.0008)
P [days] 22.656 53.88
(±0.024) (±0.07)
e 0.26 0.24
(±0.17) (±0.09)
K [m s−1 ] 2.73 4.02
(±0.33) (±0.35)
m sin i [M⊕ ] 10.22 20.57
(±1.46) (±1.80)
a [AU] 0.1484 0.2644
(±0.0024) (±0.0044)
Nmeas 128
Span [days] 2813
rms [m s−1 ] 2.02
χ2
r 5.16
Table 9. Orbital and physical parameters of the planets orbiting HD 31527 as obtained from a Keplerian fit to the data.
Parameter [unit] HD 31527 b HD 31527 c HD 31527 d
V [km s−1 ] 25.7391 (±0.0004)
P [days] 16.546 51.28 274.5
(±0.007) (±0.09) (±7.8)
e 0.13 0.11 0.38
(±0.05) (±0.07) (±0.25)
K [m s−1 ] 3.01 2.83 1.79
(±0.18) (±0.17) (±0.68)
m sin i [M⊕ ] 11.55 15.82 16.50
(±0.79) (±1.10) (±3.04)
a [AU] 0.1253 0.2665 0.818
(±0.0020) (±0.0044) (±0.020)
Nmeas 167
Span [days] 2719
rms [m s−1 ] 1.35
χ2
r 2.14
18](https://image.slidesharecdn.com/eso1134b-110912142134-phpapp02/75/Eso1134b-18-2048.jpg)
![M. Mayor et al.: The HARPS search for southern extra-solar planets
Table 10. Orbital and physical parameters of the planets orbiting HD 38858 as obtained from a Keplerian fit to the data.
Parameter [unit] HD 38858 b
−1
V [km s ] 31.6383 (±0.0004)
P [days] 407.1
(±4.3)
e 0.27
(±0.17)
K [m s−1 ] 2.99
(±0.33)
m sin i [M⊕ ] 30.55
(±4.11)
a [AU] 1.038
(±0.019)
Nmeas 52
Span [days] 2964
rms [m s−1 ] 1.38
χ2
r 2.53
Table 11. Orbital and physical parameters of the planets orbiting HD 39194 as obtained from a Keplerian fit to the data.
Parameter [unit] HD 39194 b HD 39194 c HD 39194 d
−1
V [km s ] 14.1692 (±0.0005)
P [days] 5.6363 14.025 33.941
(±0.0008) (±0.005) (±0.035)
e 0.20 0.11 0.20
(±0.10) (±0.06) (±0.16)
K [m s−1 ] 1.95 2.26 1.49
(±0.16) (±0.15) (±0.17)
m sin i [M⊕ ] 3.72 5.94 5.14
(±0.33) (±0.47) (±0.66)
a [AU] 0.0519 0.0954 0.1720
(±0.0008) (±0.0016) (±0.0029)
Nmeas 133
Span [days] 2717
rms [m s−1 ] 1.11
χ2
r 1.30
Table 12. Orbital and physical parameters of the planets orbiting HD 45184 as obtained from a Keplerian fit to the data.
Parameter [unit] HD 45184 b
V [km s−1 ] −3.7584 (±0.0008)
P [days] 5.8872
(±0.0015)
e 0.30
(±0.19)
K [m s−1 ] 4.77
(±1.18)
m sin i [M⊕ ] 12.73
(±1.67)
a [AU] 0.0638
(±0.0010)
Nmeas 82
Span [days] 2738
rms [m s−1 ] 3.81
χ2
r 21.86
19](https://image.slidesharecdn.com/eso1134b-110912142134-phpapp02/75/Eso1134b-19-2048.jpg)
![M. Mayor et al.: The HARPS search for southern extra-solar planets
Table 13. Orbital and physical parameters of the planets orbiting HD 51608 as obtained from a Keplerian fit to the data.
Parameter [unit] HD 51608 b HD 51608 c
−1
V [km s ] 39.9773 (±0.0008)
P [days] 14.070 95.42
(±0.004) (±0.39)
e 0.15 0.41
(±0.06) (±0.18)
K [m s−1 ] 4.10 3.25
(±0.27) (±0.61)
m sin i [M⊕ ] 13.14 17.97
(±0.98) (±2.61)
a [AU] 0.1059 0.379
(±0.0017) (±0.006)
Nmeas 118
Span [days] 2697
rms [m s−1 ] 1.82
χ2
r 3.95
Table 14. Orbital and physical parameters of the planets orbiting HD 93385 as obtained from a Keplerian fit to the data.
Parameter [unit] HD 93385 b HD 93385 c
−1
V [km s ] 47.5791 (±0.0005)
P [days] 13.186 46.025
(±0.006) (±0.073)
e 0.15 0.24
(±0.11) (±0.18)
K [m s−1 ] 2.21 1.82
(±0.23) (±0.96)
m sin i [M⊕ ] 8.36 10.12
(±0.88) (±1.47)
a [AU] 0.1116 0.2570
(±0.0018) (±0.0043)
Nmeas 127
Span [days] 2733
rms [m s−1 ] 1.42
χ2
r 2.38
Table 15. Orbital and physical parameters of the planets orbiting HD 96700 as obtained from a Keplerian fit to the data.
Parameter [unit] HD 96700 b HD 96700 c
V [km s−1 ] 12.8584 (±0.0071)
P [days] 8.1256 103.49
(±0.0013) (±0.58)
e 0.10 0.37
(±0.05) (±0.19)
K [m s−1 ] 3.02 1.98
(±0.18) (±0.37)
m sin i [M⊕ ] 9.03 12.76
(±0.63) (±1.63)
a [AU] 0.0774 0.422
(±0.0012) (±0.007)
Nmeas 146
Span [days] 2717
rms [m s−1 ] 1.48
χ2
r 2.93
20](https://image.slidesharecdn.com/eso1134b-110912142134-phpapp02/75/Eso1134b-20-2048.jpg)
![M. Mayor et al.: The HARPS search for southern extra-solar planets
Table 16. Orbital and physical parameters of the planets orbiting HD 126525 as obtained from a Keplerian fit to the data.
Parameter [unit] HD 126525 b
−1
V [km s ] 13.1384 (±0.0006)
P [days] 948.1
(±22.0)
e 0.13
(±0.07)
K [m s−1 ] 5.11
(±0.34)
m sin i [M⊕ ] 71.33
(±5.78)
a [AU] 1.811
(±0.041)
Nmeas 45
Span [days] 2575
rms [m s−1 ] 1.27
χ2
r 2.10
Table 17. Orbital and physical parameters of the planets orbiting HD 134060 as obtained from a Keplerian fit to the data.
Parameter [unit] HD 134060 b HD 134060 c
−1
V [km s ] 37.9893 (±0.0026)
P [days] 3.2700 1161
(±0.0002) (±27)
e 0.40 0.75
(±0.04) (±0.19)
K [m s−1 ] 4.97 4.1
(±0.23) (±1.8)
m sin i [M⊕ ] 11.17 47.9
(±0.66) (±22.5)
a [AU] 0.0444 2.226
(±0.0007) (±0.051)
Nmeas 100
Span [days] 2615
rms [m s−1 ] 1.39
χ2
r 2.65
Table 18. Orbital and physical parameters of the planets orbiting HD 134606 as obtained from a Keplerian fit to the data.
Parameter [unit] HD 134606 b HD 134606 c HD 134606 d
V [km s−1 ] 2.0510 (±0.0006)
P [days] 12.083 59.52 459.3
(±0.010) (±0.17) (±8.3)
e 0.15 0.29 0.46
(±0.10) (±0.20) (±0.09)
K [m s−1 ] 2.68 2.17 3.66
(±0.25) (±0.35) (±0.62)
m sin i [M⊕ ] 9.27 12.14 38.52
(±0.95) (±1.67) (±4.12)
a [AU] 0.1023 0.2962 1.157
(±0.0017) (±0.0049) (±0.024)
Nmeas 113
Span [days] 2548
rms [m s−1 ] 1.66
χ2
r 3.96
21](https://image.slidesharecdn.com/eso1134b-110912142134-phpapp02/75/Eso1134b-21-2048.jpg)
![M. Mayor et al.: The HARPS search for southern extra-solar planets
Table 19. Orbital and physical parameters of the planets orbiting HD 136352 as obtained from a Keplerian fit to the data.
Parameter [unit] HD 136352 b HD 136352 c HD 136352 d
−1
V [km s ] −68.7120 (±0.0005)
P [days] 11.577 27.582 106.72
(±0.006) (±0.023) (±1.03)
e 0.18 0.16 0.43
(±0.14) (±0.07) (±0.24)
K [m s−1 ] 1.77 2.82 1.68
(±0.22) (±0.23) (±0.47)
m sin i [M⊕ ] 5.28 11.38 9.59
(±0.62) (±0.10) (±1.86)
a [AU] 0.0933 0.1665 0.411
(±0.0015) (±0.0028) (±0.007)
Nmeas 129
Span [days] 2601
rms [m s−1 ] 1.35
χ2
r 2.72
Table 20. Orbital and physical parameters of the planets orbiting HD 150433 as obtained from a Keplerian fit to the data.
Parameter [unit] HD 150433 b
−1
V [km s ] −40.1141 (±0.0003)
P [days] 1096
(±27)
e 0.0
( f ixed)
K [m s−1 ] 3.85
(±0.42)
m sin i [M⊕ ] 53.5
(±6.3)
a [AU] 1.930
(±0.045)
Nmeas 51
Span [days] 2129
rms [m s−1 ] 1.73
χ2
r 3.75
Table 21. Orbital and physical parameters of the planets orbiting HD 154088 as obtained from a Keplerian fit to the data.
Parameter [unit] HD 154088 b
V [km s−1 ] 14.2972 (±0.0003)
P [days] 18.596
(±0.021)
e 0.38
(±0.15)
K [m s−1 ] 1.78
(±0.31)
m sin i [M⊕ ] 6.15
(±0.86)
a [AU] 0.1316
(±0.0021)
Nmeas 112
Span [days] 1924
rms [m s−1 ] 1.24
χ2
r 2.21
22](https://image.slidesharecdn.com/eso1134b-110912142134-phpapp02/75/Eso1134b-22-2048.jpg)
![M. Mayor et al.: The HARPS search for southern extra-solar planets
Table 22. Orbital and physical parameters of the planets orbiting HD 157172 as obtained from a Keplerian fit to the data.
Parameter [unit] HD 157172 b
−1
V [km s ] −78.9210 (±0.0006)
P [days] 104.84
(±0.13)
e 0.46
(±0.05)
K [m s−1 ] 6.42
(±0.43)
m sin i [M⊕ ] 38.1
(±2.6)
a [AU] 0.416
(±0.007)
Nmeas 82
Span [days] 2157
rms [m s−1 ] 1.90
χ2
r 13.03
Table 23. Orbital and physical parameters of the planets orbiting HD 189567 as obtained from a Keplerian fit to the data.
Parameter [unit] HD 189567 b
−1
V [km s ] −10.4792 (±0.0004)
P [days] 14.275
(±0.005)
e 0.23
(±0.14)
K [m s−1 ] 3.02
(±0.33)
m sin i [M⊕ ] 10.03
(±1.04)
a [AU] 0.1099
(±0.0018)
Nmeas 166
Span [days] 2818
rms [m s−1 ] 2.64
χ2
r 9.09
Table 24. Orbital and physical parameters of the planets orbiting HD 204313 as obtained from a Keplerian fit to the data.
Parameter [unit] HD 204313 c
V [km s−1 ] −9.7419 (±0.0021)
P [days] 34.873
(±0.039)
e 0.17
(±0.09)
K [m s−1 ] 3.36
(±0.35)
m sin i [M⊕ ] 17.15
(±1.71)
a [AU] 0.2103
(±0.0035)
Nmeas 67
Span [days] 1547
rms [m s−1 ] 1.08
χ2
r 1.78
23](https://image.slidesharecdn.com/eso1134b-110912142134-phpapp02/75/Eso1134b-23-2048.jpg)
![M. Mayor et al.: The HARPS search for southern extra-solar planets
Table 25. Orbital and physical parameters of the planets orbiting HD 215152 as obtained from a Keplerian fit to the data.
Parameter [unit] HD 215152 b HD 215152 c
−1
V [km s ] −13.6810 (±0.0012)
P [days] 7.283 10.866
(±0.006) (±0.014)
e 0.34 0.38
(±0.27) (±0.23)
K [m s−1 ] 1.26 1.26
(±0.36) (±0.32)
m sin i [M⊕ ] 2.78 3.10
(±0.47) (±0.48)
a [AU] 0.0652 0.0852
(±0.0010) (±0.0014)
Nmeas 171
Span [days] 2927
rms [m s−1 ] 1.33
χ2
r 2.15
Table 26. Orbital and physical parameters of the planets orbiting HD 215456 as obtained from a Keplerian fit to the data.
Parameter [unit] HD 215456 b HD 215456 c
−1
V [km s ] −18.8541 (±0.0006)
P [days] 191.99 2277
(±0.73) (±67)
e 0.15 0.19
(±0.10) (±0.11)
K [m s−1 ] 3.62 3.89
(±0.31) (±0.44)
m sin i [M⊕ ] 32.21 78.37
(±2.92) (±8.86)
a [AU] 0.652 3.394
(±0.011) (±0.088)
Nmeas 96
Span [days] 2615
rms [m s−1 ] 1.79
χ2
r 5.41
24](https://image.slidesharecdn.com/eso1134b-110912142134-phpapp02/75/Eso1134b-24-2048.jpg)

This document summarizes an 8-year survey using the HARPS spectrograph to detect super-Earth and Neptune-mass planets around solar-type stars. Over 50% of solar-type stars were found to harbor at least one planet within 100 days. The mass distribution of super-Earths and Neptune-mass planets increases sharply from 30-15 Earth masses. Most of these planets belong to multi-planetary systems and have orbital eccentricities under 0.45. In contrast, giant planets are more common around metal-rich stars and can have eccentricities over 0.9. The precision of HARPS enables detection of planets in the habitable zones of solar-type stars.


![Coded Agents – with UiPath SDK + LangGraph [Virtual Hands-on Workshop]](https://cdn.slidesharecdn.com/ss_thumbnails/codedagentsdeck-251215155422-5497c599-thumbnail.jpg?width=640&height=640&fit=bounds)
![Vibe Coding vs. Spec-Driven Development [Free Meetup]](https://cdn.slidesharecdn.com/ss_thumbnails/vibecodingvsspecdrivendevelopment-251209105622-43f455e7-thumbnail.jpg?width=640&height=640&fit=bounds)


