![The Net Promoter Score: Is There a Better Alternative? Robert East, Kingston Business School, London [email_address]](https://image.slidesharecdn.com/roberteastpresentation-100128111652-phpapp01/85/Dr-Robert-East-Net-Promoter-Score-is-there-a-better-alternative-1-320.jpg)
![The Net Promoter Score: Is There a Better Alternative? Robert East, Kingston Business School, London [email_address]](https://image.slidesharecdn.com/roberteastpresentation-100128111652-phpapp01/75/Dr-Robert-East-Net-Promoter-Score-is-there-a-better-alternative-1-2048.jpg)

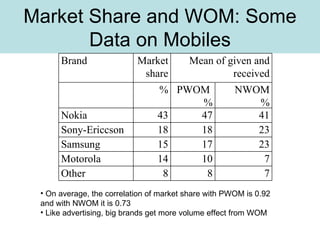
![Measure Using the measures described for measuring the volume and impact of PWOM and NWOM The Net Effect of WOM on market share will be [ (volume × impact) PWOM + (volume × impact) NWOM ]/MS (It is a + sign because the impact of NWOM is negative)](https://image.slidesharecdn.com/roberteastpresentation-100128111652-phpapp01/85/Dr-Robert-East-Net-Promoter-Score-is-there-a-better-alternative-10-320.jpg)


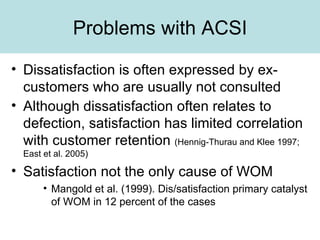
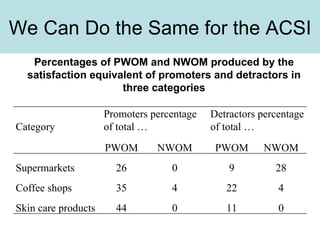
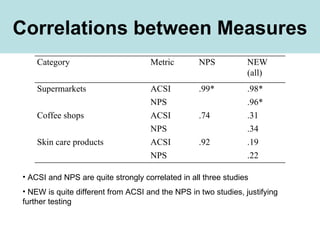
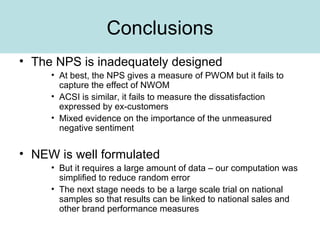

The document examines alternatives to the Net Promoter Score (NPS) for measuring word-of-mouth (WOM). It finds that the NPS does not adequately measure the impact and volume of both positive and negative WOM. An alternative measure called the Net Effect of WOM is proposed that considers both positive and negative WOM volume and impact on purchase propensity. Initial tests find the alternative measure differs from the NPS and ACSI in predicting sales, supporting further validation with larger sample sizes.


![How to run a perfect Net Promoter Score campaign [Webinar]](https://cdn.slidesharecdn.com/ss_thumbnails/webinarhowtorunaperfectnpscampaign1-170406121457-thumbnail.jpg?width=640&height=640&fit=bounds)


![[Webinar] Survey and Net Promoter Score Best Practices](https://cdn.slidesharecdn.com/ss_thumbnails/webinar-surveybestpracticesnps07-2015-150709200029-lva1-app6891-thumbnail.jpg?width=640&height=640&fit=bounds)


![Leyes de la seguridad industrial [modo de compatibilidad]](https://cdn.slidesharecdn.com/ss_thumbnails/leyesdelaseguridadindustrialmododecompatibilidad-120518150944-phpapp01-thumbnail.jpg?width=640&height=640&fit=bounds)


