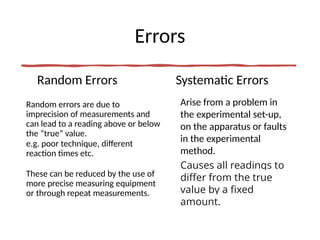
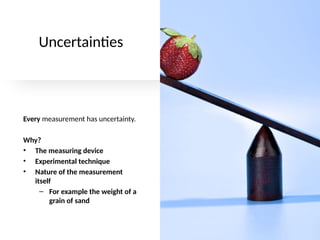
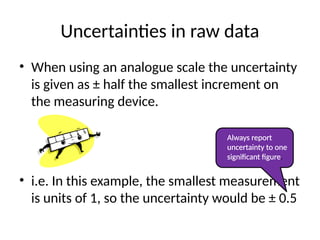
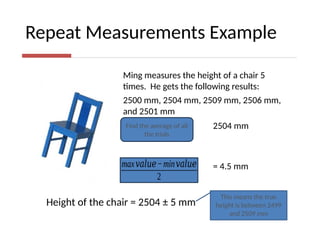
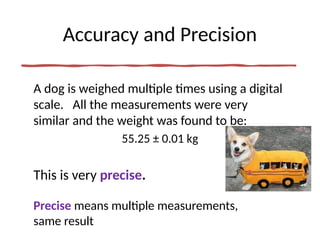
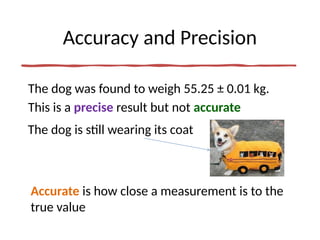
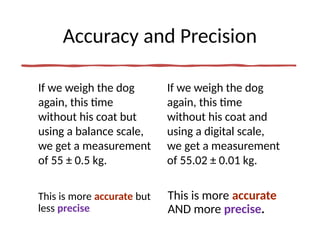
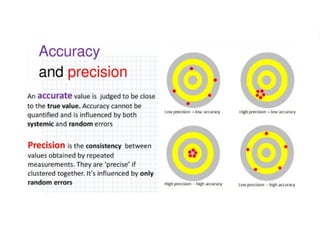
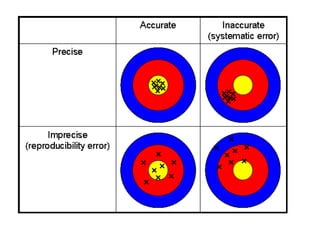
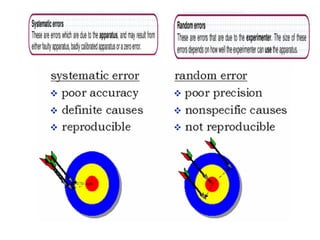
Error and Uncertainty Analysis
Errors
Random Errors
Random errors are due to
imprecision of measurements and
can lead to a reading above or below
the “true” value.
e.g. poor technique, different
reaction times etc.
These can be reduced by the use of
more precise measuring equipment
or through repeat measurements.
Systematic Errors
Arise from a problem in
the experimental set-up,
on the apparatus or faults
in the experimental
method.
Causes all readings to
differ from the true
value by a fixed
amount.
Uncertainties
Every measurement has uncertainty.
Why?
• The measuring device
• Experimental technique
• Nature of the measurement
itself
– For example the weight of a
grain of sand
Uncertainties in raw data
• When using an analogue scale the uncertainty
is given as ± half the smallest increment on
the measuring device.
• i.e. In this example, the smallest measurement
is units of 1, so the uncertainty would be ± 0.5
Always report
uncertainty to one
significant figure.
Try the following
9.5 ±0.5 cm
8.5±0.25 = 8.5±0.3cm
11.9±0.1 cm
NOTE
Uncertainty is always
reported to 1 significant
figure.
The number of decimal
places that the uncertainty
has must equal the number
of decimal places the
measurement has.
31.9±0.5 ml
• When using a
digital scale, the
uncertainty is ± 1
part of the smallest
reading.
• For example: In this
picture, the
smallest reading is
to the first decimal
place so the
uncertainty would
be ± 0.1 g
When the instrument tells you what
the uncertainty is
Repeated Measurements
• Find the average of all the trials
• Then:
–Uncertainty = ±(Max – min)/2
Repeat Measurements Example
Ming measures the height of a chair 5
times. He gets the following results:
2500 mm, 2504 mm, 2509 mm, 2506 mm,
and 2501 mm
Find the average of all
the trials
2504 mm
max𝑣𝑎𝑙𝑢𝑒−min𝑣𝑎𝑙𝑢𝑒
2
= 4.5 mm
Height of the chair = 2504 ± 5 mm
This means the true
height is between 2499
and 2509 mm
Accuracy and Precision
A dog is weighed multiple times using a digital
scale. All the measurements were very
similar and the weight was found to be:
55.25 ± 0.01 kg
This is very precise.
Precise means multiple measurements,
same result
Accuracy and Precision
The dog was found to weigh 55.25 ± 0.01 kg.
This is a precise result but not accurate
Accurate is how close a measurement is to the
true value
The dog is still wearing its coat
Accuracy and Precision
This is more accurate but
less precise.
If we weigh the dog
again, this time
without his coat but
using a balance scale,
we get a measurement
of 55 ± 0.5 kg.
This is more accurate
AND more precise.
If we weigh the dog
again, this time
without his coat and
using a digital scale,
we get a measurement
of 55.02 ± 0.01 kg.
Errors in a Graph
The worst acceptable line should be either the steepest
possible line or the shallowest possible line that passes
through the error bars of all the data points. It should be
distinguished from the line of best fit either by being drawn
as a broken line or by being clearly labelled.
When plotting the graph, the points are plotted as
normal and extended to show max & min likely values
(for y-values only)
Each small sq.vertically is 0.2cm
therefore as there is 2 small
squares above and below the
plotted point error is 0.4 . We do
not usually need to worry about the
error bar for the
x-value
Worst line of fit is
the dashed line
estimate the absolute uncertainty in the gradient of a graph by
recalling that:

Errors and uncertainty analysis - Physics A level

  • 1.
  • 2.
    Errors Random Errors Random errorsare due to imprecision of measurements and can lead to a reading above or below the “true” value. e.g. poor technique, different reaction times etc. These can be reduced by the use of more precise measuring equipment or through repeat measurements. Systematic Errors Arise from a problem in the experimental set-up, on the apparatus or faults in the experimental method. Causes all readings to differ from the true value by a fixed amount.
  • 3.
    Uncertainties Every measurement hasuncertainty. Why? • The measuring device • Experimental technique • Nature of the measurement itself – For example the weight of a grain of sand
  • 4.
    Uncertainties in rawdata • When using an analogue scale the uncertainty is given as ± half the smallest increment on the measuring device. • i.e. In this example, the smallest measurement is units of 1, so the uncertainty would be ± 0.5 Always report uncertainty to one significant figure.
  • 5.
    Try the following 9.5±0.5 cm 8.5±0.25 = 8.5±0.3cm 11.9±0.1 cm
  • 6.
    NOTE Uncertainty is always reportedto 1 significant figure. The number of decimal places that the uncertainty has must equal the number of decimal places the measurement has.
  • 7.
  • 8.
    • When usinga digital scale, the uncertainty is ± 1 part of the smallest reading. • For example: In this picture, the smallest reading is to the first decimal place so the uncertainty would be ± 0.1 g
  • 9.
    When the instrumenttells you what the uncertainty is
  • 10.
    Repeated Measurements • Findthe average of all the trials • Then: –Uncertainty = ±(Max – min)/2
  • 11.
    Repeat Measurements Example Mingmeasures the height of a chair 5 times. He gets the following results: 2500 mm, 2504 mm, 2509 mm, 2506 mm, and 2501 mm Find the average of all the trials 2504 mm max𝑣𝑎𝑙𝑢𝑒−min𝑣𝑎𝑙𝑢𝑒 2 = 4.5 mm Height of the chair = 2504 ± 5 mm This means the true height is between 2499 and 2509 mm
  • 12.
    Accuracy and Precision Adog is weighed multiple times using a digital scale. All the measurements were very similar and the weight was found to be: 55.25 ± 0.01 kg This is very precise. Precise means multiple measurements, same result
  • 13.
    Accuracy and Precision Thedog was found to weigh 55.25 ± 0.01 kg. This is a precise result but not accurate Accurate is how close a measurement is to the true value The dog is still wearing its coat
  • 14.
    Accuracy and Precision Thisis more accurate but less precise. If we weigh the dog again, this time without his coat but using a balance scale, we get a measurement of 55 ± 0.5 kg. This is more accurate AND more precise. If we weigh the dog again, this time without his coat and using a digital scale, we get a measurement of 55.02 ± 0.01 kg.
  • 18.
    Errors in aGraph The worst acceptable line should be either the steepest possible line or the shallowest possible line that passes through the error bars of all the data points. It should be distinguished from the line of best fit either by being drawn as a broken line or by being clearly labelled. When plotting the graph, the points are plotted as normal and extended to show max & min likely values (for y-values only) Each small sq.vertically is 0.2cm therefore as there is 2 small squares above and below the plotted point error is 0.4 . We do not usually need to worry about the error bar for the x-value Worst line of fit is the dashed line estimate the absolute uncertainty in the gradient of a graph by recalling that: