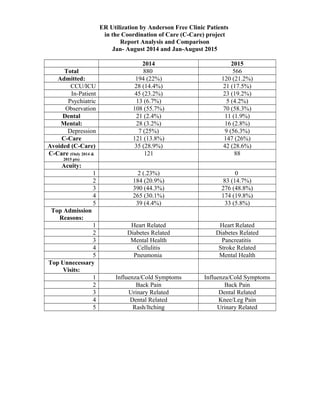
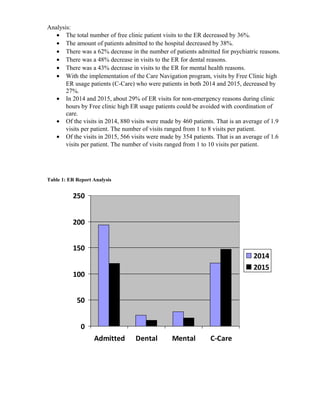
ER Utilization by Anderson Free Clinic Patients
in the Coordination of Care (C-Care) project
Report Analysis and Comparison
Jan- August 2014 and Jan-August 2015
2014 2015
Total 880 566
Admitted: 194 (22%) 120 (21.2%)
CCU/ICU 28 (14.4%) 21 (17.5%)
In-Patient 45 (23.2%) 23 (19.2%)
Psychiatric 13 (6.7%) 5 (4.2%)
Observation 108 (55.7%) 70 (58.3%)
Dental 21 (2.4%) 11 (1.9%)
Mental: 28 (3.2%) 16 (2.8%)
Depression 7 (25%) 9 (56.3%)
C-Care 121 (13.8%) 147 (26%)
Avoided (C-Care) 35 (28.9%) 42 (28.6%)
C-Care (Only 2014 &
2015 pts)
121 88
Acuity:
1 2 (.23%) 0
2 184 (20.9%) 83 (14.7%)
3 390 (44.3%) 276 (48.8%)
4 265 (30.1%) 174 (19.8%)
5 39 (4.4%) 33 (5.8%)
Top Admission
Reasons:
1 Heart Related Heart Related
2 Diabetes Related Diabetes Related
3 Mental Health Pancreatitis
4 Cellulitis Stroke Related
5 Pneumonia Mental Health
Top Unnecessary
Visits:
1 Influenza/Cold Symptoms Influenza/Cold Symptoms
2 Back Pain Back Pain
3 Urinary Related Dental Related
4 Dental Related Knee/Leg Pain
5 Rash/Itching Urinary Related
Analysis:
• The total number of free clinic patient visits to the ER decreased by 36%.
• The amount of patients admitted to the hospital decreased by 38%.
• There was a 62% decrease in the number of patients admitted for psychiatric reasons.
• There was a 48% decrease in visits to the ER for dental reasons.
• There was a 43% decrease in visits to the ER for mental health reasons.
• With the implementation of the Care Navigation program, visits by Free Clinic high
ER usage patients (C-Care) who were patients in both 2014 and 2015, decreased by
27%.
• In 2014 and 2015, about 29% of ER visits for non-emergency reasons during clinic
hours by Free clinic high ER usage patients could be avoided with coordination of
care.
• Of the visits in 2014, 880 visits were made by 460 patients. That is an average of 1.9
visits per patient. The number of visits ranged from 1 to 8 visits per patient.
• Of the visits in 2015, 566 visits were made by 354 patients. That is an average of 1.6
visits per patient. The number of visits ranged from 1 to 10 visits per patient.
Table 1: ER Report Analysis
0
50
100
150
200
250
Admitted Dental Mental C-Care
2014
2015
Table 2: Admission Types (%)
0
10
20
30
40
50
60
70
CCU/ICU
In-Patient
Psychiatric
Observation
2014
2015
Table 3: Acuity Levels (%)
0
10
20
30
40
50
60
1 2 3 4 5
2014
2015
Acuity is established using a five-level emergency department triage algorithm that
provides clinically relevant stratification of patients into five groups from least to most urgent
based on patient acuity and resource needs. Level 1 is emergent with lifesaving
interventions, followed by level 2, urgent, when patient presents with high risk situations and
after that acuity 3, 4 and 5 are non-urgent and level is defined based on resources needed for
care
Table 4: High ER Usage Patients
0
20
40
60
80
100
120
140
160
Total*
Avoidable**(%)
Visitsin
both
yrs***
2014
2015
*Total visits for 2015 includes new patients in 2015 (only) plus those in Coordination
of Care (C-Care) in 2014
**Avoidable visits are those made to ER on days and times when Anderson Free
Clinic was open and patient chose to go to ER versus the Free Clinic for a walk in
visit combined with the fact that the condition was not life threatening. Those may
include stitches removal, cold or flu related symptoms, insect bite with no respiratory
distress or other allergic reaction, medication refill, wound bandage removal, ear
ache, urinary tract infection, and dental pain without an abscess
** Only patients that are in Care-Coordination since 2014 and continue in 2015.
Intensity of Care Coordination needed may vary

Er report analysis

  • 1.
    ER Utilization byAnderson Free Clinic Patients in the Coordination of Care (C-Care) project Report Analysis and Comparison Jan- August 2014 and Jan-August 2015 2014 2015 Total 880 566 Admitted: 194 (22%) 120 (21.2%) CCU/ICU 28 (14.4%) 21 (17.5%) In-Patient 45 (23.2%) 23 (19.2%) Psychiatric 13 (6.7%) 5 (4.2%) Observation 108 (55.7%) 70 (58.3%) Dental 21 (2.4%) 11 (1.9%) Mental: 28 (3.2%) 16 (2.8%) Depression 7 (25%) 9 (56.3%) C-Care 121 (13.8%) 147 (26%) Avoided (C-Care) 35 (28.9%) 42 (28.6%) C-Care (Only 2014 & 2015 pts) 121 88 Acuity: 1 2 (.23%) 0 2 184 (20.9%) 83 (14.7%) 3 390 (44.3%) 276 (48.8%) 4 265 (30.1%) 174 (19.8%) 5 39 (4.4%) 33 (5.8%) Top Admission Reasons: 1 Heart Related Heart Related 2 Diabetes Related Diabetes Related 3 Mental Health Pancreatitis 4 Cellulitis Stroke Related 5 Pneumonia Mental Health Top Unnecessary Visits: 1 Influenza/Cold Symptoms Influenza/Cold Symptoms 2 Back Pain Back Pain 3 Urinary Related Dental Related 4 Dental Related Knee/Leg Pain 5 Rash/Itching Urinary Related
  • 2.
    Analysis: • The totalnumber of free clinic patient visits to the ER decreased by 36%. • The amount of patients admitted to the hospital decreased by 38%. • There was a 62% decrease in the number of patients admitted for psychiatric reasons. • There was a 48% decrease in visits to the ER for dental reasons. • There was a 43% decrease in visits to the ER for mental health reasons. • With the implementation of the Care Navigation program, visits by Free Clinic high ER usage patients (C-Care) who were patients in both 2014 and 2015, decreased by 27%. • In 2014 and 2015, about 29% of ER visits for non-emergency reasons during clinic hours by Free clinic high ER usage patients could be avoided with coordination of care. • Of the visits in 2014, 880 visits were made by 460 patients. That is an average of 1.9 visits per patient. The number of visits ranged from 1 to 8 visits per patient. • Of the visits in 2015, 566 visits were made by 354 patients. That is an average of 1.6 visits per patient. The number of visits ranged from 1 to 10 visits per patient. Table 1: ER Report Analysis 0 50 100 150 200 250 Admitted Dental Mental C-Care 2014 2015
  • 3.
    Table 2: AdmissionTypes (%) 0 10 20 30 40 50 60 70 CCU/ICU In-Patient Psychiatric Observation 2014 2015 Table 3: Acuity Levels (%) 0 10 20 30 40 50 60 1 2 3 4 5 2014 2015 Acuity is established using a five-level emergency department triage algorithm that provides clinically relevant stratification of patients into five groups from least to most urgent based on patient acuity and resource needs. Level 1 is emergent with lifesaving interventions, followed by level 2, urgent, when patient presents with high risk situations and after that acuity 3, 4 and 5 are non-urgent and level is defined based on resources needed for care
  • 4.
    Table 4: HighER Usage Patients 0 20 40 60 80 100 120 140 160 Total* Avoidable**(%) Visitsin both yrs*** 2014 2015 *Total visits for 2015 includes new patients in 2015 (only) plus those in Coordination of Care (C-Care) in 2014 **Avoidable visits are those made to ER on days and times when Anderson Free Clinic was open and patient chose to go to ER versus the Free Clinic for a walk in visit combined with the fact that the condition was not life threatening. Those may include stitches removal, cold or flu related symptoms, insect bite with no respiratory distress or other allergic reaction, medication refill, wound bandage removal, ear ache, urinary tract infection, and dental pain without an abscess ** Only patients that are in Care-Coordination since 2014 and continue in 2015. Intensity of Care Coordination needed may vary