Download to read offline


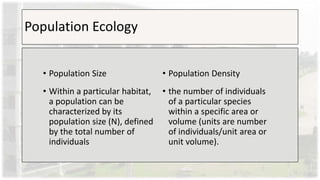


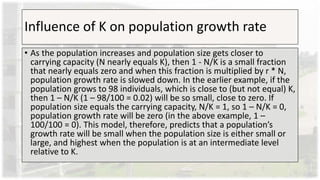


Population ecology is the study of how populations of a species interact with their environment and change over time. Key characteristics of populations include population size, density, dispersion, age structure, sex ratio, and growth rate. Populations can exhibit exponential or logistic growth patterns. Exponential growth occurs when resources are unlimited and the population grows at a constant per capita rate, while logistic growth occurs when resources are limited and the growth rate slows as the population approaches the carrying capacity of the environment. Population models help predict how population size will change over time under different environmental conditions.


