This document provides an overview of a research project analyzing the relationship between economic growth and environmental quality in the United States over time. The author explores this relationship using time series models with GDP as the dependent variable and factors like carbon dioxide emissions, oil consumption, coal consumption, and municipal solid waste as independent variables. Different model specifications are estimated and tested, including linear, threshold autoregressive, and vector autoregressive models. The author aims to determine how economic growth has impacted various environmental indicators in the US and vice versa.
The document discusses unrestricted vector autoregression (VAR) models. It analyzes a VAR model using quarterly data on H6 money aggregate DDA, personal income, and 10-year Treasury rates from the early 1960s to 2015. The model includes endogenous and exogenous variables. The main benefits of VAR discussed are that it allows measuring the impact of shocks to endogenous variables on other variables using impulse response functions and forecast error variance decompositions. However, the document notes some limitations of VAR models and questions whether some results like impulse responses truly represent economic relationships.
This is a pretty broad exploration and tutorial of basic econometrics modeling techniques. It includes an introduction to quite a few multiple regression methods. It also includes an extensive coverage of model testing to ensure that your model is quantitatively sound and statistically robust using state of the art peer reviewing protocol.
El documento discute los ataques a la libertad de expresión en Ecuador, incluyendo una demanda de $40 millones contra el periódico El Universo, sanciones constantes contra otros medios como La Hora y El Comercio, y el cierre de estaciones de radio y canales de televisión. A pesar de las críticas de organismos internacionales de derechos humanos, el gobierno ecuatoriano mantiene que sus acciones buscan hacer cumplir las leyes y la constitución.
Este documento analiza el movimiento populista alemán Pegida y las emociones políticas. Explica que los sujetos políticos tienen emociones que son importantes en política. Los partidos políticos tradicionalmente han canalizado estas emociones, pero ahora están fallando en hacerlo. Esto ha creado un vacío emocional que el populismo de derecha está llenando al ofrecer un espacio para expresar sentimientos de ofensa. Para combatir el populismo, se necesita una política que también conecte con las emociones a través de símbolos e identidad.
- Satish Kumar is seeking a position as an Engineer with over 2 years of experience working as a Linux System Administrator and System Assistant.
- He has technical skills in Linux, Windows Server, networking, and software troubleshooting.
- His previous roles involved installation, configuration, and maintenance of operating systems, servers, networking equipment, and providing user support.
Informationen für projektvorstellung englisch 20[1].4.05esregroup
The document discusses water cableways which enable water skiing and wakeboarding without the need for powerboats by using an overhead cable system. Some key points:
1) Water cableways revolutionize water sports by making them affordable and accessible to everyone by eliminating the need for expensive powerboats and personnel.
2) They have a large capacity of serving over 4,000 skiers daily using only 4-6 hectares of water, with low environmental impact as they are electrically powered.
3) Water cableways have numerous benefits - they improve water quality by adding oxygen, attract tourists, preserve land and resources, and allow water skiing/wakeboarding in a safe, cost-effective and environmentally
8. past progressive and presentation practiceNikki Mattson
This document provides guidance on verb tenses and grammar structures to use when giving a presentation on observations from a PSU class. It discusses using:
- Simple present and future tenses in introductions.
- Simple past tense when describing the class attended.
- Past continuous tense for actions during the class.
- Simple past and future tenses in conclusions.
It also contrasts the uses of "while" and "when" and provides examples of the past continuous tense. Students are prompted to practice example sentences applying the guidance to their own PSU class observations. The document concludes with an activity on collocations and assigning homework to complete a template.
Maniace Castle in Syracuse, Sicily was commissioned by Emperor Frederick II in 1232-1239. It has a square structure with four corner towers and was built according to precise rules of symmetry and geometry. The Byzantine general George Maniaces reconquered Syracuse from the Arabs in 1038 and the castle is named after him. Palazzo Mergulese-Montalto was erected in 1397 and is an example of Chiaramonte Gothic architecture, unusual in Syracuse. The Camera Reginale established after the Sicilian Vespers constituted a dowry for queens of Sicily and Naples until being suppressed in 1517.
This document summarizes strategic licensing transaction services including transaction management, scientific evaluation, finance, and alliance management. It describes partnering with commercial units to develop strategic plans by identifying business needs and determining if they can be met internally or through external deals. Business and financial analysis is also provided to support transactions through forecasting, business case development, competitive assessments, and term sheet impact assessments. Extensive deal experience is described from small agreements to acquisitions. Services can be provided on a project or ongoing basis.
دليل الإنتاج الفكري في مجال علم النفس بمكتبة كلية الآداب جامعة مصراتة الجزء ا...Naglaa Yassin
قدم هذا المشروع ضمن متطلبات الحصول على درجة الليسانس في تخصص المكتبات والمعلومات كلية الآداب جامعة مصراته - ليبيا. بعنوان دليل الإنتاج الفكري في مجال علم النفس بمكتبة الكلية االجزء الأول
The document provides information about resume samples, tips, cover letters, and interview questions for church volunteers. It includes links to free resume samples, ebooks on writing effective resumes and cover letters, and preparing for interviews on the resume123.org website. The document outlines 8 types of resumes (chronological, functional, curriculum vitae, combination, targeted, professional, new graduate, executive) and provides examples of each. It also lists additional useful materials on the website for interview preparation, questions, thank you letters, dress codes, research on careers and industries related to church volunteering.
Anoop Shrivastava's curriculum vitae provides information about his professional objectives, educational qualifications, experiences, computer proficiency, strengths, personal details, and declaration. His professional objective is to build a career in education and become a solution provider for organizations. He has a B.Com degree from Vikram University and higher secondary education qualifications. His experiences include roles in marketing, sales, and store management. He has proficiency in Microsoft Office, Tally, typing in Hindi and English, and works well under pressure.
These documents summarize several major festivals celebrated in the Philippines in January and February. The festivals honor Catholic saints and traditions incorporating street dancing, costumes, food and cultural performances. Some of the largest festivals discussed are the Feast of the Black Nazarene in Manila honoring Jesus Christ, the Sinulog Festival in Cebu paying tribute to Santo Niño, the Ati-Atihan Festival in Kalibo featuring tribal dances, and the Dinagyang Festival in Iloilo City which is modeled after Ati-Atihan. The summaries provide background on the origins and traditions associated with each celebration.
The document provides resources for forestry worker resumes, cover letters, and interview preparation. It includes links to resume samples, tips for writing effective resumes and cover letters, and guides for different types of interview questions and strategies. Additional useful materials listed are interview checklists, ways to search for jobs, and follow-up techniques. The resources provided are intended to help forestry workers create strong application materials and prepare for the hiring process.
This document is an empirical assignment report submitted by a group of students analyzing the relationship between urbanization, transportation, GDP, and carbon dioxide emissions across 209 countries. The report finds that:
1) Carbon dioxide emission levels in a country can be significantly explained by its levels of urbanization and vehicle density, with higher levels of both associated with higher CO2 emissions.
2) The model used satisfies assumptions of classical linear regression, and urbanization and vehicle density jointly explain over 50% of the variation in CO2 emissions levels.
3) GDP per capita is also likely to influence CO2 emissions but is excluded from the main model due to multicollinearity with urbanization and vehicle density.
1. The document discusses using regression analysis to estimate the effects of alcohol consumption on college GPA while controlling for relevant variables. It considers whether to include attendance and whether attendance could be used as an instrumental variable to address potential endogeneity.
2. The document also discusses using panel data from US states from 2000-2015 to investigate the effect of minimum wages on teenage employment. It compares models with and without state and time fixed effects and how this impacts the coefficient of interest.
3. Finally, the document discusses unit root testing of UK money supply data and variables using augmented Dickey-Fuller tests to inform forecasting of money growth rates. It considers a Granger causality test to evaluate whether lags
This document describes using traditional models and the error correction model approach to analyze the forward premium puzzle using US dollar/Japanese yen exchange rate data from 1989 to 2008. It first tests the level specification model and returns model but finds issues with non-stationarity and cointegration. It then introduces an extended model with macroeconomic variables but finds insignificant coefficients. Finally, it specifies an error correction model incorporating lagged differences and the residuals from the level specification, finding this model fits the data well without issues of non-stationarity, heteroskedasticity, autocorrelation or structural breaks.
Affine Term Structure Model with Stochastic Market Price of RiskSwati Mital
- The document proposes a new affine term structure model that combines principal components analysis with a stochastic market price of risk.
- Principal components provide useful information about yield curves and only three components explain over 95% of yield variation.
- Previous models linked risk premium deterministically to return-predicting factors like slope, but this could result in unrealistic risk premium levels.
- The new model introduces an additional state variable to capture the stochastic market price of risk and break the deterministic link between risk premium and return-predicting factors.
This document discusses difference-in-differences (DD) estimation methods. It begins by outlining the basic DD methodology using two groups and two time periods. It then discusses extensions such as using multiple groups, time periods, and data sources. The document also covers issues like uncertainty estimation and the use of DD with a small number of groups. Overall, it provides an overview of DD estimation techniques and considerations for their application.
The document discusses different methods for visualizing and interpreting machine learning models, including univariate, bivariate, and multivariate interpretations. Univariate interpretations using partial dependence plots (PDPs) show the effect of varying individual variables while holding others constant. PDPs vary across models, with logistic regression PDPs closely matching univariate projections but gradient boosting and decision tree PDPs being flatter. Bivariate and multivariate interpretations are needed to understand contextual effects and avoid overestimating variable importance from univariate analyses alone. Residual analysis also supports generally equivalent interpretations across models.
Issues associated with Unit Root, multicollinearity, and autocorrelation. Those issues are not as black-and-white as people think they are. They are rather complex and at times even inconclusive. Read why.
This document provides an overview of models for the short rate, including equilibrium and no-arbitrage models. Equilibrium models like Vasicek and CIR assume the short rate follows a stochastic process with mean reversion. No-arbitrage models like Ho-Lee and Hull-White use today's term structure as an input rather than an output. The Hull-White model extends Vasicek by making the reversion level a function of time.
The document discusses linear regression analysis. It explains that linear regression finds the best fitting straight line through data points in order to model the relationship between two quantitative variables. The regression line minimizes the sum of squared residuals. The R-squared value indicates how much of the variability in the data is explained by the linear model. Residual plots are examined to check if the linear model is appropriate.
Econometrics beat dave giles' blog ardl modelling in e_views 9b1mit
This blog post discusses autoregressive distributed lag (ARDL) modelling in EViews 9. Specifically:
1) The post demonstrates how to estimate an ARDL model to examine the relationship between gasoline and crude oil prices in Canada using weekly data from 2000 to 2013.
2) Unit root tests on the logged price series find inconclusive evidence of non-stationarity, making ARDL modelling appropriate.
3) An ARDL model is estimated with lags of the dependent and independent variables as regressors, selected using information criteria.
4) The bounds test allows examination of the long-run relationship between gasoline and crude oil prices.
This document discusses autocorrelation, which occurs when there is a correlation between members of a series of observed data ordered over time or space. This violates an assumption of classical linear regression that error terms are uncorrelated. Causes of autocorrelation include inertia in macroeconomic data, specification bias from excluded or incorrectly specified variables, lags, data manipulation, and non-stationarity of time series data. Autocorrelation can be detected graphically or using the Durbin-Watson and Breusch-Godfrey tests. Remedial measures include first-difference transformation, generalized transformation, and using Newey-West standard errors.
Return Decomposition
By Long Chen and Xinlei Zhao
Presentation by Michael-Paul James
Directly modeling discount rate news and backing out cash flow news
adds residual news to the latter
○ The method has led to erroneous conclusions:
■ Larger relative DR variance
■ Value stocks earn higher returns due to higher βCF
■ βCF is more important than total βtotal
○ DR news cannot be accurately estimated (low predictive power)
and backed out CF news inherits large misspecification error of DR
○ Modeled Treasury bonds reveals higher CF variance with no real CF
risk
○ Minor changes in predictive variables produce opposite results
Directly modeling cash flow news, discount rate news, and residual
○ Value firms have both lower modeled CF betas and DR betas, but
higher residual betas, indicating that the results in the current
literature are driven by the residual news.
This document proposes a simple algebraic optimization method to determine the optimum average sulfur content in US motor gasoline (mogas) by maximizing the net gain between health benefits and refining costs. It models the health benefits of reducing mogas sulfur as a parabolic function, with the greatest benefit coming from initial reductions. Refining costs are modeled as a logarithmic function, with lower costs for initial reductions. The net gain is calculated as the difference between these curves and peaks at the optimum sulfur level, between 100-330 ppm. Adopting this approach could help circumvent complex regulatory negotiations and instead provide an objective optimum standard.
Presenting Climate Change Models that estimate and forecast global temperature levels in association or caused by CO2 concentration (ppm) levels. These models also replicate IPCC scenarios.
This document summarizes the results of an analysis of factors influencing individuals' job satisfaction using panel data from the British Household Panel Survey. A fixed effects model was preferred to a random effects model based on a Hausman test. The analysis found that being married, having an improved financial situation compared to the previous year, and living outside of London were associated with higher levels of job satisfaction, while a worse financial situation was associated with lower satisfaction. Regional differences in satisfaction were also observed.
This study examines extreme co-movements in stock prices. Daily prices for the first 100 stocks were analyzed to calculate log returns and identify extreme jumps. A GARCH model was used to extract conditional volatility. Pseudo-observations were generated by dividing returns by volatility. A generalized extreme value distribution was fitted to exceedances above a threshold to determine tail properties. Fréchet scales were calculated and ranked. The number of joint exceedances above percentiles over time lags were counted to estimate conditional probabilities of extreme co-movements in stock decreases.
1. The document presents the results of a regression analysis conducted to determine which transmission type (manual or automatic) produces better gas mileage (MPG) when controlling for other variables.
2. The analysis found that manuals produce 1.8 MPG better than automatics on average.
3. The final regression model, which controlled for cylinders, horsepower, weight, and transmission type, explained 84% of the variability in MPG.
This document summarizes a study that models crude oil prices using a Lévy process. The study finds that a MA(8) model best fits the time series properties of oil price returns. However, there is also evidence of GARCH effects. Therefore, the best overall model is a GARCH(1,1) with errors modeled by a Johnson SU distribution. This hybrid Lévy-GARCH process captures the temporal, spectral and distributional properties of the crude oil price data set.
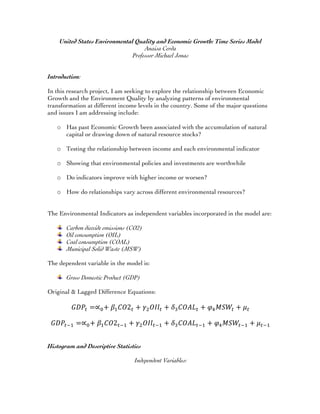
1. United States Environmental Quality and Economic Growth: Time Series Model
Anaisa Cerda
Professor Michael Jonas
Introduction:
In this research project, I am seeking to explore the relationship between Economic
Growth and the Environment Quality by analyzing patterns of environmental
transformation at different income levels in the country. Some of the major questions
and issues I am addressing include:
o Has past Economic Growth been associated with the accumulation of natural
capital or drawing down of natural resource stocks?
o Testing the relationship between income and each environmental indicator
o Showing that environmental policies and investments are worthwhile
o Do indicators improve with higher income or worsen?
o How do relationships vary across different environmental resources?
The Environmental Indicators as independent variables incorporated in the model are:
Carbon dioxide emissions (CO2)
Oil consumption (OIL)
Coal consumption (COAL)
Municipal Solid Waste (MSW)
The dependent variable in the model is:
Gross Domestic Product (GDP)
Original & Lagged Difference Equations:
𝐺𝐷𝑃! =∝!+ 𝛽! 𝐶𝑂2! + 𝛾! 𝑂𝐼𝑙! + 𝛿! 𝐶𝑂𝐴𝐿! + 𝜑! 𝑀𝑆𝑊! + 𝜇!
𝐺𝐷𝑃!!! =∝!+ 𝛽! 𝐶𝑂2!!! + 𝛾! 𝑂𝐼𝑙!!! + 𝛿! 𝐶𝑂𝐴𝐿!!! + 𝜑! 𝑀𝑆𝑊!!! + 𝜇!!!
Histogram and Descriptive Statistics
Independent Variables:
3. As noted in all the graphs and statistics see definite upwards trends and fluctuations
across time in Environmental Indicators along with GDP. The objective is to capture
an economic relationship showing the effects of GDP on the indicators are significant.
It is important to note the skewness of the variables as well and how it is varying
across the variables. None are dramatically left or right skewed.
Augmented Dickey Fuller Test
For C02, absolute value of
the t-stat is less that the
Critical values.
Do NOT reject the null as
assume unit root and non
stationary
4.
For Coal: The absolute value of
the t-stat is less than the Critical
values
Do not reject the null and
conclude unit root and non-
stationary
Seems at 3rd
difference can reject
null and sig at the 5&10% level
where = stationary with no unit
root.
For Municipal Waste:
tstat<tcritcal
Do not reject H0= unit root and
non-stationary.
5. It is evident that stationary variables are not present. Moreover, the original variables are not
showing any significance as determined by the p-values.
In the model, I do not want any spurious regression or heteroskedasticity so went along and
corrected for unit roots by lagging and taking the first difference of each of the variables.
Differenced Variables:
For Oil: tstat<tcritical
Do not reject null, unit root = non-
stationary
With First difference of Oil Tstat
becomes 3.83 to get rid of
nonstationarity and can reject null at
1,5, and 10% levels.
Dependent Variable
GDP : tstat<tcritical
Do not reject null, unit root =
non-stationary
6. Lagged Variables:
By adding the lags of certain models, can see a bit more significance in the variables
like oil at (-2) and (-1). Despite the insignificance in the second lag of the carbon
emission, I have decided to add it to the model because of the additional significant
variables, enhancing the model slightly.
7. ARMA 2,3
In order to discover how GDP relates to past values of itself and past values of the error term, ARMA
identification tests were executed. Combining AR&MA describes the current value off GDP depends
linearly on its own previous values plus a combination of current and previous values of the white noise
error term. I wanted to choose lags that minimized my Information criteria. Making sure that these new
added variables explained more than they were costing After multiple tests, I found that ARMA 2,3 was
proving to be the best model. Through looking at the Correllograms it seems to be correctly identified
since the fitted residuals are White Noise. Though MA(3) is showing to not be significant, it would be
likely to delete it. However, upon removing it all other variables became insignificant along with a rising
of the Information criteria. Therefore, I decided to keep the MA(3) term because of its explanatory
power.
The multivariate model does seem to outperform the univariate model. Seen in the Adj
r2 being at its highest along with the AIC and SIC being slightly smaller.
Some of the X variables are showing to be significant like co2 and oil practically being
zero. The model is using their lagged values because of endogeneity bias. Overall, not
8. very much improvement occurred as seen through a very slight difference in the
AIC/SIC and Adjusted R2.
Q-stat
Squared Residuals
By the results of the Qstat, there is white noise meaning that this model does not have
a form of memory or predictability over time. Therfore, this model is claiming to not be
suffering from omitted ARMA factors.
Both the correllogram of Q-stat and of Squared residuals are showing a white noise
process and therefore not seeing presence of an ARCH process and can assume
homoscedasticity.
ARCH effects
ARCH and GARCH tests were done in order to be sure that they would not show any
improvement to my model. Sure enough, they did not. Primarily, looking at the F-stat ,
it was not showing to be significant and not showing evidence of joint significance of
9. the lagged terms .Next, The Resid -1 is the reaction to market shocks at t-1 is a rather
small value which indicates relatively low sensitivity of gdp volatility to recent events.
Below are the included regressions.
F stat is not showing to be significant here, which is not suggesting the presence of
ARCH in GDP . Neither of the coefficients on the residuals are significant .
(GARCH 1,1)
The ARMA terms in the regression are not telling us anything due to their p-values
being very close to 1. But the Lagged Carbon dioxide is showing significance along
with Oil being a significant coefficient.
The ARCH term is significant and the GARCH term, which is the error variance, is
not as significant as we hoped it would. This implies a carry over effect that was not
very strong on the GARCH side.
(Seen Below)
10. GARCH conditional Variance
This Graph is providing a forecast of the market variance.
STRUCTURAL BREAKS
CHOW TEST 1989
Here with a p-value of 0.5836, we do not reject the null of zero break points/ structural
stability and conclude that there does not seem to be evident structural break points.
Without a structural break/ regime shift, we can assume a constant mean, variance,
auto correlation, marginal effects, and ARMA structure.
.
11. Quandt-Andrews Test:
Based on the sample size being limited to 53 it was too small to run this test due to the
trimming effect of this model. Due to not being able to run this model I decided to still
go forth and run a tar model because of the potential breaks in the model that may not
could have been
Ramsey Reset Test:
In the Ramsey Reset Test we are testing whether the quadratic fitted independent
variable terms are significant in determining the level of the dependent variable. The
Ramsey test in my regression is testing whether the relationship between
GDP(economic growth) and my explanatory variables is linear or not.
In the output we take note of both F= 0.34 with pvalue =. 5620 and X^2=0.000326 and
pvalue = 0.1392 , it is seen that there is no apparent non-linearity in the regression
equation and conclude that the linear model for Economic Growth/GDP is
appropriate.
12. TAR Multivariate Model
I have chosen to use my dependent variable D(GDP) as my forcing variable.
In the threshold it is also lagged tracking that GDP rising before is going to keep rising
depending on which state it is in. Where current GDP is being changed by the lags.
The dummy variables are the determining factors to which state we are in: Above 0 or
below 0. Dummy variables are used commonly as a way of solving structural breaks,
not involving splitting the data. I have included the output along with grouped TAR
indicating which state I am in across time.
Grouped Tar:
13. In the Next model clearly do see improvement, incorporating the lags:
The forcing variable in this Model is D(GDP)(-1) and the threshold is zero.
In the regression output our adjR^2 is at its highest along with AIC/SIC being at its
lowest which outperforms our linear model. This is the SETAR model where the
regime switch is determined by my dependent variable relative to the threshold.
Overall claiming that GDP (which I lagged) behaves differently when rising vs.
falling. If GDP was rising before then it will keep rising, the current GDP will be
determined by the lag.
The dummy variables alone determine the regression shift. Here showing a large
difference in states. Z1 variable being significant at 645.08 and Z2 is -187.79 There is
evidently large intercept with a large change / shift from one state to another.
14. Through this model, observing the joint significance across states to see whether or not
they belong to the model. In looking at this regression, all AR terms are proving to be
significant except for lagged carbon dioxide emissions in state 2, Lagged MSW in state
2 and Lagged oil in state 2.
The coefficients in regression are proving that states do matter in this research. For
variables such as co2 and oil there is a small change but not much different from one
another. The shape of the regression is showing to be highly sensitive to coal and msw
due to a big percent change in the coefficients.
D(GDP)=
α 1+𝛽1𝐷(𝐺𝐷𝑃)(−1)𝑡 − 1 + 𝛿1𝐷(𝐶𝑜2)(−1)𝑡 − 1 + 𝛾1𝐷(𝐶𝑜𝑎𝑙)(−1)𝑡 − 1 + 𝜆1𝐷(𝑀𝑆𝑊)(−1)𝑡 −
1 + 𝜓1𝐷(𝑜𝑖𝑙)(−1)𝑡 − 1 + 𝜇1𝑡
If ∆𝐷(𝐺𝐷𝑃)(−1)𝑡 − 1 > 0
α 2+𝛽2𝐷(𝐺𝐷𝑃)𝑡(−1) − 1 + 𝛿2𝐷(𝐶𝑜2)(−1)𝑡 − 1 + 𝛾2𝐷(𝐶𝑜𝑎𝑙)(−1)𝑡 − 1 + 𝜆2𝐷(𝑀𝑆𝑊)(−1)𝑡 −
1 + 𝜓2𝐷(𝑜𝑖𝑙)(−1) 𝑡 − 1 + 𝜇2𝑡
If ∆𝐷(𝐺𝐷𝑃)𝑡 − 1 ≤ 0
Dummy Z1t= 1 if Δ𝐷(𝐺𝐷𝑃)(−1)𝑡 − 1 > 0
Dummy Z2t= (1-Z1t)
LOGISTIC STAR MODEL
Estimating the LSTAR model using Non-Linear Least Squares
15. I tried this model various times and some type of error is occurring where all my
coefficients resulted in N/A. For the L-star estimation, for a given threshold, we must
find optimal values of alpha 0, alpha 1, Beta, and theta. Using the NLS to minimize
SSR. The generated gamma would be the state sensitivity parameter, as it increases a
small change in forcing variable GDP will have a large outcome on the state out come
of theta. The sensitivity parameter will tell us very much about the degree of state
dependence that will occur.This model will help me determine whether there is state
dependence rather than single dependence between X and Y.
VAR
The Variance Auto Regressive allows for all variables in the system to be endogenous,
depending on lags of all other variables. I am running this in my model to provide
more accurate forecasts and to accomplish the estimation of an identified VAR by
OLS. I am tracking whether shocks to Carbon Dioxide emissions, Oil, Coal, and
Municipal Solid Waste boost GDP. My goal is to show that certain resources are very
informative about GDP and that GDP is a good indicator about the use of the
resources. Throughout all testing, keeping in mind, do the amount of emissions affect
output in the economy? If so, what is the transmission mechanism by which these
effects occur?
Specific Cholesky Ordering is a crucial part to identify a structural or primitive system
to be estimated by OLS. In my model I have come up with the following order:
DOILàDMSWàDCOALàDCO2àDGDP
Here DOIL is serving as my “contemporaneously exogenous” variable and DGDP is
serving as my “contemporaneously endogenous” variable.
Based on my chosen order:
𝐷𝑂𝑖𝑙! influences, 𝐷𝑀𝑆𝑊!,𝐷𝐶𝑂𝐴𝐿! 𝐷𝐶𝑂2! and 𝐷𝐺𝐷𝑃!
contemporaneously, and is
influencd by𝐷𝑀𝑆𝑊!,𝐷𝐶𝑂𝐴𝐿! 𝐷𝐶𝑂2! and 𝐷𝐺𝐷𝑃!
only
at
a
lag.
16. 𝐷𝑀𝑆𝑊! influences 𝐷𝐶𝑂𝐴𝐿!, 𝐷𝐶𝑂2! and 𝐷𝐺𝐷𝑃!
contemporaneously
and
is
influenced
by, 𝐷𝐶𝑂𝐴𝐿!, 𝐷𝐶𝑂2! and 𝐷𝐺𝐷𝑃!
only
at
a
lag..
𝐷𝐶𝑂𝐴𝐿!influences
𝐷 𝐶𝑂2! and 𝐷𝐺𝐷𝑃! contemporaneously and is influenced by 𝐷𝐶𝑂2!
and 𝐷𝐺𝐷𝑃! only at a lag
𝐷𝐶𝑂2! influences 𝐷𝐺𝐷𝑃! contemporaneously and is influenced by 𝐷𝐺𝐷𝑃! only at a lag
𝐷𝐺𝐷𝑃! has no contemporaneous effect on the other variables
I have come up with this order on the idea that oil next in sequence because of the
large commodity that it is overall in the economy and furthermore because of the
overwhelming dependency that the country and better yet, world has on the
production and trade of oil. However, due to this dumping, production, and spills
there is severe damage that is caused in all other areas of the environment. This all
leads to the contemporaneous influences on Coal and waste. For example, oil refining
produces solid waste that contains high levels of metals and toxic compounds.
Following Oil, I have included Municipal Solid Waste. The high amount of waste that
exists in our nation has to be burned. Upon burning this produces toxic pollutants and
emissions. The more waste we have the more it directly influences the coal that is
needed to burn all this waste.
This leads me to my next variable; Coal is used to burn oil at power plants as well as
municipal solid waste as a couple examples. I have placed coal as third because when it
is burned, it releases carbon dioxide as one of its major emissions.
Next, I have carbon emissions because they are universally distributed and naturally
present in the atmosphere. It is the primary greenhouse gas that is emitted through
human activities. It comes from a variety of natural sources, but human related
emissions are responsible for the increase that has occurred since the Industrial
Revolution. Hence, carbon dioxide emissions being influenced by all other variables
like oil, coal, and waste contemporaneously.
Below are the Cholesky Ordering Equations:
17.
18. Without taking the difference of the environmental variables:
Upon running this regression, I instantly note the changes in AIC, SIC, and the log
likelihood. It has definitely minimized in comparison to other models that were run,
even the Threshold Auto Regressive model. I proceeded to run the Impulse Response
Functions, generating the responses of my environmental variables to shocks in
DGDP. I was anticipating seeing significance and unfortunately, found none. This was
not an expected result. Zero is clearly within the confidence interval and I cannot
reject the null that the change in DGDP with additive “s” terms (future periods) in the
future is zero. I did run the test without the differenced environmental variables out of
curiosity and in terms of the IRF there seems to be a bit of significance but still not as
much as had been assumed.
Results & Conclusion
Overall, a lack of data in environmental quality indicators has posed a problem in
proving the capability of this model to show more significance. The earliest data that
has been revealed has been from the 1960’s, which results in a small sample. The size
has prevented from running certain models, like the Quandt –Andrews, which would
capture the potential of any significant breaks that were not captured by other models.
Furthermore, there are definitely more environmental indicators that could have been
incorporated into the model, which is proof of omitted variable bias. Factors such as
water, deforestation, and other toxins were not readily available to serve as additional
explanatory variables in finding an economic relationship between economic growth
19. and environmental indicators. If such variables were included this could change results
greatly. Theoretically, it may not be possible to predict how environmental quality will
evolve with changes in GDP, but from this data can observe some clear patterns.
Unfortunately, not as much significance as would have been hoped for but after
running the various models there was evidence of improvements that were achieved.