Download as PDF, PPTX

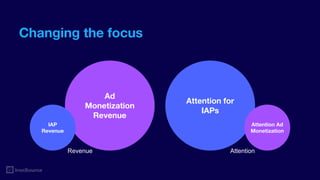

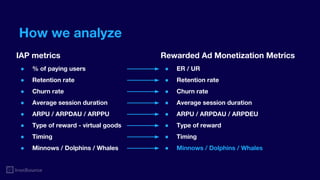

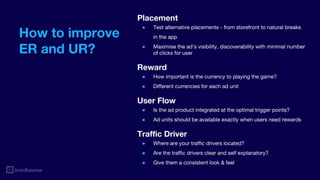


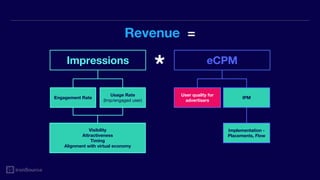


The document discusses strategies for improving user experience and monetization through rewarded ad placements in mobile apps. It emphasizes the importance of analyzing key metrics such as engagement rate, retention, and revenue for both ads and in-app purchases. Case studies highlight successful implementations that increased user engagement and revenue while maintaining a positive user experience.


![[Infographic] - Adblocking in Numbers](https://cdn.slidesharecdn.com/ss_thumbnails/adblockinginfographic-ironsource-160518150837-thumbnail.jpg?width=640&height=640&fit=bounds)


