This study developed and evaluated a common factors feedback (CFF) system aimed at improving the psychotherapy process for clients with depressive symptoms by providing ongoing feedback on outcome expectations, empathy, and therapeutic alliance. A randomized clinical trial involving 79 undergraduate participants showed that clients using the CFF system reported greater improvements in perceived empathy and therapeutic alliance than those receiving treatment as usual. The findings suggest that the CFF system is well received and has the potential to enhance therapeutic processes in treatment for depression.
![(e.g.,
humanistic and psychodynamic therapies) do not target
symptoms
per se and thus may be more compatible with a process
feedback
system than an outcome/symptom-based feedback system.
Third,
whereas therapists may view outcome feedback as evaluative
and
threatening (Boswell, Krauss, Miller, & Lambert, 2015),
therapists
This article was published Online First January 23, 2017.
Andrew S. McClintock, Matthew R. Perlman, Shannon M.
McCarrick,
Timothy Anderson, and Lina Himawan, Department of
Psychology, Ohio
University.
The ideas and data reported in this article have not been
previously
disseminated.
Correspondence concerning this article should be addressed to
Andrew
S. McClintock, 264 Porter Hall, Athens, OH 45701. E-mail:
[email protected]
ohio.edu
T
hi
s
do](https://image.slidesharecdn.com/enhancingpsychotherapyprocesswithcommonfactorsfeedback-230108091546-8446de24/85/Enhancing-Psychotherapy-Process-With-Common-Factors-Feedback-docx-4-320.jpg)


![oa
dl
y.
Journal of Counseling Psychology © 2017 American
Psychological Association
2017, Vol. 64, No. 3, 247–260 0022-0167/17/$12.00
http://dx.doi.org/10.1037/cou0000188
247
mailto:[email protected]
mailto:[email protected]
http://dx.doi.org/10.1037/cou0000188
may be more receptive to feedback about what is transpiring in
therapy. Thus, process feedback has the potential to be more
widely implemented. Fourth, a process feedback system could
yield information that is actionable and immediately useful. For
example, disagreement about treatment tasks could be readily
addressed by exploring discrepancies between the implemented
techniques and the client’s perceptions about which techniques
should be implemented.
An exemplary system that integrates process and outcome feed-
back is the Partners for Change Outcome Management System
(PCOMS; Miller et al., 2005; Duncan, 2012). PCOMS monitors
the therapeutic alliance (i.e., agreement on therapeutic goals
and
tasks in the context of a positive affective bond; Bordin, 1979)
at
every session, enabling therapists to identify and repair alliance
ruptures on an ongoing basis. Although the effectiveness of
PCOMS is well documented (e.g., Duncan, 2012), it is unclear](https://image.slidesharecdn.com/enhancingpsychotherapyprocesswithcommonfactorsfeedback-230108091546-8446de24/85/Enhancing-Psychotherapy-Process-With-Common-Factors-Feedback-docx-9-320.jpg)


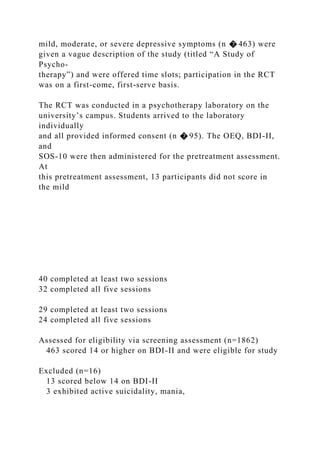


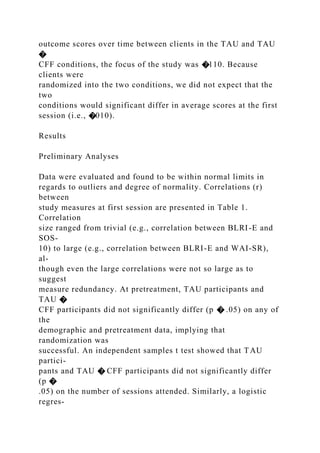
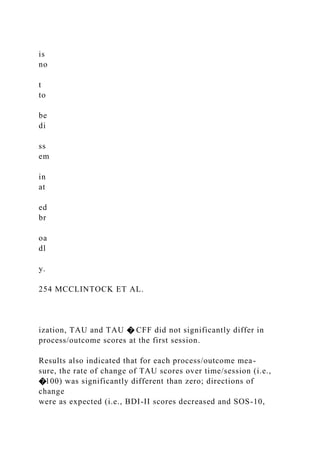
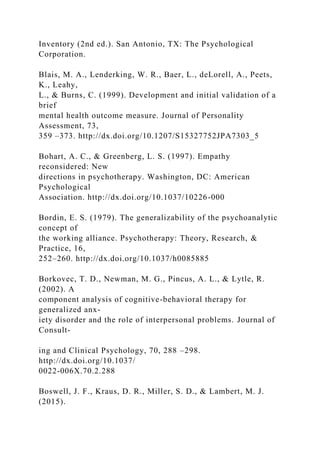
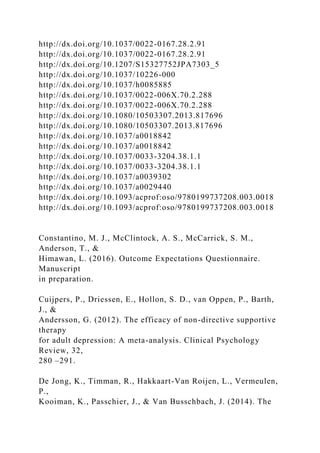
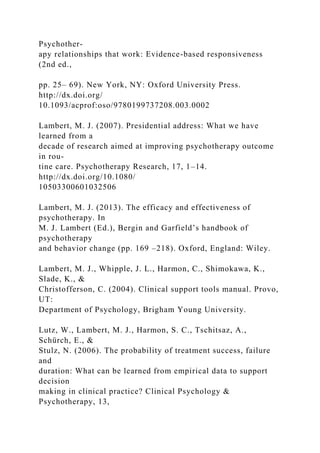
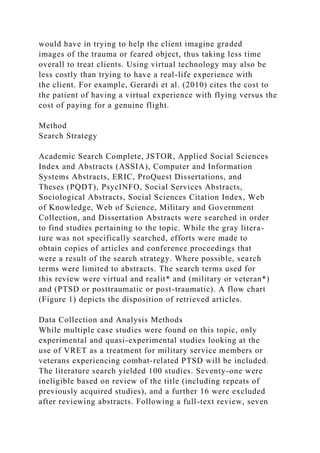
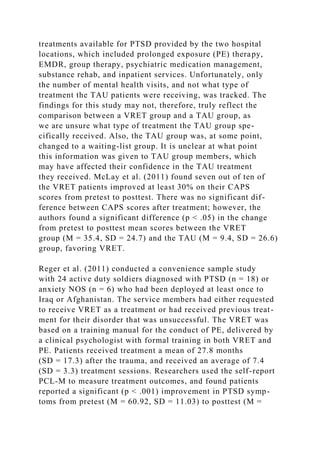
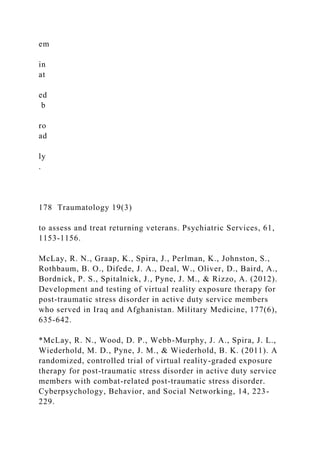
![To account for the different shapes that the growth curve might
take, four different unconditional growth curves were fitted to
the
data, and the best model was obtained by comparing the
informa-
tion criteria (i.e., Akaike Information Criteria [AIC] and
Bayesian
Information Criteria [BIC]). The four unconditional growth
curves
were as follows: (a) a linear unconditional growth curve (i.e., a
model with only a linear term of session number included as the
Level 1 predictor) to assess the possibility that scores decrease
or
increase at a constant rate over time; (b) a log unconditional
growth curve (i.e., a model with only a log of session number
included as the Level 1 predictor) to assess the possibility that
scores decrease or increase at a faster rate during the early ses-
sions, then decrease or increase at a slower rate during the later
sessions; (c) a quadratic unconditional growth curve (i.e., a
model
with linear and quadratic terms of session number as the Level 1
predictors) to assess the possibility that scores first decrease
over
time then increase or first increase then decrease; and (5) a
cubic
unconditional quadratic growth curve (i.e., a model with linear,
quadratic, and cubic terms of session number as the Level 1
predictors) to assess the possibility that scores decrease first
over
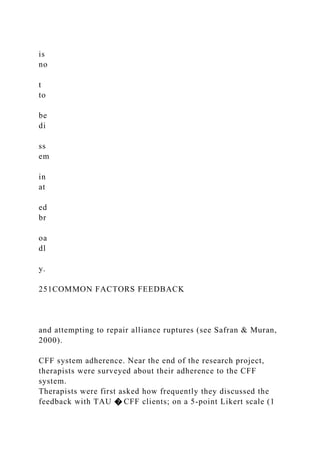
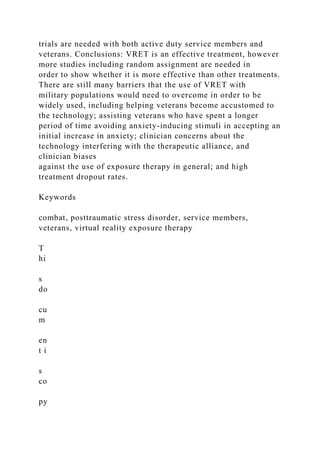
Figure 2. Example of feedback graph. See the online article for
the color version of this figure.
T
hi](https://image.slidesharecdn.com/enhancingpsychotherapyprocesswithcommonfactorsfeedback-230108091546-8446de24/85/Enhancing-Psychotherapy-Process-With-Common-Factors-Feedback-docx-48-320.jpg)


![r0ij
� r1ij(Session)tij � etij]
In the previous model, (Measure)tij is the process/outcome
measure
(i.e., BDI-II, SOS-10, WAI-SR, BLRI-E, or OEQ) at time t for
client
i seeing therapist j; because Session was centered at the first
session
(i.e., immediately before first session for BDI-II, SOS-10 and
OEQ
and immediately after first session for BLRI-E and WAI-SR),
�000 is
the average of the scores at the first session; and �100 is the
rate of
change of the scores over one unit of time (i.e., session). A
significant
�000 means that the average of the scores at the first session is
significantly different than zero. A significant �100 means that
the
scores change significantly over time (i.e., the rate of change of
the scores is significantly different than zero). The parameters
inside
the brackets are the random effects: etij is the session
variability within
a client; r0ij and r1ij are client variability within a therapist
around �000
and �100, respectively; and u00j and u10j are therapist
variability
around �000 and �100, respectively. In the beginning of the
model
fitting, �000 and �100 were treated as random effects at both
Levels 2
and 3. However, when there was an indication that the model
was](https://image.slidesharecdn.com/enhancingpsychotherapyprocesswithcommonfactorsfeedback-230108091546-8446de24/85/Enhancing-Psychotherapy-Process-With-Common-Factors-Feedback-docx-54-320.jpg)
![overspecified, these random effects were dropped one by one
starting
from the highest level, until the model fit properly.
Also for illustration purposes, the linear model fitted with treat-
ment condition (TC) as a Level 2 predictor is provided here:
Level 1:
(Measure)tij � �0ij � �1ij(Session)tij � etij
Level 2:
�0ij � �00j � �01j(TC)ij � r0ij
�1ij � �10j � �11j(TC)ij � r1ij
Level 3:
�00j � �000 � u00j
�01j � �010
�10j � �100 � u10j
�11j � �110
The complete model:
(Measure)tij � �000 � �010(TC)ij � �100(Session)tij
� �110(TC)ij(Session)tij � [u00j � u10j(Session)tij
� r0ij � r1ij(Session)tij � etij]
In the previous model, (Measure)tij is the process/outcome
measure
at time t for client i seeing therapist j; because Session was
centered
at the first session and Treatment Condition was centered at](https://image.slidesharecdn.com/enhancingpsychotherapyprocesswithcommonfactorsfeedback-230108091546-8446de24/85/Enhancing-Psychotherapy-Process-With-Common-Factors-Feedback-docx-55-320.jpg)


![(BDI-II)tij � �000 � �100(Session)tij � [u00j �
u10j(Session)tij � r0ij
� r1ij(Session)tij � etij]
(2) SOS-10
(SOS-10)tij � �000 � �100(Session)tij � [u10j(Session)tij �
r0ij
� r1ij(Session)tij � etij]
(3) WAI-SR
(WAI-SR)tij � �000 � �100(LogSession)tij
� [r0ij � r1ij(LogSession)tij � etij]
(4) BLRI-E
(BLRI-E)tij � �000 � �100(LogSession)tij �
[u10j(LogSession)tij
� r0ij � r1ij(LogSession)tij � etij]
(5) OEQ
(OEQ)tij � �000 � �100(Session)tij � [r0ij � r1ij(Session)tij
� etij]
Results indicated that the average of the scores at the first
session (i.e.,
�000) and the rate of change over time/session (i.e., �100)
were](https://image.slidesharecdn.com/enhancingpsychotherapyprocesswithcommonfactorsfeedback-230108091546-8446de24/85/Enhancing-Psychotherapy-Process-With-Common-Factors-Feedback-docx-64-320.jpg)
![significantly different than zero. As expected, BDI-II scores
decreased
over time, while SOS-10, WAI-SR, BLRI-E, and OEQ scores in-
creased over time. Over one unit of time/session, BDI-II scores
decreased by 2.74 points, SOS-10 scores increased by 2.42
points,
WAI-SR scores increased by 5.75 points, BLRI-E scores
increased by
0.32 points, and OEQ scores increased by 2.21 points. A
summary of
the unconditional growth curve results is presented in Table 2.
In the next set of analyses, treatment condition was entered as a
Level 2 predictor. The final conditional growth curves were:
(1) BDI-II
(BDI-II)tij � �000 � �010(TC)ij � �100(Session)tij
� �110(TC)ij(Session)tij � [u00j � u10j(Session)tij
� r0ij � r1ij(Session)tij � etij]
(2) SOS-10
(SOS-10)tij � �000 � �010(TC)ij � �100(Session)tij
� �110(TC)ij(Session)tij � [u10j(Session)tij � r0ij
� r1ij(Session)tij � etij]
(3) WAI-SR
(WAI-SR)tij � �000 � �010(TC)ij � �100(LogSession)tij
� �110(TC)ij(LogSession)tij � [u10j(LogSession)tij](https://image.slidesharecdn.com/enhancingpsychotherapyprocesswithcommonfactorsfeedback-230108091546-8446de24/85/Enhancing-Psychotherapy-Process-With-Common-Factors-Feedback-docx-65-320.jpg)
![� r0ij � r1ij(LogSession)tij � etij]
(4) BLRI-E
(BLRI-E)tij � �000 � �010(TC)ij � �100(LogSession)tij
� �110(TC)ij(LogSession)tij � [u10j(LogSession)tij
� r0ij � r1ij(LogSession)tij � etij]
(5) OEQ
(OEQ)tij � �000 � �010(TC)ij � �100(Session)tij
� �110(TC)ij(Session)tij � [r0ij � r1ij(Session)tij � etij]
Results indicated that for each process/outcome measure, the
average of TAU scores at the first session (i.e., �000) was
signif-
icantly different than zero. For each process/outcome measure,
the
effect of the TAU � CFF condition on �000 (i.e., �010) was
not
significant. This implies that, as would be expected given
random-
Table 1
Means (SDs) and Correlations for Study Measures at First
Session (N � 79)
Study measures M (SD) BDI-II SOS-10 WAI-SR BLRI-E OEQ
BDI-II 23.68 (8.21) �.65��� �.17 .22 .03
SOS-10 31.26 (8.32) .19 �.02 .08
WAI-SR 43.60 (7.83) .63��� .48���](https://image.slidesharecdn.com/enhancingpsychotherapyprocesswithcommonfactorsfeedback-230108091546-8446de24/85/Enhancing-Psychotherapy-Process-With-Common-Factors-Feedback-docx-66-320.jpg)


![common factor in brief treatments for depression.
Psychotherapy Re-
search, 17, 137–147.
http://dx.doi.org/10.1080/10503300600919380
Received August 20, 2016
Revision received November 7, 2016
Accepted November 7, 2016 �
Members of Underrepresented Groups:
Reviewers for Journal Manuscripts Wanted
If you are interested in reviewing manuscripts for APA journals,
the APA Publications and
Communications Board would like to invite your participation.
Manuscript reviewers are vital to the
publications process. As a reviewer, you would gain valuable
experience in publishing. The P&C
Board is particularly interested in encouraging members of
underrepresented groups to participate
more in this process.
If you are interested in reviewing manuscripts, please write
APA Journals at [email protected]
Please note the following important points:
• To be selected as a reviewer, you must have published articles
in peer-reviewed journals. The
experience of publishing provides a reviewer with the basis for
preparing a thorough, objective
review.
• To be selected, it is critical to be a regular reader of the five
to six empirical journals that are most
central to the area or journal for which you would like to](https://image.slidesharecdn.com/enhancingpsychotherapyprocesswithcommonfactorsfeedback-230108091546-8446de24/85/Enhancing-Psychotherapy-Process-With-Common-Factors-Feedback-docx-167-320.jpg)


![459891TMTXXX10.1177/153
4765612459891TraumatologyNelson
1Florida State University, Tallahassee, FL, USA
Corresponding Author:
Rebekah J. Nelson, Florida State University, 296 Champions
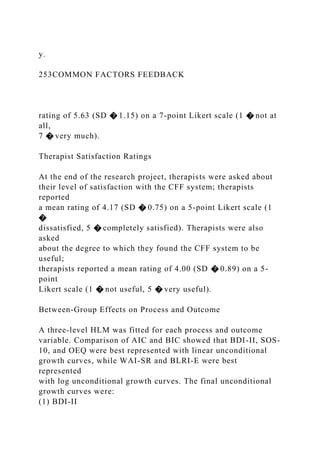
Way,
University Center, Building C, Tallahassee, FL 32306, USA.
Email: [email protected]
Is Virtual Reality Exposure Therapy
Effective for Service Members and
Veterans Experiencing Combat-
Related PTSD?
Rebekah J. Nelson1
Abstract
Purpose: Exposure therapy has been identified as an effective
treatment for anxiety disorders, including posttraumatic stress
disorder (PTSD). The use of virtual reality exposure therapy
(VRET) in the past decade has increased due to improvements
in
virtual reality technology. VRET has been used to treat active
duty service members and veterans experiencing posttraumatic
stress symptoms by exposing them to a virtual environment
patterned after the real-world environment in which the trauma
occurred. This article is a systematic review of the effectiveness
of using VRET with these two populations. Method: A
search of 14 databases yielded 6 studies with experimental or
quasi-experimental designs where VRET was used with active
duty service members or veterans diagnosed with combat-
related PTSD. Results: Studies show positive results for the
use of VRET in treating combat-related PTSD, though more](https://image.slidesharecdn.com/enhancingpsychotherapyprocesswithcommonfactorsfeedback-230108091546-8446de24/85/Enhancing-Psychotherapy-Process-With-Common-Factors-Feedback-docx-175-320.jpg)


![Bridging virtual and real worlds in the treatment of posttrau-
matic stress disorders. Cyberpsychology, Behavior, and Social
Networking, 13(1), 55-65.
Rizzo, A., Reger, G., Gahm, G., Difede, J., & Rothbaum, B. O.
(2009). Virtual reality exposure therapy for combat related
PTSD. Post-Traumatic Stress Disorder, 6, 375-399.
Rothbaum, B. O. (2006). Virtual Vietnam: Virtual reality
exposure
therapy. In M. Roy (Ed.), Novel approaches to the diagnosis
and treatment of posttraumatic stress disorder (pp. 205-218).
Amsterdam, The Netherlands: IOS Press.
Rothbaum, B. O., Hodges, L. F., Ready, D., Graap, K., &
Alarcon, R. D.
(2001). Virtual reality exposure therapy for Vietnam veterans
with posttraumatic stress disorder. Journal of Clinical Psychia-
try, 62, 617-622.
Stetz, M. C., Long, C. P., Wiederhold, B. K., & Turner, D. D.
(2008). Combat scenarios and relaxation training to harden
medics against stress. Journal of CyberTherapy & Rehabilita-
tion, 1, 239-246.
Virtual Iraq Afghanistan Media Story CBC [video file].
Retrieved
from http://www.youtube.com/watch?v=Ltl9zbDRZWY&
feature=autoplay&list=UUQrbzaW3x9wWoZPl4-l4GSA
&playnext=1
Wood, D. P., Murphy, J. A., Center, K. B., Russ, C., McLay, R.
N.,
Reeves, D., . . . Wiederhold, B. K. (2008). Combat related post-
traumatic stress disorder: A multiple case report using virtual
reality graded exposure therapy with physiological monitoring.](https://image.slidesharecdn.com/enhancingpsychotherapyprocesswithcommonfactorsfeedback-230108091546-8446de24/85/Enhancing-Psychotherapy-Process-With-Common-Factors-Feedback-docx-229-320.jpg)