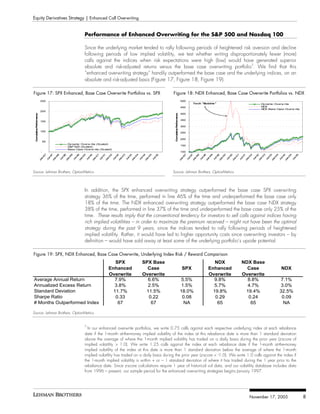
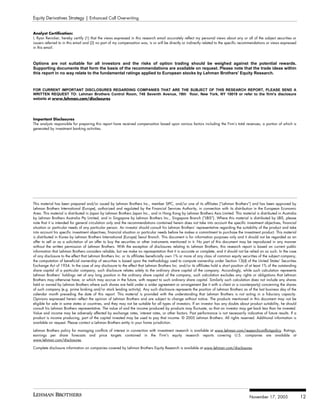
- Lehman Brothers provides research on companies it also does business with, so its research may not be entirely objective. Investors should consider this and other factors when making investment decisions.
- The document discusses strategies for overwriting index call options, such as the S&P 500, to potentially enhance returns. It finds that enhanced strategies that adjust the level of overwriting based on implied volatility can further improve risk-adjusted returns compared to static overwriting strategies.
- Specifically, an enhanced strategy that overwrites with fewer calls when implied volatility is high, and more calls when implied volatility is low, performed best in backtests, outperforming simple overwriting strategies and the underlying indices on an absolute and risk-adjusted basis.
Parametric provides strategies for exploiting increased market volatility, including rebalancing portfolios and using options strategies. Rebalancing reduces concentration risks and volatility over time by selling assets that have increased in value and buying those that have decreased, capturing returns from volatility. Options strategies can also provide downside protection for portfolios while retaining upside potential. Parametric implemented an options overlay for a client in 2008 that protected against a 5-20% market decline while retaining upside to 30%, balancing protection and participation in gains.
Enhanced Call Overwriting*
Systematically overwriting the S&P 500 with 1-month at-the-money calls, rebalanced on a monthly basis at expiration, outperformed the S&P 500 Index during our sample period (1996 – 2005). This “base case” overwriting strategy also generated superior risk-adjusted returns versus the index.
Overwriting portfolios with out-of-the-money calls tends to outperform at-the-money overwriting during market rallies, but provides less protection during market downturns. However, out-of-the money overwriting also results in relatively higher return variability and inferior risk-adjusted performance.
During the sample period, overwriting the S&P 500 with short-dated options, rebalanced more frequently, outperformed overwriting with longer-dated options, rebalanced less frequently. We discuss possible explanations for these performance differences.
We find that going long the market during periods of heightened short-term anxiety, inferred from the presence of relatively high S&P 500 1-month at-the-money implied volatility, has, on average, been a winning strategy. To a slightly lesser extent, having relatively less exposure to the market during periods of complacency – or relatively low implied market implied volatility – was also beneficial.
We create an “enhanced” overwriting strategy – whereby investors systematically overwrite the S&P 500 or Nasdaq 100 with disproportionately fewer (more) calls against the indices when risk expectations are relatively high (low).
Our enhanced overwriting portfolios handily outperformed the base case overwrite portfolios and the respective underlying indices, on an absolute and risk-adjusted basis. For example, the average annual return for the S&P 500 enhanced overwriting portfolio from 1997 – 2005 was 7.9%, versus 6.6% for the base case overwrite portfolio and 5.5% for the S&P 500 Index.
Overwriting with fewer calls when implied volatility is rich, and more calls when implied volatility is cheap, could improve the absolute and risk-adjusted performance of index-oriented overwriting portfolios.
This goes against the conventional tendency for investors to sell calls against their positions when implied volatility is high.
*Renicker, Ryan and Devapriya Mallick., “Enhanced Call Overwriting.”, Lehman,Brothers Global Equity Research Nov 17, 2005.
This document discusses hedge fund investment philosophy and manager selection. It makes the following key points:
1) Hedge fund returns come from systematic risk premiums, liquidity premiums, and alpha, which are amplified by leverage. True alpha is rare and hard to achieve consistently.
2) Successful manager selection focuses on those with a sustainable competitive edge investing in less crowded strategies, and an understanding of how to reduce risk in stressful times.
3) The selection process profiles managers' investment beliefs, alpha generation process, and risk philosophy to construct an expected return distribution for each manager.
The casual analysis of market moves in Q1 2016 does not fully explain the performance of hedge funds over the period. In addition to changes in global macroeconomic conditions and market dynamics over the course of the quarter, hedge fund performance was driven by the impact of momentum and concentration across portfolios and the structure and behavior of multi-strategy funds.
The study was undertaken to investigate the possibility of momentum and contrarian strategies to outperform and generate a superior return to the investor i.e. returns over and above the benchmark index. Analysis of the data collected over four years (2016-2019) for quarterly, half-yearly and yearly holding periods resulted in rejecting the possibility of the momentum and contrarian strategies to outperform index consistently, even though they provide huge returns sometimes, in the Indian stock market for the period under study
This document provides an overview of the Capital Asset Pricing Model (CAPM). It was developed by Sharpe and Linter based on Markowitz's portfolio theory. CAPM assumes investors will create a portfolio using risky assets and risk-free assets, such as treasury bills. It can be used to analyze the risk and return of individual securities. The model relates the expected return of securities to market risk using the security market line formula.
Fundamental factors that affect stock value include earnings per share and valuation multiples like the price-to-earnings ratio. Technical factors beyond company fundamentals can also influence stock prices, such as inflation, economic strength of the market and industry peers, availability of substitutes, incidental transactions, demographics of investors, trends, liquidity, and market sentiment. Together, fundamental and technical factors determine stock prices in both efficient and inefficient markets.
1) The document analyzes how different investment horizons and herding behavior impact investor returns over multiple market cycles from 2001-2008.
2) It tracks sales volatility and changes in investor herding to identify phases where returns were most impacted by shifts in sentiment.
3) The analysis finds that discipline around selling, rather than buying, had a greater impact on returns. Investors with medium-term horizons of 2-5 years tended to perform best when taking a bearish stance, while bullish investors favored longer horizons of 5+ years.
This document provides an overview of real options analysis (ROA) and how it can be applied to evaluate an oil field investment project. ROA accounts for flexibility and uncertainty in a project's cash flows, unlike traditional discounted cash flow analysis. The document discusses financial options concepts, outlines the Black-Scholes options pricing model, and provides an example of using ROA to determine the optimal drilling order for nine oil wells to maximize project value for investors in an unnamed private fund. Linear optimization software is used to calculate the combination of drilling schedules across the nine wells that results in the highest total value of real options.
This document discusses estimating beta and its significance. It begins with an introduction to risk and portfolio theory. It then provides background on portfolios and beta. The document analyzes the risk and return of individual stocks from State Bank of India and Infosys Ltd. It forms multiple portfolios combining the stocks and estimates their risk and return. The beta of each stock is calculated graphically. An optimal portfolio with minimum risk is identified. The conclusion is that portfolio risk is lower than individual stock risk and investors should be careful in volatile market conditions.
Security Analysis and Portfolio Management - Investment-and_Riskumaganesh
Investment involves allocating funds to assets with the goal of earning income or capital appreciation over time. Speculation aims to profit from short-term price fluctuations by taking on high business risk. Investors typically have a longer time horizon, consider fundamentals, and accept moderate risk for returns, while speculators have a very short horizon, rely on market behavior, and use leverage to seek high returns for high risk. Risks include systematic market, interest rate, and inflation risks that affect all investments, as well as unsystematic business and financial risks that are specific to individual firms.
- Arbitrage funds aim to generate returns by exploiting short-term price differences between the cash and futures markets for the same asset. They adopt strategies like stock spot-futures arbitrage and index arbitrage.
- Compared to other short-term debt funds, arbitrage funds offer tax benefits as they are considered equity funds. Returns are generally stable with low risk. However, most schemes levy exit loads if redeemed within 3 months.
- Top performing schemes over the last 1, 3 and 5 years included Reliance Arbitrage Advantage, ICICI Pru Equity Arbitrage and SBI Arbitrage Opportunities. While returns are similar to liquid funds over the long run
Moving averages and volatility bands like Bollinger Bands, Keltner Channels, and Donchian Channels can be used to identify trends and potential buy/sell signals in financial markets. They provide relative definitions of high and low prices that can help compare price action to indicators. Parameters like length of moving averages and bandwidth percentages must be chosen based on the asset and trading objectives. Crossing or moving outside the bands can signal trend continuation or reversals depending on other confirming indicators and market conditions.
The document discusses pair trading strategies using equities, ETFs, and stock indices. It finds that:
1) A mean-reversion strategy that recalibrates hedge ratios and means over rolling windows outperforms a static strategy for equity pairs.
2) Pair trading performance is more consistent for ETFs and indices than for individual equities.
3) A strategy relying on price shocks is inappropriate for equity pairs but can profitably trade index pairs if risks are managed.
There are three main forms of market efficiency:
1) Weak form - Prices reflect all past price information. Technical analysis is not useful.
2) Semi-strong form - Prices reflect all public information. Fundamental analysis is not useful.
3) Strong form - Prices reflect all public and private information. No analysis is useful.
The Arbitrage Pricing Theory (APT) is a multi-factor model that does not rely on a market portfolio like the Capital Asset Pricing Model (CAPM). The APT allows for multiple factors that influence returns while the CAPM only considers systematic risk relative to the market.
Technical indicators like moving averages and oscillators
The document provides an overview of security analysis and different analytical techniques used, including fundamental analysis and technical analysis.
Fundamental analysis involves analyzing the economy, industry, and company to determine a company's intrinsic value. Technical analysis uses historical price and volume data to identify trends and patterns that can predict future price movements. Key techniques include chart analysis and identifying support/resistance levels and patterns like head and shoulders. The efficient market hypothesis suggests stock prices already reflect all available public information and it is difficult to outperform the overall market through analysis alone.
This document discusses investment fundamentals, securities analysis, and portfolio management. It covers topics such as understanding investment, risk and return, securities analysis concepts, fundamental analysis framework, intrinsic and relative valuation, portfolio theory, and portfolio performance measurement. The key points are:
- It defines investment, risk, sources of risk, and different types of securities. It discusses the risk-return tradeoff between different securities.
- It covers the concepts of securities analysis, fundamental analysis framework using top-down and bottom-up approaches, and intrinsic valuation using discounted dividend models.
- It provides an overview of portfolio theory including modern portfolio theory, capital market theory, portfolio construction, and performance measurement.
The document discusses key concepts for investment analysis and project selection, including:
1) Projects should yield a return greater than the minimum hurdle rate, which is higher for riskier projects. Returns should consider cash flows, timing, and side effects.
2) The optimal financing mix minimizes the hurdle rate and matches the assets financed.
3) If not enough high-returning investments exist, excess cash should be returned to stockholders.
This research paper discusses enhancing value investment strategies by incorporating expected profitability.
For small cap value strategies, the paper proposes excluding stocks in each country with the lowest direct profitability, with the percentage excluded depending on the stock's price-to-book ratio.
For large cap value strategies, the paper suggests selecting stocks based on both low price-to-book ratios and high direct profitability. It also proposes overweighting stocks that have higher profitability, lower market capitalization, and lower relative price.
The goal is to structure portfolios to better capture the dimensions of expected returns related to company size, relative price, and expected profitability, while maintaining appropriate diversification and managing costs.
The document provides information about the S&P CNX Nifty and NASDAQ-100 stock indices.
The S&P CNX Nifty tracks the performance of the 50 largest Indian companies listed on the National Stock Exchange of India based on market capitalization. It covers 23 sectors of the Indian economy. The NASDAQ-100 tracks the performance of 100 of the largest domestic and international non-financial companies listed on the Nasdaq Stock Market based on market capitalization. Both indices have eligibility criteria for initial and continued inclusion and use formulae to calculate index values based on the market values and weights of constituent securities.
This document analyzes value versus growth investing styles through the lens of Dick Mayo's dilemma at GMO about whether to continue focusing on value stocks. It provides an in-depth comparison of the two styles, discussing their different focuses, investment philosophies, risks, typical stock features, and strategies. The document also analyzes whether value investing is still the right strategy given changing economic conditions that have favored growth stocks in recent years. Calculations are shown evaluating specific stocks like Cisco, CVS, and RR Donnelley to determine if they are over or undervalued based on criteria like P/E ratio, P/B ratio, and expected long-term returns.
Black Swan Event and How to Prepare for ItSamir Halim
This document discusses preparing for a potential "Black Swan" market event and strategies for market timing. It suggests that while impossible to perfectly predict, active managers can see warnings through indicators on multiple timeframes. The author advocates diversifying across asset classes and holdings, scaling positions, following multiple indicators, and building cash reserves. An example portfolio combines equity and volatility holdings across systems to produce stable returns with minimal drawdowns compared to buy-and-hold. The document also covers relative vs absolute returns and discusses market timing approaches and limitations.
The document discusses the Capital Asset Pricing Model (CAPM) and its use in evaluating securities and predicting expected returns based on systematic risk (beta). It analyzes stocks listed on the Muscat Securities Market (MSM30) index in Oman to evaluate securities based on their beta values and determine appropriate expected returns. Prior research studies on CAPM are also reviewed that test the model in various markets, with mixed results regarding CAPM's ability to fully explain returns based on beta alone.
Actionable trade ideas for stock market investors and traders seeking alpha by overlaying their portfolios with options, other derivatives, ETFs, and disciplined and applied Game Theory for hedge fund managers and other active fund managers worldwide. Ryan Renicker, CFA
1) The Capital Asset Pricing Model (CAPM) relates the risk and expected return of securities. It measures a security's risk compared to the overall market using beta.
2) Beta is a measure of a security's systematic risk. It indicates how sensitive the security's returns are to changes in the overall market.
3) According to CAPM, a security's expected return is determined by its beta - a higher beta means higher expected returns due to greater systematic risk.
Mutual funds are investment vehicles that allow investors to pool their money together into a portfolio of securities like stocks, bonds, and other assets. The key advantages of mutual funds are diversification of risk, professional management, low minimum investment amounts, and liquidity. The average assets under management of the Indian mutual fund industry has grown over 3.5 times in the last 10 years and over 2.5 times in the last 5 years, reaching Rs. 26.33 trillion as of October 2019. Mutual funds are structured as trusts that have sponsors, trustees, asset management companies, and unit holders. The main types of mutual funds are based on their investment objectives such as income, balanced, equity, and other criteria. Performance is
Details the advantages volatility risk premium creates for put writing versus covered calls. Focused on passive long only investors. Basic option characteristics explained first.
Options on the VIX and Mean Reversion in Implied Volatility Skews RYAN RENICKER
Actionable trade ideas for stock market investors and traders seeking alpha by overlaying their portfolios with options, other derivatives, ETFs, and disciplined and applied Game Theory for hedge fund managers and other active fund managers worldwide. Ryan Renicker, CFA
Question 1Risk & Return and the CAPM. Based on the following.docxIRESH3
Question 1
Risk & Return and the CAPM.
Based on the following information, calculate the required return based on the CAPM:
Risk Free Rate = 3.5%
Market Return =10%
Beta = 1.08
Question 2
Risk and Return, Coefficient of Variation
Based on the following information, calculate the coefficient of variation and select the best investment based on the risk/reward relationship.
Std Dev.Exp. Return
Company A 7.4 13.2
Company B 11.6 18.9
Question 3
Risk and Return, Coefficient of Variation
Based on the following information, calculate the coefficient of variation and select the best investment based on the risk/reward relationship.
Std Dev.Exp. Return
Company A 10.4 15.2
· Company B 14.6 22.9
Question 4
Measures of Risk.
Address each source of risk that is measured and relate it to two models addressed in this unit.
· Your response should be at least 250 words in length.
BBA 3301, Financial Management 1
UNIT VI STUDY GUIDE
Risk and Return
Learning Objectives
Upon completion of this unit, students should be able to:
1. Explain the risk-reward relationship.
2. Calculate holding period returns.
3. Calculate required returns using the Capital Asset Pricing Model
(CAPM).
4. Calculate the coefficient of variation for varying investments.
5. Decompose sources of risk.
6. Contrast measures of risk.
7. Describe portfolio theory and diversification.
Written Lecture
Whenever a business or individual makes an investment decision, risk must be
considered. This unit focuses entirely on the risk-return relationship, providing
tools for measurement, analysis and decision making.
To begin, the term risk must be defined. From a practical or applied perspective,
risk is the probability of losing some or all of the money invested. In finance, risk
is often associated with volatility of variance in returns (around some average
return). Generally, it is assumed that investments that offer higher returns
involve greater risk. For purposes of this unit, risk is measured through two
primary measures:
Standard Deviation, and
The Beta Coefficient
The rate of return allows an investment's return to be compared with other
investments. For one-year investments, the return on a debt investment is:
k = interest paid / loan amount
The return on a stock investment is calculated by the following equation
k = [D1 + (P1 – P0)] / P0
Where:
D1 = Dividends for the “next” year (on a share of stock)
P1= Price of a share of stock, one period into the future
P0= Price of a share of stock today
The expected return on stock is the return investors feel is most likely to occur
based on current information. Return is influenced by the combination of stock
price (capita ...
This document discusses analyzing investor behavior through analyzing their portfolio's performance and cost basis. It provides examples of calculating average cost basis using volume weighted average price. Analyzing cost basis at the individual security, fund, and portfolio level can provide insights into an investor's sentiment toward a stock and tendencies to take profits or losses. The document shows examples of different investors' portfolios concentrated in various profit/loss bands and how this relates to factors like portfolio turnover. Analyzing cost basis over time can help understand an investor's momentum and pressures.
Why Emerging Managers Now? - Infusion Global Partners WhitepaperAndrei Filippov
Traditional asset classes appear to offer uninspiring beta returns at present, and recent years’ hedge fund returns have disappointed both in magnitude and diversification benefits, likely reflecting capacity pressures associated with the concentration of AUM and inflows with larger funds. We argue that, by contrast, Emerging hedge funds offer a rich opportunity set with far fewer capacity issues where skilled managers with concrete competitive advantages in less efficient, smaller capitalization market segments can generate better, more sustainable and less correlated excess returns. Emerging managers do involve more investment and operational risk than larger peers; to that challenge we offer some suggestions on a thoughtful and rigorous approach to constructing an Emerging Managers allocation and balancing effective due diligence with scalability.
Prepared by Students of University of Rajshahi
Shahin Islam
Aslam Hossain
Shahidul Islam
Amy Khatun
Sohanuzzaman Sohan
MD. Rehan
Bikash Kumar
Rahid Hasan
Ali Haider
Uttam Kumar
MD. Abdullah AL Mamun
Mamunur Rahman
presented by Mango squad
For downloading this contact- bikashkumar.bk100@gmail.com
Options Strategy Monthly - 2006 - Low Volatility in the 7th Inning? Housing M...RYAN RENICKER
Actionable trade ideas for stock market investors and traders seeking alpha by overlaying their portfolios with options, other derivatives, ETFs, and disciplined and applied Game Theory for hedge fund managers and other active fund managers worldwide. Ryan Renicker, CFA
2015 why low beta (and not low volatility) outperformsFrederic Jamet
This document discusses why low beta strategies outperform compared to low volatility strategies. It provides 7 theoretical arguments for why low beta stocks are underpriced, including behavioral biases that push investors towards high beta stocks and rational constraints that limit arbitrage of the low beta anomaly. Empirically, it shows that both low beta and low volatility strategies have outperformed the market, but the outperformance is better explained by the low beta feature rather than just low volatility. Low beta strategies tend to have lower skewness, which makes them less risky and more attractively priced by rational investors.
Hedge funds have been criticized for taking hefty fees without a performance to match. This presentation takes a look at the issue of hedge fund performance looking at both sides of the equation and evaluating how hedge funds fit into an investment portfolio.
The document provides an overview of key topics from Q4 2013 including:
- Bonds still belong in portfolios despite rising interest rates due to their benefits of low correlation to stocks, lower volatility, and liquidity. Flexible bond funds that can minimize interest rate risk performed well compared to benchmarks in 2013.
- The Merger Fund uses an arbitrage strategy focused on mergers after announcement but before completion to achieve steady returns with very low volatility and correlation to stocks and bonds, making it a good diversifier.
- Duration risk, or sensitivity to interest rate changes, has increased in the bond market and conservative investors should consider this risk given the likelihood of rising rates.
- Being a registered investment advisor
An investment in mid-cap stocks would have significantly outperformed large and small cap stocks over the long term between 1979 and 2009. Mid-caps have exhibited a consistent record of outperformance relative to other market caps across various time periods. They also provide a better risk-reward relationship than other caps, participating in market upswings while avoiding much of the downside. Mid-cap performance follows predictable patterns over economic cycles. The current market environment is favorable for mid-caps, and including a mid-cap allocation has historically improved portfolio performance with minimal increased risk.
1) The document analyzes perverse incentives created by common hedge fund fee structures, noting fees as high as 2-3% annually plus 20% of gains can incentivize inappropriate investments.
2) Research cited finds hedge funds from 1995-2003 returned an average of 8.82% annually, but estimates actual returns for investors were 500-1000 bps lower due to biases.
3) While hedge funds provided some diversification, correlations with stocks were around 0.3 on average, meaning investors paid fees for passive stock exposure rather than skill.
This document summarizes the key tenets of Modern Portfolio Theory (MPT) and its influence on investing over the past 50 years. It discusses how MPT, developed in the 1950s, established that diversifying across different asset classes in indexed funds could achieve more consistent returns than investing in a single asset class. It also describes how MPT is based on assumptions that markets are efficient and that investors have long time horizons. While MPT became the standard for large institutional investors, the document argues that pushing it to individual investors instilled a false sense of certainty about long-term stock returns and risk.
This document discusses the differences between absolute return and relative return investment approaches for charity trustees. It defines absolute return as aiming for a positive return in all market conditions by outperforming cash or inflation, while relative return aims to outperform a benchmark index or peer group. The document examines the advantages and disadvantages of each approach, noting there is no single right answer and trustees must consider their charity's individual needs. Key factors in the increased debate around these approaches include more investment options available and recent major stock market declines.
For the first time since 2009, 3-Month LIBOR has risen above 0.75%, which will impact corporate loan deals and potentially benefit investors. A rise in LIBOR means more loans will float off their floors, increasing coupon payments. The rise was likely caused by investors pulling money from prime funds due to impending money market reforms. With low yields across bonds, corporate loans may be preferable for their floating rates and higher yields with less volatility than high yield bonds.
This document introduces dynamic risk management as an alternative to static 60/40 portfolio allocations. It argues that static allocations are unsuitable in both bull and bear markets, by providing too little protection in downturns but excessively dampening returns during upturns. The document proposes using market condition analysis to dynamically shift allocations between stocks and bonds based on short, medium, and long-term market trends. Historical data is presented showing that dynamic allocations achieved higher returns with smaller drawdowns than static 60/40 portfolios during the 2001-2018 period.
The document discusses the benefits of including managed futures/commodities trading advisors (CTAs) in investment portfolios. It notes that CTAs may have an information advantage over equity and fixed income managers in interpreting commodities markets. CTAs also tend to have low or negative correlation with traditional stock and bond holdings, helping to improve risk-adjusted returns and reduce volatility for portfolios. Back-testing shows that including a 10% allocation to CTAs led to increased returns, lower volatility, and a sharper ratio for portfolios over the past 10 years compared to holdings without CTAs.
Similar to Enhanced Call Overwriting - Groundbreaking Study Published in 2005 (20)
Advisory to Financial Institutions on E-Mail Compromise Fraud SchemesRyan Renicker CFA
"The Financial Crimes Enforcement Network (FinCEN) is issuing this advisory to help financial institutions guard against a growing number of e-mail fraud schemes, in which criminals
misappropriate funds by deceiving financial institutions and their customers into conducting wire transfers.
This advisory also provides red flags—developed in consultation with the Federal Bureau of Investigation (FBI) and the U.S. Secret Service (USSS)—that financial institutions may use to identify and prevent such e-mail fraud schemes."
Source: FinCEN Advisory FIN-2016-A003, September 6, 2016
This document provides guidelines for safely using Twitter. It recommends only connecting with people you know, assuming anything you post is public, and ensuring family also practices privacy. It advises avoiding posting photos that clearly show your face. The document also outlines how to configure privacy settings to limit visibility of tweets, followers, and profile information to approved accounts only. It provides tips like avoiding hashtags and location data, changing usernames periodically, and using nicknames instead of real names or photos.
Attached for your reference are “Quick Tips” regarding methods one can use to minimize your becoming a victim of cyber crime while using social media.
You are encouraged to share these tips with your friends, family and co-workers.
Also included is this “smart card” for LinkedIn for increased security awareness.
UNCLASSIFIED - TLP: WHITE. TLP: WHITE information may be distributed without restriction, subject to copyright controls.
Source: FBI.
Attached for your reference are “Quick Tips” regarding methods one can use to minimize your becoming a victim of cyber crime while using social media.
You are encouraged to share these tips with your friends, family and co-workers.
UNCLASSIFIED - TLP: WHITE. TLP: WHITE information may be distributed without restriction, subject to copyright controls.
Source: FBI.
The document provides guidance on privacy settings and information sharing for Google+ profiles. It recommends only connecting with people you know, assuming anything shared can be seen publicly, and avoiding posting photos that clearly show your or your family's face. It also gives directions to adjust privacy settings to share only with circles selected, limit profile information to your circles, and adjust account settings to opt-out of sharing notifications, connections to other accounts and services. The document stresses limiting one's presence and digital footprint on Google+ for privacy.
Attached for your reference are “Quick Tips” regarding methods one can use to minimize your becoming a victim of cyber crime while using social media.
You are encouraged to share these tips with your friends, family and co-workers.
Also included is this “smart card” for Facebook for increased security awareness.
UNCLASSIFIED - TLP: WHITE. TLP: WHITE information may be distributed without restriction, subject to copyright controls.
Source: FBI.
FinCEN Statement on Providing Banking Services to Money Services BusinessesRyan Renicker CFA
"FinCEN Statement on Providing Banking Services to Money Services Businesses. The Financial Crimes Enforcement Network (“FinCEN”), as the agency primarily responsible for administering the Bank Secrecy Act, is issuing this Statement to
reiterate expectations regarding banking institutions’ obligations under the Bank Secrecy Act for money services businesses.
Money services businesses (“MSBs”), including money transmitters important to the global flow of remittances, are losing access to banking services, which may in part be a result
of concerns about regulatory scrutiny, the perceived risks presented by money services business accounts, and the costs and burdens associated with maintaining such accounts. "
National CFA Charterholder Compensation Survey 2015Ryan Renicker CFA
Some insights into the value of successfully completing (and retaining) the CFA Charter.
Source: CFA Societies Canada - 11 August 2015
https://www.cfasociety.org/saskatchewan/JobLine1/CFA%20Charterholder%20Compensation%20Survey%20-%20Summary%20-%20FINAL%20v2.pdf
Ryan Renicker argues that the S&P 500 reached its low point for 2009 on March 2nd based on 3 factors: 1) money market funds holdings are at extraordinary high levels compared to equity holdings, 2) there is extreme pessimism in the markets which will likely lead to upside surprises, and 3) economic indicators are beginning to stabilize or rise slightly while markets discount the future. Renicker predicts the financial sector will lead the rally in US equities and recommends being bullish on US stocks, but bearish on Russia, Argentina, Mexico, and gold.
Institutional lnvestor Magazine’s Alpha Hedge Fund Rankings - Top Ranked Ana...Ryan Renicker CFA
"Who is the best catering to hedge funds? To answer that question, Alpha turned to its sister publication, Institutional Investor, which for more than 34 years has surveyed money managers of all types...
Credit Market Imperfection and Sectoral Asymmetry of Chinese Business CycleRyan Renicker CFA
This paper analyzes the role of credit market imperfection and sectoral asymmetry as a
means through which shocks to the real economy are propagated and amplified. Drawing
on firm-level data to calibrate the model, our simulations capture two key stylized facts of
the Chinese economy: that credit constraints are more binding in nontradable sectors than
in tradable industries and that output volatility is much greater in China than in industrial
economies. We find that the driving force behind our simulation results is strongly related
to the on-uniform nature of credit market imperfections in China and their implications
for resource allocation and the way in which the economy reacts to shocks. Correctly
capturing these macro-financial interactions are essential to understand the dynamic behavior of the Chinese economy.
Prepared by Yuanyan Sophia Zhang (IMF)
Stock Pickers Guide, May 2002, CSFB Quantitative & Equity Derivatives Str...Ryan Renicker CFA
The document discusses the benefits of meditation for reducing stress and anxiety. Regular meditation practice can help calm the mind and body by lowering heart rate and blood pressure. Studies have shown that meditating for just 10-20 minutes per day can have significant positive impacts on both mental and physical health over time.
The document discusses the benefits of meditation for reducing stress and anxiety. It notes that meditation can help calm the mind and body by lowering heart rate and easing muscle tension. Regular meditation practice of 10-20 minutes per day is recommended to experience stress-reducing benefits.
Using Volatility Instruments As Extreme Downside Hedges-August 23, 2010Ryan Renicker CFA
“Long volatility” is thought to be an effective hedge against a long equity portfolio, especially during periods of extreme market volatility. This study examines using volatility futures and variance futures as extreme downside hedges, and compares their effectiveness against traditional “long volatility” hedging instruments such as out-of-the-money put options. Our results show that CBOE VIX and variance futures are more effective extreme downside hedges than out-of-the-money put options on the S&P 500 index, especially when reasonable actual and/or estimated costs of rolling contracts have taken into account. In particular, using 1-month rolling as well as 3-month rolling VIX futures presents a cost-effective choice as hedging instruments for extreme downside risk protection as well as for upside preservation.
Hedge Fund Predictability Under the Magnifying Glass:The Economic Value of Fo...Ryan Renicker CFA
This document summarizes a study that examines the predictability of individual hedge fund returns based on macroeconomic variables. The study finds that a large proportion (over 60%) of hedge fund returns can be predicted using factors like default spreads, dividend yields, and market volatility. However, exploiting this predictability out-of-sample is challenging due to estimation risk and model uncertainty. The study finds that a combination strategy that averages predictive signals from multiple factors delivers superior risk-adjusted performance compared to strategies relying on single factors alone. This strategy is also more robust, especially during periods of financial crisis when predictor values deviate significantly from historical averages.
Hedge Fund Predictability Under the Magnifying Glass:The Economic Value of Fo...
Enhanced Call Overwriting - Groundbreaking Study Published in 2005
1. Lehman Brothers does and seeks to do business with companies covered in its research reports. As a result, investors should be aware that the firm may have a conflict of
interest that could affect the objectivity of this report.
Customers of Lehman Brothers in the United States can receive independent, third-party research on the company or companies covered in this report, at no cost to them,
where such research is available. Customers can access this independent research at www.lehmanlive.com or can call 1-800-2LEHMAN to request a copy of this research.
Investors should consider this report as only a single factor in making their investment decision.
PLEASE SEE ANALYST(S) CERTIFICATION AND IMPORTANT DISCLOSURES BEGINNING ON PAGE 12.
Enhanced Call Overwriting
Superior risk-adjusted returns for at-the-money overwriting vs. long only. Systematically
overwriting the S&P 500 with 1-month at-the-money calls, rebalanced on a monthly basis at
expiration, outperformed the S&P 500 Index during our sample period (1996 – 2005). This
“base case” overwriting strategy also generated superior risk-adjusted returns versus the
index.
Risk/return profile changes when overwriting with out-of-the-money calls. Overwriting
portfolios with out-of-the-money calls tends to outperform at-the-money overwriting during
market rallies, but provides less protection during market downturns. However, out-of-the-
money overwriting also results in relatively higher return variability and inferior risk-adjusted
performance.
Short-dated overwriting has outperformed long-dated overwriting. During the sample
period, overwriting the S&P 500 with short-dated options, rebalanced more frequently,
outperformed overwriting with longer-dated options, rebalanced less frequently. We discuss
possible explanations for these performance differences.
“Enhanced” Overwriting. We find that going long the market during periods of heightened
short-term anxiety, inferred from the presence of relatively high S&P 500 1-month at-the-money
implied volatility, has, on average, been a winning strategy. To a slightly lesser extent,
having relatively less exposure to the market during periods of complacency – or relatively
low implied market implied volatility – was also beneficial. We create an “enhanced”
overwriting strategy – whereby investors systematically overwrite the S&P 500 or Nasdaq
100 with disproportionately fewer (more) calls against the indices when risk expectations
are relatively high (low).
Our Enhanced Overwriting Strategy performed the best. Our enhanced overwriting
portfolios handily outperformed the base case overwrite portfolios and the respective
underlying indices, on an absolute and risk-adjusted basis. For example, the average annual
return for the S&P 500 enhanced overwriting portfolio from 1997 – 2005 was 7.9%, versus
6.6% for the base case overwrite portfolio and 5.5% for the S&P 500 Index.
Goes against conventional tendency to overwrite when volatility is rich. Overwriting with
fewer calls when implied volatility is rich, and more calls when implied volatility is cheap,
could improve the absolute and risk-adjusted performance of index-oriented overwriting
portfolios. This goes against the conventional tendency for investors to sell calls against their
positions when implied volatility is high.
November 17, 2005
Ryan Renicker, CFA
1.212.526.9425
ryan.renicker@lehman.com
Devapriya Mallick
1.212.526.5429
dmallik@lehman.com
2. Equity Derivatives Strategy | Enhanced Call Overwriting
November 17, 2005 2
Call Overwriting and the CBOE S&P 500 BuyWrite Index (BXM)
Call overwriting is a trading strategy whereby investors sell call options against their long position in
the underlying. Specifically, an overwriting investor sells a stock’s upside potential beyond the strike
price in exchange for the initial premium received from the short call transaction.
Investors typically overwrite their portfolios when they anticipate range-bound stock prices, wish to
hedge against a short-term market retracement, reduce the total volatility of their portfolios or to
enhance yield. Please see Appendix I: Call Overwriting in a Nutshell for additional details on the
call overwriting strategy.
Overwriting has become increasingly popular among equity investors. According to the Chicago
Board Options Exchange (CBOE), more than $13 billion has been recently allocated by asset
managers to buy-write investment products
1
. This popularity has led the CBOE, in cooperation with
Standard & Poor’s, to develop the CBOE S&P 500 BuyWrite Index (BXM), which measures the total
return of a “covered call” strategy applied to the S&P 500 Index (SPX). Specifically, the BXM consists
of a hypothetical portfolio consisting of a long position in the SPX and a short 1-month at-the-money
SPX call, rebalanced on a monthly basis at expiration. See Appendix II: Description of the BXM
Index for further details. From January 1996 to September 2005, the BXM had an average annual
return of 9.6%, versus 8.6% for the S&P 500 Total Return Index (SPTR). The BXM also had consistently
lower realized volatility than the SPTR.
Figure 1: BXM – SPTR Relative Performance (Quarterly) Figure 2: BXM vs. SPTR Cumulative Performance
-12%
-8%
-4%
0%
4%
8%
12%
M
ar-96
S
ep
-96
M
ar-97
S
ep
-97
M
ar-98
S
ep
-98
M
ar-99
S
ep
-99
M
ar-00
S
ep
-00
M
ar-01
S
ep
-01
M
ar-02
S
ep
-02
M
ar-03
S
ep
-03
M
ar-04
S
ep
-04
M
ar-05
S
ep
-05
BXM-SPTRPerformance
BXM Outperforms
BXM Underperforms
50
100
150
200
250
300
Jan-96
Jan-97
Jan-98
Jan-99
Jan-00
Jan-01
Jan-02
Jan-03
Jan-04
Jan-05
BXM (Scaled)
S&P 500 TR Index (Scaled)
Source: Lehman Brothers, Bloomberg Source: Lehman Brothers, Bloomberg
Figure 3: BXM vs. SPTR Rolling 90-Day Realized Volatility Figure 4: BXM vs. SPTR Daily Return Distribution
0%
5%
10%
15%
20%
25%
30%
35%
40%
Jan-9
6
Jan-9
7
Jan-9
8
Jan-9
9
Jan-0
0
Jan-0
1
Jan-0
2
Jan-0
3
Jan-0
4
Jan-0
5
90-DayRealizedVolatility
BXM
S&P 500 TR Index
-
100
200
300
400
500
600
700
800
900
1,000
-7.50%
-7.00%
-6.50%
-6.00%
-5.50%
-5.00%
-4.50%
-4.00%
-3.50%
-3.00%
-2.50%
-2.00%
-1.50%
-1.00%
-0.50%
0.00%
0.50%
1.00%
1.50%
2.00%
2.50%
3.00%
3.50%
4.00%
4.50%
5.00%
5.50%
Daily Return
Frequency
BXM Index
S&P 500 Total Return Index
Source: Lehman Brothers, Bloomberg Source: Lehman Brothers, Bloomberg
1
Growing Interest in BuyWrite Strategies, CBOE, September 2005.
3. Equity Derivatives Strategy | Enhanced Call Overwriting
November 17, 2005 3
BXM Risk / Reward Characteristics
A comparison of the Sharpe ratios demonstrates that the BXM has had superior risk-adjusted
performance relative to a traditional long-only position in the SPTR from January 1996 to September
2005. Over this time period, the BXM had a Sharpe ratio of 0.55, versus 0.31 for the SPTR. Although
the BXM outperformed the SPTR on an absolute basis, a substantial contribution to the superior risk-
adjusted performance can be attributed to the BXM’s markedly lower volatility. During the study period,
the beta of the monthly total returns of the BXM with respect to the SPTR was about 0.62, and about
77% of the variability in BXM’s returns could be explained by the SPTR (R
2
= 0.77).
However, since the BXM portfolio incorporates a short call position on the underlying index, its relative
performance versus the SPX is largely dependent on the market’s direction.
In directionless or bear markets, overwritten portfolios are more likely to outperform the SPTR, since the
initial cash flow received from the short call position cushions the loss of the long underlying position.
The BXM tends to lag SPTR in bull markets, as the overwritten portfolio’s profit potential is capped on the
upside.
This pattern is even more pronounced if the BXM portfolio returns are calculated strictly between
monthly expiration dates (Figure 5). In this case, the relative performance of the BXM versus the SPTR is
almost entirely dependent upon the market’s performance for the month leading up to expiration.
However, if the overwritten portfolio is rebalanced between expiration dates, the relative performance
of the BXM versus the SPTR becomes dependent upon both the direction of the market (“delta effect”)
as well as the change in the implied volatility for the short call option (“vega effect”) (Figure 6).
Figure 5: BXM vs. SPTR Relative Return Comparison
(Rebalanced at expiration.)
Figure 6: BXM vs. SPTR Relative Return Comparison
(Rebalanced between expirations.)
-12%
-8%
-4%
0%
4%
8%
12%
-20% -16% -12% -8% -4% 0% 4% 8% 12% 16% 20%
S&P 500 Total Return
BXM-S&P500TotalReturnSpread
-12%
-8%
-4%
0%
4%
8%
12%
-20% -16% -12% -8% -4% 0% 4% 8% 12% 16% 20%
S&P 500 Total Return
BXM-S&P500TotalReturnSpread
Source: Lehman Brothers Source: Lehman Brothers
For example, there are instances when the BXM underperforms the SPTR during market downturns
(Figure 6, bottom left quadrant, circles). In these cases, the increase in the value of the written call
option attributed to rising implied volatility (“vega”) overwhelmed the drop in its value due to the
market’s decline. Thus, investors short the calls would incur a loss at rebalance since they would have
to buy back the calls at a higher price than what they had originally sold them for when the trade was
initiated. On these 6 occasions, the SPTR was down an average of 3.7%, and the BXM
underperformed the SPTR about 1.1%, on average. On the other hand, the BXM occasionally
outperforms the SPTR by more than anticipated despite strong market performance (Figure 6, top right
quadrant). In these cases, the initial premium received and the decrease in the value of the call option
sold attributed to declining implied volatility was greater than the opportunity cost incurred when the
market rallied beyond the strike price.
4. Equity Derivatives Strategy | Enhanced Call Overwriting
November 17, 2005 4
Overwriting Scenarios
Does it then follow that overwriting 1-month at-the-money calls is the optimal covered call strategy?
Why not overwrite a position by shorting out-of-the-money calls, or sell longer-dated calls rebalanced
less frequently? In this section, we explore some of these overwriting alternatives and examine their
risk/reward characteristics.
Base Case
We analyze the absolute performance and risk/reward profile of systematically overwriting the SPX
with 1-month at-the-money calls, rebalanced at each sequential monthly option expiration date. The
study incorporates data from February 1996 to September 2005
2
.
The base case overwriting strategy outperformed the SPX in 63% of the 115 months included in our
study and outperformed the SPX by about 0.5% per year (Figure 9). In addition, the overwrite portfolio
tended to outperform (underperform) the market during market declines (rallies).
Figure 7: Base Case Overwrite vs. S&P 500 Index Performance Figure 8: Base Case Relative Performance vs. S&P 500 Index
-
50
100
150
200
250
Feb-96
Feb-97
Feb-98
Feb-99
Feb-00
Feb-01
Feb-02
Feb-03
Feb-04
Feb-05
CumulativePerformance
Overw rite Portfolio (Scaled)
S&P500 (Scaled)
S&P 500 Return
-15%
-10%
-5%
0%
5%
10%
15%
-20%
-15%
-10%
-5%
0%
5%
10%
15%
20%
Overwrite-S&P500Return
Source: Lehman Brothers, OptionMetrics Source: Lehman Brothers, OptionMetrics
In addition, the overwrite portfolio fared better than the market on a risk-adjusted basis. Specifically,
the overwriting strategy yielded a Sharpe ratio of 0.30 versus 0.16 for the SPX. During the study
period, the beta of the monthly total returns of the base case overwrite portfolio with respect to the SPX
was about 0.56, and about 77% of the variability in the overwritten portfolio’s returns could be
explained by SPX returns (R
2
= 0.77).
Figure 9: Base Case vs. S&P 500 Risk / Reward Characteristics
Base Case
Overwrite
SPX
Base Case -
SPX
Average Annual Return 7.5% 7.0% 0.5%
Annualized Excess Return 3.3% 2.8% 0.5%
Standard Deviation 11.1% 17.3% -6.2%
Sharpe Ratio 0.30 0.16
# Months Outperformed 72 43 29
% Months Outperformed 63% 37% 25%
Note: Annualized excess return is relative to 1-month LIBOR.
Source: Lehman Brothers, OptionMetrics
2
For simplicity, we exclude dividends and transaction costs in the return calculations of both the overwrite portfolio and
the S&P 500 Index and assume that all trades are executed at the close on expiration.
5. Equity Derivatives Strategy | Enhanced Call Overwriting
November 17, 2005 5
Altering “Moneyness” of Calls
In this section, we analyze the tradeoffs associated with overwriting the SPX with 2%, 5% and 8% out-
of-the-money calls, rebalanced at each monthly expiration date from January 1996 to September
2005.
Since a call option’s delta decreases as the strike price increases, and the underlying portfolio has a
delta of 1.0, the overwritten portfolio’s net delta approaches 1.0 as deeper out-of-the-money (OTM)
calls are sold against the underlying portfolio. This means that overwriting strategies incorporating out-
of-the-money calls tend to outperform at-the-money overwriting during market rallies, but provide less
protection during market downturns (Figure 10). This also results in higher return variability and lower
risk-adjusted performance (Figure 11).
Figure 10: Average Return During Market Rallies, Downturns Figure 11: Altering “Moneyness”: Sharpe Ratio Comparison
-10%
-8%
-6%
-4%
-2%
0%
2%
4%
6%
8%
10%
AverageMonthlyReturn
Base Case
(ATM )
2%OTM 5%OTM 8%OTM S&P 500 Index
M arket Rallies
M arket Downturns
0 .3 0
0 .2 4 0 .2 4
0 .19
0 .16
-
0.05
0.10
0.15
0.20
0.25
0.30
0.35
Base Case
(ATM )
2%OTM 5%OTM 8%OTM S&P 500 Index
SharpeRatio
Source: Lehman Brothers, OptionMetrics Source: Lehman Brothers, OptionMetrics
During our sample period, systematically overwriting the SPX with 5% OTM calls generated the highest
average annual return across the “moneyness” scenarios (Figure 12). In the environment we have
considered, 5% OTM overwriting allowed investors to participate in monthly market rallies during the
bull markets of 1996 – 2000 and 2003 – 2005, while retaining a slight downside hedge during the
bear market of late 2000 – early 2003. However, the volatility of portfolios overwritten with out-of-the
money calls was relatively high and the risk-adjusted returns of out-of-the-money overwriting became
less attractive as further out-of-the-money calls were sold against the underlying portfolio (Figure 11).
Figure 12: Base Case, OTM Overwriting vs. S&P 500 Risk / Reward Characteristics (1/96 – 9/05)
Base Case
(ATM)
2% OTM 5% OTM 8% OTM
S&P 500
Index
Average Annual Return 7.5% 7.2% 8.0% 7.5% 7.0%
Annualized Excess Return 3.3% 3.0% 3.8% 3.2% 2.8%
Standard Deviation 11.1% 12.6% 15.5% 16.7% 17.3%
Sharpe Ratio 0.30 0.24 0.24 0.19 0.16
# Months Overwrite Outperforms S&P 500 72 77 101 107 NA
% Months Overwrite Outperforms S&P 500 63% 67% 88% 93% NA
Source: Lehman Brothers, OptionMetrics
6. Equity Derivatives Strategy | Enhanced Call Overwriting
November 17, 2005 6
Altering Expiration Dates
We compare the risk/reward attributes of overwriting the SPX with at-the-money calls expiring in 1, 3
and 6 months, rebalanced at expiration every 1, 3 and 6 months, respectively. The short-dated
overwrite portfolios significantly outperformed the 6 month covered call strategy during this time period
(Figure 13). Below, we explore possible explanations for these performance differences.
“Trending Market” Bias. Portfolios overwritten with longer dated options, rebalanced less frequently,
may outperform shorter-dated overwriting strategies if markets are “choppy”. For example, assume
investor A overwrites the SPX with 1-month at-the-money calls, rebalanced once, for a combined two
month holding period. Investor B overwrites the SPX with 2-month at-the-money calls, and closes out this
position when the two-month options expire. If the market has a significant rally between the initial
trade date and 1 month from initiation, A realizes a loss and has to sell new, higher-strike calls for the
second month of the trade. If the market then reverts back to the level where it was trading at the
beginning of the initial trade as of the end of the 2
nd
month, the new calls expire worthless and A
retains the entire premium on the calls sold at the roll date. Thus, investor A’s total net profit equals the
sum of the premiums received on each of the two short call transactions, less the loss incurred due to
the market rally during the first month of the trade. Investor B, however, retains the entire premium
received from selling the 2-month calls, and does not incur the interim loss one month into the trade.
During our sample period, the loss due to rebalancing more frequently did not overwhelm the other
factors that contributed to the outperformance of the shorter-dated overwriting.
“Out-of-the-Money Rebalance” Bias. At each rebalance date, the new “at-the-money” call written
against the SPX is selected by choosing the listed option having the closest strike price above the
closing price of the SPX as of the close of trading on that day; for our base case portfolio, the calls
shorted were, on average, about 0.41% out-of-the-money (Figure 14). Since this option is typically out-
of-the-money at the trade initiation date, the value of the overwritten portfolio partially participates in a
rally of the underlying during the trade’s holding period, unlike a pure “at-the-money” overwrite
position. Thus, if the market has a series of monthly rallies between each roll date, the cumulative
impact of writing slightly out-of-the-money versus at-the-money calls is compounded.
Figure 13: One, Three, Six Month Overwrites vs. SPX Figure 14: % OTM for Each Monthly Rebalance (Base Case)
-
50
100
150
200
250
M
ar-96S
ep
-96M
ar-97S
ep
-97M
ar-98S
ep
-98M
ar-99S
ep
-99M
ar-00S
ep
-00M
ar-01S
ep
-01M
ar-02S
ep
-02M
ar-03S
ep
-03M
ar-04S
ep
-04M
ar-05S
ep
-05
CumulativePerformance
1M onth
3 M ont h
6 M ont h
S&P 500 (1M onth)
-2.0%
-1.5%
-1.0%
-0.5%
0.0%
0.5%
1.0%
1.5%
2.0%
%OTMonWrittenCall
Average % OTM = 0.41%
Source: Lehman Brothers, OptionMetrics Source: Lehman Brothers, OptionMetrics
Rate of Time Decay. As an at-the-money option approaches expiration, the rate of time decay (theta)
tends to increase at an increasing rate, particularly during the last week or two heading into
expiration, other factors held constant. Thus, a relatively large proportion of the total time decay for an
at-the-money option occurs close to its expiration (a 6-month option retains a relatively high proportion
of its original “time value” even one month prior to expiration). Investors who sell options benefit if the
value of the option sold decreases more rapidly with the passage of time. Thus, the expected total
premium from selling six consecutive 1-month at-the-money calls (which have yet to undergo rapid time
decay) can be higher than that expected from selling one 6-month at-the-money call. This could have
contributed to the higher return for the short-dated call overwriting strategy versus overwriting with
longer-dated options.
7. Equity Derivatives Strategy | Enhanced Call Overwriting
November 17, 2005 7
Enhanced Overwriting
Since covered call strategies have a tendency to underperform traditional long-only strategies during
market rallies and outperform during market downturns, and since a relatively high proportion of
overwriting returns can be explained by movements in the underlying portfolio overwritten, overwriting
strategies that are dynamically rebalanced ahead of relatively large market rallies or downturns can
naturally enhance the returns generated. Generally speaking, a stock’s near-term implied volatility tends
to rise during market retracements and decline as the market rallies. This suggests option market
participants alter their short-term forecast of a stock’s future return uncertainty (risk) in response to recent
observations in the underlying stock’s movement.
During our sample period
3
(1/97 to 9/05), the SPX was up in 55 months, and declined in 49
months. In the month following up months, the market declined 53% of the time. In the month following
down months, the market rallied in 59% of the months. Since risk expectations (measured by at-the-
money implied volatility) generally rose following these market downturns, the market had a tendency
to rally after spikes in implied volatility. In other words, it is likely that investors were already pricing in
their worst fears for the market after the market had declined, and tended to be rewarded for going
long the market when market fear was excessive. To a lesser extent, investors generally experienced
lower returns investing in the market when risk expectations were relatively low (complacency).
To illustrate this, we calculate the number of standard deviations (z score) 1-month at-the-money implied
volatility stood above or below the average 1-month at-the-money implied volatility for each index
during the year prior to each monthly rebalance date. Next, we calculate the return for each respective
index for each following month. As Figure 15 demonstrates, the SPX tended to rally during the month
following rebalance dates in which the market had relatively high implied volatility levels and, to a
lesser extent, decline the month following rebalance dates in which the market had relatively low
implied volatility levels. Specifically, when the z score was greater than 1 at the beginning of the
monthly rebalance, the SPX was up 80% of the time during the next month; when the z score was less
than -1, the SPX declined 61% of the time during the following month. Although less pronounced, this
pattern was also evident for the NDX, which was up 58% of the time during the month following
periods when the z score was greater than 1. When the z score was less than -1, the NDX declined
56% of the time during the subsequent month (Figure 16).
Based on these results, we conclude going long during periods of complacency has, on average, not
been a winning strategy during this time period. This phenomenon also tended to occur for the
Nasdaq 100 Index (NDX), although to a lesser extent.
Figure 15: Implied Vol. Z-Score vs. Next Month SPX Returns Figure 16: Implied Vol. Z-Score vs. Next Month NDX Returns
-20%
-15%
-10%
-5%
0%
5%
10%
15%
20%
-5 -4 -3 -2 -1 0 1 2 3 4 5
Implied Vol. Z-Score
S&P500NextMonthReturn
Low Risk Expectations High Risk Expectations
-30%
-20%
-10%
0%
10%
20%
30%
-5 -4 -3 -2 -1 0 1 2 3 4 5
Implied Vol. Z-Score
Nasdaq100NextMonthReturn
Low Risk Expectations High Risk Expectations
Source: Lehman Brothers, OptionMetrics Source: Lehman Brothers, OptionMetrics
8. Equity Derivatives Strategy | Enhanced Call Overwriting
November 17, 2005 8
Performance of Enhanced Overwriting for the S&P 500 and Nasdaq 100
Since the underlying market tended to rally following periods of heightened risk aversion and decline
following periods of low implied volatility, we test whether writing disproportionately fewer (more)
calls against the indices when risk expectations were high (low) would have generated superior
absolute and risk-adjusted returns versus the base case overwriting portfolio
3
. We find that this
“enhanced overwriting strategy” handily outperformed the base case and the underlying indices, on an
absolute and risk-adjusted basis (Figure 17, Figure 18, Figure 19).
Figure 17: SPX Enhanced, Base Case Overwrite Portfolios vs. SPX Figure 18: NDX Enhanced, Base Case Overwrite Portfolios vs. NDX
-
50
100
150
200
250
Jan-9
7
Jul-97
Jan-9
8
Jul-98
Jan-9
9
Jul-99
Jan-0
0
Jul-00
Jan-0
1
Jul-01
Jan-0
2
Jul-02
Jan-0
3
Jul-03
Jan-0
4
Jul-04
Jan-0
5
Jul-05
CumulativePerformance
Dynamic Overw rite (Scaled)
S&P 500 (Scaled)
Base Case Overw rite (Scaled)
100
150
200
250
300
350
400
450
500
Jan-9
7
Jul-97
Jan-9
8
Jul-98
Jan-9
9
Jul-99
Jan-0
0
Jul-00
Jan-0
1
Jul-01
Jan-0
2
Jul-02
Jan-0
3
Jul-03
Jan-0
4
Jul-04
Jan-0
5
Jul-05
CumulativePerformance
Dynamic Overw rite
NDX
NDX Base Case Overw rite
Tech "Bubble"
Source: Lehman Brothers, OptionMetrics Source: Lehman Brothers, OptionMetrics
In addition, the SPX enhanced overwriting strategy outperformed the base case SPX overwriting
strategy 36% of the time, performed in line 46% of the time and underperformed the base case only
18% of the time. The NDX enhanced overwriting strategy outperformed the base case NDX strategy
38% of the time, performed in line 37% of the time and underperformed the base case only 25% of the
time. These results imply that the conventional tendency for investors to sell calls against indices having
rich implied volatilities – in order to maximize the premium received – might not have been the optimal
strategy during the past 9 years, since the indices tended to rally following periods of heightened
implied volatility. Rather, it would have led to higher opportunity costs since overwriting investors – by
definition – would have sold away at least some of the underlying portfolio’s upside potential.
Figure 19: SPX, NDX Enhanced, Base Case Overwrite, Underlying Index Risk / Reward Comparison
SPX
Enhanced
Overwrite
SPX Base
Case
Overwrite
SPX
NDX
Enhanced
Overwrite
NDX Base
Case
Overwrite
NDX
Average Annual Return 7.9% 6.6% 5.5% 9.8% 8.8% 7.1%
Annualized Excess Return 3.8% 2.5% 1.5% 5.7% 4.7% 3.0%
Standard Deviation 11.7% 11.5% 18.0% 19.8% 19.4% 32.5%
Sharpe Ratio 0.33 0.22 0.08 0.29 0.24 0.09
# Months Outperformed Index 67 67 NA 65 65 NA
Source: Lehman Brothers, OptionMetrics
3
In our enhanced overwrite portfolios, we write 0.75 calls against each respective underlying index at each rebalance
date if the 1-month at-the-money implied volatility of the index at this rebalance date is more than 1 standard deviation
above the average of where the 1-month implied volatility has traded on a daily basis during the prior year (z-score of
implied volatility > 1.0). We write 1.25 calls against the index at each rebalance date if the 1-month at-the-money
implied volatility of the index at this date is more than 1 standard deviation below the average of where the 1-month
implied volatility has traded on a daily basis during the prior year (z-score < -1.0). We write 1.0 calls against the index if
the 1-month implied volatility is within + or – 1 standard deviation of where it has traded during the 1 year prior to the
rebalance date. Since z-score calculations require 1 year of historical vol data, and our volatility database includes data
from 1996 – present, our sample period for the enhanced overwriting strategies begins January 1997.
9. Equity Derivatives Strategy | Enhanced Call Overwriting
November 17, 2005 9
Appendix I: Call Overwriting, in a Nutshell
A call overwriting strategy combines a short call position with an existing long position in the
underlying stock. The strike price chosen for the written call corresponds with the desired level of
market participation that the investor wishes to obtain. For example, investors believing that an
underlying security is likely to trade flat, with a low probability of a rally, might choose to write at-the-
money calls. On the other hand, if investors believe a 10% rally in the underlying is possible, they
might choose to sell 10% out-of-the-money calls. This reduces the yield enhancement benefits of the
overwriting strategy, but allows for greater participation in an upward move in the underlying. Of
course, the premium received from writing the out-of-the-money calls will be less than what would have
been obtained from an at-the-money sale, other factors held constant.
Formally, the annualized maximum upside gain (market participation cap) for a written call at
expiration is equal to
1
1
−
+ t
S
CK
Where K denotes the strike price, C is the call premium collected, S is the stock price as of the trade
initiation date and t is the time to option expiration in years.
For example, consider an investor who purchases 100 shares of ABC at $50 per share and writes a
3-month call with a $55 strike. Further assume that the premium received (per share) equals $5. At
expiration, the investor participates in the underlying up to the strike price. He / she is also entitled to
any dividends, provided that the stock is not called away prior to expiration. In this example, the
investor receives up to $10 (20% return) during the life of the option: $5 from the stock’s appreciation
up to the strike ($55 - $50) plus $5 from the premium received. At expiration, the covered call position
would lose money if the stock price closes below $45 on expiry ($50 initial stock price - $5 premium
received), although the total loss would be less than a pure long-only position in ABC. In addition, the
overwriting strategy would underperform a long-only position in ABC if the stock rallies above $55 as
of expiration (opportunity cost versus a long-only strategy above $55) (Figure 20 and Figure 21)
Figure 20: Overwrite vs. Long-Only Payoff Diagram Example Figure 21: Payoff Details (Breakeven & Max Upside Highlighted)
$(40)
$(30)
$(20)
$(10)
$-
$10
$20
$30
$40
$20
$25
$30
$35
$40
$45
$50
$55
$60
$65
$70
$75
$80
$85
Stock Price at Expiration
PayoffatExpiration
Stock P&L
Overwrite P&L
Stock Price Premium Strike Stock P&L
Overwrite
P&L
Stock
Return
Overwrite
Return
$20 $5 $55 -$30 -$25 -60% -50%
$25 $5 $55 -$25 -$20 -50% -40%
$30 $5 $55 -$20 -$15 -40% -30%
$35 $5 $55 -$15 -$10 -30% -20%
$40 $5 $55 -$10 -$5 -20% -10%
$45 $5 $55 -$5 $0 -10% 0%
$50 $5 $55 $0 $5 0% 10%
$55 $5 $55 $5 $10 10% 20%
$60 $5 $55 $10 $10 20% 20%
$65 $5 $55 $15 $10 30% 20%
$70 $5 $55 $20 $10 40% 20%
$75 $5 $55 $25 $10 50% 20%
$80 $5 $55 $30 $10 60% 20%
$85 $5 $55 $35 $10 70% 20%
Source: Lehman Brothers Source: Lehman Brothers
10. Equity Derivatives Strategy | Enhanced Call Overwriting
November 17, 2005 10
Motivations for Call Overwriting
Yield Enhancement
If the stock/portfolio is expected to be range-bound, the premium received will function as yield
enhancement.
Express Price Target
If an investor believes the stock/portfolio is unlikely to trade beyond a price target over a specified
period of time, they can write calls against their underlying position with a strike price equal to the
target price. This way, the investor receives incremental premium, while enforcing discipline with
respect to the specific target selling price.
Partial Downside Hedge
Since investors receive the call premium when the overwrite is initiated, a downward move in the
underlying between the trade initiation date and expiration will be partially offset by the amount of the
premium received via the call sale.
Reduce Volatility
By writing calls against the long stock position, investors are effectively reducing the downside and
upside variability relative to a long-only position.
11. Equity Derivatives Strategy | Enhanced Call Overwriting
November 17, 2005 11
Appendix II: Description of the BXM Index
Summary Information
Announced by the Chicago Board Options Exchange (CBOE) in April 2002
Time series history: June 1988 – present.
Initial value: 100
Rebalanced: monthly
Priced: daily
Index Description
Position: long S&P 500 Index portfolio, short near-term S&P 500 call.
Short call position held to expiration, generally the 3
rd
Friday of each month.
Call option is settled against the Special Opening Quotation (SOQ) of the S&P 500 Index.
SOQ: special calculation of the S&P 500 Index derived by using the opening prices of each
constituent in the S&P 500 Index.
SOQ determined before 11 AM EST, after all S&P 500 constituents have opened for trading.
Final settlement price of the call at maturity is the greater of 0 and (SOQ – strike price).
Dividends paid on the underlying S&P 500 Index + dollar value of option premium received
functionally re-invested in the covered S&P 500 Index portfolio.
Subsequent to settlement of expiring call option, a new at-the-money call expiring in the next
month is written.
Strike price of new call is the S&P 500 Index call listed on the CBOE having the closest strike
above the last value of the S&P 500 Index reported before 11 AM EST on expiration.
New call option assumed sold at VWAP of its prices during the first ½ hour period beginning
at 11:30 AM EST on expiration.
BXM Index Level: BXMt
= BXMt-1
(1+Rt
) where Rt
= daily rate of return for covered portfolio.
Gross Daily Return (excluding roll dates): 1 + Rt
= (St
+ Divt
– Ct
) / (St-1
– Ct
-1) where St
=
closing value of S&P 500 Index at t, Divt
= ordinary cash dividends payable on component
stocks underlying S&P 500 Index that trade “ex-dividend” at date t expressed in S&P 500
Index points, and Ct
= arithmetic average of last bid and ask prices of the call option reported
before 4:00 PM EST on preceding trading day (t-1).
Source: Description of the CBOE S&P 500 BuyWrite Index (BXM), October 12, 2004.
www.cboe.com/bxm