The document presents a final report on the design of a serial hybrid propulsion system for the 'Tara', a diesel-powered boat owned by Tidelines Institute, aimed at reducing fossil fuel dependency while transporting students between their campuses in southeast Alaska. The propulsion system utilizes a combination of a diesel generator, lithium battery, and electric motor, with detailed deliverables including CAD models, lifecycle assessments, and operational analysis. This innovative solution is intended to leverage local hydro power resources and promote environmental sustainability in marine transport.

![List of Figures
1 Block Diagram for Propulsion System . . . . . . . . . . . . . . . . . . . . . . . . . . . 3
2 Interpolated power curve for Tara showing required continuous shaft power to maintain
corresponding speed . . . . . . . . . . . . . . . . . . . . . . . . . . . . . . . . . . . . . 11
3 Sample of parametric analysis outputs showing a) trip fuel use as a function of throttle
power over a predefined 50 mile trip, b) trip fuel use as a function of throttle power
using all available fuel and charge aboard, c) range as a function of throttle power over
a predefined 50 mile trip, d) range as a function of throttle power all available fuel and
charge aboard, e) range as a function of generator output power over a predefined 50
mile trip, f) range as a function of generator output power all available fuel and charge
aboard . . . . . . . . . . . . . . . . . . . . . . . . . . . . . . . . . . . . . . . . . . . . 12
4 CAD Model of exterior of boat . . . . . . . . . . . . . . . . . . . . . . . . . . . . . . . 17
5 Interior view of CAD model with each component labeled . . . . . . . . . . . . . . . . . 17
6 Calculation of waterline . . . . . . . . . . . . . . . . . . . . . . . . . . . . . . . . . . . 18
7 Buoyancy test: State where fuel tank is empty . . . . . . . . . . . . . . . . . . . . . . . 19
8 Buoyancy test: State where fuel tank is full . . . . . . . . . . . . . . . . . . . . . . . . 19
9 FEA Static test - Stress results . . . . . . . . . . . . . . . . . . . . . . . . . . . . . . . 20
10 FEA Static Test - Stress results for individual component loading . . . . . . . . . . . . . 20
11 Factor of Safety Results from FEA analysis . . . . . . . . . . . . . . . . . . . . . . . . . 21
12 Impacts by SBOM inputs: Carbon footprint [CO2 eq. kg/func unit] . . . . . . . . . . . 22
13 Impacts by life cycle stage: Carbon footprint [CO2 eq. kg/func unit] . . . . . . . . . . . 23
14 Impacts by life cycle stage: Total [mPts/func unit] . . . . . . . . . . . . . . . . . . . . 23
15 Tara’s home port on the Inian Islands and her primary ports of call in Gustavus and Elfin
Cove. The red arrow shows her expected trip. . . . . . . . . . . . . . . . . . . . . . . .
16 FEA Study - Displacement of loading on hull . . . . . . . . . . . . . . . . . . . . . . .
17 FEA Study - Strain of loading on hull . . . . . . . . . . . . . . . . . . . . . . . . . . .
18 FEA Study - Displacement of individualized components . . . . . . . . . . . . . . . . .
19 FEA Study - Strain of individualized components . . . . . . . . . . . . . . . . . . . . .
List of Tables
1 Breakdown of Guiding Specifications . . . . . . . . . . . . . . . . . . . . . . . . . . . . 2
2 Components for Diesel Electric Series Hybrid Refit . . . . . . . . . . . . . . . . . . . . . 3
3 Parameters for buoyancy testing in SolidWorks . . . . . . . . . . . . . . . . . . . . . . . 6
4 Loading forces on the hull . . . . . . . . . . . . . . . . . . . . . . . . . . . . . . . . . . 6
5 Material content of typical marine diesel engine . . . . . . . . . . . . . . . . . . . . . . 8
6 Material content of a Lithium Iron Phosphate battery . . . . . . . . . . . . . . . . . . . 8
7 Material content of typical electric motor . . . . . . . . . . . . . . . . . . . . . . . . . 9
8 Material content of a typical diesel gen-set . . . . . . . . . . . . . . . . . . . . . . . . . 9
9 Bill of materials including three main propulsion components and ancillary components . 15
10 Quoted prices for each of the three main systems . . . . . . . . . . . . . . . . . . . . . 16
11 Overall Results from both design studies for testing buoyancy . . . . . . . . . . . . . . . 19
12 Current specifications of Tara . . . . . . . . . . . . . . . . . . . . . . . . . . . . . . . .
13 Average operating conditions . . . . . . . . . . . . . . . . . . . . . . . . . . . . . . . .
14 Most severe operating conditions . . . . . . . . . . . . . . . . . . . . . . . . . . . . . .
15 Comparison of available diesel genset specifications . . . . . . . . . . . . . . . . . . . .
iv](https://image.slidesharecdn.com/engs90finalreportteamtara-230418191458-286fa866/85/ENGS_90_Final_Report_TeamTara-pdf-4-320.jpg)
![1 Introduction
1.1 Background & Significance
Tidelines Institute is an environmental and educational organization co-founded by Zachary Brown and
Laura Marcus in early 2021. Tidelines has two campuses: the Good River Campus, located in Gustavus,
AK, 50 miles northwest of Juneau, AK, and the Inian Islands Campus, also known as ”The Hobbit
Hole,” located about 25 nautical miles southwest of Gustavus. Tidelines has purchased Tara, a diesel-
powered 29-foot Rawson boat built in 1967, that had been used around the Icy Strait region as a halibut
fishing vessel for decades. The boat was acquired to help Tidelines transport students between their
two campuses.
Currently, Tidelines Institute charters other boats and planes in the area to transport students
between their two campuses. They spend an estimated $5000 per year on fuel running their gasoline
boat, the Magister, in addition to chartering costs. Not only does Tidelines have a financial interest
in this project, but they also hope to move towards full independence from fossil fuels. Most of their
remaining fossil fuel use is from transportation between their two campuses, so the retrofit of Tara would
make Tidelines take a significant step towards energy independence.
Due to the central role of the ocean in the local geography, boats that use antiquated and inefficient
diesel or gasoline propulsion systems prevail in this part of Southeastern Alaska, both as means of
transportation and for commercial fishing. Juneau has the most active port in the state, issuing 2028
launch ramp permits in 2019 as well as having 213 active fishing boats ported there [4]. Tidelines
Institute is concerned with environmental threats related to boat emissions and sees an opportunity to
reduce their own environmental footprint while also inspiring the local population to adopt a similar
change. Tidelines hopes to use this project as a proof of concept of marine electrification for the entire
region of Southeast Alaska. There is an opportunity to drastically reduce the total emissions produced
by boats, and the people at Tidelines hope that Tara can serve as an example to convince the local
population that there are viable alternatives to fossil fuel powered boats. This is why the choice of
using Tara for this project is especially significant. She has been used for halibut fishing in the region
for decades and is a familiar sight. Locals who may be uncertain about the reliability of an electric or
hybrid engine will recognize Tara as one of their own. Therefore, proving that Tara can become a hybrid
electric vessel would have far more impact than if we built a state-of-the-art boat from the ground up.
1.2 Problem Statement
In pursuit of these goals, Tidelines wants us to design a more environmentally friendly propulsion system
for Tara that allows them to reduce their dependence on fossil fuels and simultaneously facilitate the
ease of transportation between their two campuses. Because we do not have access to the boat itself,
this project is an exercise in design feasibility. Our aim is to provide Tidelines with enough information
and specifications to demonstrate that, if they choose to move forward with the project, that we have
produced a viable design for the retrofit of Tara. We will provide them with a bill of materials, a
3D model of Tara post-retrofit, a Life Cycle Assessment evaluating the performance of the existing
system against that of the proposed design over its entire life cycle, and supporting documents for the
installation of the main components.
1](https://image.slidesharecdn.com/engs90finalreportteamtara-230418191458-286fa866/85/ENGS_90_Final_Report_TeamTara-pdf-5-320.jpg)


![2 Methods & Methodology
2.1 Data Collection
2.1.1 Photogrammetric Analysis
To better understand Tara’s hull shape, a photogrammetric analysis was conducted. Several hundred
photographs of her exterior were sourced from Zach, capturing at least three quarters of the hull in each
and wrapping around the entire vessel above and below the waterline. These photographs were then
imported into Metashape and aligned automatically in three dimensions. A point cloud was generated by
the software and scaled manually with the length, stem to stern, set to 29 feet. A mesh was generated
from this point cloud and exported as an .stl file. Further processing of the mesh was conducted in
MeshLab, such as resampling the mesh to smooth irregularities. Because of the high density of the
mesh and the fact that some irregularities remained post processing, the photogrammetric mesh was
not used directly in the CAD model or in buoyancy and loading simulations. Instead, it was used as a
reference model to ensure that the dimensions of the CAD model accurately represented those of the
actual vessel.
2.1.2 Internal Measurements
Internal measurements and layouts were also gathered for Tara to aid in the placement of the components
in her hull. A series of hand sketches and a spreadsheet tabulating marked dimensions, both included in
Appendix ??, were sent to Tidelines, and Tanner, a member of the staff, measured and recorded each
of the marked dimensions in the spreadsheet, noting qualitative details and corrections where needed.
This dataset was used to propose an interior layout that would minimize the relocation of bulkheads
and the inclusion of additional structural supports, thereby minimizing labor costs.
2.2 Operational Model & Parametric Analysis Development
Measuring Tara’s expected performance in the water was critical for determining the proper size of
components. Since Tara has been out of the water for years and lacks any substantial operational
data logs, these specifications had to be developed using models. A fully parameterized operational
model was constructed in MATLAB. This model performs a number of analyses on different aspects of
Tara’s operation: examining apparent speeds and effective trip durations, interpolating a power curve
to determine power and energy specifications, and conducting an electrical load analysis.
Matrices containing Tara’s apparent speed over bottom were calculated across a predetermined
range of actual speeds over water and velocities of tidal currents using the Law of Cosines and an
angle of incidence between Tara’s direction of travel and the direction of current. Four matrices were
calculated, one for each condition: Tara heading eastbound with a rising tide, Tara heading eastbound
into a receding tide, Tara heading westbound into a rising tide, and Tara heading westbound with a
receding tide. Because the angle between Tara’s heading and the primary direction of current flow
differs for eastbound and westbound travel, two angles of incidence were used: one each for eastbound
and westbound. Matrices containing trip durations were calculated by dividing a predetermined trip
length, in this case 50 NM, by each apparent speed.
Lacking a sufficient drag curve from literature, Tara’s power requirements remained a broad estimate
for many weeks. Fortunately, our team was provided with datasets from two larger but similarly shaped
vessels, Woodstock and I Gotta, that included measurements of shaft power at a range of speeds [8,
9]. These power curves (power vs speed) were reduced to dimensionless drag curves (drag coefficient
vs Froude number) via the calculations shown below. A wetted area ratio calculated as the square of
4](https://image.slidesharecdn.com/engs90finalreportteamtara-230418191458-286fa866/85/ENGS_90_Final_Report_TeamTara-pdf-8-320.jpg)
![the waterline length ratio was used to scale the drag values to a boat of Tara’s size [21]. This method
assumes that the measured hull has the same shape as Tara (i.e., that they are scale models of each
other). This dimensionless drag curve was then interpolated at known Froude number values from Tara
and multiplied back into a power curve. Tara’s maximum (rated) power specification was determined
using a conventional method of applying a sea margin to the power required to reach hull speed, and
the energy requirement for a trip was calculated by multiplying the power required at six knots by the
duration of the trip at six knots.
An electrical load analysis was also conducted using the forward Euler method to construct a time
series of battery loads. The battery discharge rate was calculated as the efficiency-adjusted throttle
power, and the battery charge rate was calculated as the efficiency-adjusted generator output power.
Two versions of the Euler loop were developed – one using a for loop that would run for the duration
of the trip, and one using a while loop that would run until the fuel tank and batteries were empty.
For each of these, a timestep of 1.5 minutes was used, and at each timestep, the battery level was
calculated. Within the Euler loop, a control algorithm applying a simple hysteresis method toggled the
generator on or off at the bottom or top of a battery level deadband and kept it on or off within the
deadband. From this time series, outputs including generator runtime, range, fuel use, and fuel cost
were calculated and reported.
Manually changing parameter values to understand the behavior of a single component proved too
arduous to be practical, so a parametric analysis script was developed. This secondary script defines a
range of test values and single default values for each parameter. The user manually selects a particular
parameter to iterate over, and the script calls the operational model for each value of the user-selected
parameter, using default values for all other parameters. Outputs are then tabulated and graphed.
2.3 CAD Modeling
In an effort to visually illustrate the retrofit of Tara, we designed a CAD model. The dimensions of the
CAD model are based on the dimensions of Tara in its current state, obtained as described in sections
2.1.1 and 2.1.2. With this data, we produced a number of iterations of CAD models to ensure the most
accurate design.
In developing a CAD model of Tara, our goals were threefold: to visualize the retrofit, to prove the
buoyancy of the boat, and to test to the stability of the hull with the new components. To produce a
CAD model, we primarily used the software SolidWorks, as it would also allow us to be able to conduct
studies, such as buoyancy testing and Finite Element Analysis (FEA). To be able to conduct such studies,
we required information on materials of both the hull and each of the components. The hull is known to
be made of fiberglass. Since there is no complete information for fiberglass material in SolidWorks, we
outsourced that information from a technical forum [3]. Material and dimension information for each
component was obtained from each of the three quotes contained in Appendix A.4.To better illustrate
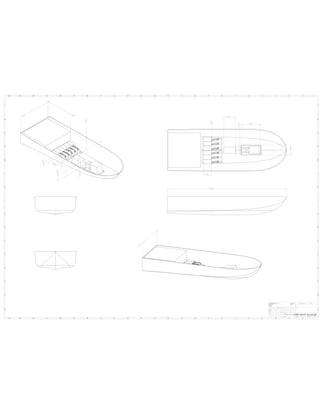
the different views and dimensions of the CAD model, we also developed 2D drawings of the design.
See Supplementary Materials A.2 for drawings.
2.4 Design Verification
Once each of the new components were selected and the CAD model of Tara produced, we then needed
to verify that implementing a hybrid-electric propulsion system in Tara is technically feasible. To do
this, we ran two tests. The first test determined if the boat will be buoyant and float even with the
additional loading. The second test looked at the distribution of load across Tara and checked if there
was an imbalance in load on one side, causing stability issues.
5](https://image.slidesharecdn.com/engs90finalreportteamtara-230418191458-286fa866/85/ENGS_90_Final_Report_TeamTara-pdf-9-320.jpg)
![For the first test, we first approached it analytically. We began by solving for the buoyant force
acting on the boat. This was done by considering that the buoyant force will be equal to the weight
that the boat displaces while in the water. Since the weight of the hull is a known parameter, we found
that the buoyant force acting on the boat is equal to approximately 1600 lb. Moreover, according to
Archimedes Principle, the volume of the boat underwater will equal the volume of the water displaced
[20, 13]. We used this principle to solve for the volume of water displaced, which can be considered as
the water line on the boat. To solve for the waterline of the boat, we did so by taking into account the
following parameters:
Parameter Value
Weight of the hull 1600 lbs
Volume of the hull 36.953m3
Specific gravity of salt water 1020kg/m3
Loading on the boat 4256 lbs
Table 3: Parameters for buoyancy testing in SolidWorks
Analytically, we solved for the buoyancy of the boat without considering any loading on the boat.
We did this to verify our computational method, which was to run a design study in SolidWorks. For
the design study, we needed to account for total loading on the boat, weight of the hull, and volume of
the hull. Considering loading on the hull, we mainly focused on the following factors:
Loading Factors Weight (lbs) Dimensions (in3)
Genset 1922 10,388.35
Motor 650 12,679.975
Batteries 6 batteries + 3 controllers: 984 Battery: 3,463.2
Fuel tank (full) 700 352,512
Table 4: Loading forces on the hull
For this test, we mainly focused on seeing how an empty fuel tank would affect the stability of the
boat versus if it was a full fuel tank. To do so, we ran the design study twice. For these studies, we
ran a cutting line across the length of the boat. For every 0.025 in. step size, it would cut the volume
of the boat by that much. We set the cutting line to cut the volume of the boat by 0.025 in. until the
mass of the hull equaled the actual total mass of the boat. The aim of this study is to figure out how
far down is the waterline from the top of the boat, as we wanted to test how much the waterline would
change if the fuel tank were empty or full. Thus, for the first test, we set the mass constraint to be the
total mass without including the load of the fuel (700 lb.). Once it reaches this point, then we have
identified the waterline and consequently the center of buoyancy as well. We then run this study again
while changing the mass constraint to include the 700 lb. of fuel.
To perform the structural loading analysis, we conducted a finite element analysis (FEA) to determine
how the distribution of loading affects the stability of the boat. For this, we identified the forces acting
on the boat. Knowing the waterline from the buoyancy tests, we set fixed structures along the part of
the hull that will be underwater. From there, we included forces such as from total loading and gravity.
We then ran this static study to solve for the displacement, strain, and stress distribution. These results
will allow us to visually determine if there are any instability issues.
To identify which tests and simulations to conduct to verify our design, we consulted with experts
such as Professor Vicki May and Machine Shop technical instructors Scott Ramsay and Joseph Poissant.
After consulting with them, we identified our approach for determining that the retrofitted Tara will
6](https://image.slidesharecdn.com/engs90finalreportteamtara-230418191458-286fa866/85/ENGS_90_Final_Report_TeamTara-pdf-10-320.jpg)
![be stable and float. Each step of our testing and simulations was verified and looked over by Joseph
Poissant.
2.5 Life Cycle Assessment
Life Cycle Assessment (LCA) is a technique for assessing the possible environmental impacts associated
with a product’s lifecycle by compiling an inventory of relevant inputs and outputs of a product system.
LCA results are then interpreted according to the goal and scope of the project to investigate the
sustainability of the system. LCA examines the environmental impacts throughout a product’s life (i.e.,
cradle-to-grave) which includes raw materials extraction, manufacturing, use of product, and end of life
treatment. For the LCA that was conducted on Tara’s propulsion systems, we collected the data for
the different parts’ bills of materials through literature values, estimations, and similar products. Actual
values were not possible to obtain due to either the termination of manufacturing of the product (such
was the case with the old Tara engine) or due to the unavailability of model-specific data online. It is
important to note that LCA is a process that is driven by assumptions. Despite its existence as a tool
that influences and verifies the decision-making process, it is not meant to be an absolute driving factor
of the process.
Conducting an LCA includes several steps: System Definition, Modeling, and Optimization. During
the first step, the goal and the scope of the system are defined. The goal of our LCA is to assess
the environmental impacts for a diesel propulsion system and to compare it to its hybrid diesel-electric
counterpart. Our two systems focus on three stages: Manufacturing, Usage, and End-of-Life. Raw
materials info was included during the manufacturing stage; the materials libraries include the extraction
and transportation data of raw materials in the entries automatically. There is no need for the user’s
manual input. Maintenance was out of scope for this project as we did not have enough information
about the maintenance of the old system. Transportation was treated similarly because the old system
is already installed in Tara. Therefore, we primarily focused on the usage stage of the product because
that was the stage that we wanted to optimize and we had the largest influence on. We wanted to
look at how our system’s fuel consumption compares to the old one and the effect of the electric power
source on the system’s environmental impact.
For Tara’s powertrains, we decided that a comparison of the life cycles of the old system and the
new hybrid one will show us how sustainable our solution is and any modifications that might better
our LCA results. The old system consists of the Sabb 2JHVP Marine Diesel Engine. The new hybrid
system consists of the Elco-70 motor, six Lithionics GT102V75A batteries, and the Bollard MG42 diesel
genset. The LCA was conducted on a web based tool called Sustainable Minds which uses single scores
to evaluate the environmental performance of a product. According to Sustainable Minds’ website, the
results of each product concept represent the contribution to one person’s share of the environmental
impacts of the entire United States in one year. As a summary of the set of the 10 environmental impact
categories, millipoints represent a total impact score in one number.
For Tara’s old Sabb diesel engine, the motor’s life span was assumed to be around 30 years. The
yearly fuel consumption was estimated to be around 192 gallons per year. The BOM for the motor
production was compiled according to “An Effective Framework for Life Cycle and Cost Assessment for
Marine Vessels Aiming to Select Optimal Propulsion Systems” which lists several motors and the weight
ratios of the constituent materials. This data was taken and then scaled to the weight of our motor.
Only raw materials were added and no materials processing was included due to the negligibility of the
estimated impact and the unavailability of data. Steel and cast iron were the primary materials, with
around 40 and 46 percent of the motor’s weight ratio respectively [6]. The rest of the BOM is included
in table 5 .
Similarly, data for lithium iron phosphate batteries was taken from “Update of Bill-of-Materials and
7](https://image.slidesharecdn.com/engs90finalreportteamtara-230418191458-286fa866/85/ENGS_90_Final_Report_TeamTara-pdf-11-320.jpg)
![Engine Material Weight Ratio Weight (in kg)
Steel 40 152
Cast iron 46 174.8
Aluminum 8 30.4
Copper 0.1 0.38
Zinc 0.1 0.38
Lead 0.1 0.38
Plastic 0.9 3.42
Rubber 0.9 3.42
Paints 0.9 3.42
Oils and Grease 3.0 11.4
Total 100 380
Table 5: Material content of typical marine diesel engine
Cathode chemistry addition for Lithium-ion Batteries in the GREET® Model”. The list of materials was
simplified because Sustainable Minds’ library of materials is very outdated and not nearly comprehensive;
it did not include most of the materials necessary for the batteries. Some of the table entries that were
in the article were also too vague for us to infer the constituent materials, for instance, electronic parts.
The final table is included below. The active material (lithium iron phosphate in our case), copper,
and aluminum were the main contributors to the weight of the batteries with 14.92, 29.65, and 25.81
percent respectively [22]. The rest of the BOM is in table 6. We are using six batteries in our solution;
therefore, these values were scaled in the LCA model according to that number. The lifespan of the
batteries was estimated to be around 15 years.
Battery Material Weight Ratio Weight (in kg)
Lithium Iron Phosphate 14.92 11.34
Carbon 7.96 6.05
Copper (and ½ of electronics) 29.65 22.53
Aluminum (and ½ of electronics) 25.81 19.62
LiPF6 1.75 1.33
Polypropylene 13.14 9.99
Steel 2.59 1.97
Thermal Insulation 0.66 0.50
Coolant: Glycol 3.52 2.67
Total 100 76kg
Table 6: Material content of a Lithium Iron Phosphate battery
The data for the electric motor was taken from “Lifecycle Analysis of Different Motors from the
Standpoint of Environmental Impact”. The life span of the motor was estimated to be 50 years. This
estimation was based on similar products. Also, inboard motors have one moving part. Therefore, they
are more likely to last for longer. Steel (electric and other) and aluminum were the primary materials
contributing to the weight of the motor, with around 60.19 and 17.2 percent of the motor’s weight ratio
respectively [19]. The rest of the BOM is included in table 7.
8](https://image.slidesharecdn.com/engs90finalreportteamtara-230418191458-286fa866/85/ENGS_90_Final_Report_TeamTara-pdf-12-320.jpg)
![Motor Material Weight Ratio Weight (in kg)
Electric steel 47.62 140.48
Other steel 12.57 37.08
Aluminum 17.2 50.74
Copper 8.47 24.99
Insulation material 0.26 0.77
Impregnation resin 1.32 3.89
Paints 0.66 1.95
Packing material 11.9 35.1
Total 100 295kg
Table 7: Material content of typical electric motor
Finally, the data for the genset was taken from “Life cycle energy assessment of a standby diesel
generator set”. Ferrosilicon and low alloy steel were contributing 27 and 25 percent of the weight of
the motor [1]. The rest of the BOM is included in table 8.
Generator Material Weight Ratio Weight (in kg)
Aluminum Alloy 2.5 21.8
Cast Aluminum 2.5 21.8
Cast Iron 12 104.64
Copper 3 26.16
Ferrosilicon (Fe-Si) 27 235.44
Low Alloy Steel 25 218
Low Carbon Steel 16 139.52
Nickel 1 8.72
Steel 10 87.2
Epoxies 1 8.72
Total 100 872
Table 8: Material content of a typical diesel gen-set
For the use phase of the Sabb diesel engine, the amount of service delivered is estimated to be
around 30 years. For the fuel consumption of the engine, we know that Tidelines Institute expects these
trips to occur weekly (4 months × 4 weeks = 16 trips) during times of the year when student groups are
present (May-September) and monthly ( 8 months = 8 trips) during the off-season (September to May).
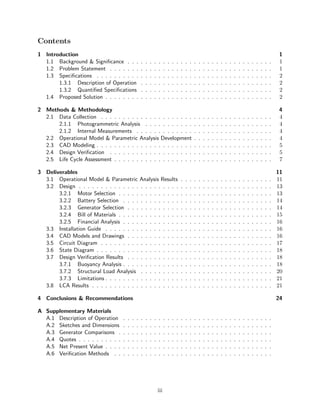
A round-trip duration is around 8 hours. We also know thatTara supposedly burns 1 gal diesel/hour at
6 knots.
1 gal diesel/hour × (16 + 8) trips × 8 hour/trip× = 192 gal diesel
192gal diesel = 618360.64 gram
On the other hand, for the new hybrid system, we assumed that Tara would be running half of the
trip on diesel and the other half on the electric power. Tara burns 2.7 gal diesel/hour at 6 knots using
9](https://image.slidesharecdn.com/engs90finalreportteamtara-230418191458-286fa866/85/ENGS_90_Final_Report_TeamTara-pdf-13-320.jpg)
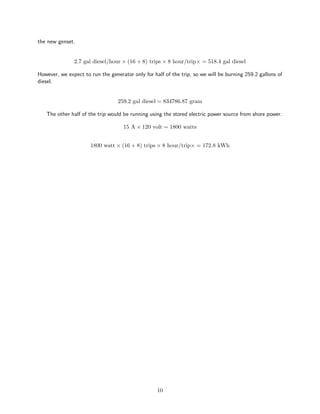


![Aside from stress, we also calculated displacement and strain and found the results to be consistent
to that of our stress results. See Supplementary Materials A.6 for displacement and strain results.
Another result from the FEA study was in obtaining the Factor of Safety from the design. Figure 11
shows the Factor of Safety to be greater than 1 for most parts, which suggests that our design and
placement of components shows no clear places of failure.
Figure 11: Factor of Safety Results from FEA analysis
Given the limitations for the FEA study as a result of the difference in material, we are not able
to provide sufficient information on how each individual component affects the stress and strain on
the hull. To be able to provide a deeper understanding of just how the drivetrain, motor, and battery
packs will be integrated into the hull structure, we would need more data on the hull material and hull
construction.
3.7.3 Limitations
In an effort to demonstrate the distribution of loading on Tara, we aimed to conduct a structural loading
analysis that would determine if the boat is stable along with the ideal configuration of components
in the interior. While we succeeded in conducting an FEA analysis that demonstrates how the total
loading on the boat affects the stability of Tara, we were unable to complete the testing of how each
individual component loading affects the stability of the hull. After consulting with Thayer Machine
Shop Technical Instructor Joseph Poissant, we concluded that there were limitations to successfully
completing those simulations due to issues with the large size of the CAD assembly model. In order
to successfully run the FEA study, we concluded that we needed to compromise on material due to an
elastic strain error when using fiberglass as the material [10]. Thus, instead of selecting fiberglass as
the material for the FEA of the boat, we went with the material Aluminum Alloy 6061-T6 instead.
3.8 LCA Results
LCA results of the diesel and hybrid diesel-electric systems were compared in Fig. 12, Fig. 13, and Fig.
14. Although the new hybrid system did not outperform the old diesel one when it comes to the carbon
footprint of the individual parts, this can be attributed to the particular nature of Tara’s old engine.
Not only was it severely undersized, it was severely underpowering Tara. It was an old engine that is
out of production now. The maintenance of the engine, we are assuming, although not included due to
21](https://image.slidesharecdn.com/engs90finalreportteamtara-230418191458-286fa866/85/ENGS_90_Final_Report_TeamTara-pdf-25-320.jpg)
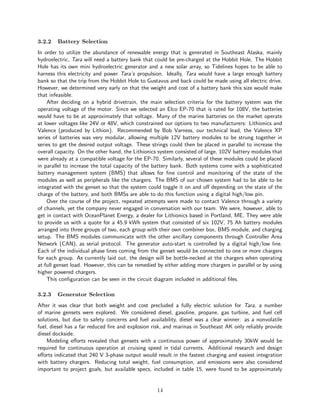
![the lack of available information, would have contributed a lot in the LCA. It’s also important to note
that our new system is much more powerful than the previous one, so a comparison of two equivalent
systems would be more realistic. We still believe the retrofit is more sustainable for similar vessels with
different diesel engines, ones with equivalent horsepower as our solution.
Figure 12: Impacts by SBOM inputs: Carbon footprint [CO2 eq. kg/func unit]
Looking at the impacts by life cycle stage, which is a better metric, considering we are more
concerned with how the two systems perform during the usage stage, we notice that our hybrid system
produces only 5.73 kg more of CO2 per year. Again, emphasizing the small size of our motor, this
implies that other current diesel motors will definitely be outperformed from a sustainability perspective
by our solution.
22](https://image.slidesharecdn.com/engs90finalreportteamtara-230418191458-286fa866/85/ENGS_90_Final_Report_TeamTara-pdf-26-320.jpg)
![Figure 13: Impacts by life cycle stage: Carbon footprint [CO2 eq. kg/func unit]
Looking at the impacts by life cycle stage of all emissions of chemicals into the air, water and soil,
we notice that our hybrid system outperforms the old one, scoring 0.037 mPts less per year. This value
increases significantly to 0.35 mPts per year when we assume that our batteries will be running for three
quarters of the trip and the diesel genset only for a quarter of the trip. This implies the use of more
batteries, which will increase the costs of this project but also will make the trip more sustainable. This
is a trade-off that Tidelines might have to make. Therefore, as the batteries are used longer to power
Tara during the trip, the propulsion system performs better when it comes to several impact categories
including ecological damage, resource depletion, and human health damage.
Figure 14: Impacts by life cycle stage: Total [mPts/func unit]
23](https://image.slidesharecdn.com/engs90finalreportteamtara-230418191458-286fa866/85/ENGS_90_Final_Report_TeamTara-pdf-27-320.jpg)

![References
[1] Kelly Benton, Xufei Yang, and Zhichao Wang. “Life cycle energy assessment of a standby
diesel generator set”. In: Journal of Cleaner Production 149 (2017), pp. 265–274. issn: 0959-
6526. doi: https://doi.org/10.1016/j.jclepro.2017.02.082. url: https:
//www.sciencedirect.com/science/article/pii/S0959652617302962.
[2] CAT. C4.4, C4.4 ACERT, C2.2 Product Specifications. 2021.
[3] Firasf1dream. Fiberglass composite study in SolidWorks, Help ! 2015. url: https://www.
f1technical.net/forum/viewtopic.php?t=22303 (visited on 03/07/2022).
[4] Anjuli Grantham. Juneau’s Climate Change Solutionists: Electrifying marine transportation
with Bob Varness. 2021.
[5] Hans Hersbach et al. “The ERA5 global reanalysis”. In: Quarterly Journal of the Royal
Meteorological Society 146.730 (2020), pp. 1999–2049.
[6] Byongug Jeong et al. “An effective framework for life cycle and cost assessment for marine
vessels aiming to select optimal propulsion systems”. In: Journal of Cleaner Production 187
(2018), pp. 111–130. issn: 0959-6526. doi: https://doi.org/10.1016/j.jclepro.
2018.03.184. url: https://www.sciencedirect.com/science/article/pii/
S0959652618308552.
[7] Michael Kasten. Sabb 2JHVP Marine Diesel Engine. Oct. 2001. url: http://www.xsw.
com/boojum/Sabb30/index.html (visited on 11/18/2021).
[8] Chandler Kemp. “Electric power systems for fishing vessels : Feasibility , fuel savings and
costs Sponsoring organizations : Prepared by : Corresponding Author”. In: (2021).
[9] Chandler Kemp. “Woodstock Summer Operations”. In: (2021).
[10] Ketul Patel. SOLIDWORKS Simulation: Causes of Incremental Strain Error. 2018. url:
https://www.cati.com/blog/2018/12/solidworks-simulation-causes-of-
incremental-strain-error/ (visited on 03/07/2022).
[11] Kohler. “Model : 28EFKOZD, 32EKOZD, 33EFKOZD Marine Generator Set Generator
Weights and Dimensions Engine”. In: 195 (2021), pp. 1–4.
[12] Anna Karina Magnussen. “Rational calculation of sea margin”. MA thesis. NTNU, 2017.
[13] Grant D. McKenzie. How to Calculate The Underwater Volume. 2017. url: https : / /
sciencing . com / calculate - underwater - volume - 6345342 . html (visited on
03/07/2022).
[14] MER. “Bollard MG28, MG42 Marine Generator Specifications”. In: (2021).
[15] NOAA. “Coast Pilot 8: Alaska-Dixon Entrance to Cape”. In: 1 (2021), pp. 119–135.
[16] NOAA. “Current Tables, Pacific Coast”. In: (2021).
[17] Northern Lights. “M944W3FG, M944T3FG Specifications and Dimensions”. In: (2021).
[18] Onan. MDKDU, MDKDS Marine Generator Specifications. 2021.
[19] Svetlana Orlova et al. “Lifecycle Analysis of Different Motors from the Standpoint of En-
vironmental Impact”. In: Latvian Journal of Physics and Technical Sciences 6 (Dec. 2016),
pp. 37–46. doi: 10.1515/lpts-2016-0042.
[20] University of British Columbia. 14.4 Archimedes’ Principle and Buoyancy. url: https://
opentextbc.ca/universityphysicsv1openstax/chapter/14-4-archimedes-
principle-and-buoyancy/ (visited on 03/07/2022).](https://image.slidesharecdn.com/engs90finalreportteamtara-230418191458-286fa866/85/ENGS_90_Final_Report_TeamTara-pdf-30-320.jpg)
![[21] USNA. “Resistance and powering of ships”. In: Resistance and powering of ships. 2002.
Chap. 2.07, pp. 1–46.
[22] O. Winjobi, Q. Dai, and J.C. Kelly. “Update of Bill-of-Materials and Cathode Chemistry
addition for Lithium-ion Batteries in GREET 2020”. In: Systems Assessment Group, Energy
Systems Division, Argonne National Laboratory (2020).](https://image.slidesharecdn.com/engs90finalreportteamtara-230418191458-286fa866/85/ENGS_90_Final_Report_TeamTara-pdf-31-320.jpg)
![A Supplementary Materials
A.1 Description of Operation
[see below]](https://image.slidesharecdn.com/engs90finalreportteamtara-230418191458-286fa866/85/ENGS_90_Final_Report_TeamTara-pdf-32-320.jpg)
![Vessel Information
Background
First launched in 1967, the F/V Tara (formerly F/V Angel Lilly, call sign WX9698) has served as a halibut
longline fishing vessel in the waters of Southeast Alaska for decades. Her hull is a semi-displacement deep-v with
dimensions given in Table 12. Her main deck has a center cockpit helm and a small forward cuddy cabin with a
raised cabin top in lieu of a foredeck. She has two fish holds amidships with a six ton total capacity, and an engine
compartment aft of the holds. Additional smaller lockers to hold fishing, deck, and docking gear are located on
the deck. Tara’s current power plant is a 30 horsepower diesel engine, the specs of which are also listed in Table
12 [7].
Part Dimension Units
LOA 28’11” feet/in
Beam 10’3” feet/in
Draft 4’6” feet/in
GRT 10 tons
NRT 8 tons
Hold Capacity 6 tons
SABB 2JHVP diesel motor 2 cylinders, water cooled, 4 stroke
Engine max power 30 horsepower (at 1900 rpm)
Engine bore/stroke 3.93”/4.72” inches
Engine displacement 114.7 in3
Fuel consumption 0.4 lb/hph
Engine weight 838 lbs
Table 12: Current specifications of Tara
Planned Systems
Hybrid conversion of Tara will replace her current diesel power plant with a series hybrid electric propulsion system.
This system will employ an electric drive motor with a battery power supply. Since current charging infrastructure
(§Home Port, §Ports of Call) is insufficient for fully electric operation of the vessel, a conventionally-fueled range
extender – an internal combustion motor running a generator – will charge the batteries in port and en route,
however, the vessel will recharge with renewable energy sources when available
Sea Margin
A sea margin of 20% will be used for initial calculations and will be revisited after preliminary CFD simulations
are completed [12].
Vessel Operator
Background: Tidelines Institute
Tara will be operated by the Tidelines Institute, an experiential education and research organization located in
Southeast Alaska. As a former fishing vessel, conversion of Tara will offer a benchmark for performance and cost
of hybrid vessel construction and will serve as an inspiration to take on such projects, advancing the institute’s
mission of climate responsibility.](https://image.slidesharecdn.com/engs90finalreportteamtara-230418191458-286fa866/85/ENGS_90_Final_Report_TeamTara-pdf-33-320.jpg)

![Area of Operations
Planned Route
Tara’s planned route will take her from Inian Island to Gustavus and back, a round-trip distance of approximately
50 miles excluding the effects of currents. Apparent speed over water and effective trip duration with maximum
currents are shown in Tables ??, ??, ??, and ??. Other areas of operations include Glacier Bay, Icy Strait, and
Cross Sound.
Expected Conditions
Typical Operating Conditions
Tara’s primary operating season is May through September. Tara may also operate in shoulder-season conditions
outside of that window for non-critical transport of Tidelines Institute staff and equipment. Typical meteorological
and maritime conditions for these periods in the northern Icy Strait are summarized in Table 13 [15].
Parameter Units May June July August September
Air Temperature °C 8.3 11.7 13.3 13.3 10
Water Temperature °C 8.8 11.3 13.4 13.9 12.1
Wind Speed mph 6.1 5.6 5.5 6.2 7.9
Wind Direction N/A SE S S S S
Table 13: Average operating conditions
Most Severe Operating Conditions
Tara’s primary operating season is May through September. Tara may also operate in shoulder-season conditions
outside of that window for non-critical transport of Tidelines Institute staff and equipment. The most severe
meteorological and maritime conditions for these periods in the northern Icy Strait are summarized in Table 14
[15, 16, 5].
Parameter Units May June July August September
Air Temperature (min) °C 4.4 7.8 10 10 7.2
Air Temperature (max) °C 13.3 16.1 17.2 16.7 13.9
Wind Speed mph 25.2 22.8 21.7 21.9 26.4
Sea Height % > 9ft 2.8 1.8 1.0 1.8 3.5
Tidal Current kts 3.1 3 2.9 3 3
Table 14: Most severe operating conditions
Storage Conditions
Tara will be taken out of the water each winter, covered, stored outdoors in Gustavus. Sea conditions at this time
are thus irrelevant, but storage temperatures will average between 25° and 35° Fahrenheit and may reach as low
as 0° F [5].](https://image.slidesharecdn.com/engs90finalreportteamtara-230418191458-286fa866/85/ENGS_90_Final_Report_TeamTara-pdf-35-320.jpg)
![A.2 Sketches and Dimensions
[see below]](https://image.slidesharecdn.com/engs90finalreportteamtara-230418191458-286fa866/85/ENGS_90_Final_Report_TeamTara-pdf-36-320.jpg)


![A.3 Generator Comparisons
[see below]](https://image.slidesharecdn.com/engs90finalreportteamtara-230418191458-286fa866/85/ENGS_90_Final_Report_TeamTara-pdf-42-320.jpg)
![MAKE
MODEL
UNIT
COST
VOLTAGE
POWER
(MAX)
OUTPUT
FREQUENCY
WEIGHT
L/W/H
FUEL
CONS.
EMISSIONS
Kohler
[11]
28EFKOZD
-
120/480
28
three
phase
50
1339
51/26/30
2.57
32EKOZD
-
110/380
32
three
phase
60
1339
51/26/30
2.99
EPA
Tier
III
33EFKOZD
-
110/416
33
three
phase
50
2260
64/30/40
2.7
CAT
[2]
C2.2
$12,560.00
12/24
18
single
phase
50/60
1027
46/24/31
EPA
Tier
III,
IMO
NST,
EU
IW
C2.2
$15,320.00
12/24
27
single
phase
50/60
1027
46/24/31
EPA
Tier
III,
IMO
NST,
EU
IW
Cummins
[18]
Onan
QD
29
$24,876.66
220/208
29
three
phase
60
1380
54/25/30
2.8
EPA
Tier
III
Onan
QD
17
$18,788.32
220/208
17
three
phase
60
930
44/24/28
2.2
EPA
Tier
III
Northern
Lights
[17]
M944W3FG
$34,958.00
120/208
30
three
phase
60
1329
56/29/32
2.8
EPA
Tier
III
M944T3FG
$53,241.00
120/208
38
three
phase
60
1443
60/29/32
3.26
EPA
Tier
III
MER
[14]
Bollard
MG42
$40,280.00
120/208
42
three
phase
60
1922
62/31/40
3.53
EPA
Tier
III
Bollard
MG28
$29,480.00
120/208
28
three
phase
60
1147
52/22/31
2.3
EPA
Tier
III
Table
15:
Comparison
of
available
diesel
genset
specifications](https://image.slidesharecdn.com/engs90finalreportteamtara-230418191458-286fa866/85/ENGS_90_Final_Report_TeamTara-pdf-43-320.jpg)


![A.5 Net Present Value
[see below]](https://image.slidesharecdn.com/engs90finalreportteamtara-230418191458-286fa866/85/ENGS_90_Final_Report_TeamTara-pdf-51-320.jpg)


