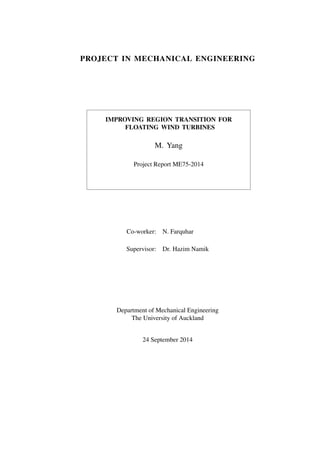
1. IMPROVING REGION TRANSITION FOR
FLOATING WIND TURBINES
M. Yang
Project Report ME75-2014
PROJECT IN MECHANICAL ENGINEERING
Co-worker: N. Farquhar
Supervisor: Dr. Hazim Namik
Department of Mechanical Engineering
The University of Auckland
24 September 2014
2. ME75-2014
IMPROVING REGION TRANSITION FOR FLOATING WIND TURBINES
M. Yang
ABSTRACT
At certain wind speeds a wind turbine will transition from operating at below
design specifications to above design specifications. This transition causes dips
in power capture and increased loads which reduces overall performance and
life-span. The goal of this project is to improve the region transition specifically
for a offshore floating wind turbine.
The project will be purely simulation based with the aid of an aero-servo-
elastic simulator called FAST which is coupled with MATLAB ’s Simulink
to provide the control system interface. A 5 MW wind turbine placed on a
barge platform will be used as the baseline.
Two different directions were taken to improve region transition; the first was
changes to try reduce platform motion, and the second was a change to the
torque behaviour of the wind turbine generator.
The largest reduction in transition time occurred using a different torque com-
mand compared to the baseline. Transitions now ranged from 3 % to 10 % of
total time compared to 17 % for the baseline. Power captured in region 2 also
increased by around 11-34 %.
The use of individual blade pitch control to regulate motion showed the greatest
improvement to energy capture in region 3 with reduction in lost power capture
of 15 %.
Load reductions were most effective using motion reduction objectives with
reductions of up to 14 %. However, there were cases where a load increased by
as much as 32 %.
A combination controller was tested and results showed that there were further
improvements when operating within the transition region.
ii
6. Acknowledgements
I would like to thank my partner Nick Farquhar for putting up with me and helping me
throughout this project. He has been an integral part of the team and progress would have
been hard without him. I would also like to extend my thanks to Dr Hazim Namik for his
guidance, advice and patience in helping us along with this project.
vi
7. Glossary of Terms
Damage equivalent
load
The same amount of damage that would be imparted if the
loading had constant amplitude at some frequency compared to
the more stochastic loadings.
Integral wind-up The situation where a proportional integral derivative controller
can accumulate a large error term due to a large change in
regulation set point causing overshoot past regulation point.
Linear state-space
matrix
A set of first-order differential equations that describes the
states and the outputs of the model.
States Variables that describe the characteristics of the system which
can completely define what the system is doing at any point in
time.
Abbreviations
BP Blade pitch
DEL Damage equivalent load
DLC Design load case
DOF Degree of freedom
EEA European Environment Agency
FAST Fatigue, aerodynamic, structural, turbulence
FSFB Full-state feedback
GSPI Gain schedule proportional integral
HAWT Horizontal axis wind turbine
HSS High speed shaft
IEC International Electrotechnical Commission
LIDAR Light detection and ranging
LQR Linear quadratic regulator
LSS Low speed shaft
LTI Linear time invariant
MBC Multi-blade coordinate transformation
MIMO Multiple-input multiple-output
MPC Model predictive control or controller
NREL National Renewable Energy Laboratory
P Proportional
PI Proportional integral
SISO Single-input single-output
SS Side-side
vii
8. VAWT Vertical axis wind turbine
VPPC Variable power pitch controller
VSVP Variable speed, variable pitch
VSWT Variable speed wind turbine
Nomenclature
Symbols
A Turbine state matrix –
B Turbine actuators gain matrix –
C Turbine model output matrix –
D Controlled inputs in relation to measurments matrix –
e Error at some time value –
ID Inertia of the drivetrain kg•m2
c Scaling parameter for Weibull distribution –
k Shape factor for Weibull distribution –
NGear Gear ratio from high-speed to low-speed –
NR Non-rotating frame –
∂P
∂θ
Sensitivity of the aerodynamic power to blade pitch angle W/rad
Prated Rated generator power W
Q Weighting matrix –
Q Augmented weighting matrix –
si Weibull scaling factor –
t Time s
Tgen Generator torque Nm
uNR Input vector in the non-rotating frame –
U Mean wind speed over 10 minutes m/s
xNR States vector in the non-rotating frame –
yNR
Meaurements vector in the non-rotating frame –
Greek Symbols
ηgen Generator efficiency –
viii
9. Ω0 Rated generator speed rad/s
Ωgen Generator rotational speed rad/s
ωn Natural frequency of the response rad/s
ωpitch Platform pitching velocity deg/s
ωr Set point generator speed rpm
ψ Azimuth angle degree
θ Collective blade pitch angle degree
θ1 Blade one angle degree
θ2 Blade two angle degree
θ3 Blade three angle degree
θcc Cosine-cyclic rotating input degree
θc Collective rotating input degree
θpitch Platform pitch angle degree
θsc Sine-cyclic rotating input degree
ζ Damping ratio –
ix
10. 1. Introduction
Renewable energy has become increasingly sought after as fossil fuel energy is harmful to
the environment with a limited supply. This has led to the proliferation of wind energy
capture in recent years with offshore wind turbines being an area of research. This section
will give a brief overview of wind energy, wind turbines and control of wind turbines. The
problem area will be introduced and the project objective and scope will be defined.
1.1 Wind Energy Overview
Wind energy is a vast and inexhaustible source of energy. Renewable energy production,
in general, has grown with sources such as wind, geothermal, solar, and other sources
(excluding hydro) up 1% in February 2014 compared to the previous year [1]. This was
reconciled with a fall of 1% from energy generation from fossil fuels. There has been
annual growth of renewable energy sources, and wind energy has been one of the major
contributors for this [1, 2]. This has led to the wind energy industry becoming more
competitive as companies and governments seek to expand this technology in a bid to
diversify their mix of energy production. This diversification leads to environmental and
economical benefits which is something that traditional fossil fuel energy generation cannot
meet [2].
By the end of 2012, the global wind power capacity was 282.5 GW [2] which was a
growth of 19% from the previous year. Figure 1 shows the rapid growth of the total
installed wind capacity of the world [2]. The Asian market was the largest of wind energy
for the fifth consecutive year with China as the main contributor followed by India. China
had seen tremendous growth since 2009 when it had a capacity of 25.8 GW to its level
now of 75.3 GW. India had also seen growth, where wind energy was 8% of their total
electricity generation in 2012. However, the country with the largest proportion of wind
energy consumption was Denmark with more than 30% of electricity requirements covered
by wind energy at the end of 2012 [2].
0
50000
100000
150000
200000
250000
300000
1996 1997 1998 1999 2000 2001 2002 2003 2004 2005 2006 2007 2008 2009 2010 2011 2012
Totalinstalled(MW)
Year
Figure 1 Combined global wind energy capacity from 1996-2012 (adapted from [2])
Looking forward, many countries have placed targets on wind energy capture. For example,
Mexico had placed a target that wind energy is to produce 15% of total power requirements
by 2020. Forecasts have shown that the average growth rate was expected to be 13.7%
from 2012 to 2017 which was well below the previous year’s growth rates of 22%. Policies
and infrastructure are the major hurdles to overcome to drive the industry towards a high
growth rate [2].
1
11. 1.1.1 Offshore Wind Energy
The first offshore wind farm was built in Vindeby, Denmark, in 1991 and has a 4.95 MW
capacity [2, 3]. By the end of 2012, global installed offshore wind energy capacity was
5.415 GW making it 2% of the combined installed wind energy capacity. Over 90% of
the current offshore wind energy capacity is installed within the northern Europe coastal
area (Baltic, North, and Irish Seas, and the English Channel). The other 10% is mainly
made up within the east coast of China, where it is used as demonstration sites. Both
Europe and China have placed targets from offshore sites to produce a percentage of total
energy requirements by 2020 [4]. Japan and South Korea also have plans to expand on
their offshore farms to meet targets set by their governments towards sustainable energy
generation levels. The United States have just recently deployed a prototype of a floating
wind turbine in the waters of the Penobscot River in Maine where it will be towed out to
sea for testing [5].
There is significant potential for energy to be captured offshore and the European Envir-
onment Agency (EEA) has estimated that the potential energy is capable of meeting the
energy demand of Europe seven times over [6].
1.2 Wind Turbines Overview
Wind turbines can either be a vertical axis wind turbine (VAWT) or a horizontal axis wind
turbine (HAWT). We will be focusing on the HAWT variants which are the traditional
land-based wind turbines and offshore wind turbines. Land based wind turbines occupy
large sections of area which could otherwise have been used for agriculture, housing, or
township developments. For example, the Roscoe wind turbine farm in Texas, United States
has 627 wind turbines spread over an area of 100,000 acres. These wind farms are typically
situated far from large cities which places greater demand on efficient and effective power
transmission lines. This is a major barrier to the development of wind energy capture [7].
Furthermore, land based wind turbines may be considered unsightly and produce noise that
is significant enough to be a nuisance for some. Professor William E. Heronemus saw the
need to alleviate these concerns and proposed that large offshore floating wind farms be
used in 1972. It was only until the 1990s that the offshore wind turbine industry was set
up [8]. This establishment has led to much research in the area.
Offshore wind turbines can be either fixed bottom, if placed in shallow waters (less than
50 m) or floating. There are several advantages of placing wind turbines offshore and these
are listed below [4,7,9,10]:
• Wind energy found offshore is generally much greater, more stable with less turbu-
lence and shear, allowing for greater energy capture from fewer turbines.
• The distance to major cities, usually situated along coastal areas, is not as great thus
reducing the need for long transmission lines.
• Visual impact is avoided if placed sufficiently far away (L =
√
2HR, where L is the
distance from shore to turbine to be invisible, H is the hub height plus the radius of
a blade, and R is the radius of the earth). Auditory impact is also avoided.
• The size of an offshore wind turbine farm is not restricted (for example, no nearby
infrastructure to limit size).
2
12. • Land that would have been used for wind turbine farms can now be used for other
infrastructure.
• The offshore wind turbine can be expected to recover its energy cost used for the
initial installation, manufacture, transportation, maintenance and operation, and de-
commissioning in three months.
XY
Z
Wind
Figure 2 Platform DOFs (modi-
fied from [9])
There will be, however, disadvantages associated with off-
shore wind turbines and these include [7,9]:
• Greater initial capital investment due to the added
obstacles faced with placing a wind turbine offshore.
• Increased downtime and cost of maintenance of wind
turbines due to it being less accessible.
• Increased complexity of design as there are extra con-
siderations to be made, such as loading from waves
and platform movements for floating turbines.
1.2.1 Floating Offshore Wind Turbines
The first successful full-scale test of a floating wind turbine
was the Hywind project which was installed in 200 m deep
water on the south-western coast of Norway in 2009 [5].
This was a 2.3 MW turbine, produced by Siemens, placed
on a spar buoy platform. The configuration of the platform
will be discussed below. The successful test of this turbine
has led to further full scale testing to better understand and advance the technology.
Because of the fact that a floating wind turbine is no longer rigidly fixed upon a foundation,
there are an additional six degrees of freedom (DOFs) to consider; three linear, and three
rotational. The linear DOFs are surge, sway, and heave along the X, Y, Z axis respectively.
Roll, pitch, and yaw applied along the X, Y, Z axis respectively, make up the final three.
Figure 2 illustrates the additional DOFs. The motion of the waves on the platform causes
additional challenges to the design of a wind turbine and must be accounted for when
determining a solution.
There are many possible configurations for offshore wind turbines, one of which has
already been stated: the spar buoy platform. This configuration is one of four main types
derived from the oil and gas industry [8]. Figure 3 highlights the different designs. Each
platform’s name relates to how the platform is moored and stabilised. The spar-buoy type
is characterized by a large ballast which is usually constructed from steel or concrete and
filled with water. The ballast lowers the centre of mass (CoM) well below its centre of
buoyancy (CoB). This design inherently makes the turbine difficult to capsize. It is usually
moored using taut or catenary lines made from chains, steel cables or synthetic fibres. This
type must be assembled offshore. The tension leg platform (TLP) consists of a submerged
platform which uses tensioned tethers, achieved from the buoyancy of the platform, to
provide stability. This means that the TLP has less dynamic response to incident waves
compared to the other types. The barge type platform employs a large floating structure
and is moored by taut or catenary lines. Stability is achieved through the distributed
3
13. buoyancy where the water-plane area provides a righting moment. This design is more
susceptible to the waves’ motions [7, 8]. The semi-submersible type is constructed from
three columns which are held together with tubular structures. The columns have ballasts
in them and stability is achieved through the water-plane area. Mooring is provided using
taut or catenary lines [8].
Barge TLP Spar-Buoy
Mooringlinesnottoscale
(a)
(b) (c)
Figure 3 Sub-Figure a) shows the three main types [9] and sub-figures b) and c) show the semi-submersible
type [8]
1.3 Wind Turbine Control Overview
A HAWT can be classified as either a fixed-speed or variable-speed wind turbine (VSWT).
This project will focus on the control systems of the latter because VSWT can be used
in a range of wind conditions whereas the fixed-speed is only efficient at a single wind
speed [11]. The control can be split into two categories. The first is supervisory control
which is primarily concerned with the start-up and shut-down of a wind turbine. The
second is closed-loop control which is concerned with operational parameters when the
wind turbine is generating power [9]. A typical VSWT has a torque controller and blade
pitch (BP) controller to regulate power capture. To better determine the control strategies
for closed-loop control, wind turbines have three distinct regions of operation [7, 9, 12]
shown in Figure 4:
4
14. Figure 4 Ideal power capture curve show-
ing the regions
Region 1 In this region, the wind speed is below a
wind speed called the cut-in wind speed. No
power is extracted from the wind. This re-
gion accelerates the rotor to start up the wind
turbine.
Region 2 This region is concerned with optimising
power capture where it operates between the
cut-in and the rated wind speed. The BP is
held constant and the torque controller is used
to maximise power capture.
Region 3 Here, the wind speed is above the design
or rated wind speed. Power capture is restricted to protect components from damage.
The BP can vary to maintain constant rotor speed, while the generator torque can
vary inversely to the generator speed to maintain constant power. Above a certain
wind speed, the cut-off wind speed, the turbine will go into shut-down.
There exists a region called region 2.5 which is a transition from region 2 to region 3.
This region is needed due to limitations on tip speed to meet structural vibration and noise
constraints, resulting in regions 2 and 3 not intersecting at the rated speed. Both the BP
angle and torque varies here [7, 12, 13]. This region presents some problems in obtaining
smooth switching between the two main regions while maintaining effective power capture
as the two controllers clash with each other. Change in control authority causes problems
when one controller is saturated while the other is operating [14]. Rapid actuations by the
controllers causes additional loads on the turbine which can reduce the useful life of the
turbine [13, 15]. Platform motion further exacerbates the problem as this causes the rotor
speed to vary leading to poorer power regulation [16]. The wind speeds in each region is
shown in Table 1 and these are obtained from [7].
Table 1 Wind speed range within each region
Region Wind Speed Range (m/s)
1 0 ≤ V < 3
2 3 ≤ V < 10.2
2.5 10.2 ≤ V < 11.4
3 11.4 ≤ V < 25
Shutdown V ≥ 25
The controller can vary in complexity
based on its design. The controller can
either be single-input single-output (SISO)
or multiple-input multiple-output (MIMO)
[7, 9, 17]. The SISO controller takes in
a single input, such as generator speed,
and calculates a single signal that is passed
through to an actuator, or the same signal
to multiple actuators. A MIMO controller
takes in multiple inputs, such as generator speed and a structural load measurement, and
sends different signals to their respective actuators to regulate these. The advantage of
using MIMO is that it can exhibit an improvement in speed regulation and load reduction
over a SISO controller. However, it does not work well in region 2.5 where it can accu-
mulate a large error signal thus causing excess overshoot which is undesirable as it leads
to poor controllability [17]. This is referred to as integral wind-up and a SISO controller
has greater controllability over this [17]. The blades can either be controlled collectively
(SISO) or individually (MIMO), with individual BP control being more complex. Further
5
15. complications arise with coupling between controller inputs and outputs where the outputs
of each controller can affect structural loads, weather adversely or favourably, even if it is
not the design goal for that controller [17].
1.4 Project Goals and Scope
The project goal is to design and test, or implement existing transition control strategies to
investigate its effects on power capture and structural loads. The objectives will then be to
improve region transition while reducing loads and improving power capture. Some areas
that are outside the scope of the project are defined below:
• Wind speeds well above and below rated will not be considered. We are only
interested in wind speeds around rated, and therefore the transition region.
• Analysis will be limited to the barge platform.
• Region transition is defined as the time spent in switching between regions, where
switching occurs when the controller spends less than 15 secs within a region.
• No extreme or ultimate loads investigation will be conducted. This project will focus
on fatigue loads during normal operation where the controllers are in effect.
• No changes to platform or turbine such as optimisation of design or adding additional
components.
• We will not consider yaw control as this has little to no impact on power capture [9].
• The project will be purely simulation based as having access to a model to test is
not feasible.
2. Floating Wind Turbine Control Overview
Few research has been done into transition controllers and its effect on power capture and
structural loads. Much of the past research has been centred around the above-rated wind
region. This section will give an overview of controllers that are designed, or could be
adapted, for transition.
2.1 Power Curve Tracking
Tracking the power curve more efficiently is one way to improve power capture and lead to
smooth transitions [11]. This curve is the locus of operating points that maximises power
capture. The coefficient of power (Cp), which is a function of BP angle and tip speed
ratio (TSR), is used to derive this curve. Once the curve is found, the regulation policies
for rotor speed, BP and rotor torque can be found [18]. Normally, the optimum Cp curve
is not tracked because in turbulent wind the rotor reaches a speed which causes the rotor
blades to stall leading to lower power conversion. This point where the turbine stalls is
called the stall front. Thus to avoid reaching the stall front, a lower, less optimal, Cp curve
is tracked. [11]. This is especially true of large wind turbines which have larger rotational
inertia. Therefore it is usually better to track a Cp curve slightly below (around 5 %) the
Cp max curve [11,19].
6
16. C C
B
B
A
Rated power curve
Cp max locus
Rated
Rated
Generator speed (rad/s)
Generatortorque(Nm)
Figure 5 Simple representation of the power curve (adapted from [11])
When the controllers are switching between regions, it is found that often there are large
dips in torque and thus power generation. Around rated wind speeds, there are many region
transitions occurring which also leads to poorer power capture as the controller is often
switching between logic. Bianchi et al. [11] offers a solution to this by altering the power
curve which leads to smoother transition at the cost of power capture as shown in Figure 5
by the AB’C’C trajectory. In region 2, the control tracks on the optimal Cp curve until
point B’ where the torque ramps up to rated torque. This strategy tries to clearly define
the regions where each controller acts. From A to C’, the torque controller acts without
interference from the BP controller, which is dominant around point C [11].
Bossanyi [19] proposes that the path ABC be followed. This allows for better tracking
of the Cp curve and therefore better power extraction. To do this, he implements a
proportional integral (PI) torque controller and tested it on a 5 MW fixed offshore wind
turbine. It is hard to say if there are improvements as there are no comparisons to a
reference turbine. [20].
Bianchi et al. [11] and Bossanyi [19] both present a similar method to improve power
capture and load reduction. At the rated wind speed, the BP begins to pitch slowly as wind
speed increases, while torque continues to increase. This means that the rated power will
be attained at a higher wind speed, effectively stretching out the transition region. Bossanyi
suggests that the torque controller and the BP controller be coupled with inclusion of a
torque error term into the BP control logic. At wind speeds far above and below rated, the
controllers act independently, but close to rated, the two controllers will work in tandem.
Bossanyi also states that it would be necessary to “ratchet” the torque to prevent dips at
above rated wind speeds as the BP are not at their optimal angle. The path that this
strategy follows is given by ABC in Figure 5.
2.2 Platform Motion Control
Work on reducing platform motion in a bid to improve power capture and reduce loads
have been conducted in region 3. In this region when the platform is pitching towards
the wind, the apparent wind seen by the turbine increase and will induce the rotor blades
to spin faster. Therefore, to maintain a constant rotor speed, the pitch controller will
actuate the blades to reduce the lift generation. This has the effect of reducing rotor thrust,
which acts to provide a restoring moment on the wind turbine, and thus exacerbates the
motion towards the wind. The same ideas can be used when pitching backwards where
7
17. the apparent wind decreases. This removes some of the restoring moment and worsens the
pitching. Lackner [16] proposes a simple solution to this by altering the set point of the
BP controller. This approach is referred to as the variable power collective pitch control
(VPPC) and is given below:
ωr = 1173.7(1 + kωpitch) (1)
where ωr is the set point generator speed (rpm), k is a constant, and ωpitch is the pitching
velocity of the platform. When the platform is pitching forwards, the set point increases so
that the rotor will continue to extract power and provide thrust and so provide a restoring
moment to counter the pitching. Results from simulation with the National Renewable
Energy Laboratory (NREL) 5 MW floating wind turbine show that there are improvements.
For a k of -0.025 there were, on average, a 3-8% increase in speed and power error,
and a 15% reduction in the root mean square (RMS) platform pitch angle and RMS pitch
rate [16].
2.3 Wind Preview
Most of the literature pertaining to the preview of wind uses light detection and ranging
(LIDAR) as the method. LIDAR looks ahead and measures the wind to allow the con-
trol system to generate a smooth and optimised trajectory to track. However, there are
measurement inaccuracies when LIDAR is used in turbulent wind. This requires the use
of a low-pass filter to filter the measurements. Aho et al. [13] used simulated LIDAR
measurements to design a trajectory tracking controller (TTC) and ran simulations using
the NREL 5 MW turbine with five different turbulent wind profiles for 600 seconds each.
The LIDAR was centred at the hub and used three beams to sample the wind. It was
focused at 75% of the blade length at 107 m upwind of the turbine. It was found that
the TTC reduced loads and led to smoother transitions between regions compared to the
baseline, except for the low speed shaft DEL [13]. Figure 6 shows the difference in the
trajectory between the baseline and the TTC.
Rated
Rated
Rated power
Cp max locus
Rotor speed (rpm)
Generatortorque(Nm)
Baseline
TTC
Figure 6 Trajectory comparison of TTC and baseline (adapted from [13])
8
18. 2.4 Model Predictive Control
A model predictive controller (MPC) was originally designed for systems with slow dy-
namics, such as the process industry, because of on-the-fly calculations [14]. This naturally
requires heavy use of computations. Research into MPC has become more common in
the last five years as technology has allowed for much faster calculations making it more
widely accepted [14,21,22].
The core of a MPC is an objective function defining the control objectives and a set
of equations which describes the dynamics of the system. This, therefore, becomes an
optimisation problem. Some of the strengths of MPC is its ability to incorporate system
constraints and disturbance predictions into the problem. MPC uses past system states,
such as the wind speed, to predict the future state at a discrete time step and thus sets
the objective function. Weights are used to determine relative importance of each control
goal and varies depending on the operation region. For example in region 3 wind speeds,
the power output is to be kept constant and so the weighting associated with maintaining
constant power is high [14].
Figure 7 Diagram of the 5-mass
model (3 lump masses for the blades,
and 2 for the drive train) [14]
Lindeberg et al. [14] formulated a linear MPC model,
by using a series of linear controllers to model the non-
linear behaviour of a wind turbine, and used a 5-mass
wind turbine model, seen in Figure 7, on a floating plat-
form. This proof-of-concept model was called “bumpless
transfer” where the switching of controllers is not sudden
but rather a gradual change. Using weightings obtained
from a trial and error basis, the power output was found
to be smoother than the case where the weightings led to
sudden control change. Spencer [22] investigated current
wind versus predicted wind, using wind preview, and its
effect, and implemented MPC on the NREL 5 MW tur-
bine. He isolated simulations within region 2 and 3. In
region 3, there was significant load reduction, when wind
preview was used, in extreme winds while less reduction
was seen with more normal turbulent winds. In region
2, Spencer implemented two controllers, one to maximise
power capture and the other to minimise fatigue loads. He found that there was only im-
provement in power capture with the former controller in more extreme winds. Laks [21]
used MPC in conjunction with LIDAR and found that it was effective in alleviating loads in
turbulent wind conditions using a three-bladed Controls Advance Research Turbine (CART)
at the NREL centre.
3. Simulation and Analysis Tools
To aid in the analysis and modelling of a floating offshore wind turbine, there are two
tools that will be used together for the simulations. Fatigue, Aerodynamics, Structures, and
Turbulence (FAST) which is a code that can be used to to simulate the aerodynamics and
structural dynamics of a HAWT given a wind profile. It was developed by the NREL and
certified by Germanischer Lloyd WindEnergie GmbH. This is available free of charge on
the NREL website [23]. This is coupled with MATLAB ’s Simulink (here on referred to
9
19. as Simulink) which provides the interface for designing the control systems. FAST models
the wind turbine as both a rigid and flexible model with full control over the DOF. For
a three-bladed HAWT, FAST models this with 24 DOFs. These are six DOFs related to
translational motion (surge, sway, and heave), and rotational motion (roll, pitch, and yaw).
Four DOFs relating to the motion of the tower; two for the fore-aft modes and two for
the side-to-side modes. One DOF for the yawing motion of the nacelle (the housing of the
turbine components). A DOF for the azimuth angle of the generator, and a DOF for the
interaction of the rotor and generator in the drivetrain. The azimuth angle is the angle of
the blade relative to 0
◦
, which is the position of the blade at its vertical position with the
tip pointing straight up. There are two flap-wise bending modes DOF and one DOF for
the edge-wise bending mode, for each blade. The flap-wise load is the load on the blade
as it moves perpendicularly out of plane, the plane being the vertical plane of the rotor
face against the oncoming wind., and the edge-wise is in plane loading. The last two relate
to the rotation of the hub and nacelle [24]. In this project, the nacelle and hub will be
held as rigid bodies and yawing motion ignored giving a total of 21 DOF. The FAST code
utilises the AeroDyn module which is an aerodynamics analysis routine for HAWT, and
HydroDyn, a module required to model the dynamics of a floating platform [9, 23]. This
makes FAST a robust simulator. Figure A1 in Appendix A shows the relationship between
the modules.
Limitations of the FAST model
Although FAST has been certified, the HydroDyn code has yet to be certified. However,
the Offshore Code Comparison Collaboration (OC3) project has given indications that the
code developed is acceptable [9]. Therefore, the limitations of this tool should be noted.
Listed below are some assumptions used in the code [9]:
• Small angles of platform motion (less than 20º
).
• Tower is perpendicular to the platform and is modelled as a cantilever.
• Mooring lines have no bending stiffness
The wind turbine model (conceptual model) that will be used is based on components
that are publicly available. This wind turbine is referred to as the “NREL offshore 5-MW
baseline wind turbine” and will be coupled with a 40 x 40 x 10 m barge platform [25].
From here on, this reference turbine will be known as the baseline. Table 2 lists some
properties of this turbine with full details found in [25]. Figure 8 shows a simplified version
of the controller model implemented within the baseline coupled with the FAST interface
(called wind turbine in the figure) [9]. This model uses a gain scheduled proportional
integral (GSPI) controller for the BP control and is an example of SISO where the sole
objective is to regulate the rotor speed. Note that the region selection input is not a
parameter that is trying to be controlled. Because the BP controller acts throughout the
whole operation, the region selection input is required to inform the BP controller that it
is in region 3 so that the signal will be passed into the wind turbine block to actuate the
blades. A complete schematic of the model can be found in appendix A. The project will
based off of this baseline control model. As alternations to the control logic are made,
simulation results will be compared to the baseline to ascertain if improvements have been
gained.
Once a satisfactory control strategy has been implemented, that appears to work for simple
winds, with waves and without waves, it will need to be verified that the logic does
10
20. smooth out transition while maintaining effective power capture with more realistic winds.
TurbSim, which is also a free package from NREL, is a stochastic, full-field, turbulent-wind
simulator, will be used to generate different wind profiles within the transition region for
verification of the logic.
Torque
Controller
Blade Pitch
Controller
Region
Selection
Filtered generator speed
Generator
torque
Blade
pitch
Wind Turbine
Figure 8 Baseline controller Simulink model (adapted from [9])
3.1 The Baseline Controller
The baseline is a variable-speed, variable-pitch (VSVP) wind turbine with two basic control
systems: a generator torque controller and a collective BP controller. It was designed by
Jonkman to alleviate platform motion [26]. The generator torque controller works mostly
independently of the BP controller and its goal is to optimise power capture in the below
rated wind speed (region 2). The BP controller operates in the above rated wind speed
(region 3) where it pitches to feather (pitching the leading edge to face the wind to reduce
lift generation) to regulate rotor speed and hence power capture. The filtered generator speed
measurement is used as the sole feedback input for both the torque and BP controllers.
The torque commanded varies depending on which region the wind turbine is operating in.
Figure 9 shows the trajectory that the torque follows. Region 1 to 2 (region 1.5) follows a
linear transition used to place a lower limit on the turbine’s operating speed range. Region
2 follows a squared relationship of the generator speed, using a constant of proportionality
of 0.025576386 Nm/rpm2
. There is another linear transition from region 2 to 3, and region
3 follows an inversely proportional relationship to generator speed as given by equation 2
where Tgen is the generator torque, Prated is the rated power, ηgen is the efficiency of the
generator, and Ωgen is the generator speed. This is so that power generated is kept constant.
Tgen =
Prated
ηgenΩgen
(2)
The GSPI for the BP control is given by [25,26]:
θ(t) = Kpe(t) + Ki
tˆ
0
e(τ)dτ
where
e(t) = Ωgen − Ω0
11
21. Kp =
2IDΩ0ζωn
NGear −∂P
∂θ
Ki =
IDΩ0ω2
n
NGear −∂P
∂θ
and Ω0 is the rated rotor speed, Ngear is the gearbox ratio, ∂P
∂θ
is the sensitivity of the
aerodynamic power to the BP angle, ID is the inertia of the drivetrain, ζ is the damping
ratio and ωn is the natural frequency of the response. Full derivations can be found in [25].
Figure 9 Baseline torque controller trajectory [7]
The generator speed is passed through a low-pass filter with a corner frequency of 0.25 Hz.
This is one-quarter of the blade’s first edgewise natural frequency chosen to prevent destabil-
ising of flexible modes [7,27].
For this project the gain values used were proposed by Jonkman [25] and are Kp =
0.01255121s, and Ki = 0.0003586059. These are referred to as the detuned gains and
were a result of improving the platform pitch response in region 3 [7]. Integral wind-up
measures are also taken to prevent signal overshoot for the BP controller.
3.2 IEC Standards
The wind files generated will be based on Design Load Case (DLC) 1.2 in the IEC 61400-3
standard which are used to analyse the fatigue load performance of an offshore wind turbine
under normal operating conditions [28]. This standard was developed by the International
Electrotechnical Commission (IEC) and is for a fixed offshore wind turbine. Currently,
there are no standards for floating wind turbines therefore this standard is used.
Wind profiles generated will be between 8 m/s and 14 m/s in 1 m/s increments because this
is the region of interest in this project. The IEC standard requires that six different 600-
second simulations, of the same mean wind speed, be run. This is achieved using turbulent
12
22. Table 2 Properties of the NREL 5MW wind turbine
Power Rating 5MW
Number of Blades 3
Rotor, Hub Diameter 126m, 3m
Hub Height 90m
Cut-in, Rated, Cut-Out Wind Speed 3m/s, 11.4m/s, 25m/s
Cut-in, Rated Rotor Speed 6.9rpm, 12.1rpm
Rated Generator Torque 43,093Nm
Gearbox Ratio 97:1
Blade Operation Pitch to feather
Controls Variable speed, collective variable pitch
wind and irregular waves generated using different random seeds. These six simulations,
or DLC, constitute a wind speed bin [29].
The standard for DLC 1.2 requires that there is full knowledge of probability distributions
for wind speed, wave period and significant wave height. These are not fully known,
however, and so DLC 1.1 conditions for expected significant wave heights is used for a
given wind speed range. DLC 1.2 also specifies that wind and wave conditions be co-
directional and multi-directional. But because the barge platform is axisymmetric, the wave
and wind considered will be from one direction only.
Wave conditions used are the same used by Jonkman [7] and Namik [9]. This reference
site is situated in the north-east of Scotland.
Appendix B shows the properties used to generate the stochastic wind conditions used for
each wind speed bin kindly provided by Dr. Hazim Namik.
3.3 Performance Metrics
Comparison of each DLC against the baseline will be made using performance metrics
designed by Namik [9]. These metrics can be divided up into four basic categories:
• Region 3 performance metrics
– Region 3 time ratio
– Power (kW), torque (kNm), and speed (rpm) error
– Blade usage (pitch rate and max pitch rate (deg/s))
• Region 2 performance metrics
– Region 2 time ratio
– Power captured (kW) and efficiency
• Fatigue loads (kNm):
– Blade loads (flap-wise and edge-wise)
– Tower loads (fore-aft and side-side (SS))
– Low speed shaft (LSS)
13
23. • Platform motions (deg and deg/s):
– Roll and roll rate
– Pitch and pitch rate
– Yaw and yaw rate
Transition time is found from subtracting the region ratios from 1. Minimising this value is
a goal of this project. Region 3 metrics and motions are calculated as a root mean square
(RMS) value. The error is the deviation from the rated value. Reducing motions is desirable
as they lead to lower loads on the tower. Fatigue loads are calculated as damage equivalent
loads (DEL). This is used to calculate an equivalent load as the stochastic loading, using a
periodic loading of a calculated amplitude at a given frequency of 1 Hz [9].
The performance metrics are calculated for each simulation and then averaged within a
wind speed bin. The full set of bins are then averaged again using a weighting based on
the amount of time in a year that that wind speed will occur at a particular site. This
will give an overall average and a clearer view of performance comparisons against the
baseline as it is unrealistic to say that a location will experience equal amounts of time
at each wind speed. This weighted average will be done using a Weibull distribution
discussed in Appendix C. Comparisons made between the proposed control implementation
and the baseline will be based off of these weighted average values and are referred to
as the overall or total. For the region 3, fatigue loads, and platform motions metrics,
these weighted averages will be expressed as a normalised value against the baseline to
find a percentage change as results are bound by the assumptions and limitations of the
simulation tools. Comparing results on a relative sense will give a clearer meaning to the
controller’s effect regardless of weather or not the simulation results are truly representative
of a physical wind turbine. However, in saying so, region 2 metrics will be compared
using the absolute values because the region transition is already a percentage value and
will give a clearer understanding of any change.
4. Controller Implementation and Testing
An initial simulation of the baseline, with waves and without waves, using a ramp wind
from 9.5 m/s to 13 m/s is shown in Figure 10. It shows that the effect of waves on the region
detection was pronounced with the waves causing a significant amount of switching between
the regions. This in turn affects the generator power capture by increasing the number of
power dips. These dips are caused by the waves resulting in the wind turbine pitching
forwards or backwards thus changing the apparent wind seen by the wind turbine. A further
explanation can be found in subsection 2.2. It can also be seen that the controller does not
operate in region 2.5 for any significant amount of time compared to the baseline without
waves. This means that the torque controller is causing a large change in torque command
each time there is a transition which causes large torque spikes or dips and thus affecting
the power capture. The difference in operating point can be seen in Figure 9. Simulations
using turbulent wind profiles shows the same characteristics with region transition occurring
17 % of overall time compared to 6.3 % without waves. This further emphasises the effect
waves have on region transition.
Thus, research into regulating the motions of the wind turbine, given wave disturbances,
and changing the transition logic has been performed to analyse their effect on region
transitions and power capture.
14
24. 0 20 40 60 80 100 120 140 160 180 200
0
10
20
Windspeed(m/s)
&Wave(m)
0 20 40 60 80 100 120 140 160 180 200
0
5000
Generatorpower
(kW)
0 20 40 60 80 100 120 140 160 180 200
1
2
3
Time (sec)
Region
Baseline with waves Baseline without waves
Figure 10 Baseline simulation with waves and without waves
Stol et al. [30] showed that individual blade pitching is effective in reducing tower side-side
fatigue loads by around 70 % compared to a reference turbine in above rated wind speeds.
For comparison, collective pitch only reduced loads by 25 %. In region 2, collective
pitch reduced tower for-aft loads by 70 %. These results arise from field tests using a
onshore CART rated at 600 kW. Therefore, these two control methods will be tested on an
offshore wind turbine to ascertain their effect on region transition, power capture, and load
mitigation. Blade pitch actuation will also be allowed in region 2 as well as 3 to allow
motion reduction regulation for a wider wind speed range.
4.1 Collective Pitch Proportional Control
A method to reduce the motions of the platform is the use of a positive feedback pro-
portional (P) controller. This is a SISO controller which takes in the platform pitching
velocity and applies a gain value to it. For example, if the platform is pitching forwards
(negative velocity), the gain applied will give a signal into the summing junction to reduce
the BP to provide a restoring thrust force. The output will then change the BP command
from the baseline resulting in an overall higher amount of blade usage. Figure 11 shows
a simplified model which was based off of research performed by Lazaro et al. [17]. The
BP signal required within the region selection control is taken before the subtraction of the
gain value to maintain the same region selection as the baseline so that only the effects of
the gain value are tested.
Wind
Turbine
Torque
Controller
Blade Pitch
Controller
Region Selection
Filtered generator speed
Generator
torque
Blade
pitch
+
gain
Pitching velocity
+
+
Figure 11 Simplified P control implemented in Simulink
15
25. A series of gains were selected based on 5 % of the maximum Cp value found on the
Cp envelop. Derivation of the Cp curve is explained in Appendix E. The first gain value
is selected based on the intersection of this Cp value and the Cp envelop and two other
values are selected relatively to this. This will give a broad view of how different gains
affect the motions. These are 0.0175, 0.0349 and 0.0524 rads which translates to 1, 2, and
3 degree of blade pitch actuation per deg/s of platform fore-aft motion.
4.1.1 Results and Discussion
In region 3, it was found from an initial analysis that the P controller is not effective in
reducing motion. While the BP controller is trying to regulate rotor speed, the signal from
the P controller cancels this and changes the rotor speed thus causing a different thrust on
the turbine. This, at times, results in no motion reduction occurring. This is evident in
Figure 12 where only some of the peaks are reduced while a majority is at the same level
as the baseline. Reduction in motion occurs only when there are a high pitching velocity
(seen as the peaks in the figure).
0 20 40 60 80 100 120 140 160 180 200
−4
−2
0
2
4
6
Time (sec)
Platformpitching
velocity(deg/s)
Baseline P Controller
Figure 12 Platform pitch response at a turbulent mean wind speed of 14 m/s
The gain that produced the highest reductions was 0.0524 rads. As expected RMS pitch
and RMS pitch rate reduced by 6-14 % and 12-27 % respectively. RMS roll and RMS roll
rate decreased by 7-17 % and 9-20 % respectively. There was no significant change to yaw
as expected as no unsymmetrical loads are produced with collective pitching. As a result
of the reduced motion, the fore-aft DEL and SS DEL both reduced by 9-14 % and 5-11 %
respectively. There was higher blade usage (as high as 97 % more). Consequently, the
blade flap DEL increased, by around 2-8 %, as expected, as a higher amount of thrust is
produced to reduce the pitching motion of the wind turbine. The LSS DEL reduced by
6 % for all gain values.
There was improvement using all the gains in region transition, again with the gain of
0.0524 rads being the best performer. There were small improvements in all wind speed
bins with overall time spent in transition varying from 16-14 %, for each respective gain,
compared to 17 % using the baseline. A bar graph showing the performance metrics can
be found in Figure D1 in appendix D.
4.2 Individual Blade Pitch Control
Individual blade pitching causes an unsymmetrical loading on the blades in the rotor plane.
This will induce a moment about the nacelle which causes a motion of the wind turbine. To
implement this a negative feedback MIMO control that actuates each blade independently
is used. Figure 13 shows a simplified model of the implementation in Simulink. It can be
16
26. Wind
Turbine
Torque
Controller
Blade Pitch
Controller
Region Selection
Filtered generator speed
Generator
torque
Blade
pitch
MIMO Motion
Reduction Controller
x
uΔθΔTgen
+_
+_
Figure 13 Individual blade pitch control diagram
seen that this controller is decoupled from the baseline which allows the MIMO to only
regulate motion and thus region selection will be maintained by the baseline alone.
This controller requires the azimuth angle (ψ) to be known. However, because the system
is highly periodic, a coordinate transformation is required to transform the dynamics in the
rotating frame into a fixed frame of reference [9, 17, 31]. This is known as a multi-blade
coordinate transformation (MBC). The transformed system is not time-invariant. However,
Stol et al. found that averaging the resultant state matrices does not result in loss of
information [30]. The result of the transformation and averaging is the linear time invariant
(LTI) system given in equation 3 where the subscript refers to non-rotating frame, ∆ is a
term for perturbations, x are the states, u are the inputs, and y are the outputs. A, B, C,
and D are averaged linear state-space matrices.
∆ ˙xNR = A∆xNR+ B∆uNR
∆yNR
= C∆xNR+ D∆uNR
(3)
Individual blade pitching is then achieved when the new coordinates are transformed back
into a rotating frame of reference. The new coordinates are called collective (θc), cosine-
cyclic (θcc), and sine-cyclic (θsc) which are then transformed to give the three commanded
BP angles θ1, θ2, and θ3 as given in equation 4.
θ1
θ2
θ3
=
1 cos(ψ) sin(ψ)
1 cos(ψ + 2π/3) sin(ψ + 2π/3)
1 cos(ψ + 4π/3) sin(ψ + 4π/3)
θc
θcc
θsc
(4)
The MIMO control is designed as a full-state feedback (FSFB) controller that utilises
linear quadratic regulation (LQR). A characteristic quadratic cost function (J) is required
to describe the relationship between state regulation objectives and control actuations. The
solution which fulfils the FSFB control law is the LQR controller. FSFB works by taking
in a vector of system states and passing it through a gain matrix. These are then passed
as inputs into the systems.
The states used were produced using FAST’s linearisation function. Different states required
can be selected based on which DOF are active. FAST linearised the system until a
steady state was achieved. The periodic equation was then calculated and the linearisation
and operating points were found [24]. This work used eight states which are the three
displacements and velocities of the roll, pitch, and yaw as shown in equation 5. The
azimuth angle and generator speed was required in order to complete linearisation.
17
27. x = θroll θpitch θyaw ψ ωroll ωpitch ωyaw Ωgen
T
(5)
Because we are only interested in regulating the motions of the platform, the output vector
(equation 6) is used in cost function given in equation 7. Q and R are weighting matrices
and depends on the control objectives. The augmented matrix QNR used in the cost function
is related to QNR shown in equation 8. This shows the interaction between the C matrix,
the output signals, and the states. LQR tools in MATLAB was used to calculate the gains
matrix required to minimise the cost function and ensure system stability. Gains for ψ and
Ωgen are set to zero so that there will not be conflicting regulation against the baseline.
y = θroll θpitch θyaw ωroll ωpitch ωyaw
T
(6)
J =
∞ˆ
0
yT
NR
QNRyNR
+ uT
NRRNRuNR dt (7)
QNR = CT
NRQNRCNR (8)
4.2.1 Linearisation and Weighting
From an initial analysis of individual blade pitching using a single linearisation point at
14 m/s, it became apparent that operations in region 2 was not effective because of the
different control goals in each region. Therefore two linearisation points are used, one
point at 8 m/s and the other at 14 m/s. This is based off of work done by Stol et al. [32],
who linearised at 8 and 18 m/s. 14 m/s was chosen as the linearisation point for this work
as it was closer to region transition and it was reasoned that the closer operating point
would improve performance. Stol et al. used the rotor speed to determine which operating
point to use while this work will use the region selection, which is a function of rotor
speed.
The tuning of the controller was performed individually for each operating point. The
goal of the process was to reduce fluctuations in the rotor speed thus improving the signal
required for region selection. Tower fore-aft pitching velocity had a higher weight than the
roll and yaw velocities to make the reduction of the pitching velocity the objective. The
weights on the displacements of the wind turbine were required to be significantly lower
than the velocity values because displacement regulation requires a significant amount of
actuation. Thus, using higher weights would destabilise the system. For the region 2
operating point, the input regulation matrix placed a higher weight on the torque value and
collective pitch to reduce torque utilisation and thus reduce disturbances to the baseline
torque controller. Region 3 had equal weights allowing torque to be used more readily.
4.2.2 Results and Discussion
Simulation results showed that there was motion reduction but this resulted in higher loads
on the tower and blades. There was a significant reduction in RMS yaw and RMS yaw
rate at 42 % and 53 % respectively. This is an improvement over using just a P controller
in subsection 4.1 because the MIMO is active in regulating yaw while the P controller’s
sole purpose was to try reduce pitch. RMS roll decreased by 17 % and RMS roll rate
decreased by 10 %. The RMS pitch saw the smallest decrease at 9 % while the RMS pitch
18
28. rate decreased by 17 %. This was unexpected as the weighting placed on platform pitching
rate prioritised its regulation, and currently, the reason for this is unknown. Compared
to the P controller, the reductions in roll and pitch were not as significant. This may be
attributed to the fact that the MIMO also has to regulate yaw which affects how the wind
turbine moves in the pitch and roll direction.
There were both increases and decreases in loads with the tower SS DEL seeing a significant
increase of 32 %. There was a higher max pitch rate (blade actuation) weighted average
meaning that there are a higher number of actuations at lower wind speeds. The increase in
max pitch rate coincides with a much higher RMS pitch rate which means that there was a
significantly higher amount of blade movements. This is expected because individual blade
pitching requires higher blade actuation. Because of this, the blade flap DEL increased by
17 % as there was a greater amount of rotor thrust produced to mitigate motion. Tower
fore-aft DEL and LSS DEL both saw a reduction of 9 % and 3 % respectively.
Individual blade pitching shows improvement in power capture with a reduction of 15 % in
RMS power error as a result of less power dips. Although the controller spent an overall
higher amount of time in region 2 (63 % of total time compared to 61 %), power captured
decreased from 257.55 kWh to 246.55 kWh. This is believed to be because the MIMO
is causing a small reduction in torque command and thus a reduction in power capture.
The efficiency was similar at around 79 %. Transition time reduced marginally for each
wind speed bin with an overall transition time reducing from 17 % of total time to 15 %.
This small change in region transition may be due to the fact that there was only a small
amount of platform reduction. A bar graph of the metrics can be found in Figure D2 in
Appendix D.
Compared against the P controller, individual blade pitching allows greater regulation of
power. However it experiences lower load reductions in fore-aft and LSS, and an increase
in SS loading. Motions in roll and pitch are not attenuated as well. However, there
may be improvements in these areas if greater tuning was done or a gain schedule was
implemented [33]. Transition time was similar between the two suggesting that loads and
power regulation sees the greater affect depending on the type of controller.
4.3 Alternative Torque Trajectories
Changing the trajectory that the torque follows as the generator speed varies is an idea that
was suggested by Bianchi [11] as explained in subsection 2.1. The generalised shape of
this new trajectory is given in Figure 5 by AB’C’C. Five different trajectories were made,
based off of the generalised shape, to analyse its effect on region transition. Each had
varying slopes and range where the torque is held at the rated value. Figure 14 shows an
example of the curve overlaid on top of the baseline for comparison and Table 3 shows
the characteristics of each of the five curves. The start of region 2 torque command is the
same as that commanded from the baseline. When it reaches a specified generator speed,
the torque is then commanded linearly up to rated torque which is the beginning of region
2.5. As shown in Figure 14, region 2.5 is now over a larger range. By extending region
2.5 and holding it at constant torque, transition between region 2.5 and 3 will not actuate
the torque as quickly compared to the baseline (the baseline changes torque dramatically
around rated generator speed) and so there will be less torque dips and smoother transition
leading to improved power generation. This is evident in Figure D7 in Appendix D.
19
29. y = 175.17x - 149596
0
5000
10000
15000
20000
25000
30000
35000
40000
45000
50000
600 700 800 900 1000 1100 1200 1300
Generatortorque(Nm)
Generator speed (rpm)
Baseline curve Baseline Region 2 and 2.5
Rated Gen speed and torque New Trajectory
New region 2 New 2.5
Baseline 2.5
Figure 14 Trajectory 1 curve against baseline
Table 3 Trajectories characteristics
Trajectory Intersect with Baseline
Curve (rpm)
Intersect with Region 2
(rpm)
Slope Equation
1 1000 1100 Tgen = 175.17Ωgen − 149596
2 950 1100 Tgen = 133.41Ωgen − 103653
3 1050 1100 Tgen = 297.91Ωgen − 284611
4 1071.7 1150 Tgen = 175.20Ωgen − 158389
5 930.399 1050 Tgen = 175.20Ωgen − 140862
4.3.1 Results and Discussion
Using the different torque trajectories showed that there was vastly improved region trans-
ition. There is a noticeable reduction in large region transition compared to the baseline as
shown in Figure 16 which leads to fewer torque dips and thus improved power regulation.
All five trajectories showed that region transition time was, at most, 11 % of total time or
less compared to the baseline of 17 %. Figure 16 shows average percentage of time spent
within region 2, 3, or in transition for trajectory 2. It can be seen that there was marked
improvement in region transition up to 13 m/s, with smaller improvement thereafter. As
shown, the transition is a lot smoother around rated wind speed of 11.4 m/s, resulting in
an overall time spent in transition of 9 %. Overall reduction is shown by the reduction of
the grey area in Figure 16. Trajectory 5 showed the most improvement in overall region
transition, spending only 7 % of total time switching. Trajectory 4 was the worst performer
at 11 %. The reduced transition time translates to an increase in time spent in region 2
and thus power captured. Trajectory 4 had the lowest reduction in region transition and
so had the least increase in power captured, whereas trajectory 5 saw the largest increase
(321.22 kWh compared to baseline of 239.12 kWh).
For all trajectories there was improvement in the region 3 metrics as time spent in this
region increased also. On average, there was around 5 % improvement in RMS power
20
30. error, 3 % improvement in RMS speed error and 4 % improvement in RMS torque error.
Trajectory 4 was again the worst performer of the trajectories with less reductions. For the
RMS power error there was only a 1 % reduction while RMS speed and RMS torque error
saw no change from the baseline. In general, there were less actuations of the blades with
up to 21 % reduction shown by trajectory 5. Trajectory 4 showed the least reduction with
4 %.
For the loads only the blade flap DEL, tower fore-aft, and tower SS saw some improve-
ments. There was an increase in loads of 3 % for the LSS using trajectory 3, and 1 %
using trajectory 5. Trajectory 2 saw a 3 % decrease and the other two saw a 1 % decrease.
There was an increase in RMS pitch of 1 % for all trajectories while there was a decrease
of 1-2 % in yaw for trajectories 2, 3 and 5. RMS roll saw the largest increase with the
highest at 12 % for trajectory 5. Trajectory 4 was the lowest with a 3 % increase. This
increase is due to a higher generator torque usage, where the torque causes a moment about
the nacelle. Bar graphs of metric comparisons can be found in Figures D3, D4, D5, D6 in
Appendix D as well as a figure showing how the increase in generator torque affects roll
(Figure D7).
Trajectory 2 is deemed to be the best solution of the five. This is because it had the
highest performance improvements without sacrificing any increase in loads. However, if
a slight increase in a load (1 % increase in LSS DEL) was permissible then trajectory 5
would be the best. It had the least time spent in transition (7 % time spent instead of
9 % of trajectory 2) with similar load reductions relative to trajectory 2 with variations of
1 % between the two. Trajectory 5 saw a small increase in captured energy in region 2
(321.22 kWh compared to 313.64 kWh) as a result of the decreased time spent in transition.
From these results, a longer region 2.5 aids in lowering region transition, blade usage and
improving power captured. However using a larger region 2.5 causes less reductions in
loads and motions. The effect of the slope, however, is not as easy to determine.
0 20 40 60 80 100 120 140 160 180 200
0
5000
Generatorpower
(kW)
Baseline Trajectory 2
0 20 40 60 80 100 120 140 160 180 200
0
50
Generatortorque
(kNm)
0 20 40 60 80 100 120 140 160 180 200
2
2.5
3
Time (sec)
Region
Figure 15 Trajectory 2 time series plot in turbulent wind with mean speed of 11 m/s
4.4 Linearised Torque Trajectory
FAST has the capability to linearise about a predetermined number of operating points
to find steady state operating values. Therefore a series of linearisation were performed
21
31. 0%
20%
40%
60%
80%
100%
8 9 10 11 12 13 14
Average%oftime
Wind Speed (m/s)
Region Transition
Region 3
Region 2
0%
20%
40%
60%
80%
100%
8 9 10 11 12 13 14
Average%oftime
Wind Speed (m/s)
Region Transition
Region 3
Region 2
0%
20%
40%
60%
80%
100%
8 9 10 11 12 13 14
Average%oftime
Wind Speed (m/s)
Region
Transition
Region 3
Region 2
(a) Baseline
0%
20%
40%
60%
80%
100%
8 9 10 11 12 13 14
Average%oftime
Wind Speed (m/s)
Region Transition
Region 3
Region 2
0%
20%
40%
60%
80%
100%
8 9 10 11 12 13 14
Average%oftime
Wind Speed (m/s)
Region Transition
Region 3
Region 2
0%
20%
40%
60%
80%
100%
8 9 10 11 12 13 14
Average%oftime
Wind Speed (m/s)
Region
Transition
Region 3
Region 2
(b) Trajectory 2
Figure 16 Trajectory 2 transition plot against baseline
using constant wind profiles from 5-11 m/s to find the generator torque value that the wind
turbine ideally operates at during steady state. This was done to see if using the steady state
values to generator a torque curve would improve performance in turbulent winds. Three
DOF were used; the generator DOF, surge, and fore-aft pitching. The last two platform
DOF were used to simulate the floating platform and to find the steady state position.
This has an effect on the wind speed seen by the wind turbine and thus the steady state
generator torque value. Yaw DOF was ignored because its effect is minimal and the roll
DOF was ignored because roll has very little damping and thus will not reach a steady
state solution. Figure 17 shows the linearised points overlaid on top of the baseline. The
linearised points used to plot this graph were obtained from the linearisation at 8-11 m/s
(the second to fourth crosses in Figure 17). Points below these linearisation values (those
obtained at 5-7 m/s) fell into region 1.5 and were ignored. The intersection into region 1.5
(the triangle mark in the figure) was found using a second order quadratic fit (not shown in
the figure) of all the linearised points. As shown, using the linearised points to determine
how the torque command behaves results in an earlier entrance into region 2 compared
to the baseline. Region 2.5 is now narrower as well. At the lower generator speeds,
synonymous with lower wind speeds (8-9 m/s), the linearised torque command follows a
shallower path while at higher wind speeds (10-11 m/s) it is a step higher compared to the
baseline. From 9-10 m/s there is a large increase in torque command suggesting that the
turbine would prefer operating at a higher generator torque from this point onwards. The
linearised value at 11 m/s lies on the baseline region 2.5 slope suggesting that the baseline
allowed the turbine to operate at its optimal state for this wind speed.
To implement this within Simulink®
a 1-dimensional look-up table was produced which took
in the generator rotor speed and finds the linearised generator torque value. Interpolation
between linearised points were performed using MATLAB®
’s inbuilt linear interpolation
method.
4.4.1 Results and Discussion
Following turbulent testing, the improvements found from a preliminary test, using constant
winds with no waves, were not matched up in turbulent winds. It was found that there
were largely no significant changes in loads and power capture. However, there was a
3% improvement in region transition as shown in Figure 18. The reduction was most
evident around the transition region (10.2-11.4 m/s) leading to a higher amount of time
22
32. Baseline curve Rated Gen speed and torque
Linearised points Baseline Region 2 and 2.5
New Region 2
Baseline Region 2
New 2.5
Baseline 2.5
Figure 17 Linearised torque trajectory against baseline
spent in region 2. Because of this, region 2 captured energy increased from 239.12 kWh to
264.29 kWh. Combined with a 2 % reduction in RMS power error, overall power capture
would have increased slightly. There were no significant improvements to loads and a 3%
increase in RMS roll motion. From these results it can be surmised that using the steady
state operating points found from linearisation does not offer significant improvements to
power capture and load reduction. Figure D8 in Appendix D shows a graph of the metrics.
These results show that using linearisation points to determine a torque trajectory is not
as effective in reducing region transition, improving power capture and loads, as using a
trajectory from subsection 4.3. Results also reinforces that a short region 2.5 is ineffective.
0%
20%
40%
60%
80%
100%
8 9 10 11 12 13 14
Average%oftime
Wind Speed (m/s)
Region Transition
Region 3
Region 2
0%
20%
40%
60%
80%
100%
8 9 10 11 12 13 14
Average%oftime
Wind Speed (m/s)
Region Transition
Region 3
Region 2
0%
20%
40%
60%
80%
100%
8 9 10 11 12 13 14
Average%oftime
Wind Speed (m/s)
Region
Transition
Region 3
Region 2
(a) Baseline
0%
20%
40%
60%
80%
100%
8 9 10 11 12 13 14
Average%oftime
Wind Speed (m/s)
Region Transition
Region 3
Region 2
0%
20%
40%
60%
80%
100%
8 9 10 11 12 13 14
Average%oftime
Wind Speed (m/s)
Region Transition
Region 3
Region 2
0%
20%
40%
60%
80%
100%
8 9 10 11 12 13 14
Average%oftime
Wind Speed (m/s)
Region
Transition
Region 3
Region 2
(b) Linearised torque
Figure 18 Baseline and linearised torque region transition plot
4.5 Combined Implementation
A model was made using a combination of trajectory 2 and the individual blade pitch
control to analyse how the two would interact with each other to see if there would be
23
33. 0%
20%
40%
60%
80%
100%
8 9 10 11 12 13 14
Average%oftime
Wind Speed (m/s)
Region Transition
Region 3
Region 2
0%
20%
40%
60%
80%
100%
8 9 10 11 12 13 14
Average%oftime
Wind Speed (m/s)
Region
Transition
Region 3
Region 2
(a) Baseline
0%
20%
40%
60%
80%
100%
8 9 10 11 12 13 14
Average%oftime
Wind Speed (m/s)
Region Transition
Region 3
Region 2
0%
20%
40%
60%
80%
100%
8 9 10 11 12 13 14
Average%oftime
Wind Speed (m/s)
Region
Transition
Region 3
Region 2
(b) Combined implementation
Figure 19 Region transition plot of combined implementation against baseline
further improvements. These two were selected as they showed good improvement in
region transition and power capture. Results showed that there was a further reduction in
time spent in transition using a combined approach. Figure 19 shows the improvement in
region transition, across all wind speeds, now only spending 7 % of total time transitioning
compared to 8 % for trajectory 2 alone and 10 % for individual blade pitching alone. It
is interesting to note that the controller spends the most time transitioning at 13 m/s wind
speeds, showing that the controller influence is greatest around rated wind speeds. This
improvement to region transition is very similar to trajectory 2’s shown in Figure 16.
Figure 20 shows the two control methods work together constructively to improve power
capture in region 3 as seen in the RMS power error with a drop of 19 %. Where the loads
or motions for a control was higher than the other, the combined control would often be
in between the two. For example, the tower SS, RMS roll, RMS pitch and their respective
RMS rates were not the highest or the lowest. Tower fore-aft DEL and LSS DEL fell
by 9 % and 7 % respectively which was not as high as using individual blade pitching
alone. There was an increase in tower SS DEL which was 22 % higher than the baseline.
However it can been seen that the combined control reduced the effect compared to using
individual alone. In region 2, there was a higher amount of energy captured at 314.51 kWh
compared to 257.55 kWh of the baseline, at a higher efficiency of 83.33 % compared to
79.64 %. This was also higher than using individual blade pitching or the trajectory as a
stand alone. A bar graph of the metrics against the baseline can be found in Figure D9,
and an example time series result in Figure D10 in Appendix D.
These results show that improvements to region transition and power capture can be made
using a combination of changes to the torque controller and blade pitch controller.
5. Conclusions
The objectives of this project was to improve region transition, power capture, and reduce
loads. From the simulations it was found that:
• The use of an alternative torque trajectory was found to reduce region transition the
most while improving power capture. Region transition fell by as much as 7 %, with
the most effective trajectory resulting in only 7 % of time spent transitioning.
• Power captured in region 2 increased as a result with an increase as high as 82.1 kWh
24
34. 1.00
1.00
1.00
1.00
1.00
1.00
1.00
1.00
1.00
0.93
0.93
1.00
0.97
0.93
1.10
1.02
1.10
1.03
0.85
0.96
0.91
1.32
0.97
0.83
0.91
0.90
0.83
0.81
0.92
0.91
1.22
0.93
0.92
0.92
0.97
0.85
0.00
0.20
0.40
0.60
0.80
1.00
1.20
1.40
RMS Power
Error
RMS Speed
Error
Tower FA
DEL
Tower SS
DEL
LSS DEL RMS Roll RMS Pitch RMS Roll
Rate
RMS Pitch
Rate
Power and Speed Platform Motions
Baseline Trajectory 2 Individual BP Combined Control
Figure 20 Comparison graph of the combined control against baseline and its respective individual controls
over the baseline (239.12 kWh). Using motion reduction, power captured in region 2
reduced relative to the baseline as a result of changes to the blade pitch in region 2.
• Power captured improved most using individual blade pitching with a reduction of
RMS power error of 15 %.
• Loads on the tower reduced the most using a P controller with a gain of 0.0525 rads.
The fore-aft DEL reduced by 14 %, SS DEL reduced by 11 %, and LSS DEL reduced
by 6 %.
• Using a combination of individual blade pitching and trajectory 2 resulted in higher
energy captured in region 2 and 3 compared to using each control alone. Transition
time reduced as well.
• The two controllers worked together to cancel out their respective load extremes
resulting in the combined controller loads being between the two loads of each
controllers.
6. Future Works
• Testing of the logic presented in this work on different platform configurations to
determine if similar results can be obtained.
• Perform tuning of the alternative torque trajectory to find an optimal trajectory based
on power optimisation or load minimisation.
• Linearise about a greater number of points to determine a torque trajectory with
greater resolution to ascertain if improvements can be made.
• Research methods to reduce SS loading for the individual BP controller.
• Conduct design and research into a gain scheduled individual BP controller.
• Utilise MPC on individual BP controller and baseline BP controller.
25
35. References
[1] Monthly Electricity Statistics: February 2014. International Energy Agency. Retrieved
July 1, 2014 from:
http://www.iea.org/stats/surveys/mes.pdf.
[2] Global Wind Report–Annual Market Update 2012. Global Wind Energy Council.
[3] Project Details for Vindeby. 4C Offshore. Retrieved September 2, 2014 from:
http://www.4coffshore.com/windfarms/vindeby-denmark-dk06.
html.
[4] Global Offshore. Global Wind Energy Council. Retrieved July 1, 2014 :
http://www.gwec.net/global-figures/global-offshore/.
[5] Sawyer, S. (2013). Floating Wind Power: The Next Wave? Energy Focus Journal.
Retrieved July 1, 2014 from:
http://www.gwec.net/wp-content/uploads/2013/09/
The-Next-Wave-9-2013.pdf, September.
[6] Offshore wind. Europena Environment Agency. Retrieved July 1, 2014 from:
http://www.ewea.org/policy-issues/offshore/.
[7] Jonkman, J. M. (2007). Dynamics modeling and loads analysis of an offshore floating
wind turbine. PhD thesis, University of Colorado.
[8] Wang, C. M., Utsunomiya, T., Wee, S. C., and Choo, Y. S. (2010). Research on
floating wind turbines: a literature survey. The IES Journal Part A: Civil Structural
Engineering, 3(4), pp. 267–277.
[9] Namik, H. (2012). Individual Blade Pitch and Disturbance Accommodating Control
of Floating Offshore Wind Turbines. PhD thesis, The University of Auckland.
[10] Sclavounos, P. D. Floating Wind Turbines. Lecture Powerpoint, Laboratory for Ship
and Platform Flows (LSPF), Department of Mechanical Engineering, Massachusetts
Institute of Technology. Retrieved May 28, 2014 from :
http://web.mit.edu/windenergy/windweek/Presentations/P6%
20-%20Sclavounos.pdf.
[11] Bianchi, F., de Battista, H., and Mantz, R. (2006). Wind Turbine Control Systems:
Principles, Modelling and Gain Scheduling Design. Advances in Industrial Control.
Springer, London, England. pp. 2, 19–21, 68–78.
[12] Rezaei, V. (2014). Active robust control of wind turbines. PhD thesis, Colorado School
of Mines.
[13] Aho, J., Pao, L., and Hauser, J. (2013). Optimal trajectory tracking control for wind
turbines during operating region transitions. In American Control Conference (ACC),
2013, IEEE, pp. 1424–1429.
[14] Lindeberg, E., Svendsen, H. G., and Uhlen, K. (2012). Smooth transition between
controllers for floating wind turbines. Energy Procedia, 24, pp. 83–98.
[15] Pao, L. Y., and Johnson, K. E. (2011). Control of wind turbines. Control Systems,
IEEE, 31(2), pp. 44–62.
26
36. [16] Lackner, M. A. (2009). Controlling Platform Motions and Reducing Blade Loads for
Floating Wind Turbines. Wind Engineering, 33(6), pp. 541–553.
[17] Lazaro, J. K., Chakiath, M. J., Stol, K. A., and Namik, H. (2010). A study of dynamic
coupling and composite load control for wind turbines. In 48th AIAA Aerospace
Sciences Meeting, pp. 1–9.
[18] Bottasso, C., Croce, A., Nam, Y., and Riboldi, C. (2012). Power curve tracking in
the presence of a tip speed constraint. Renewable Energy, 40(1), pp. 1–12.
[19] Bossanyi, E. (2000). The design of closed loop controllers for wind turbines. Wind
energy, 3(3), pp. 149–163.
[20] Bossanyi, E. (2009). Controller for 5MW reference turbine. Tech. Rep. 11593/BR/04,
Garrad Hassan and Partners Limited.
[21] Laks, J. H. (2013). Preview Scheduled Model Predictive Control For Horizontal Axis
Wind Turbines. PhD thesis, University of Minnesota.
[22] Spencer, M. D., Stol, K. A., Unsworth, C. P., Cater, J. E., and Norris, S. E. (2013).
Model predictive control of a wind turbine using short-term wind field predictions.
Wind Energy, 16(3), pp. 417–434.
[23] Jonkman, J. NWTC Computer-Aided Engeering Tools: FAST. Retrieved July 2, 2014
from:
http://wind.nrel.gov/designcodes/simulators/fast/.
[24] Jonkman, J. M., and Buhl Jr, M. L. (2005). FAST user guide. Golden, CO: National
Renewable Energy Laboratory.
[25] Jonkman, J. M., Butterfield, S., Musial, W., and Scott, G. (2009). Definition of a
5-MW reference wind turbine for offshore system development. National Renewable
Energy Laboratory Golden, CO.
[26] Zuo, S., Song, Y., Wang, L., and Song, Q.-W. (2013). Computationally Inexpensive
Approach for Pitch Control of Offshore Wind Turbine on Barge Floating Platform.
The Scientific World Journal, 2013, pp. 1–9.
[27] Wright, A. D. (2004). Modern Control Design for Flexible Wind Turbines. Tech. Rep.
NREL/TP-500-35816, National Renewable Energy Laboratory.
[28] Wind Turbines - Part 3: Design Requirements for Offshore Wind Turbines. Interna-
tional Electrotechnical Commission (IEC), 61400-3 Ed. 1 (2009).
[29] Wind Turbines - Part 1: Design Requirements. International Electrotechnical Commis-
sion (IEC), 61400-1 Ed. 3 (2005).
[30] Stol, K. A., Zhao, W., and Wright, A. D. (2006). Individual blade pitch control for
the controls advanced research turbine (CART). Journal of solar energy engineering,
128(4), pp. 498–505.
[31] Stol, K. A., Moll, H.-G., Bir, G., and Namik, H. (2009). ‘A Comparison of Multi-Blade
Coordinate Transformation and Direct Periodic Techniques for Wind Turbine Control
Design’, paper presented at the 47th AIAA Aerospace Sciences Meeting Including the
New Horizons Forum and Aerospace Exhibition, Orlando, Florida, 5-8 January.
27
37. [32] Stol, K., and Fingersh, L. (2004). Wind turbine field testing of state-space control
designs. Tech. Rep. NREL/SR-500-35061.
[33] Kumar, A., and Stol, K. (2009). Scheduled model predictive control of a wind turbine.
In Proc. AIAA/ASME Wind Energy Symp, pp. 1–18.
[34] Hau, E. (2006). Wind Turbines : Fundamentals, Technologies, Application, Economics,
2nd ed. Springer, New York; New York. pp. 45–59.
28
38. Appendix A Simulink Model and FAST diagram
Control System
Wind-
Inflow
Aero-
dynamics
Rotor
Dynamics
Drivetrain
Dynamics
Power
Generation
Nacelle Dynamics
Tower Dynamics
Waves &
Currents
Hydro-
dynamics
Platform Dynamics
Mooring Dynamics
Figure A1 FAST relationships with different modules [9].
Figure A1 shows the interactions between FAST and the AeroDyn, and HydroDyn modules.
A detailed view of the Simulink model that controls the 5 MW NREL wind turbine coupled
with the FAST interface is shown in Figure A2 [9]. This is an example of SISO. The
pitch controller takes in only one disturbance input and it tries to regulate this to a set
point (rated generator rotational speed) by commanding the collective pitch of the blades.
Given initial conditions for the rotor speed, blade pitch and platform position, FAST will
process a specified wind profile and model the behaviour of the wind turbine to this wind.
The model will then extract the generator speed which is then passed onto the operating
region block, and the torque and pitch controller. The controllers will try to maximise
power capture or maintain constant power capture according to which region the controller
thinks it is in. These control inputs are passed into FAST where it will calculate loads and
the associated effects that the inputs will have on other behaviours of the turbine. The yaw
controller is there as a place holder and has no effect on the wind turbine.
29
40. Appendix B Design Load Cases
This appendix is a collection of the parameters used to generated the turbulent wind profiles
and wave conditions. These are then used for DLC analysis done in accordance to the IEC
61400-3 standard [28]. These wind and wave profiles were kindly given by Dr. Hazim
Namik of the University of Auckland but can be obtained easily using TurbSim and the
HydroDyn module of FAST. These are shown below in table B1 . Each wind speed bin
has 6 different wind and wave profiles in accordance to IEC 61400-1 standard [29].
Table B1 Wind speed bins and the parameters for each DLC
Wind
Speed Bin
(m/s)
Wind
Random
Seed 1
Wind
Random
Seed 2
Wave
Height
(m)
Wave
Periods
(s)
Wave
Random Seed
1
Wave
Random Seed
2
8
5411384 1483177
1.9
9.944 1523349375 255545576
5296326 1457810 11.929 1620677309 1070228652
5181267 1432443 13.914 592759340 2061034457
5066209 1407076 15.900 1459650384 730972782
4951151 1381710 17.885 1406812251 1256852925
4836093 1356343 19.870 349206043 480632481
9
4721035 1330976
2.1
10.272 1613333725 1175136402
4605977 1305610 12.307 547812589 297693725
4490919 1280243 14.343 1086534495 320606436
4375861 1254876 16.379 1501255830 552994765
4260803 1229509 18.414 1913200166 1805426559
4145745 1204143 20.450 2060062649 546066822
10
4030687 1178776
2.2
10.613 1748663348 1322945868
3915629 1153409 12.581 522965888 1016380064
3800570 1128042 14.548 1995578435 755183041
3685512 1102676 16.515 751584415 1784190892
3570454 1077309 18.483 422185086 1256845065
3455396 1051942 20.450 539198480 1180522460
11
3340338 1026575
2.3
10.921 1969658395 162895847
3225280 1001209 12.827 613834619 115856998
3110222 975842 14.733 1626075110 1139879065
2995164 950475 16.638 1618620905 1673248885
2880106 925108 18.544 817001235 2005772671
2765048 899742 20.450 1219387688 278971459
12
2649990 874375
2.6
11.400 1221539510 668329214
2534932 849008 13.002 1008008726 1135016266
2419873 823641 14.604 25559500 355727938
2304815 798275 16.206 723965366 1292746375
2189757 772908 17.808 348283855 564726534
2074699 747541 19.410 1705713063 1404624168
Continues to next page...
31
42. Appendix C Weibull Weighted Average
A weighted average of performance is used because the wind speed varies at a given
site. For this project the Weibull distribution and parameters used is based from real data,
collected between 1993 to 1997, from the Vindeby offshore wind farm in Denmark. This
is the same distribution used by Namik [9]. Data from Scotland was not available so this
was the chosen site. Figure C1 shows the Weibull distribution as well as the distribution
of wind throughout a year. This matches closely with the distribution of the scaling factors
which is expected. The more time a particular wind speed spends within a wind speed for
a given year, the higher the weighting will be and so the overall effects of the different
wind speeds on the performance of the turbine will be appropriately averaged. Table C1
shows a tabulated form of the scaling values that were of interest for this project. These
were kindly provided by Dr. Hazim Namik. Following is a brief explanation of how the
factors were obtained and a more complete explanation can be found in [9].
0 5 10 15 20 25
0
0.2
0.4
0.6
0.8
1
Wind speeds (m/s)
Scalingfactor
0 5 10 15 20 25
0
2
4
6
8
10
Percentagetimeofyear
Scaling Factor
Percentage of time
Figure C1 Weibull Distribution
The shape of the Weibull distribution is given by equation C1 where F(U) is the ratio of
time that the mean wind, in an hour, exceeds U, c is the scaling parameter, and k is the
shape factor. The percentage time spent in a wind speed bin (in a year) with a range from
U − 0.5 m/s to U + 0.5 m/s can be found using equation C2. The Weibull parameters k and
c are 2.3 and 9.1 respectively [9].
F(U) = exp(−(U/c)k
) (C1)
33
43. Table C1 Weibull scaling values
Wind Speed Bin Scaling Value
8 1.0000
9 0.9670
10 0.8939
11 0.7915
12 0.6724
13 0.5484
14 0.4297
Tu = (F(U − 0.5) − F(U + 0.5)) × 100 (C2)
The scaling factors, si, used in equation C3 is then found by normalising the all the Tu
values by the maximum Tu. This gives the highest weighting to the most dominant wind
speed bin. The overall performance metric, po, can then be calculated where pi is the
averaged performance within a wind speed bin, i is the current wind speed bin, and n is
the total number of wind speed bins [9].
po =
n
i =1
sipi
n
i =1
si
(C3)
34
44. Appendix D Results Graphs and Plots
This section gives more detailed representations of the results and plots used to analyse
simulation data. The bar graphs are all normalised to the baseline unless otherwise stated.
Bar graphs showing normalised results for region 3 metrics, loads and motions for the
trajectories can be found below. Region 2 metrics and transition time graphs are shown in
absolute values.
Figure D1 shows the performance for the P controller. Figure D2 shows the performance
for the individual blade pitch controller.
Figure D3 shows the various reductions in transition time for the different torque trajectories.
Figure D4 is a comparison of region 2 performance for the trajectories and Figures D5
and D6 shows the region 3 metrics, loads, and motions for the trajectories. The affect of
the generator torque on roll can be found in Figure D7. The comparison is made between
using trajectory 4, which had the shortest region 2.5 region, against trajectory 5 which
had the largest. This resulted in the RMS roll for trajectory 4 being the closest to the
baseline. Trajectory 4’s torque response is similar to that of the baseline, with smaller
peaks than trajectory 5. This resulted in smaller peaks in roll and thus a lower RMS roll
value. Another feature of holding region 2.5 wider is that there are no torque overshoots
resulting in better regulation.
Figure D8 is the bar graph of the region 3 performance metrics, loads, and motions of the
linearised torque trajectory against the baseline. The region 2 metrics have been omitted
from the linearised torque metrics graph as they were given in subsection 4.4.
The metrics comparison graph for the combined controller can be found in Figure D10
and a time series plot can be found in Figure D10. The time series plot shows how
well the controls track power capture around rated. Compared to the baseline, there are
significantly less dips in power capture because of less transitions. The individual blade
pitch actuations are also evident showing the vast amount of changes in angle for each
individual blade shown in the blue, black, and dash green coloured lines. Overall tracking
was the same as the baseline in winds above rated, while around rated, the blade pitches do
not quickly actuate to 0º
as much. This helps in reducing region transition and improving
power capture. This is evident each time there is a change to 0º
BP.
35