Energy Expenditure atRest
Energy Expenditure at Rest
Basal Metabolic Rate
Basal Metabolic Rate
BMR is rate of energy expenditure during fasted,
BMR is rate of energy expenditure during fasted,
rested and supine conditions in thermoneutral
rested and supine conditions in thermoneutral
environment
environment
Resting metabolic rate (RMR) is rate of energy
Resting metabolic rate (RMR) is rate of energy
expenditure when at rest but not basal
expenditure when at rest but not basal
BMR proportional to BSA, after age 20 , 2% & 3%
BMR proportional to BSA, after age 20 , 2% & 3%
per decade in women and men, respectively
per decade in women and men, respectively
BMR represents largest fraction of TEE in sedentary
BMR represents largest fraction of TEE in sedentary
people
people
3
4.
Energy Expenditure atRest
Energy Expenditure at Rest
Influence of Body Size
Influence of Body Size
Differences in body size usually expressed in terms
Differences in body size usually expressed in terms
of body surface area (BSA).
of body surface area (BSA).
From 20-40, average values BMR are 38 kcal/m
From 20-40, average values BMR are 38 kcal/m2
2
per
per
hour for men and 36 kcal/m
hour for men and 36 kcal/m2
2
for women.
for women.
Lower BMR in women can be attributed to woman’s
Lower BMR in women can be attributed to woman’s
larger percent body fat & smaller muscle mass.
larger percent body fat & smaller muscle mass.
4
5.
Energy Expenditure atRest
Energy Expenditure at Rest
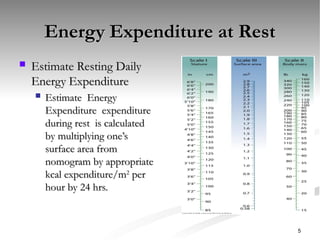
Estimate Resting Daily
Estimate Resting Daily
Energy Expenditure
Energy Expenditure
Estimate Energy
Estimate Energy
Expenditure expenditure
Expenditure expenditure
during rest is calculated
during rest is calculated
by multiplying one’s
by multiplying one’s
surface area from
surface area from
nomogram by appropriate
nomogram by appropriate
kcal expenditure/m
kcal expenditure/m2
2
per
per
hour by 24 hrs.
hour by 24 hrs.
5
6.
Energy Expenditure atRest
Energy Expenditure at Rest
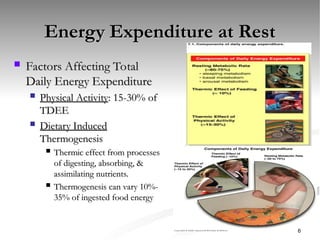
Factors Affecting Total
Factors Affecting Total
Daily Energy Expenditure
Daily Energy Expenditure
Physical Activity
Physical Activity: 15-30% of
: 15-30% of
TDEE
TDEE
Dietary Induced
Dietary Induced
Thermogenesis
Thermogenesis
Thermic effect from processes
Thermic effect from processes
of digesting, absorbing, &
of digesting, absorbing, &
assimilating nutrients.
assimilating nutrients.
Thermogenesis can vary 10%-
Thermogenesis can vary 10%-
35% of ingested food energy
35% of ingested food energy
6
7.
Energy Expenditure atRest
Energy Expenditure at Rest
Factors affecting Total Daily Energy Expenditure
Factors affecting Total Daily Energy Expenditure
Climate.
Climate.
RMR of people in tropic climate averages 5-10% higher.
RMR of people in tropic climate averages 5-10% higher.
RMR in extreme cold can triple.
RMR in extreme cold can triple.
Pregnancy.
Pregnancy.
7
8.
Energy Expenditure inPhysical
Energy Expenditure in Physical
Activity
Activity
Expression of Energy Expenditure
Expression of Energy Expenditure
Total (gross) – Resting energy expenditure (REE) = Net
Total (gross) – Resting energy expenditure (REE) = Net
energy expenditure of the activity per se.
energy expenditure of the activity per se.
Recovery energy included in Total = exercise energy +
Recovery energy included in Total = exercise energy +
recovery energy.
recovery energy.
Utilization of 1 liter of O
Utilization of 1 liter of O2
2 generates about 5 kcal of
generates about 5 kcal of
energy.
energy.
Net O
Net O2
2 cost of exercise = exercise VO
cost of exercise = exercise VO2
2 + recovery
+ recovery
VO
VO2
2 – (resting VO
– (resting VO2
2 x time)
x time)
Gross energy expenditure= VO
Gross energy expenditure= VO2
2 during an activity
during an activity
and recovery × 5 kcal per liter
and recovery × 5 kcal per liter 8
9.
Energy Expenditure inPhysical
Energy Expenditure in Physical
Activity
Activity
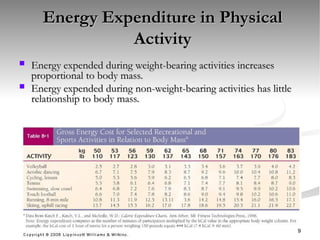
Energy expended during weight-bearing activities increases
Energy expended during weight-bearing activities increases
proportional to body mass.
proportional to body mass.
Energy expended during non-weight-bearing activities has little
Energy expended during non-weight-bearing activities has little
relationship to body mass.
relationship to body mass.
9
10.
Energy Expenditure inPhysical
Energy Expenditure in Physical
Activity
Activity
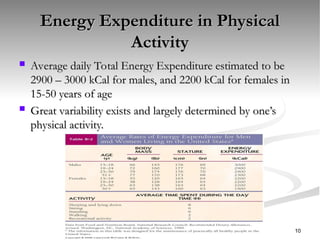
Average daily Total Energy Expenditure estimated to be
Average daily Total Energy Expenditure estimated to be
2900 – 3000 kCal for males, and 2200 kCal for females in
2900 – 3000 kCal for males, and 2200 kCal for females in
15-50 years of age
15-50 years of age
Great variability exists and largely determined by one’s
Great variability exists and largely determined by one’s
physical activity.
physical activity.
10
11.
Energy Expenditure inPhysical
Energy Expenditure in Physical
Activity
Activity
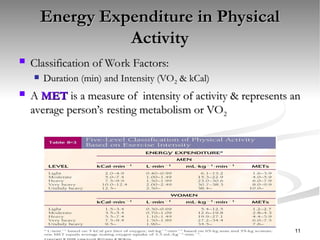
Classification of Work Factors:
Classification of Work Factors:
Duration (min) and Intensity (VO
Duration (min) and Intensity (VO2
2 & kCal)
& kCal)
A
A MET
MET is a measure of intensity of activity & represents an
is a measure of intensity of activity & represents an
average person’s resting metabolism or VO
average person’s resting metabolism or VO2
2
11
12.
Energy Expenditure inPhysical
Energy Expenditure in Physical
Activity
Activity
Classification of Work
Classification of Work
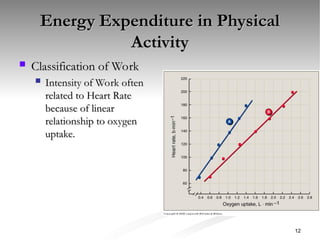
Intensity of Work often
Intensity of Work often
related to Heart Rate
related to Heart Rate
because of linear
because of linear
relationship to oxygen
relationship to oxygen
uptake.
uptake.
12
13.
Economy & Efficiencyof Energy
Economy & Efficiency of Energy
Expenditure
Expenditure
Mechanical Efficiency
Mechanical Efficiency = Work Output÷
= Work Output÷
Energy Input (expenditure).
Energy Input (expenditure).
Work Output = Force x Distance
Work Output = Force x Distance
Three efficiency terms:
Three efficiency terms:
1.
1. Gross
Gross
2.
2. Net
Net
3.
3. Delta
Delta
13
14.
Economy & Efficiencyof Energy
Economy & Efficiency of Energy
Expenditure
Expenditure
Gross
Gross efficiency uses total oxygen uptake.
efficiency uses total oxygen uptake.
Work Output
Work Output
Energy Expended
Energy Expended
Net
Net efficiency subtracts resting VO
efficiency subtracts resting VO2
2 from total.
from total.
Work Output
Work Output
Energy Expended Above Rest
Energy Expended Above Rest
Delta
Delta efficiency computes relative energy cost of
efficiency computes relative energy cost of
performing an additional increment of work.
performing an additional increment of work.
14
15.
Energy Expenditure duringWalking,
Energy Expenditure during Walking,
Running, and Swimming
Running, and Swimming
Economy is relationship between
Economy is relationship between
Energy output
Energy output
Energy input
Energy input
Greater economy requires less oxygen uptake to
Greater economy requires less oxygen uptake to
perform a task.
perform a task.
Training adjustment that improves economy
Training adjustment that improves economy
directly relates to improved exercise
directly relates to improved exercise
performance.
performance.
15
16.
Energy Expenditure duringWalking
Energy Expenditure during Walking
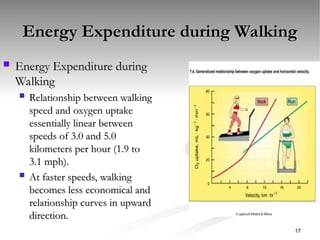
Walking represents the major daily physical activity for most
Walking represents the major daily physical activity for most
persons.
persons.
The relationship between walking speed and oxygen
The relationship between walking speed and oxygen
consumption remains approximately linear between speeds from
consumption remains approximately linear between speeds from
3.0 to 5.0 km/h; at faster speeds, walking ecomomy decreases
3.0 to 5.0 km/h; at faster speeds, walking ecomomy decreases
and the relationship curves upward,indicating a disproportionate
and the relationship curves upward,indicating a disproportionate
increase in energy expenditure with increasing speed.
increase in energy expenditure with increasing speed.
This explains the reason why per unit distance traveled faster,
This explains the reason why per unit distance traveled faster,
less efficient walking speeds expand more total calories.
less efficient walking speeds expand more total calories.
16
17.
Energy Expenditure duringWalking
Energy Expenditure during Walking
Energy Expenditure during
Energy Expenditure during
Walking
Walking
Relationship between walking
Relationship between walking
speed and oxygen uptake
speed and oxygen uptake
essentially linear between
essentially linear between
speeds of 3.0 and 5.0
speeds of 3.0 and 5.0
kilometers per hour (1.9 to
kilometers per hour (1.9 to
3.1 mph).
3.1 mph).
At faster speeds, walking
At faster speeds, walking
becomes less economical and
becomes less economical and
relationship curves in upward
relationship curves in upward
direction.
direction.
17
18.
Factor affecting walking
Factoraffecting walking
1- Influence of body mass
1- Influence of body mass
2-Terraing & walking surface
2-Terraing & walking surface
3-Downhill walking
3-Downhill walking
4- Footwear
4- Footwear
18
19.
Influence ofbody mass-
Influence of body mass-
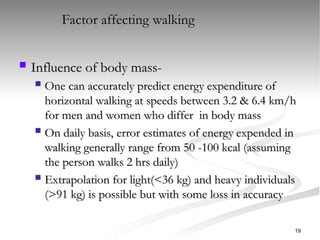
One can accurately predict energy expenditure of
One can accurately predict energy expenditure of
horizontal walking at speeds between 3.2 & 6.4 km/h
horizontal walking at speeds between 3.2 & 6.4 km/h
for men and women who differ in body mass
for men and women who differ in body mass
On daily basis, error estimates of energy expended in
On daily basis, error estimates of energy expended in
walking generally range from 50 -100 kcal (assuming
walking generally range from 50 -100 kcal (assuming
the person walks 2 hrs daily)
the person walks 2 hrs daily)
Extrapolation for light(<36 kg) and heavy individuals
Extrapolation for light(<36 kg) and heavy individuals
(>91 kg) is possible but with some loss in accuracy
(>91 kg) is possible but with some loss in accuracy
Factor affecting walking
19
20.
Factor affecting walkingcont…
Factor affecting walking cont…
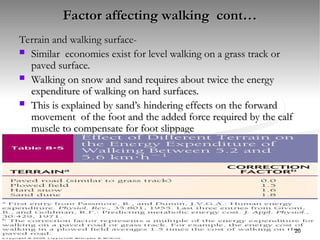
Terrain and walking surface-
Terrain and walking surface-
Similar economies exist for level walking on a grass track or
Similar economies exist for level walking on a grass track or
paved surface.
paved surface.
Walking on snow and sand requires about twice the energy
Walking on snow and sand requires about twice the energy
expenditure of walking on hard surfaces.
expenditure of walking on hard surfaces.
This is explained by sand’s hindering effects on the forward
This is explained by sand’s hindering effects on the forward
movement of the foot and the added force required by the calf
movement of the foot and the added force required by the calf
muscle to compensate for foot slippage
muscle to compensate for foot slippage
20
21.
Factor affecting walkingcont….
Factor affecting walking cont….
Walking in a soft snow triples metabolic cost
Walking in a soft snow triples metabolic cost
compared with similar walking on a treadmill.
compared with similar walking on a treadmill.
A brisk walk (or a run) along a beach or in a freshly
A brisk walk (or a run) along a beach or in a freshly
fallen snow provides excellent exercise stress to
fallen snow provides excellent exercise stress to
“burn” additional calories or improve physiologic
“burn” additional calories or improve physiologic
fitness
fitness
Persons generate essentially the same physiologic
Persons generate essentially the same physiologic
stress by walking on a level surface or walking on a
stress by walking on a level surface or walking on a
treadmill at an equivalent speed & distance
treadmill at an equivalent speed & distance
21
22.
Factor affecting walkingcont…
Factor affecting walking cont…
Downhill walking
Downhill walking
Walking the downhill portion of a mountain hike or golf course
Walking the downhill portion of a mountain hike or golf course
provides welcome relief compared with the uphill segment of
provides welcome relief compared with the uphill segment of
the exercise.
the exercise.
Downhill walking represents a form of negative work because
Downhill walking represents a form of negative work because
the body’s centre of mass moves in downward vertical direction
the body’s centre of mass moves in downward vertical direction
with each step cycle
with each step cycle
This decreases the total potential energy of the system
This decreases the total potential energy of the system
Consequently , at the same speed and elevation,it requires less
Consequently , at the same speed and elevation,it requires less
energy to perform eccentric muscle actions than the concentric
energy to perform eccentric muscle actions than the concentric
actions of positive work
actions of positive work
22
23.
Factor affecting walkingcont…
Factor affecting walking cont…
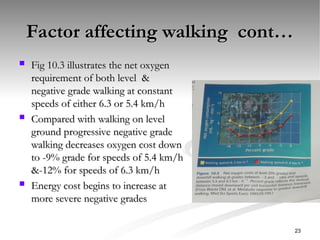
Fig 10.3 illustrates the net oxygen
Fig 10.3 illustrates the net oxygen
requirement of both level &
requirement of both level &
negative grade walking at constant
negative grade walking at constant
speeds of either 6.3 or 5.4 km/h
speeds of either 6.3 or 5.4 km/h
Compared with walking on level
Compared with walking on level
ground progressive negative grade
ground progressive negative grade
walking decreases oxygen cost down
walking decreases oxygen cost down
to -9% grade for speeds of 5.4 km/h
to -9% grade for speeds of 5.4 km/h
&-12% for speeds of 6.3 km/h
&-12% for speeds of 6.3 km/h
Energy cost begins to increase at
Energy cost begins to increase at
more severe negative grades
more severe negative grades
23
24.
Factor affecting walkingcont…
Factor affecting walking cont…
The increase in oxygen cost for walking down
The increase in oxygen cost for walking down
the steeper grades probably results from
the steeper grades probably results from
additional energy to ressist or “brake” the body
additional energy to ressist or “brake” the body
from gravity’s pull while trying to achieve a
from gravity’s pull while trying to achieve a
proper and safe walking rhythm.
proper and safe walking rhythm.
24
25.
Factor affecting walkingcont…
Factor affecting walking cont…
Footwear
Footwear
It requires considerably mpre energy to carry weight on the feet or ankles than to
It requires considerably mpre energy to carry weight on the feet or ankles than to
carry the same weight on the torso
carry the same weight on the torso
A weight equal to 1.4% of body mass placed on the ankles increases the energy
A weight equal to 1.4% of body mass placed on the ankles increases the energy
cost of walking an average of 8% or nearly 6 times more than with the same weight
cost of walking an average of 8% or nearly 6 times more than with the same weight
on the torso.
on the torso.
In a practical sense wearing boots increases the energy cost while wearing lighter
In a practical sense wearing boots increases the energy cost while wearing lighter
running shoes.
running shoes.
Adding an additional 100g to each shoe increases oxygen consumption durig
Adding an additional 100g to each shoe increases oxygen consumption durig
moderate running by 1% .
moderate running by 1% .
Clear implication exists for these findings in the design of running shoes,hiking and
Clear implication exists for these findings in the design of running shoes,hiking and
climbing boots,and workboots traditionally required in mining,forestry,fire fighting
climbing boots,and workboots traditionally required in mining,forestry,fire fighting
and the milittary –small changes in movement economy
and the milittary –small changes in movement economy
25
26.
Factor affecting walkingcont…
Factor affecting walking cont…
the cushioning properties of shoes also affect exercises economy
the cushioning properties of shoes also affect exercises economy
.
.
A softer soled running shoe reduse the oxygen cost (incresd
A softer soled running shoe reduse the oxygen cost (incresd
economy).of running at moderet speed by 2.5% compared with
economy).of running at moderet speed by 2.5% compared with
similar shoe with a firmer cushioning system .
similar shoe with a firmer cushioning system .
Even though the pair of softer –soled shoes weighed an
Even though the pair of softer –soled shoes weighed an
additional31g
additional31g
26
27.
Factor affecting walkingcont…
Factor affecting walking cont…
Hand held and ankle weights
Hand held and ankle weights
The impect force on the legs during running averages about three
The impect force on the legs during running averages about three
times body mass,wheras the level of leg shock walking equals
times body mass,wheras the level of leg shock walking equals
only 30% of this value
only 30% of this value
Individuals desiring to increase energy expenditure using only
Individuals desiring to increase energy expenditure using only
walking as a low impact exercise mode often add extra
walking as a low impact exercise mode often add extra
weight to the body.
weight to the body.
This modification also has been applied to running activities.
This modification also has been applied to running activities.
27
28.
Influence of handheld weight
Influence of hand held weight
Walking
Walking
Ankle weights increase the energy expenditure of walking to values
Ankle weights increase the energy expenditure of walking to values
usually observed for running
usually observed for running
The effect benefits individual who use only walking as a low impact
The effect benefits individual who use only walking as a low impact
training modality , yet require greater energy expenditure than occur
training modality , yet require greater energy expenditure than occur
during normal walking
during normal walking
Hand held weights, walking poles (stimulate arm action in cross
Hand held weights, walking poles (stimulate arm action in cross
country skiing),power belts(worn around waist with ressistance cords
country skiing),power belts(worn around waist with ressistance cords
with handles for arm action) and upper body exercise(swinging the
with handles for arm action) and upper body exercise(swinging the
arms) all increase the energy expenditure of walking
arms) all increase the energy expenditure of walking
However, handheld weights and walking poles may disproportionately
However, handheld weights and walking poles may disproportionately
increase exercise systolic blood pressure-elevating effects of
increase exercise systolic blood pressure-elevating effects of
(1)upper body exercise
(1)upper body exercise
(2) increased intramuscular tension from gripping the object
(2) increased intramuscular tension from gripping the object
An augmented blood pressure response contraindicates use of
An augmented blood pressure response contraindicates use of
handheld weights for individuals with existing hypertension or
handheld weights for individuals with existing hypertension or
coronary heart disease
coronary heart disease
28
29.
Influence of handheld weight cont…
Influence of hand held weight cont…
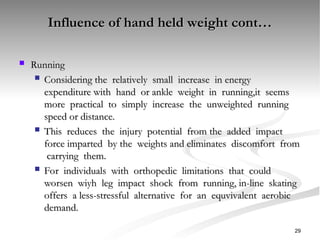
Running
Running
Considering the relatively small increase in energy
Considering the relatively small increase in energy
expenditure with hand or ankle weight in running,it seems
expenditure with hand or ankle weight in running,it seems
more practical to simply increase the unweighted running
more practical to simply increase the unweighted running
speed or distance.
speed or distance.
This reduces the injury potential from the added impact
This reduces the injury potential from the added impact
force imparted by the weights and eliminates discomfort from
force imparted by the weights and eliminates discomfort from
carrying them.
carrying them.
For individuals with orthopedic limitations that could
For individuals with orthopedic limitations that could
worsen wiyh leg impact shock from running, in-line skating
worsen wiyh leg impact shock from running, in-line skating
offers a less-stressful alternative for an equvivalent aerobic
offers a less-stressful alternative for an equvivalent aerobic
demand.
demand.
29
30.
Influence of handheld weight cont…
Influence of hand held weight cont…
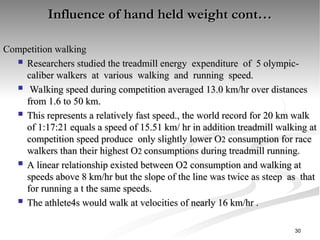
Competition walking
Competition walking
Researchers studied the treadmill energy expenditure of 5 olympic-
Researchers studied the treadmill energy expenditure of 5 olympic-
caliber walkers at various walking and running speed.
caliber walkers at various walking and running speed.
Walking speed during competition averaged 13.0 km/hr over distances
Walking speed during competition averaged 13.0 km/hr over distances
from 1.6 to 50 km.
from 1.6 to 50 km.
This represents a relatively fast speed., the world record for 20 km walk
This represents a relatively fast speed., the world record for 20 km walk
of 1:17:21 equals a speed of 15.51 km/ hr in addition treadmill walking at
of 1:17:21 equals a speed of 15.51 km/ hr in addition treadmill walking at
competition speed produce only slightly lower O
competition speed produce only slightly lower O2
2 consumption for race
consumption for race
walkers than their highest O
walkers than their highest O2
2 consumptions during treadmill running.
consumptions during treadmill running.
A linear relationship existed between O2 consumption and walking at
A linear relationship existed between O2 consumption and walking at
speeds above 8 km/hr but the slope of the line was twice as steep as that
speeds above 8 km/hr but the slope of the line was twice as steep as that
for running a t the same speeds.
for running a t the same speeds.
The athlete4s would walk at velocities of nearly 16 km/hr .
The athlete4s would walk at velocities of nearly 16 km/hr .
30
31.
Influence of handheld weight cont…
Influence of hand held weight cont…
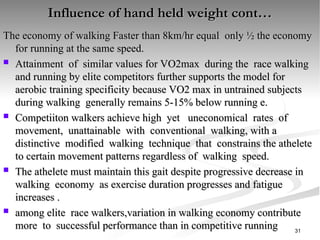
The economy of walking Faster than 8km/hr equal only ½ the economy
The economy of walking Faster than 8km/hr equal only ½ the economy
for running at the same speed.
for running at the same speed.
Attainment of similar values for VO2max during the race walking
Attainment of similar values for VO2max during the race walking
and running by elite competitors further supports the model for
and running by elite competitors further supports the model for
aerobic training specificity because VO2 max in untrained subjects
aerobic training specificity because VO2 max in untrained subjects
during walking generally remains 5-15% below running e.
during walking generally remains 5-15% below running e.
Competiiton walkers achieve high yet uneconomical rates of
Competiiton walkers achieve high yet uneconomical rates of
movement, unattainable with conventional walking, with a
movement, unattainable with conventional walking, with a
distinctive modified walking technique that constrains the athelete
distinctive modified walking technique that constrains the athelete
to certain movement patterns regardless of walking speed.
to certain movement patterns regardless of walking speed.
The athelete must maintain this gait despite progressive decrease in
The athelete must maintain this gait despite progressive decrease in
walking economy as exercise duration progresses and fatigue
walking economy as exercise duration progresses and fatigue
increases .
increases .
among elite race walkers,variation in walking economy contribute
among elite race walkers,variation in walking economy contribute
more to successful performance than in competitive running
more to successful performance than in competitive running 31
32.
Energy Expenditure duringRunning
Energy Expenditure during Running
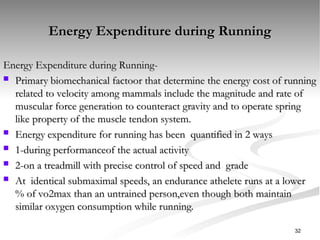
Energy Expenditure during Running-
Energy Expenditure during Running-
Primary biomechanical factoor that determine the energy cost of running
Primary biomechanical factoor that determine the energy cost of running
related to velocity among mammals include the magnitude and rate of
related to velocity among mammals include the magnitude and rate of
muscular force generation to counteract gravity and to operate spring
muscular force generation to counteract gravity and to operate spring
like property of the muscle tendon system.
like property of the muscle tendon system.
Energy expenditure for running has been quantified in 2 ways
Energy expenditure for running has been quantified in 2 ways
1-during performanceof the actual activity
1-during performanceof the actual activity
2-on a treadmill with precise control of speed and grade
2-on a treadmill with precise control of speed and grade
At identical submaximal speeds, an endurance athelete runs at a lower
At identical submaximal speeds, an endurance athelete runs at a lower
% of vo2max than an untrained person,even though both maintain
% of vo2max than an untrained person,even though both maintain
similar oxygen consumption while running.
similar oxygen consumption while running.
32
33.
Energy Expenditure duringRunning cont…
Energy Expenditure during Running cont…
Independent of fitness, it becomes more economical from an
Independent of fitness, it becomes more economical from an
energy standpoint to discontinue walking and begin running at
energy standpoint to discontinue walking and begin running at
speeds above about 8km/h
speeds above about 8km/h
33
34.
Energy Expenditure duringRunning cont…
Energy Expenditure during Running cont…
Economy of running fast or slow-
Economy of running fast or slow-
Because of linear relationship between oxygen consumption & running
Because of linear relationship between oxygen consumption & running
speed,the total energy requirement for running a given distance is about
speed,the total energy requirement for running a given distance is about
the same regardless of speed
the same regardless of speed
Simply stated, running a mile at 10 mph requires about twice the energy
Simply stated, running a mile at 10 mph requires about twice the energy
per minute as running a mile at 5 mph; at the faster speed ,completing
per minute as running a mile at 5 mph; at the faster speed ,completing
the mile requires 6 minutes,but running at slower speed takes twice as
the mile requires 6 minutes,but running at slower speed takes twice as
long or 12 minutes
long or 12 minutes
As such the net energy cost to traverse the mile remains about the same
As such the net energy cost to traverse the mile remains about the same
Equvivalent energy costs per mile occur not only for horizontal walking
Equvivalent energy costs per mile occur not only for horizontal walking
but also for walking at a specific grade that ranges from -45 to +15 %
but also for walking at a specific grade that ranges from -45 to +15 %
34
35.
Energy Expenditure duringRunning cont…
Energy Expenditure during Running cont…
During horizontal running, the net energy cost per kilogram of
During horizontal running, the net energy cost per kilogram of
body mass per kilometer traveled averages 1kcal or 1kcal/kg/km
body mass per kilometer traveled averages 1kcal or 1kcal/kg/km
Thus the net energy cost of running 1 km for individuals
Thus the net energy cost of running 1 km for individuals
weighing 78 kg averages 78kcal,regardless of running speed
weighing 78 kg averages 78kcal,regardless of running speed
Expressed in terms of oxygen consumption, this amounts to
Expressed in terms of oxygen consumption, this amounts to
15.6 L of oxygen consumption
15.6 L of oxygen consumption
Comparisons of net energy cost of locomotion per unit
Comparisons of net energy cost of locomotion per unit
distance traveled for walking & running indicate greater energy
distance traveled for walking & running indicate greater energy
expenditure when running a given distance.
expenditure when running a given distance.
35
36.
Energy Expenditure duringRunning cont…
Energy Expenditure during Running cont…
Stride length, stride frequency and speed
Stride length, stride frequency and speed
Running
Running
One can increase running speed in 3 ways-
One can increase running speed in 3 ways-
1.
1. Increase the number of steps each minute (stride frequency)
Increase the number of steps each minute (stride frequency)
2.
2. Increase the distance between steps(stride length)
Increase the distance between steps(stride length)
3.
3. Increase both the frequency and length of the stride
Increase both the frequency and length of the stride
The 3
The 3rd
rd
option may seem obvious for increasing running speed,but
option may seem obvious for increasing running speed,but
several experiments have provided objective data concerning this
several experiments have provided objective data concerning this
alternative
alternative
36
37.
Energy Expenditure duringRunning cont…
Energy Expenditure during Running cont…
Research in 1994 evaluated the stride pattern for the danish
Research in 1994 evaluated the stride pattern for the danish
champion in the 5- & 10-km running events
champion in the 5- & 10-km running events
At a running speed of 9.3 km/h, this athelete’s stride frequency
At a running speed of 9.3 km/h, this athelete’s stride frequency
equaled 160/minute, with a stride corresponding stride length of
equaled 160/minute, with a stride corresponding stride length of
97 cm
97 cm
When running speed increased 91% to 17.8km/h
When running speed increased 91% to 17.8km/h
Stride frequency increased only 10% to 176 per minute ,whereas
Stride frequency increased only 10% to 176 per minute ,whereas
stride length increased 83% to 168 cm
stride length increased 83% to 168 cm
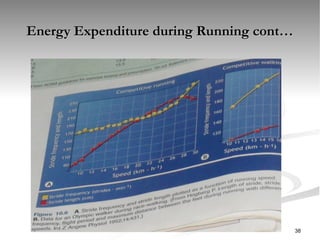
Figure 10.6 A displays the inteaction between stride frequency and
Figure 10.6 A displays the inteaction between stride frequency and
stride length as running speed increases
stride length as running speed increases
Doubling the speed from 10 to 20 km/h increases stride length by
Doubling the speed from 10 to 20 km/h increases stride length by
85%,whereas stride frequency increases only about 9%
85%,whereas stride frequency increases only about 9%
37
Energy Expenditure duringRunning cont…
Energy Expenditure during Running cont…
Running at speed above 23km/h occurs mainly by increasing
Running at speed above 23km/h occurs mainly by increasing
stride frequency
stride frequency
As a general rule, running speed increases mainly by
As a general rule, running speed increases mainly by
lengthening the stride
lengthening the stride
only at faster speeds does stride frequency become important
only at faster speeds does stride frequency become important
Relying on increasing the length of the “stroke” cycle, not the
Relying on increasing the length of the “stroke” cycle, not the
frequency
frequency
To achieve more rapid speeds in endurance performance also
To achieve more rapid speeds in endurance performance also
occurs among top-flight kayakers,rowers,cross country skiers, &
occurs among top-flight kayakers,rowers,cross country skiers, &
speed skaters.
speed skaters.
39
40.
Competition walking-
Competitionwalking-
The competitive walker does not increase speed the same way as a
The competitive walker does not increase speed the same way as a
runner does
runner does
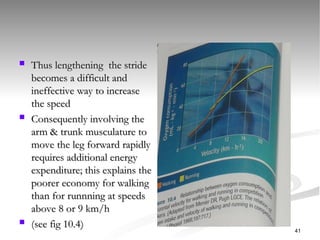
Fig 10.6 B illustrates the stride length-stride frequency relationship for
Fig 10.6 B illustrates the stride length-stride frequency relationship for
an olympic 10-km medal winner who walked at speeds from 10 to 14.4
an olympic 10-km medal winner who walked at speeds from 10 to 14.4
km/h
km/h
When walking speed increased within this range, stride frequency
When walking speed increased within this range, stride frequency
increased by 13%
increased by 13%
Faster speeds produced an even greater increase in stride frequency
Faster speeds produced an even greater increase in stride frequency
Unlike running, in which the body glides through the air, competitive
Unlike running, in which the body glides through the air, competitive
race-walking requires that the back foot remain on the ground until the
race-walking requires that the back foot remain on the ground until the
front foot makes contact
front foot makes contact
40
41.
Thus lengtheningthe stride
Thus lengthening the stride
becomes a difficult and
becomes a difficult and
ineffective way to increase
ineffective way to increase
the speed
the speed
Consequently involving the
Consequently involving the
arm & trunk musculature to
arm & trunk musculature to
move the leg forward rapidly
move the leg forward rapidly
requires additional energy
requires additional energy
expenditure; this explains the
expenditure; this explains the
poorer economy for walking
poorer economy for walking
than for runnning at speeds
than for runnning at speeds
above 8 or 9 km/h
above 8 or 9 km/h
(see fig 10.4)
(see fig 10.4)
41
42.
Optimum stridelength
Optimum stride length
Each person runs at constant speed with an optimum
Each person runs at constant speed with an optimum
combination of stride length & frequency
combination of stride length & frequency
This optimum depends on the person’s mechanics or “style”
This optimum depends on the person’s mechanics or “style”
of running or cannot be determined from body
of running or cannot be determined from body
measurements
measurements
Nevertheless energy expenditure increases more for
Nevertheless energy expenditure increases more for
overstriding than for understanding
overstriding than for understanding
42
43.
Energy Expenditure duringRunning cont…
Energy Expenditure during Running cont…
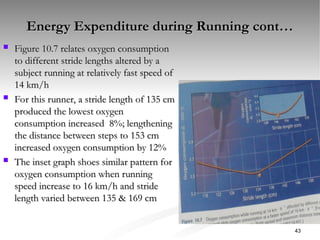
Figure 10.7 relates oxygen consumption
Figure 10.7 relates oxygen consumption
to different stride lengths altered by a
to different stride lengths altered by a
subject running at relatively fast speed of
subject running at relatively fast speed of
14 km/h
14 km/h
For this runner, a stride length of 135 cm
For this runner, a stride length of 135 cm
produced the lowest oxygen
produced the lowest oxygen
consumption increased 8%; lengthening
consumption increased 8%; lengthening
the distance between steps to 153 cm
the distance between steps to 153 cm
increased oxygen consumption by 12%
increased oxygen consumption by 12%
The inset graph shoes similar pattern for
The inset graph shoes similar pattern for
oxygen consumption when running
oxygen consumption when running
speed increase to 16 km/h and stride
speed increase to 16 km/h and stride
length varied between 135 & 169 cm
length varied between 135 & 169 cm
43
44.
Energy Expenditure duringRunning cont…
Energy Expenditure during Running cont…
Decreasing this runner’s stride length from the optimum of 149cm to
Decreasing this runner’s stride length from the optimum of 149cm to
135 cm increased oxygen consumption by 4.1%; lengthening the
135 cm increased oxygen consumption by 4.1%; lengthening the
stride to 169 cm increased aerobic energy expenditure nearly 13%
stride to 169 cm increased aerobic energy expenditure nearly 13%
As one might expect, the stride length selected by the subject
As one might expect, the stride length selected by the subject
(marked in figure by solid orange circle) produced the most
(marked in figure by solid orange circle) produced the most
economical stride length (lowest vo2)
economical stride length (lowest vo2)
Lengthening the stride above the optimum caused a larger increase in
Lengthening the stride above the optimum caused a larger increase in
oxygen consumption than a shorter-than-optimum length
oxygen consumption than a shorter-than-optimum length
Urging a runner who shows signs of fatigue to “lengthen your stride!”
Urging a runner who shows signs of fatigue to “lengthen your stride!”
to maintain speed actually proves counterproductive in terms of
to maintain speed actually proves counterproductive in terms of
economy of effort
economy of effort
44
45.
Energy Expenditure duringRunning cont…
Energy Expenditure during Running cont…
Well trained runners should run at stride length they have
Well trained runners should run at stride length they have
selected through years of running
selected through years of running
In keeping with the concept that the body attempts to achieve a
In keeping with the concept that the body attempts to achieve a
level of minimum effort, a self selected length & frequency
level of minimum effort, a self selected length & frequency
generally produce the most economical running performance
generally produce the most economical running performance
This reflects an individual’s unique body size ,inertia of limb
This reflects an individual’s unique body size ,inertia of limb
segments, & anatomic development
segments, & anatomic development
No “best” style characterizes elite runners
No “best” style characterizes elite runners
Biomechanical analysis may help the athelete correctminor
Biomechanical analysis may help the athelete correctminor
irregularities in movement pattern while running
irregularities in movement pattern while running
For competitive runner, any minor improvement in movement
For competitive runner, any minor improvement in movement
economy generally improves performance
economy generally improves performance
45
46.
Energy Expenditure duringRunning
Energy Expenditure during Running
More economical to discontinue walking and begin
More economical to discontinue walking and begin
to run or jog at speeds > 6.5 kmh (4 mph).
to run or jog at speeds > 6.5 kmh (4 mph).
Net energy cost of running a given distance is
Net energy cost of running a given distance is
independent of running speed.
independent of running speed.
Lengthening stride above the optimum length (and
Lengthening stride above the optimum length (and
reducing stride frequency) increases VO
reducing stride frequency) increases VO2
2 more than
more than
shortening below optimum (and increasing stride
shortening below optimum (and increasing stride
frequency).
frequency).
Cost of running into headwind significantly greater
Cost of running into headwind significantly greater
than the reduction with tailwind.
than the reduction with tailwind. 46
47.
Running economy; children,adult,trained
Runningeconomy; children,adult,trained
and untrained atheletes
and untrained atheletes
Boys & girls are less economical runners than adults because
Boys & girls are less economical runners than adults because
they require 20 to 30% more oxygen per unit body mass to run
they require 20 to 30% more oxygen per unit body mass to run
at a particular speed
at a particular speed
consequently adult models to predict energy cost in weight
consequently adult models to predict energy cost in weight
bearing locomotion fails to account for the increased energy
bearing locomotion fails to account for the increased energy
costs in children & adolscents
costs in children & adolscents
47
48.
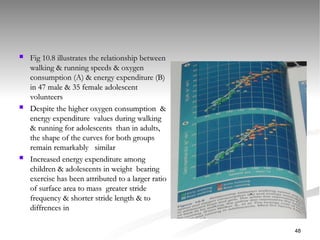
Fig 10.8illustrates the relationship between
Fig 10.8 illustrates the relationship between
walking & running speeds & oxygen
walking & running speeds & oxygen
consumption (A) & energy expenditure (B)
consumption (A) & energy expenditure (B)
in 47 male & 35 female adolescent
in 47 male & 35 female adolescent
volunteers
volunteers
Despite the higher oxygen consumption &
Despite the higher oxygen consumption &
energy expenditure values during walking
energy expenditure values during walking
& running for adolescents than in adults,
& running for adolescents than in adults,
the shape of the curves for both groups
the shape of the curves for both groups
remain remarkably similar
remain remarkably similar
Increased energy expenditure among
Increased energy expenditure among
children & adolescents in weight bearing
children & adolescents in weight bearing
exercise has been attributed to a larger ratio
exercise has been attributed to a larger ratio
of surface area to mass greater stride
of surface area to mass greater stride
frequency & shorter stride length & to
frequency & shorter stride length & to
diffrences in
diffrences in
48
49.
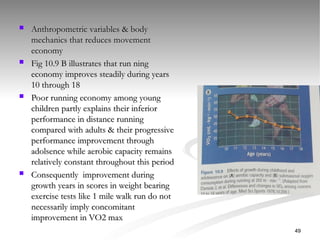
Anthropometric variables& body
Anthropometric variables & body
mechanics that reduces movement
mechanics that reduces movement
economy
economy
Fig 10.9 B illustrates that run ning
Fig 10.9 B illustrates that run ning
economy improves steadily during years
economy improves steadily during years
10 through 18
10 through 18
Poor running economy among young
Poor running economy among young
children partly explains their inferior
children partly explains their inferior
performance in distance running
performance in distance running
compared with adults & their progressive
compared with adults & their progressive
performance improvement through
performance improvement through
adolsence while aerobic capacity remains
adolsence while aerobic capacity remains
relatively constant throughout this period
relatively constant throughout this period
Consequently improvement during
Consequently improvement during
growth years in scores in weight bearing
growth years in scores in weight bearing
exercise tests like 1 mile walk run do not
exercise tests like 1 mile walk run do not
necessarily imply concomitant
necessarily imply concomitant
improvement in VO2 max
improvement in VO2 max
49
50.
Treadmill versustrack running
Treadmill versus track running
The treadmill provides the primary exercise mode to evaluate the physiology
The treadmill provides the primary exercise mode to evaluate the physiology
of running
of running
8 distance runners ran on a treadmill & track under a calm air conditions at 3
8 distance runners ran on a treadmill & track under a calm air conditions at 3
submaximal speeds of 180m/min, 210m/mi & 260m/min
submaximal speeds of 180m/min, 210m/mi & 260m/min
Graded exercise test determined possible diffrence between treadmill & track
Graded exercise test determined possible diffrence between treadmill & track
running on maximal oxygen consumption
running on maximal oxygen consumption
50
51.
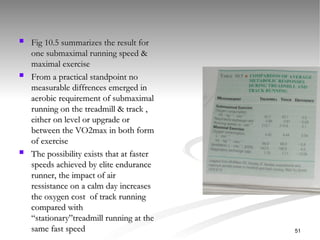
Fig 10.5summarizes the result for
Fig 10.5 summarizes the result for
one submaximal running speed &
one submaximal running speed &
maximal exercise
maximal exercise
From a practical standpoint no
From a practical standpoint no
measurable diffrences emerged in
measurable diffrences emerged in
aerobic requirement of submaximal
aerobic requirement of submaximal
running on the treadmill & track ,
running on the treadmill & track ,
either on level or upgrade or
either on level or upgrade or
between the VO2max in both form
between the VO2max in both form
of exercise
of exercise
The possibility exists that at faster
The possibility exists that at faster
speeds achieved by elite endurance
speeds achieved by elite endurance
runner, the impact of air
runner, the impact of air
ressistance on a calm day increases
ressistance on a calm day increases
the oxygen cost of track running
the oxygen cost of track running
compared with
compared with
“stationary”treadmill running at the
“stationary”treadmill running at the
same fast speed
same fast speed 51
52.
Marathon running
Marathonrunning
The current world marathon record(as october 2005) is 2h:04min:55s
The current world marathon record(as october 2005) is 2h:04min:55s
Researchers measured 2 distance runners during a marathon to assess
Researchers measured 2 distance runners during a marathon to assess
energy expenditure each minute & total caloric cost of the run
energy expenditure each minute & total caloric cost of the run
They determined oxygen consumption every 3 miles using open circuit
They determined oxygen consumption every 3 miles using open circuit
spirometry
spirometry
Marathon times were 2h:36min:34s(vo2max=70.5ml/kg/min) &
Marathon times were 2h:36min:34s(vo2max=70.5ml/kg/min) &
2h:39min:28s(vo2max=73.9ml/kg/min)
2h:39min:28s(vo2max=73.9ml/kg/min)
The first runner maintained an average speed of 16.2 km/h that requires
The first runner maintained an average speed of 16.2 km/h that requires
oxygen consumption equal to 80% of vo2max
oxygen consumption equal to 80% of vo2max
for 2
for 2nd
nd
runner who averaged a slower speed of 16km/h,the aerobic
runner who averaged a slower speed of 16km/h,the aerobic
component averaged 78.3% of maximum
component averaged 78.3% of maximum
For both men total energy required to run the marathon ranged between
For both men total energy required to run the marathon ranged between
2300 & 2400kcal.
2300 & 2400kcal. 52
53.
Swimming
Swimming
Swimming differsin several important aspects from walking or
Swimming differs in several important aspects from walking or
running
running
One obvious diffrence entails the expenditure of energy to
One obvious diffrence entails the expenditure of energy to
maintain buoyancy while simultaneously generating horizontal
maintain buoyancy while simultaneously generating horizontal
movement by using arms & legs either in combination or
movement by using arms & legs either in combination or
seperately
seperately
Other diffrences include requirement of overcoming drag forces
Other diffrences include requirement of overcoming drag forces
that impedes a swimmer’s forward movement
that impedes a swimmer’s forward movement
The amount of drag depends upon the fluid medium &
The amount of drag depends upon the fluid medium &
swimmer’s size, shape, & velocity
swimmer’s size, shape, & velocity
53
54.
Energy Expenditure during
EnergyExpenditure during
Swimming
Swimming
Energy expenditure to swim a given distance is
Energy expenditure to swim a given distance is
about 4 times greater than to run same distance.
about 4 times greater than to run same distance.
Energy must be expended to maintain buoyancy
Energy must be expended to maintain buoyancy
while generating horizontal motion and to
while generating horizontal motion and to
overcome drag forces.
overcome drag forces.
Total drag consists of:
Total drag consists of:
Wave drag
Wave drag
Skin friction drag
Skin friction drag
Viscous pressure drag
Viscous pressure drag
54
55.
Energy Expenditure during
EnergyExpenditure during
Swimming cont…
Swimming cont…
Energy cost and drag
Energy cost and drag
Wave drag-caused by waves that build up in front of and form
Wave drag-caused by waves that build up in front of and form
hollows behind ,the swimmer moving through the water.
hollows behind ,the swimmer moving through the water.
This component of drag does not significantly affect swimming at
This component of drag does not significantly affect swimming at
slow velocities but its influence increases at faster swimming speeds
slow velocities but its influence increases at faster swimming speeds
Skin friction drag-produced as the water slides over skin
Skin friction drag-produced as the water slides over skin
surface .even at relatively fast swimming velocities the quantitative
surface .even at relatively fast swimming velocities the quantitative
contribution of skin friction drag to total drag remains same
contribution of skin friction drag to total drag remains same
Viscous pressure drag-caused by pressure diffrence created in front
Viscous pressure drag-caused by pressure diffrence created in front
& behind the swimmer, which substantially counters propulsive
& behind the swimmer, which substantially counters propulsive
effort at slow velocities
effort at slow velocities
55
56.
Energy Expenditure duringSwimming cont…
Energy Expenditure during Swimming cont…
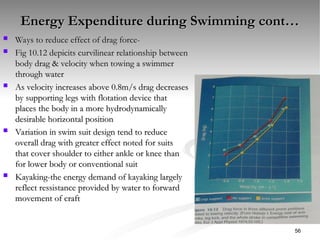
Ways to reduce effect of drag force-
Ways to reduce effect of drag force-
Fig 10.12 depicits curvilinear relationship between
Fig 10.12 depicits curvilinear relationship between
body drag & velocity when towing a swimmer
body drag & velocity when towing a swimmer
through water
through water
As velocity increases above 0.8m/s drag decreases
As velocity increases above 0.8m/s drag decreases
by supporting legs with flotation device that
by supporting legs with flotation device that
places the body in a more hydrodynamically
places the body in a more hydrodynamically
desirable horizontal position
desirable horizontal position
Variation in swim suit design tend to reduce
Variation in swim suit design tend to reduce
overall drag with greater effect noted for suits
overall drag with greater effect noted for suits
that cover shoulder to either ankle or knee than
that cover shoulder to either ankle or knee than
for lower body or conventional suit
for lower body or conventional suit
Kayaking-the energy demand of kayaking largely
Kayaking-the energy demand of kayaking largely
reflect ressistance provided by water to forward
reflect ressistance provided by water to forward
movement of craft
movement of craft
56
57.
Energy Expenditure during
EnergyExpenditure during
Swimming cont…
Swimming cont…
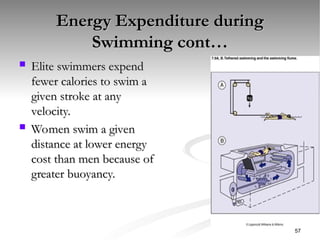
Elite swimmers expend
Elite swimmers expend
fewer calories to swim a
fewer calories to swim a
given stroke at any
given stroke at any
velocity.
velocity.
Women swim a given
Women swim a given
distance at lower energy
distance at lower energy
cost than men because of
cost than men because of
greater buoyancy.
greater buoyancy.
57
58.
Energy cost, swimmingvelocity,
Energy cost, swimming velocity,
and skill
and skill
Elite swimmer swim a particular stroke at a given velocity with
Elite swimmer swim a particular stroke at a given velocity with
lower oxygen consumption than relatively untrained or
lower oxygen consumption than relatively untrained or
recreational swimmers
recreational swimmers
Highly skilled swimmer use more of the energy they generate
Highly skilled swimmer use more of the energy they generate
per stroke to overcomevdrag forces
per stroke to overcomevdrag forces
Consequently they cover a greater distance per stroke than less
Consequently they cover a greater distance per stroke than less
skilled swimmers who waste considerable energy ineffectively
skilled swimmers who waste considerable energy ineffectively
moving water
moving water
58
59.
Effect ofwater temperature-
Effect of water temperature-
Cold water places swimmer under thermal stress
Cold water places swimmer under thermal stress
This initiates cardiovascular & metabolic adjustments different
This initiates cardiovascular & metabolic adjustments different
from swimming in warmer water
from swimming in warmer water
This adaptive response primarily maintain a stable core
This adaptive response primarily maintain a stable core
temperature by compensating for considerable heat loss from the
temperature by compensating for considerable heat loss from the
body particularly at water temperature below 25
body particularly at water temperature below 250
0
c
c
Body heat loss occurs most readily in lean swimmers who lack
Body heat loss occurs most readily in lean swimmers who lack
benefits from insulatory effects of subcutaneous fat
benefits from insulatory effects of subcutaneous fat
accumulation
accumulation
59
60.
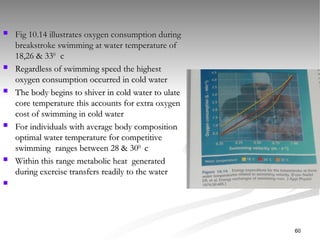
Fig 10.14illustrates oxygen consumption during
Fig 10.14 illustrates oxygen consumption during
breakstroke swimming at water temperature of
breakstroke swimming at water temperature of
18,26 & 33
18,26 & 330
0
c
c
Regardless of swimming speed the highest
Regardless of swimming speed the highest
oxygen consumption occurred in cold water
oxygen consumption occurred in cold water
The body begins to shiver in cold water to ulate
The body begins to shiver in cold water to ulate
core temperature this accounts for extra oxygen
core temperature this accounts for extra oxygen
cost of swimming in cold water
cost of swimming in cold water
For individuals with average body composition
For individuals with average body composition
optimal water temperature for competitive
optimal water temperature for competitive
swimming ranges between 28 & 30
swimming ranges between 28 & 300
0
c
c
Within this range metabolic heat generated
Within this range metabolic heat generated
during exercise transfers readily to the water
during exercise transfers readily to the water
60
61.
Effect ofbuoyancy: men versus women:
Effect of buoyancy: men versus women:
Women of all ages possess on average a higher body fat
Women of all ages possess on average a higher body fat
percentage than men
percentage than men
Because fat floats & muscle & bone sink in water the average
Because fat floats & muscle & bone sink in water the average
women gain a hydrodynamic lift and expends less energy to stay
women gain a hydrodynamic lift and expends less energy to stay
afloat than her male counterpart
afloat than her male counterpart
More than likely, gender diffrences in percentage body fat & thus
More than likely, gender diffrences in percentage body fat & thus
body buoyancy partially explain the greater swimming economy
body buoyancy partially explain the greater swimming economy
for women
for women
For eg, women swim a given distance at about 30% lower total
For eg, women swim a given distance at about 30% lower total
energy cost than do men
energy cost than do men
61
62.
Endurance swimmers-
Enduranceswimmers-
Distance swimming in ocean water poses a severe metabolic
Distance swimming in ocean water poses a severe metabolic
& physiologic challenge
& physiologic challenge
A study of 9 english channel swimmers included
A study of 9 english channel swimmers included
measurements taken under race condition in salt water pool
measurements taken under race condition in salt water pool
at swimming speed that ranged from 2.6 to 4.9km/h
at swimming speed that ranged from 2.6 to 4.9km/h
During the race competitors maintained a constant stroke
During the race competitors maintained a constant stroke
rate & place until the last few hours when fatigue set in
rate & place until the last few hours when fatigue set in
62
63.
References
References
McArdle, WilliamD., Frank I. Katch, and Victor
McArdle, William D., Frank I. Katch, and Victor
L. Katch. 2000. Essentials of Exercise
L. Katch. 2000. Essentials of Exercise
Physiology 2
Physiology 2nd
nd
ed. Image Collection. Lippincott
ed. Image Collection. Lippincott
Williams & Wilkins.
Williams & Wilkins.
63