Download to read offline

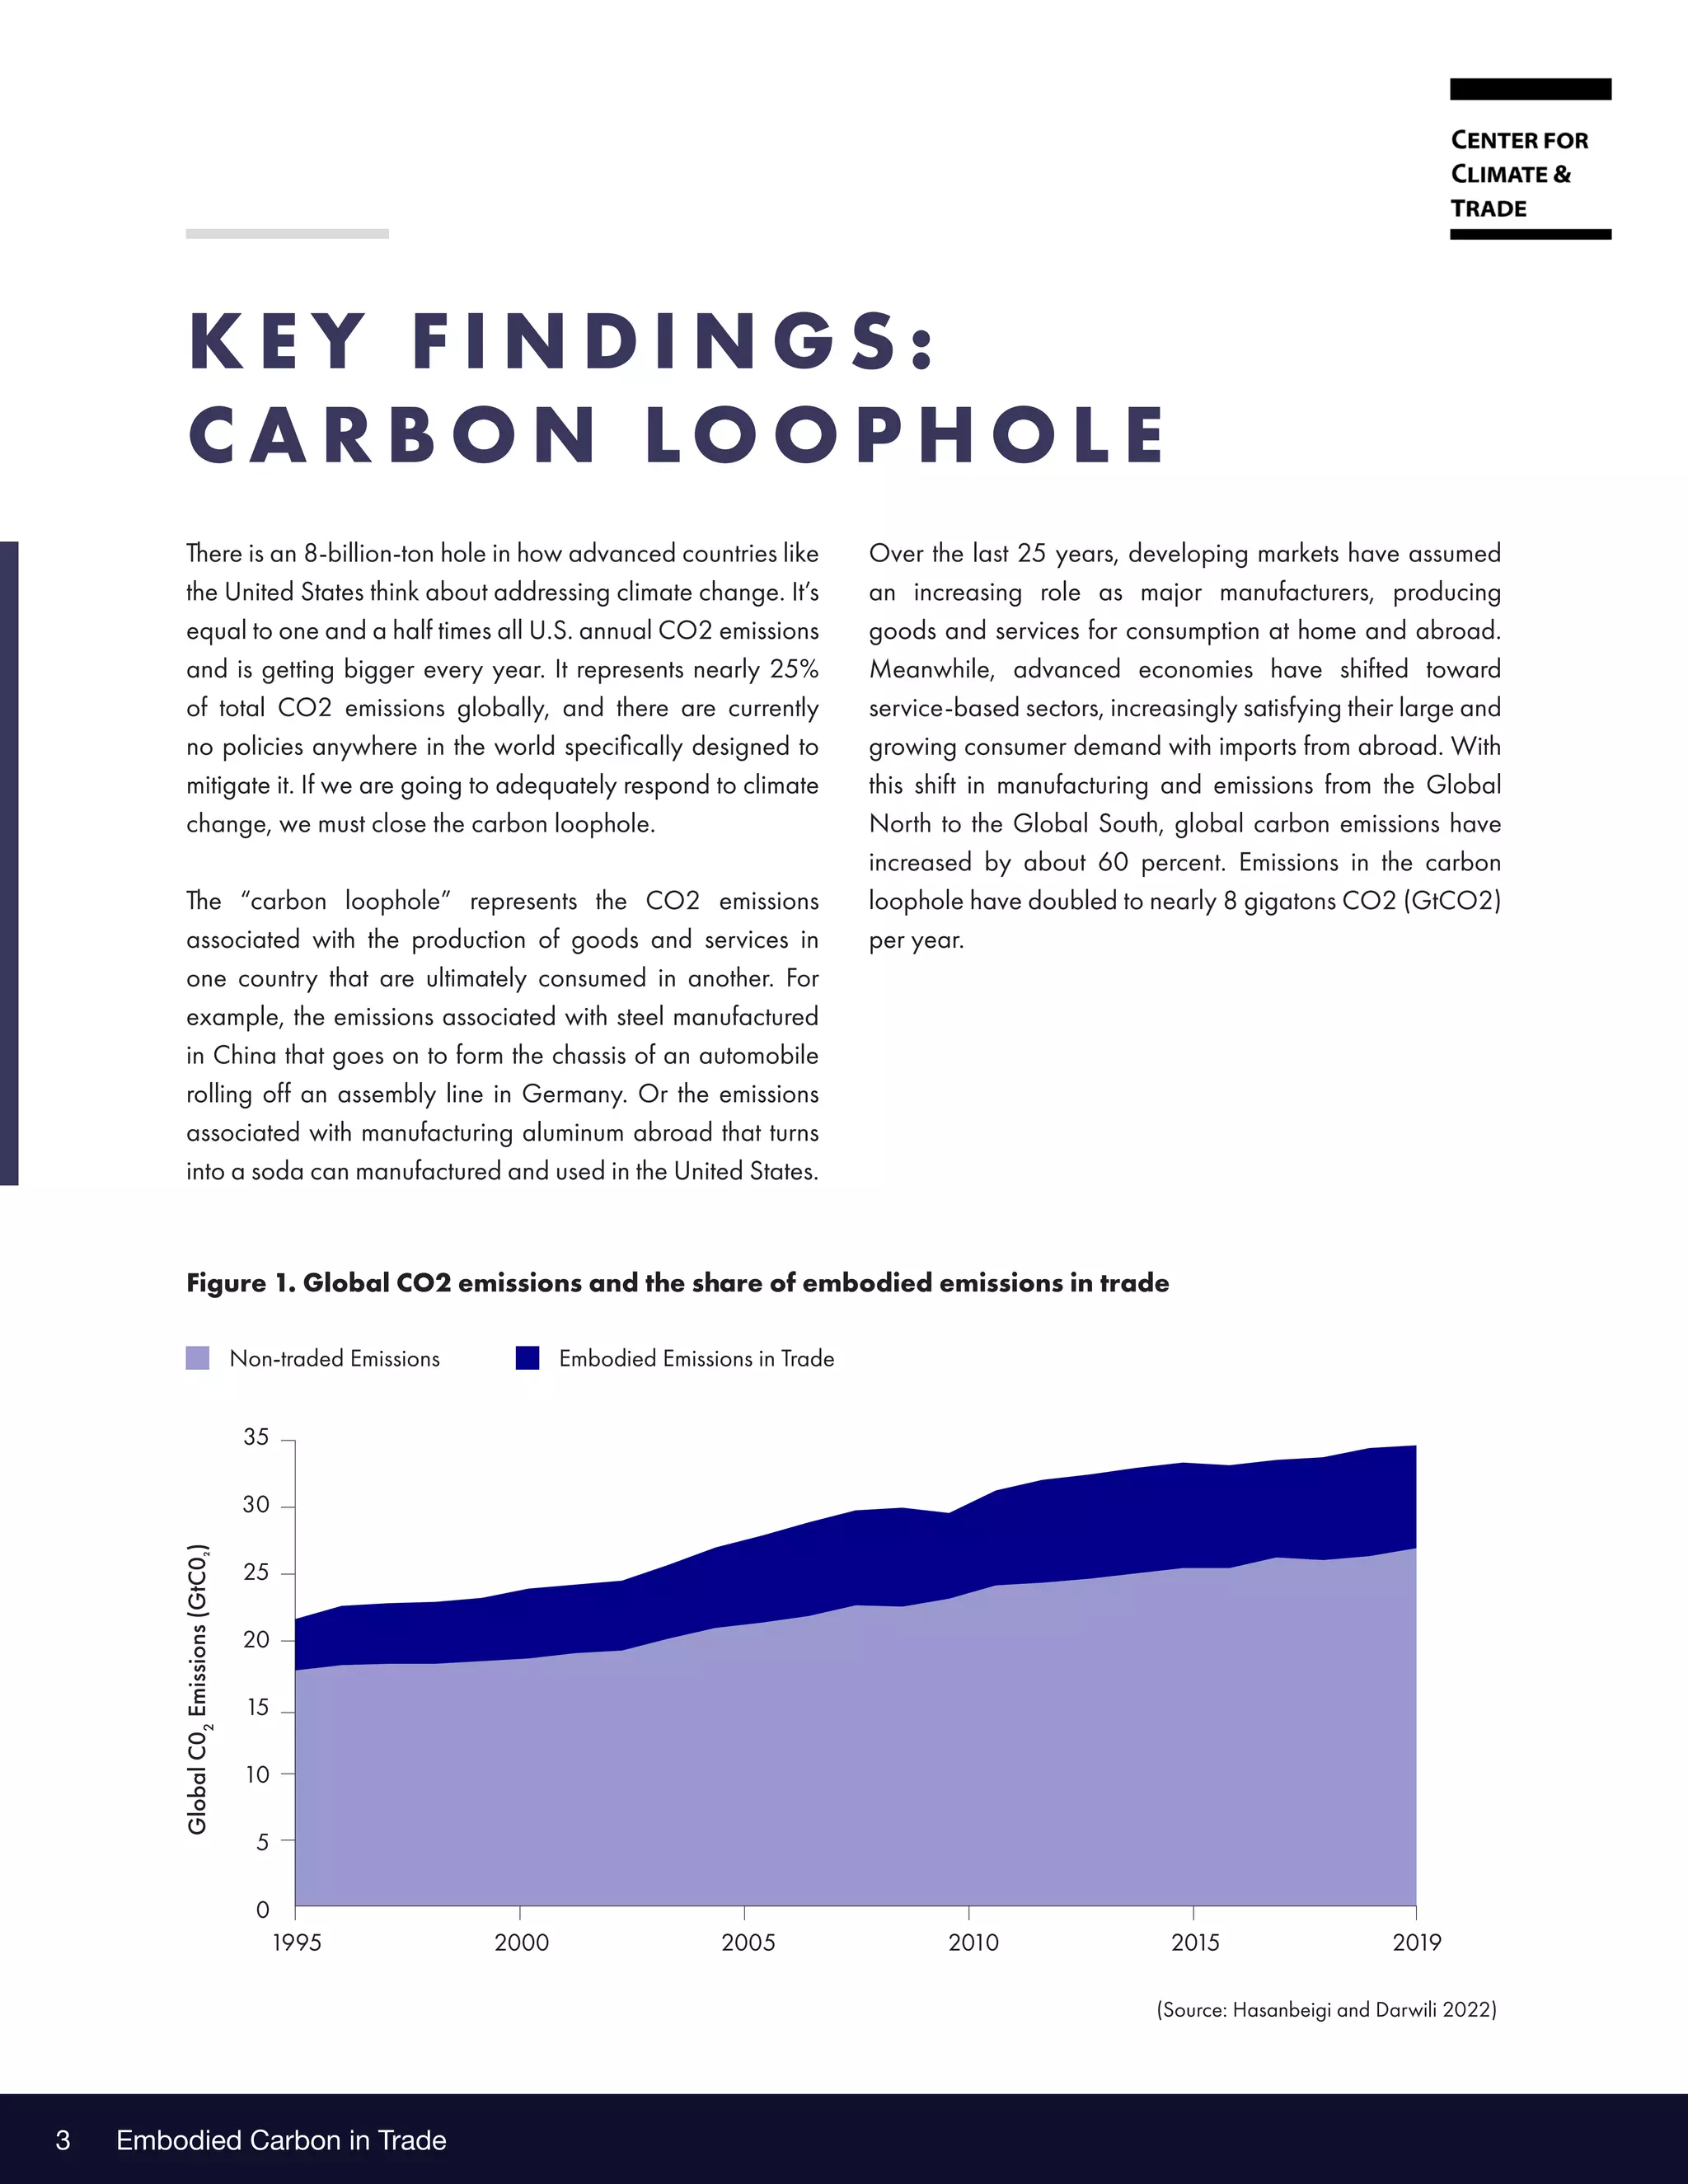
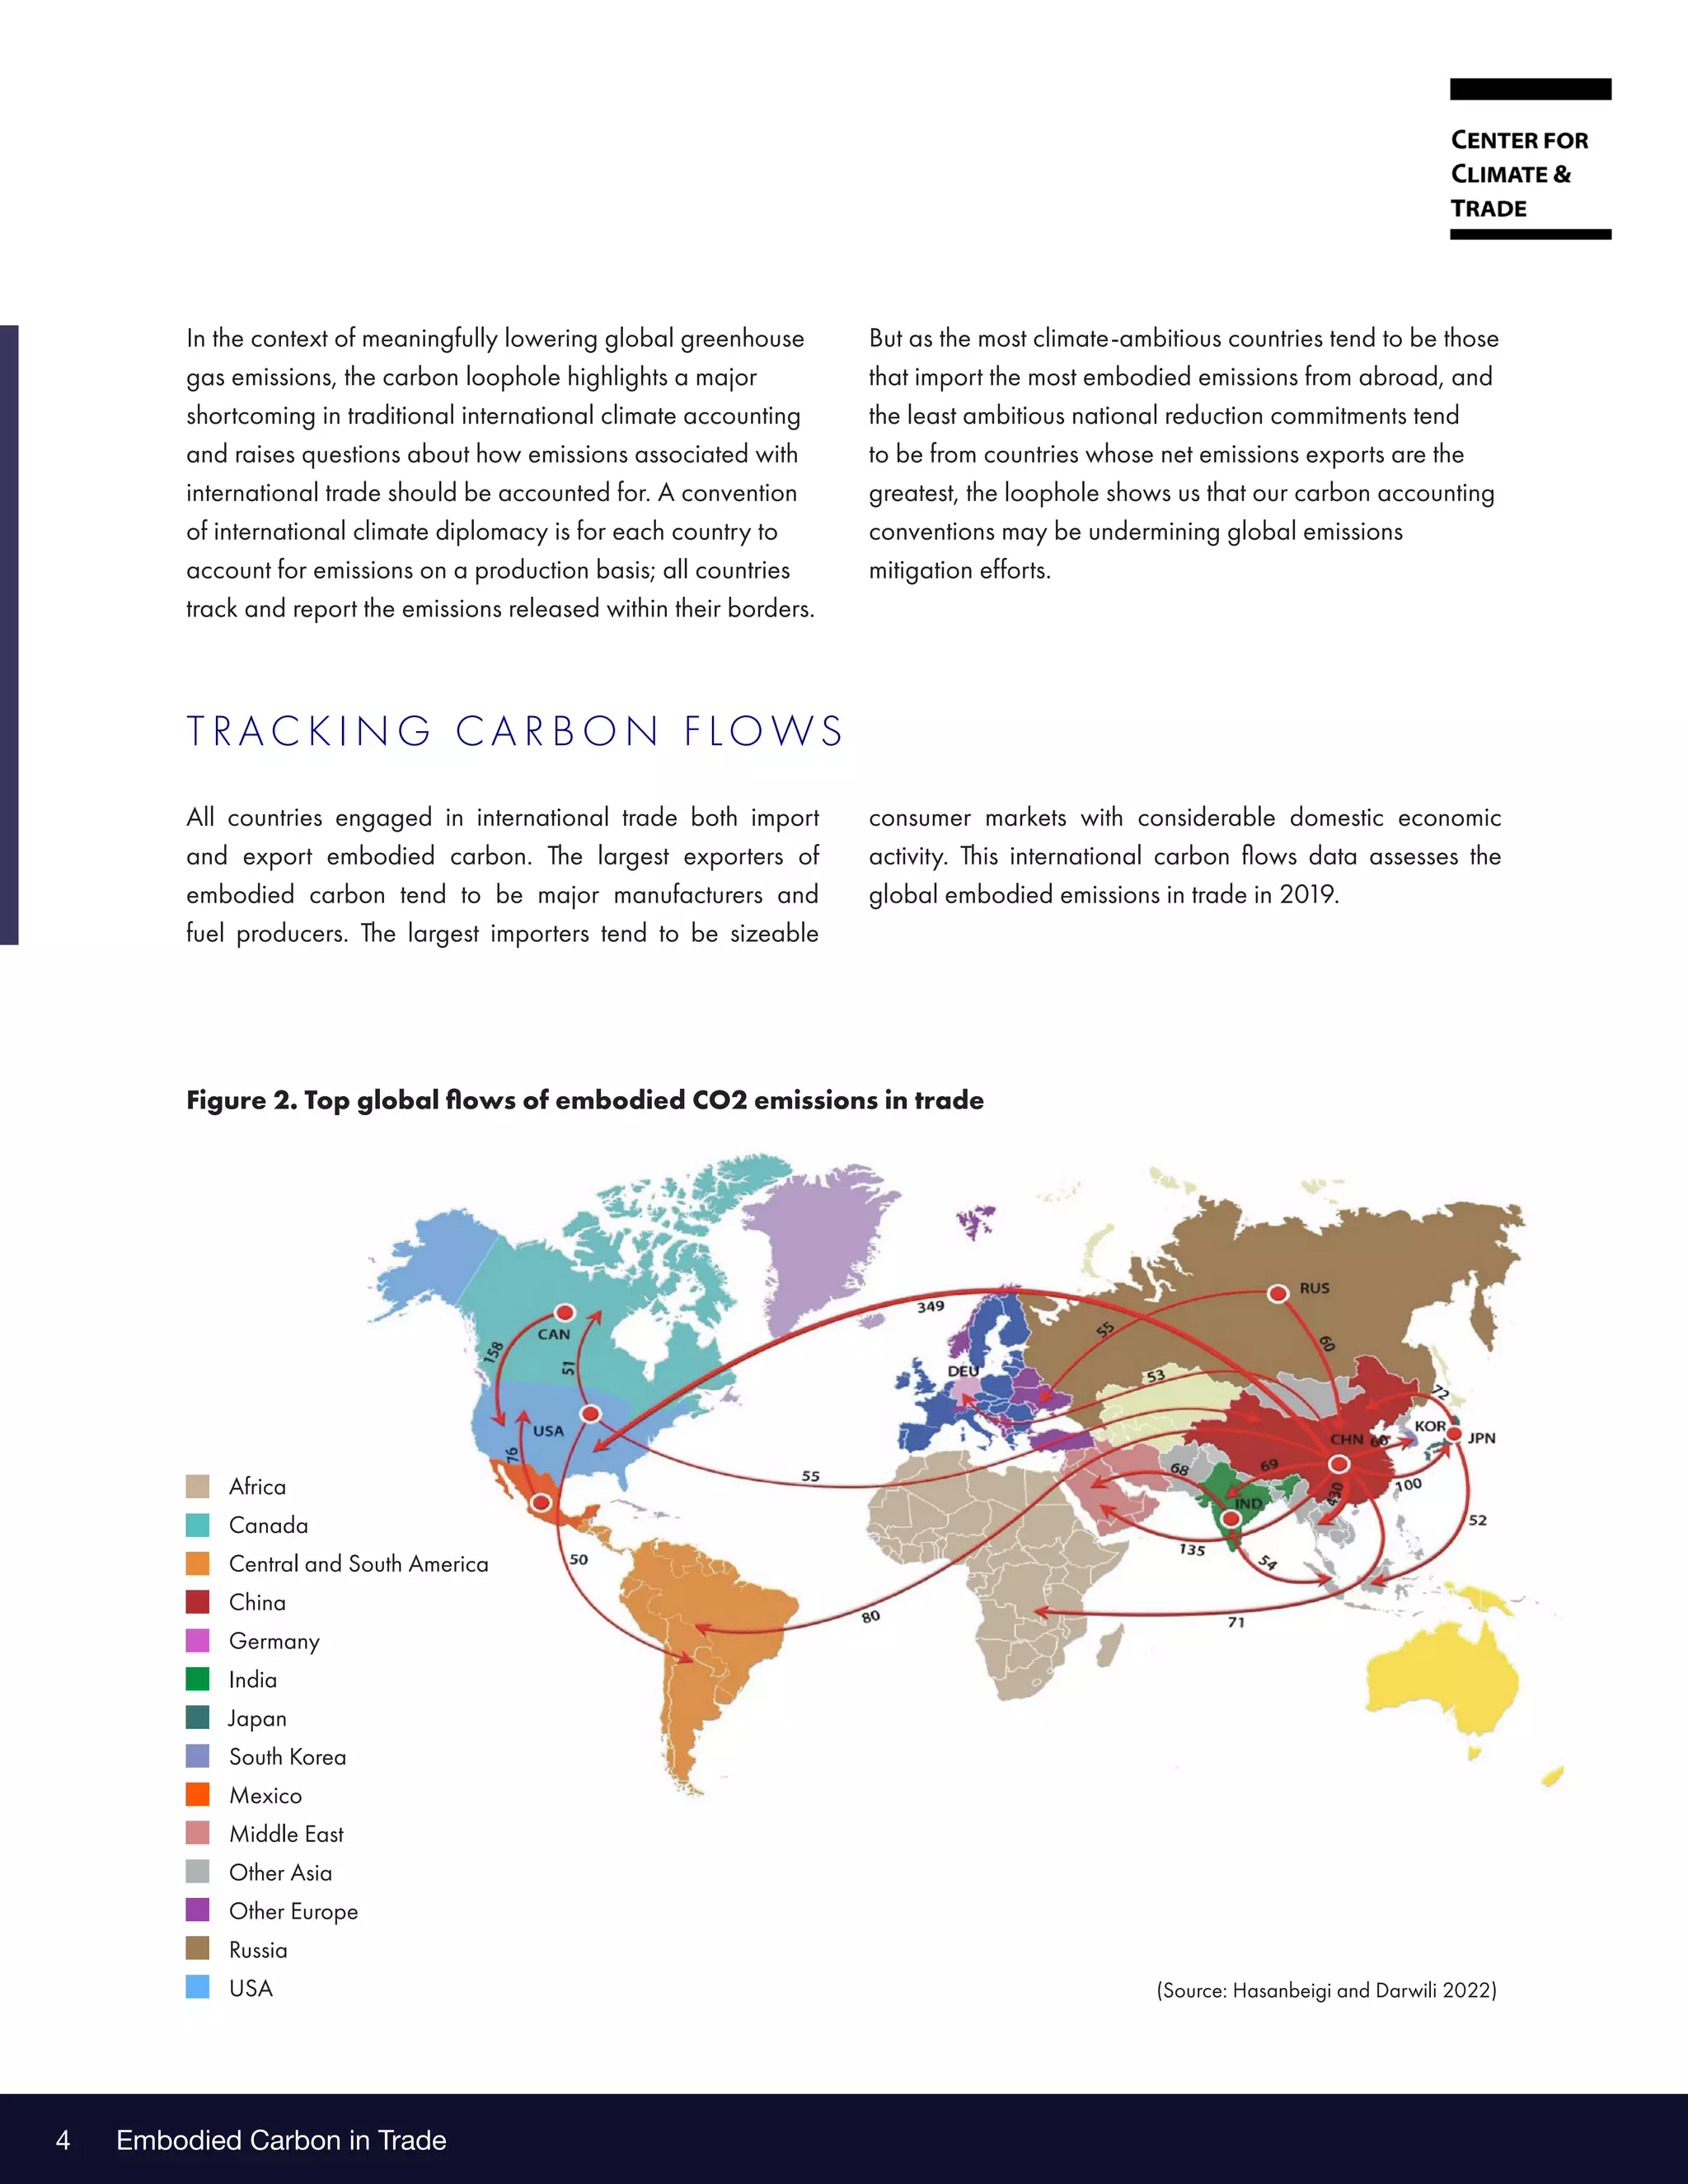
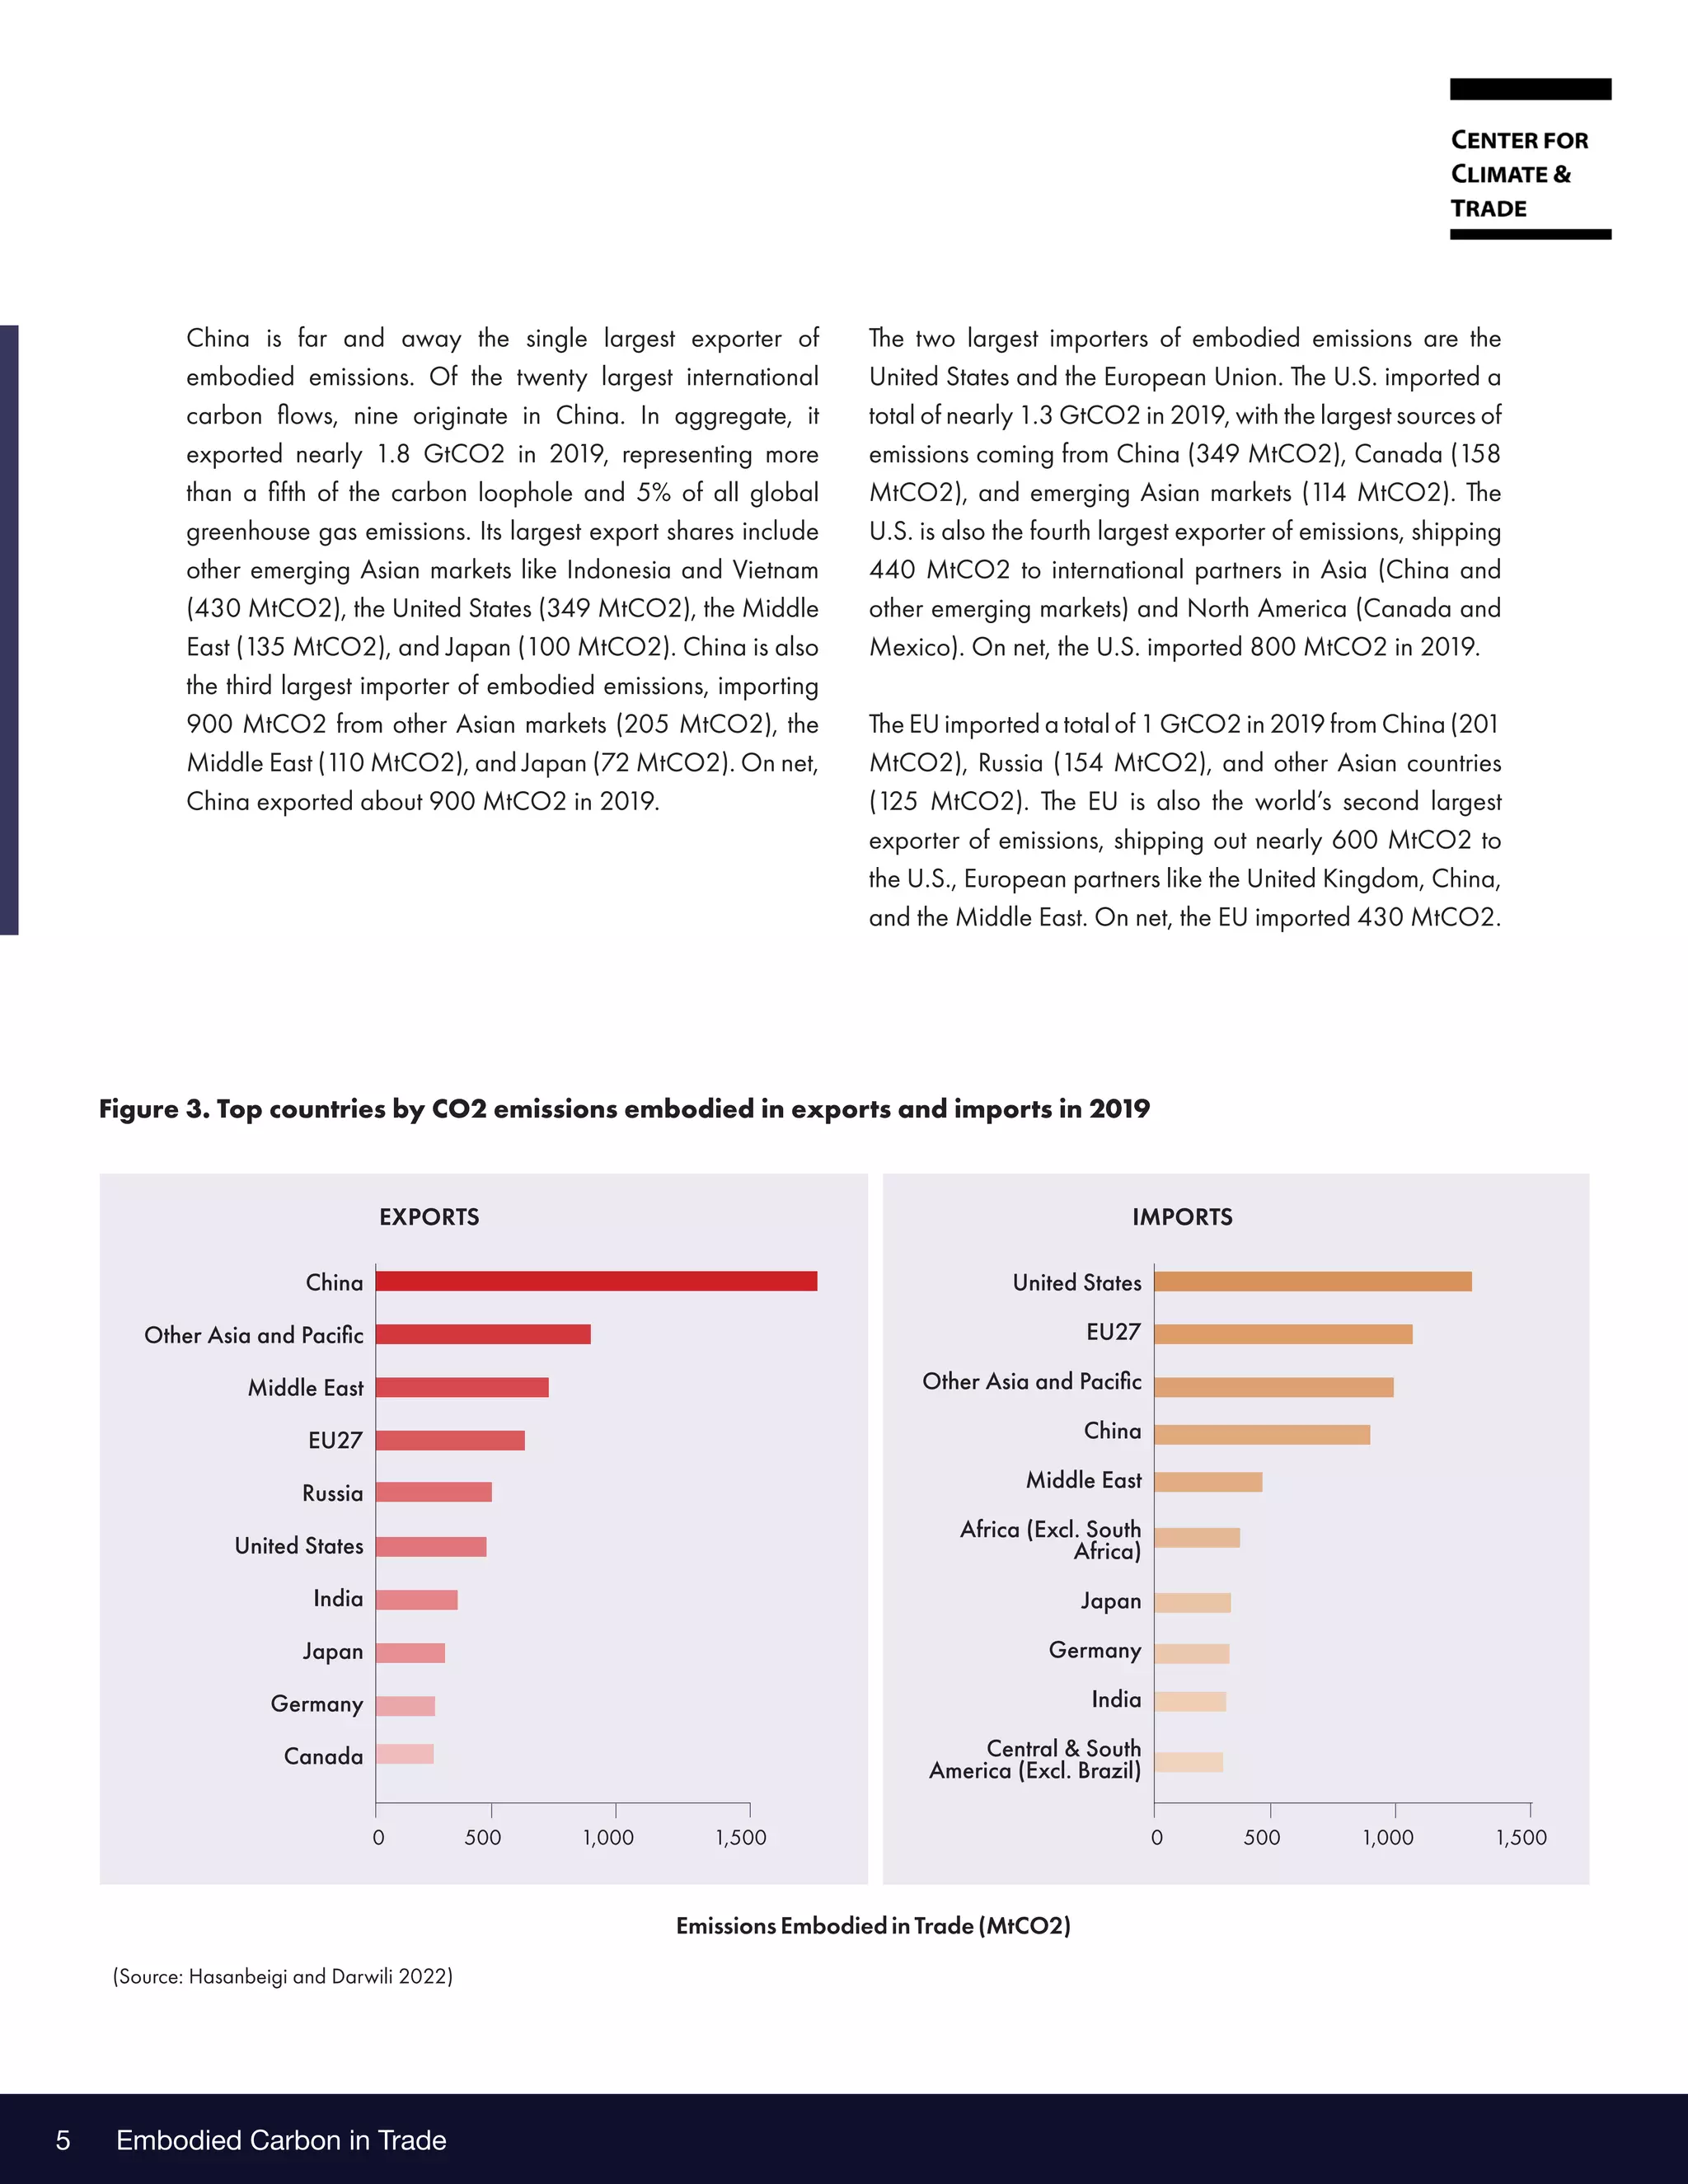


The document summarizes a report about the "carbon loophole" which represents the CO2 emissions associated with the production of goods in one country that are consumed in another. Some key findings: - The carbon loophole has doubled in size to 8 GtCO2 per year, undermining climate goals. China is the largest exporter and the US/EU are the largest importers. - The loophole shifts emissions from advanced to developing economies, exacerbating global emissions increases. It reflects "carbon leakage" as economic activity moves to places with lower environmental standards. - Closing the loophole requires cooperative international policies that value lower carbon goods, shift production to more efficient markets, and support developing countries in