SlideShare a Scribd company logo
October 2015 | wri.org/countryactions | 1
WHAT ARE OTHER COUNTRIES
DOING ON CLIMATE CHANGE?
As countries prepare to conclude an international climate agreement in Paris at the end of this year, this brief describes
the actions that a number of countries are taking on climate change, including adoption of greenhouse gas reduction
targets, shifts to renewable energy, increases in energy efficiency, and restoration of forests.
Already to date, 150 countries, including every major economy in the world, have submitted national climate plans
for the 2015 climate agreement, an increase from the 100 countries that submitted pre-2020 plans following the
Copenhagen climate talks. These plans are from countries representing nearly 90% of global emissions.
CHINA
▪▪ China has set targets to reduce its carbon dioxide
(CO2
) emissions per unit of GDP by 40–45 percent
from 2005 levels by 20201
and 60–65 percent by
2030.2
In an historic joint announcement with the
United States, China committed that its CO2
emissions
will peak around 2030 and that it will increase its
forest stock volume by 4.5 billion cubic meters (com-
pared with 2005).3
▪▪ China has committed to increase the share of non-
fossil fuels used in its primary energy consumption
to about 20 percent by 2030. This requires China
to deploy an additional 800–1,000 gigawatts of
non-fossil generation capacity, which is close to the
entire installed capacity of all the power plants in
the United States.4
The climate policies described below include actions from these national climate plans, as well as other policies that
countries have put in place.
150COUNTRIES
HAVE SUBMITTED
NATIONAL
CLIMATE PLANS
FROM COUNTRIES
REPRESENTING NEARLY
90% OF GLOBAL
EMISSIONS
▪▪ In 2014 China was the world’s number one investor
in renewable energy, investing $83.3 billion—nearly a
third of total global investment (Figure 1).5
▪▪ China plans6
to establish a national emissions trading
system7
starting in 2017.8
It currently has seven city
and provincial carbon-trading pilots, which together
constitute the second largest carbon market in the
world, after the European Union Emission Trading
System.9
▪▪ China’s Top 10,000 Energy-Consuming Enterprises
program (actually about 17,000 enterprises) covers
mostly the industrial firms that account for two-thirds
of the country’s energy use. It targets energy savings
of 250 million metric tons of coal equivalent10
over the
12th Five Year Plan (2011–15),11
equivalent to shutting
down 143 coal-fired plants for one year.12
October 2015 | wri.org/countryactions | 2
MEXICO
▪▪ In 2012 Mexico passed one of the first climate laws
in a developing country, the General Law on Climate
Change, outlining the country’s transition to a low-
carbon economy with a 50 percent reduction in emis-
sions from 2000 levels by 2050.13
▪▪ Mexico committed to reduce its greenhouse gas emis-
sions by 22 percent and its black carbon (soot) by 51
percent by 2030 relative to business-as-usual levels.14
▪▪ Mexico set a target for 40 percent of its energy to
come from low-emission energy sources by 2035, and
50 percent by 205015
including renewables as well as
nuclear and fossil fuels with carbon capture and stor-
age.
▪▪ Mexico set a target to cut deforestation rates to zero
by 2030.16
▪▪ In 2013, Mexico adopted light-duty vehicle CO2
and
fuel economy standards that aim to avoid 265 million
tons of CO2
emissions by 2032,17
equivalent to annual
greenhouse gas emissions from 50 million passenger
vehicles.18
Figure 1 | Global Investment in Renewable
Energy in 2014 (US$ Billions)
31%
30.8%
21.3%
14.2%
2.7% INDIA $7.4
OTHER $83.7
CHINA $83.3
EUROPE $57.5
U.S. $38.3
Source: See endnote 5
INDONESIA
▪▪ Indonesia committed to cut emissions by 29 percent
from business-as-usual levels by 2030.32
▪▪ Indonesia aims to achieve 87 percent of its 2020 miti-
gation target by reducing emissions from deforesta-
tion and peat land conversion.
▪▪ In May 2015, the Indonesian government renewed a
two-year moratorium on new palm oil plantation con-
cessions in primary natural forests and peat lands.33
The first moratorium, set in 2011, aimed to protect an
area the size of Japan from development.34
▪▪ Indonesia has also targeted 12.7 million hectares for
social forestry and ecosystem restoration by 2019 as
part of its national development plan.35
INDIA
▪▪ India has set targets to substantially increase its
renewable energy capacity, including increasing
its solar capacity to 100 gigawatts by 2022—a
twentyfold increase from current levels of 4 gigawatts
(Figure 2)—and increasing its wind power capacity
to 60 gigawatts by 2022 from current levels of
23.76 gigawatts.19
▪▪ India has committed to increase its non-fossil fuel en-
ergy sources to 40% of total energy sources by 203020
.
▪▪ India has committed to reduce CO2
emissions per unit
of GDP 33–35 percent below 2005 levels by 2030.20
▪▪ India is the first developing country to adopt a mar-
ket based mechanism, “Perform, Achieve and Trade”
(PAT), to improve energy intensity in industries and
aims for an emissions reduction of 26 million met-
ric tons of carbon dioxide equivalent by 2015, thus
contributing to the national target,21
and avoiding CO2
emissions from the equivalent of six power plants an-
nually.22
▪▪ India’s Ministry of Power set average fuel consump-
tion standards for passenger cars in January 2014 to
take effect in April 2017 and result in a cumulative re-
duction of 22.97 million metric tons of fuel consump-
tion, avoiding more than 66 million metric tons of CO2
emissions by 2025.23
This is equivalent to avoiding the
CO2
emissions of 13 million cars annually.24
October 2015 | wri.org/countryactions | 3
BRAZIL
▪▪ Brazil committed to reduce greenhouse gas emissions 37
percent in absolute terms below 2005 levels by 2025.25
▪▪ Brazil has set a target to increase its share of renew-
ables other than hydropower to 28–33 percent of its
total energy mix by 2030.25
Currently hydropower gen-
erates about 66 percent of Brazil’s electricity; and other
renewable energy sources, less than 10 percent.26
▪▪ Over the past decade, the rate of deforestation27
in the
Brazilian Amazon has dropped 70 percent compared
with the previous decade, keeping 3.2 billion metric
tons of CO2
emissions out of the atmosphere (Figure
3).28
This is equivalent to taking all U.S cars off the
road for three years.29
▪▪ In a recent U.S.–Brazil Joint Statement,30
Brazil
indicated that it will restore and reforest 12 million
hectares by 2030, which is equivalent in size to the
state of Pennsylvania.31
▪▪ The national energy policy, revised in 2014, aims to
increase renewable energy to 23 percent of primary
energy supply and to reduce the share of oil in the
energy mix to less than 25 percent by 2025.36
EUROPEAN UNION
▪▪ The European Union has decoupled greenhouse gas
emissions from economic growth: its 1990–12 GDP
growth was more than 44 percent while emissions
decreased by 19 percent (Figure 4).37
▪▪ The European Union has adopted policies to reduce
emissions by at least 40 percent below 1990 levels by
2030 and established a target to reduce emissions by
80–95 percent by 2050.38
Figure 2 | India Plans to Increase its Solar Power
Figure 3 | Over the Past Decade the Brazilian Amazon’s Rate of Deforestation
Dropped 70 Percent Compared with the Previous Decade
0
5
10
15
20
25
30
3.25 GtCO2
96 97 98 99 00 01 02 03 04 05 06 07 08 09 10 11 12 13
Annual Deforestation Deforestation Reduction Baseline
AnnualDeforestation(Sq.km)
Year
Solar Panels Installed:
4 GW
Previous 2022 Solar Goal:
20 GW
New 2022 Solar Goal:
100 GW
October 2015 | wri.org/countryactions | 4
Source: Nepstad et al. 2014, Science 344.
▪▪ European Union policies aim to increase the share of
renewable energy in its energy consumption mix to at
least 27 percent and increase energy efficiency by 30
percent by 2030.
▪▪ The European Union Emissions Trading Scheme,
launched in 2005, is operational in all 28 EU mem-
ber states plus Iceland, Norway, and Liechtenstein. It
was the first large greenhouse gas emissions trading
scheme in the world and remains the largest, covering
45 percent of EU greenhouse gas emissions.39
ETHIOPIA
▪▪ Ethiopia aims to achieve middle-income status by
2025 in a carbon neutral way through its climate resil-
ient green economy strategy.40
▪▪ In line with the strategy, Ethiopia committed to re-
duce emissions by 64 percent from business-as-usual
by 2030 (Figure 5).41
▪▪ Ethiopia made a significant pledge to restore 15 mil-
lion hectares of degraded and deforested land—one-
sixth of its land area—to productivity by 2025.42
CHILE
▪▪ Chile committed to reduce CO2
emissions per unit of
GDP 30 percent below 2007 levels by 2030.43
▪▪ Chile is the first country in Latin America to set a
binding renewable energy generation target that re-
quires that by 2025 at least 20 percent of the country’s
energy will come from renewable sources excluding
large hydroelectric plants (solar, wind, geothermal,
tidal, biomass, and small-hydro).44
▪▪ Chile also set an ambitious target to generate 70 per-
cent of its electricity from renewable sources, mainly
solar and wind, by 2050, a sevenfold increase from
current levels.45
▪▪ To reduce emissions from power generation, Chile
approved a carbon tax on thermal power generators
of 50 megawatts or more as part of a broader fiscal re-
form. Starting in 2017, emitters will have to pay US$5
per metric ton of CO2
emissions.46
Figure 4 | The European Union Decoupled Economic Growth from Emissions
Figure 5 | Ethiopia Plans to Reduce
Emissions by 64 Percent by 2030
0
6
12
18
0
2000
4000
6000
1990 1992 1994 1996 1998 2000 2002 2004 2006 2008 2010 2012
TotalGHGEmission(MtCO2
e)
Year
GDP-USD[TrillionUS$(2005)]
Total GHG Emissions Including Land-Use Change and Forestry
GDP-USD [Trillion US$ (2005)]
2010 2030:
Business
as Usual
2030:
Green
Economy
64%
0
100
200
300
400
EmissionsPerYear(MtCO2
e)
150 145
400
October 2015 | wri.org/countryactions | 5
ENDNOTES
1.	 China FAQs, “China’s State Council Unveils 40–45% Carbon Intensity
Target,” Blog, March3, 2015, http://www.chinafaqs.org/blog-posts/
chinas-state-council-unveils-40-45-carbon-intensity-target.
2.	 “Enhanced Actions on Climate Change: China’s Intended Nationally
Determined Contributions,” submitted to UNFCCC June 30, 2015,
http://www4.unfccc.int/submissions/INDC/Published%20Documents/
China/1/China’s%20INDC%20-%20on%2030%20June%202015.pdf.
3.	 The White House, “U.S.–China Joint Announcement on Climate Change
and Clean Energy Cooperation,” Fact Sheet/Press Release, November
11, 2014, https://www.whitehouse.gov/the-press-office/2014/11/11/
fact-sheet-us-china-joint-announcement-climate-change-and-clean-
energy-c.
4.	 ChinaFAQs, “U.S.-China Accord Includes Important Steps on Non-Fos-
sil Energy,” Blog, March 3, 2015 http://www.chinafaqs.org/blog-posts/
us-china-accord-includes-important-steps-non-fossil-energy#sthash.
ImwtH7GZ.dpuf.
5.	 China installed 13 gigawatts of solar photovoltaic projects in 2014,
roughly 70 percent more than any other country had ever installed
in a single year, see http://www.chinafaqs.org/files/chinainfo/Chi-
naFAQs_Renewable_Energy_Graphical_Overview_of_2014.pdf;
China also installed a record 20.7 gigawatts of wind power capacity
in 2014. Bloomberg Business, January 22, 2015 “ U.S. Wind-Power
Installations Rose Sixfold in 2014: BNEF,” http://www.bloomberg.
com/news/articles/2015-01-22/u-s-wind-power-installations-rose-
sixfold-in-2014-bnef.
6.	 U.S.-China Joint Presidential Statement on Climate Change, September
25, 2015. In the joint statement, China made other announcements,
including climate assistance to developing countries, and limits on
financing for projects with carbon emissions. https://www.whitehouse.
gov/the-press-office/2015/09/25/us-china-joint-presidential-statement-
climate-change.
7.	 China’s national emissions trading system will initially cover key
industrial sectors such as iron and steel, power generation, chemicals,
building materials, paper-making, and non-ferrous metals, see https://
www.whitehouse.gov/the-press-office/2015/09/25/us-china-joint-
presidential-statement-climate-change.
8.	 Some provinces will be allowed to delay participation in the emissions
trading system if they do not have the technical infrastructure to partici-
pate from the beginning, see http://uk.reuters.com/article/2014/08/31/
china-carbontrading-idUKL3N0R107420140831.
9.	 ChinaFAQs, “Emissions Trading in China: First Reports from the Field,”
January 23, 2014, http://www.chinafaqs.org/blog-posts/emissions-
trading-china-first-reports-field.
10.	 This is equivalent to about 600 million tons of CO2
. ChinaFAQs,
“China’s Ten Key Energy Efficiency Projects,” Blog, November 11, 2009,
http://www.chinafaqs.org/library/chinafaqs-chinas-ten-key-energy-
efficiency-projects#sthash.iAEjcrD4.dpuf.
11.	 Institute for Industrial Productivity, “Top-10,000 Energy-Consuming
Enterprises Program,” http://iepd.iipnetwork.org/policy/top-10000-en-
ergy-consuming-enterprises-program.
12.	 U.S. Environmental Protection Agency, Greenhouse Gas Equivalencies
Calculator, http://www.epa.gov/cleanenergy/energy-resources/calcula-
tor.html#results.
13.	 Camara de Diputados del H. Congresso de la Union, June 2012. Ley
General de Cambio Climatico, Estados Unidos Mexicanos, http://www.
diputados.gob.mx/LeyesBiblio/pdf/LGCC_130515.pdf.
14.	 This commitment implies a net emissions peak starting in 2026, de-
coupling greenhouse gas emissions from economic growth: emissions
intensity per unit of GDP will reduce by around 40 percent from 2013 to
2030. “Mexico Intended National Determined Contribution,” submit-
ted to UNFCCC March 30, 2015, http://www4.unfccc.int/submissions/
INDC/Published%20Documents/Mexico/1/MEXICO%20INDC%20
03.30.2015.pdf.
15.	 International Renewable Energy Agency (IRENA), 2015, “Renewable
Energy Prospects: Mexico, REmap 2030 Analysis,” IRENA, Abu Dhabi,
http://www.irena.org/DocumentDownloads/Publications/IRENA_RE-
map_Mexico_report_2015.pdf.
16.	 Government of Mexico, “Mexico Intended National Determined Contri-
bution,” submitted to UNFCCC March 30, 2015, http://www4.unfccc.int/
submissions/INDC/Published%20Documents/Mexico/1/MEXICO%20
INDC%2003.30.2015.pdf.
17.	 International Council for Clean Transportation, “Mexico Light-duty
Vehicle CO2
and Fuel Economy Standards,” Policy Update, July 2013,
http://www.theicct.org/sites/default/files/publications/ICCTupdate_
Mexico_LDVstandards_july2013.pdf.
18.	 U.S. Environmental Protection Agency, Greenhouse Gas Equivalencies
Calculator, http://www.epa.gov/cleanenergy/energy-resources/calcula-
tor.html#results.
19.	 World Resources Institute, “As Obama and Modi Meet, 4 Opportunities
for US-India Action on Clean Energy and Climate,” Blog, January 21,
2015, http://www.wri.org/blog/2015/01/obama-and-modi-meet-4-op-
portunities-us-india-action-clean-energy-and-climate.
20.	 Government of India, “India’s Intended Nationally Determined Contribu-
tion: Working towards Climate Justice,” submitted to UNFCCC on Octo-
ber 1, 2015, http://www4.unfccc.int/submissions/INDC/Published%20
Documents/India/1/INDIA%20INDC%20TO%20UNFCCC.pdf.
21.	 Climate and Development Knowledge Network, “Inside Stories: Creating
Market Support for Energy,” January 2013, http://r4d.dfid.gov.uk/PDF/
Outputs/CDKN/India-PAT_InsideStory.pdf.
22.	 U.S. Environmental Protection Agency, Greenhouse Gas Equivalencies
Calculator http://www2.epa.gov/energy/greenhouse-gas-equivalencies-
calculator.
23.	 Shakti Sustainable Energy Foundation, “India Climate Report,” July
2015, http://shaktifoundation.in/wp-content/uploads/2015/07/India-
Climate-Report-Vol.-1.pdf.
24.	 U.S. Environmental Protection Agency, Greenhouse Gas Equivalencies
Calculator http://www2.epa.gov/energy/greenhouse-gas-equivalencies-
calculator.
October 2015 | wri.org/countryactions | 6
25.	 Government of Brazil, “Intended Nationally Determined Contribution
towards Achieving the Objective of the United Nations Framework
Convention on Climate Change,” submitted to UNFCCC on September
28, 2015, http://www4.unfccc.int/submissions/INDC/Published%20
Documents/Brazil/1/BRAZIL%20iNDC%20english%20FINAL.pdf.
26.	 World Resources Institute, “A Closer Look at Brazil’s New Climate Plan
(INDC)”, Blog, September 30, 2015 http://www.wri.org/blog/2015/09/
closer-look-brazils-new-climate-plan-indc.
27.	 Brazil’s forest laws aim to reduce annual deforestation by 80 percent in
the Amazon by 2020, compared with the 1996–2005 historical average,
and to reduce annual deforestation in the savannahs by 40 percent by
2020, compared with the 1999–2000 historical average.
28.	 Through a tremendous decline in the rate of Amazon deforestation
from 2006–13, Brazil has avoided 3.2 gigatons of CO2
emissions to
the atmosphere, compared with the historic baseline (annual average
1996–2005). Nepstad et al. , 2014, Science 344, http://earthinnovation.
org/our-work/global/redd-policy-initiative/.
29.	 National Geographic, “Brazil Leads World in Reducing Carbon Emis-
sions by Slashing Deforestation,” June 5, 2014, http://news.national-
geographic.com/news/2014/06/140605-brazil-deforestation-carbon-
emissions-environment/.
30.	 The White House, “U.S.-Brazil Joint Statement on Climate Change,”
Press Release, June 30, 2015, https://www.whitehouse.gov/the-press-
office/2015/06/30/us-brazil-joint-statement-climate-change.
31.	 The state of Pennsylvania has a total area of 46,054.35 square miles
(11928021.89 hectares).
32.	 Government of Indonesia, “Intended Nationally Determined Contribu-
tion of Indonesia,” submitted to UNFCCC on September 24, 2015,
http://www4.unfccc.int/submissions/INDC/Published%20Documents/
Indonesia/1/INDC_REPUBLIC%20OF%20INDONESIA.pdf.
33.	 Kemen Austin , Ariana Alisjahbana, Taryono Darusman, Rachmat
Boediono, Bambang Eko Budianto, Christian Purba, Giorgio Budi
Indrarto, Erica Pohnan, Andika Putraditama, and Fred Stolle, 2014, “In-
donesia’s Forest Moratorium: Impacts and Next Steps,” Working Paper,
World Resources Institute, Washington DC, http://www.wri.org/sites/
default/files/indonesia-forest-moratorium-next-steps.pdf .
34.	 World Resources Institute, “2 Things You Need to Know about Indone-
sia’s Forest Moratorium,” Blog, January 30, 2014, http://wri-indonesia.
org/blog/2-things-you-need-know-about-indonesias-forest-morato-
rium#sthash.OBErRjua.dpuf.
35.	 Republic of Indonesia, Rencana Pembangunan Jangka Menengah Na-
sional RPJMN 2015-2019, http://www.bpkp.go.id/public/upload/unit/
sesma/files/Buku%20II%20RPJMN%202015-2019.pdf .
36.	 International Energy Agency (IEA), 2014, World Energy Outlook special
report for Southeast Asia, IEA, Paris.
37.	 EU Submission Technical Annex “Kyoto Ambition Mechanism Report,”
April 2014, Technical Paper, http://ec.europa.eu/clima/policies/inter-
national/negotiations/docs/eu_submission_20140430_technical_an-
nex_en.pdf.
38.	 Adopted by EU leaders in October 2014, the plan builds on the 2020
climate and energy package. “2030 Climate  Energy Framework,”
http://ec.europa.eu/clima/policies/strategies/2030/index_en.htm.
39.	 A ‘Cap and Trade’ System, http://ec.europa.eu/clima/policies/ets/
index_en.htm.
40.	 Federal Democratic Republic of Ethiopia, 2011, “Ethiopia’s Climate-
Resilient Green Economy Green Economy Strategy,” http://www.undp.
org/content/dam/ethiopia/docs/Ethiopia%20CRGE.pdf.
41.	 Federal Democratic Republic of Ethiopia, “Intended Nationally
Determined Contribution (INDC) of the Federal Democratic Republic
of Ethiopia,” submitted to UNFCCC on June 10, 2015, http://www4.
unfccc.int/submissions/INDC/Published%20Documents/Ethiopia/1/
INDC-Ethiopia-100615.pdf.
42.	 World Resources Institute, “Ethiopia Commits to Restore One-Sixth
of its Land,” October 2014, Blog, http://www.wri.org/blog/2014/10/
ethiopia-commits-restore-one-sixth-its-land .
43.	 Government of Chile, “Intended Nationally Determined Contributions
of Chile,” submitted to UNFCCC on September 29, 2015, http://www4.
unfccc.int/submissions/INDC/Published%20Documents/Chile/1/
INDC%20FINAL%20SEPT%202015.pdf .
44.	 International Renewable Energy Agency (IRENA), 2015, “Renewable
Energy in Latin America 2015: An Overview of Policies,” IRENA Policy
Brief, http://www.irena.org/DocumentDownloads/Publications/IRENA_
RE_Latin_America_Policies_2015.pdf .
45.	 Chilean Association for Renewable Energies, ACERA AG, “Las energias
renovables son un eje esencial para las politicas publicas de energia
al 2050”, http://www.acera.cl/las-energias-renovables-son-un-eje-
esencial-para-las-politicas-publicas-de-energia-al-2050/.
46.	 IRENA, 2015.
Contact
CHRISTINA DECONCINI
Director, Government Affairs
cdeconcini@wri.org | +1 (202) 729-7738

More Related Content

What's hot

A short analysis of green investment potential in europe and beyond
A short analysis of green investment potential in europe and beyondA short analysis of green investment potential in europe and beyond
A short analysis of green investment potential in europe and beyond
Serena Liuni
 
CCXG Forum, September 2021, Timur Gul
CCXG Forum, September 2021, Timur GulCCXG Forum, September 2021, Timur Gul
CCXG Forum, September 2021, Timur Gul
OECD Environment
 
Jos Delbeke - EU Climate Change Policy
Jos Delbeke - EU Climate Change PolicyJos Delbeke - EU Climate Change Policy
Jos Delbeke - EU Climate Change Policy
European Journalism Centre
 
Post2015 mazria(architecture2030)roadmap zero emissions ccxg gf march2014-pre...
Post2015 mazria(architecture2030)roadmap zero emissions ccxg gf march2014-pre...Post2015 mazria(architecture2030)roadmap zero emissions ccxg gf march2014-pre...
Post2015 mazria(architecture2030)roadmap zero emissions ccxg gf march2014-pre...OECD Environment
 
The Strategy of the European Union on the Climate Change
The Strategy of the European Union on the Climate ChangeThe Strategy of the European Union on the Climate Change
The Strategy of the European Union on the Climate Change
Gerardo A. Escamilla
 
Proposal for a New Climate Target
Proposal for a New Climate TargetProposal for a New Climate Target
Proposal for a New Climate Target
Naoyuki Yamagishi
 
Cb Low Carbon Sa Media Aug 09
Cb   Low Carbon Sa Media Aug 09Cb   Low Carbon Sa Media Aug 09
Cb Low Carbon Sa Media Aug 09
equitywatch
 
4.3.shi ji gao environmental and industrial policies
4.3.shi ji gao environmental and industrial policies4.3.shi ji gao environmental and industrial policies
4.3.shi ji gao environmental and industrial policies
OECD Environment
 
City of Oconomowoc Utilities Updated 25x25 Plan
City of Oconomowoc Utilities Updated 25x25 Plan City of Oconomowoc Utilities Updated 25x25 Plan
City of Oconomowoc Utilities Updated 25x25 Plan
Lisa Geason-Bauer
 
Assessing the achieved and missed co-benefits of INDCs
Assessing the achieved and missed co-benefits of INDCsAssessing the achieved and missed co-benefits of INDCs
Assessing the achieved and missed co-benefits of INDCs
NewClimate Institute
 
Lessons Learnt From Unilateral Process of Reducing Emissions From Land-based ...
Lessons Learnt From Unilateral Process of Reducing Emissions From Land-based ...Lessons Learnt From Unilateral Process of Reducing Emissions From Land-based ...
Lessons Learnt From Unilateral Process of Reducing Emissions From Land-based ...
ASB Partnership for the Tropical Forest Margins
 
Policy and legislative environment for value addition for agro-based industri...
Policy and legislative environment for value addition for agro-based industri...Policy and legislative environment for value addition for agro-based industri...
Policy and legislative environment for value addition for agro-based industri...
ILRI
 
The importance of renewable energy resources in the long-term energy strategy...
The importance of renewable energy resources in the long-term energy strategy...The importance of renewable energy resources in the long-term energy strategy...
The importance of renewable energy resources in the long-term energy strategy...
EBAconference
 
Elina rantanen - City of Turku
Elina rantanen - City of TurkuElina rantanen - City of Turku
Elina rantanen - City of Turku
Local Renewables
 
ENV GLOBAL FORUM OCT 2016 - Session 3 - Sir David King
ENV GLOBAL FORUM OCT 2016 - Session 3 - Sir David King ENV GLOBAL FORUM OCT 2016 - Session 3 - Sir David King
ENV GLOBAL FORUM OCT 2016 - Session 3 - Sir David King
OECD Environment
 
AGM 2010 presentations
AGM 2010 presentations AGM 2010 presentations
AGM 2010 presentations
Vicky
 
ETP 2017 Webinar - Part I
ETP 2017 Webinar - Part IETP 2017 Webinar - Part I
ETP 2017 Webinar - Part I
International Energy Agency
 

What's hot (20)

A short analysis of green investment potential in europe and beyond
A short analysis of green investment potential in europe and beyondA short analysis of green investment potential in europe and beyond
A short analysis of green investment potential in europe and beyond
 
Insight climate change_india
Insight climate change_indiaInsight climate change_india
Insight climate change_india
 
CCXG Forum, September 2021, Timur Gul
CCXG Forum, September 2021, Timur GulCCXG Forum, September 2021, Timur Gul
CCXG Forum, September 2021, Timur Gul
 
Jos Delbeke - EU Climate Change Policy
Jos Delbeke - EU Climate Change PolicyJos Delbeke - EU Climate Change Policy
Jos Delbeke - EU Climate Change Policy
 
P1_VanBegin
P1_VanBeginP1_VanBegin
P1_VanBegin
 
D1_Hewitt
D1_HewittD1_Hewitt
D1_Hewitt
 
Post2015 mazria(architecture2030)roadmap zero emissions ccxg gf march2014-pre...
Post2015 mazria(architecture2030)roadmap zero emissions ccxg gf march2014-pre...Post2015 mazria(architecture2030)roadmap zero emissions ccxg gf march2014-pre...
Post2015 mazria(architecture2030)roadmap zero emissions ccxg gf march2014-pre...
 
The Strategy of the European Union on the Climate Change
The Strategy of the European Union on the Climate ChangeThe Strategy of the European Union on the Climate Change
The Strategy of the European Union on the Climate Change
 
Proposal for a New Climate Target
Proposal for a New Climate TargetProposal for a New Climate Target
Proposal for a New Climate Target
 
Cb Low Carbon Sa Media Aug 09
Cb   Low Carbon Sa Media Aug 09Cb   Low Carbon Sa Media Aug 09
Cb Low Carbon Sa Media Aug 09
 
4.3.shi ji gao environmental and industrial policies
4.3.shi ji gao environmental and industrial policies4.3.shi ji gao environmental and industrial policies
4.3.shi ji gao environmental and industrial policies
 
City of Oconomowoc Utilities Updated 25x25 Plan
City of Oconomowoc Utilities Updated 25x25 Plan City of Oconomowoc Utilities Updated 25x25 Plan
City of Oconomowoc Utilities Updated 25x25 Plan
 
Assessing the achieved and missed co-benefits of INDCs
Assessing the achieved and missed co-benefits of INDCsAssessing the achieved and missed co-benefits of INDCs
Assessing the achieved and missed co-benefits of INDCs
 
Lessons Learnt From Unilateral Process of Reducing Emissions From Land-based ...
Lessons Learnt From Unilateral Process of Reducing Emissions From Land-based ...Lessons Learnt From Unilateral Process of Reducing Emissions From Land-based ...
Lessons Learnt From Unilateral Process of Reducing Emissions From Land-based ...
 
Policy and legislative environment for value addition for agro-based industri...
Policy and legislative environment for value addition for agro-based industri...Policy and legislative environment for value addition for agro-based industri...
Policy and legislative environment for value addition for agro-based industri...
 
The importance of renewable energy resources in the long-term energy strategy...
The importance of renewable energy resources in the long-term energy strategy...The importance of renewable energy resources in the long-term energy strategy...
The importance of renewable energy resources in the long-term energy strategy...
 
Elina rantanen - City of Turku
Elina rantanen - City of TurkuElina rantanen - City of Turku
Elina rantanen - City of Turku
 
ENV GLOBAL FORUM OCT 2016 - Session 3 - Sir David King
ENV GLOBAL FORUM OCT 2016 - Session 3 - Sir David King ENV GLOBAL FORUM OCT 2016 - Session 3 - Sir David King
ENV GLOBAL FORUM OCT 2016 - Session 3 - Sir David King
 
AGM 2010 presentations
AGM 2010 presentations AGM 2010 presentations
AGM 2010 presentations
 
ETP 2017 Webinar - Part I
ETP 2017 Webinar - Part IETP 2017 Webinar - Part I
ETP 2017 Webinar - Part I
 

Viewers also liked

24 feburary
24 feburary24 feburary
24 feburary
Safalta Vigyan
 
Pristup cjelovitom mjerenju i upravljanju performancama poslovnog sustava
Pristup cjelovitom mjerenju i upravljanju performancama poslovnog sustavaPristup cjelovitom mjerenju i upravljanju performancama poslovnog sustava
Pristup cjelovitom mjerenju i upravljanju performancama poslovnog sustava
pero periuc
 
Quidditch
QuidditchQuidditch
Quidditch
Bertangy
 
La creación de súper materiales
La creación de súper materialesLa creación de súper materiales
La creación de súper materiales
UNACARTemasSelectosdeFisica
 
La robótica
La robóticaLa robótica
La robótica
dayanavivanco1995
 
Research on States to Bahamas cable 2010
Research on States to Bahamas cable 2010Research on States to Bahamas cable 2010
Research on States to Bahamas cable 2010Albert Maciel
 
Bethany Barr Creative Writing Piece
Bethany Barr Creative Writing PieceBethany Barr Creative Writing Piece
Bethany Barr Creative Writing PieceBethany Barr
 
Globes 2016
Globes 2016Globes 2016
Globes 2016
Louise Lister
 
Theirs spiritual messaging for all from me due to puja vidhis time at my nati...
Theirs spiritual messaging for all from me due to puja vidhis time at my nati...Theirs spiritual messaging for all from me due to puja vidhis time at my nati...
Theirs spiritual messaging for all from me due to puja vidhis time at my nati...
Deepak Somaji-Sawant
 
TomorrowLand Part 2
TomorrowLand Part 2TomorrowLand Part 2
TomorrowLand Part 2
padistance
 
My cv
My cvMy cv
G3 4 unidad 3. yo y mi escuela
G3 4 unidad 3. yo y mi escuelaG3 4 unidad 3. yo y mi escuela
G3 4 unidad 3. yo y mi escuela
Ana Guillen
 

Viewers also liked (14)

24 feburary
24 feburary24 feburary
24 feburary
 
The Datai F&B Director
The Datai F&B DirectorThe Datai F&B Director
The Datai F&B Director
 
Pristup cjelovitom mjerenju i upravljanju performancama poslovnog sustava
Pristup cjelovitom mjerenju i upravljanju performancama poslovnog sustavaPristup cjelovitom mjerenju i upravljanju performancama poslovnog sustava
Pristup cjelovitom mjerenju i upravljanju performancama poslovnog sustava
 
Quidditch
QuidditchQuidditch
Quidditch
 
La creación de súper materiales
La creación de súper materialesLa creación de súper materiales
La creación de súper materiales
 
La robótica
La robóticaLa robótica
La robótica
 
Research on States to Bahamas cable 2010
Research on States to Bahamas cable 2010Research on States to Bahamas cable 2010
Research on States to Bahamas cable 2010
 
Papás final.
Papás final.Papás final.
Papás final.
 
Bethany Barr Creative Writing Piece
Bethany Barr Creative Writing PieceBethany Barr Creative Writing Piece
Bethany Barr Creative Writing Piece
 
Globes 2016
Globes 2016Globes 2016
Globes 2016
 
Theirs spiritual messaging for all from me due to puja vidhis time at my nati...
Theirs spiritual messaging for all from me due to puja vidhis time at my nati...Theirs spiritual messaging for all from me due to puja vidhis time at my nati...
Theirs spiritual messaging for all from me due to puja vidhis time at my nati...
 
TomorrowLand Part 2
TomorrowLand Part 2TomorrowLand Part 2
TomorrowLand Part 2
 
My cv
My cvMy cv
My cv
 
G3 4 unidad 3. yo y mi escuela
G3 4 unidad 3. yo y mi escuelaG3 4 unidad 3. yo y mi escuela
G3 4 unidad 3. yo y mi escuela
 

Similar to WRI15_BRO_Country-Action-v8

Climate Change Mitigation
Climate Change MitigationClimate Change Mitigation
Climate Change Mitigation
Purva Saxena
 
GHG mitigation scenarios for major emitting countries - COP 23
GHG mitigation scenarios for major emitting countries - COP 23GHG mitigation scenarios for major emitting countries - COP 23
GHG mitigation scenarios for major emitting countries - COP 23
NewClimate Institute
 
Climate finance and strategies by india as per submitted ind cs to unfccc
Climate finance and strategies by india as per submitted ind cs to unfcccClimate finance and strategies by india as per submitted ind cs to unfccc
Climate finance and strategies by india as per submitted ind cs to unfccc
Anirban Chatterjee
 
The European Green Deal - Forum Financier Namur.pdf
The European Green Deal - Forum Financier Namur.pdfThe European Green Deal - Forum Financier Namur.pdf
The European Green Deal - Forum Financier Namur.pdf
Forums financiers de Wallonie
 
Climate change and economic growth.pptx
Climate change and economic growth.pptxClimate change and economic growth.pptx
Climate change and economic growth.pptx
Govt.college,Nagda, ujjain.M.P
 
Energy Efficiency Resolution Lib Int Congress 2009
Energy Efficiency Resolution Lib Int Congress 2009Energy Efficiency Resolution Lib Int Congress 2009
Energy Efficiency Resolution Lib Int Congress 2009
Centerpartiet
 
revised-PPT-Press-Conference-INDC-v5.pdf
revised-PPT-Press-Conference-INDC-v5.pdfrevised-PPT-Press-Conference-INDC-v5.pdf
revised-PPT-Press-Conference-INDC-v5.pdf
ssuser415366
 
Deep decarbonisation of Ireland's energy system
Deep decarbonisation of Ireland's energy systemDeep decarbonisation of Ireland's energy system
Deep decarbonisation of Ireland's energy system
IEA-ETSAP
 
Alex Obregón - The Climate Group
Alex Obregón - The Climate GroupAlex Obregón - The Climate Group
Alex Obregón - The Climate Group
Alexobregon
 
i201510201.ppt
i201510201.ppti201510201.ppt
i201510201.ppt
AnuragBisen7
 
Green Hydrogen - ProColombia
Green Hydrogen - ProColombiaGreen Hydrogen - ProColombia
Green Hydrogen - ProColombiaProColombia
 
Hydrogen perspectives in Colombia
Hydrogen perspectives in ColombiaHydrogen perspectives in Colombia
Hydrogen perspectives in ColombiaProColombia
 
Climate change is happening - UK, climate action
Climate change is happening - UK, climate actionClimate change is happening - UK, climate action
Climate change is happening - UK, climate action
Grupo Areté
 
climate change.pptx
climate change.pptxclimate change.pptx
climate change.pptx
RICKWINDERSINGH1
 
greeneconomy-150306180005-conversion-gate01.pdf
greeneconomy-150306180005-conversion-gate01.pdfgreeneconomy-150306180005-conversion-gate01.pdf
greeneconomy-150306180005-conversion-gate01.pdf
halemayehu
 
Climate-Compatible Development Plan for the Dominican Republic
Climate-Compatible Development Plan for the Dominican RepublicClimate-Compatible Development Plan for the Dominican Republic
Climate-Compatible Development Plan for the Dominican Republic
CIFOR-ICRAF
 
World Energy Outlook 2016 - Executive Summary
World Energy Outlook 2016 - Executive SummaryWorld Energy Outlook 2016 - Executive Summary
World Energy Outlook 2016 - Executive Summary
Marcellus Drilling News
 
Summary of India´s National Action Plan On Climate Change
Summary of India´s National Action Plan On Climate ChangeSummary of India´s National Action Plan On Climate Change
Summary of India´s National Action Plan On Climate Change
DBTGrupoIndia
 

Similar to WRI15_BRO_Country-Action-v8 (20)

Climate Change Mitigation
Climate Change MitigationClimate Change Mitigation
Climate Change Mitigation
 
GHG mitigation scenarios for major emitting countries - COP 23
GHG mitigation scenarios for major emitting countries - COP 23GHG mitigation scenarios for major emitting countries - COP 23
GHG mitigation scenarios for major emitting countries - COP 23
 
Climate finance and strategies by india as per submitted ind cs to unfccc
Climate finance and strategies by india as per submitted ind cs to unfcccClimate finance and strategies by india as per submitted ind cs to unfccc
Climate finance and strategies by india as per submitted ind cs to unfccc
 
The European Green Deal - Forum Financier Namur.pdf
The European Green Deal - Forum Financier Namur.pdfThe European Green Deal - Forum Financier Namur.pdf
The European Green Deal - Forum Financier Namur.pdf
 
Climate change and economic growth.pptx
Climate change and economic growth.pptxClimate change and economic growth.pptx
Climate change and economic growth.pptx
 
Energy Efficiency Resolution Lib Int Congress 2009
Energy Efficiency Resolution Lib Int Congress 2009Energy Efficiency Resolution Lib Int Congress 2009
Energy Efficiency Resolution Lib Int Congress 2009
 
revised-PPT-Press-Conference-INDC-v5.pdf
revised-PPT-Press-Conference-INDC-v5.pdfrevised-PPT-Press-Conference-INDC-v5.pdf
revised-PPT-Press-Conference-INDC-v5.pdf
 
Deep decarbonisation of Ireland's energy system
Deep decarbonisation of Ireland's energy systemDeep decarbonisation of Ireland's energy system
Deep decarbonisation of Ireland's energy system
 
Session2_Japan_NaomiInoue.pdf
Session2_Japan_NaomiInoue.pdfSession2_Japan_NaomiInoue.pdf
Session2_Japan_NaomiInoue.pdf
 
Alex Obregón - The Climate Group
Alex Obregón - The Climate GroupAlex Obregón - The Climate Group
Alex Obregón - The Climate Group
 
i201510201.ppt
i201510201.ppti201510201.ppt
i201510201.ppt
 
Green Hydrogen - ProColombia
Green Hydrogen - ProColombiaGreen Hydrogen - ProColombia
Green Hydrogen - ProColombia
 
Hydrogen perspectives in Colombia
Hydrogen perspectives in ColombiaHydrogen perspectives in Colombia
Hydrogen perspectives in Colombia
 
Climate change is happening - UK, climate action
Climate change is happening - UK, climate actionClimate change is happening - UK, climate action
Climate change is happening - UK, climate action
 
climate change.pptx
climate change.pptxclimate change.pptx
climate change.pptx
 
Green economy
Green economyGreen economy
Green economy
 
greeneconomy-150306180005-conversion-gate01.pdf
greeneconomy-150306180005-conversion-gate01.pdfgreeneconomy-150306180005-conversion-gate01.pdf
greeneconomy-150306180005-conversion-gate01.pdf
 
Climate-Compatible Development Plan for the Dominican Republic
Climate-Compatible Development Plan for the Dominican RepublicClimate-Compatible Development Plan for the Dominican Republic
Climate-Compatible Development Plan for the Dominican Republic
 
World Energy Outlook 2016 - Executive Summary
World Energy Outlook 2016 - Executive SummaryWorld Energy Outlook 2016 - Executive Summary
World Energy Outlook 2016 - Executive Summary
 
Summary of India´s National Action Plan On Climate Change
Summary of India´s National Action Plan On Climate ChangeSummary of India´s National Action Plan On Climate Change
Summary of India´s National Action Plan On Climate Change
 

WRI15_BRO_Country-Action-v8

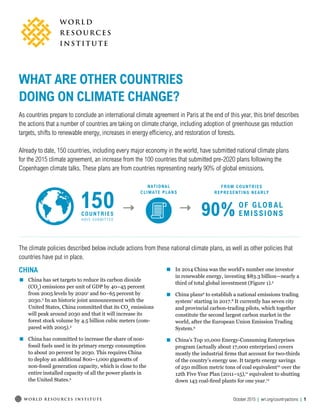
  • 1. October 2015 | wri.org/countryactions | 1 WHAT ARE OTHER COUNTRIES DOING ON CLIMATE CHANGE? As countries prepare to conclude an international climate agreement in Paris at the end of this year, this brief describes the actions that a number of countries are taking on climate change, including adoption of greenhouse gas reduction targets, shifts to renewable energy, increases in energy efficiency, and restoration of forests. Already to date, 150 countries, including every major economy in the world, have submitted national climate plans for the 2015 climate agreement, an increase from the 100 countries that submitted pre-2020 plans following the Copenhagen climate talks. These plans are from countries representing nearly 90% of global emissions. CHINA ▪▪ China has set targets to reduce its carbon dioxide (CO2 ) emissions per unit of GDP by 40–45 percent from 2005 levels by 20201 and 60–65 percent by 2030.2 In an historic joint announcement with the United States, China committed that its CO2 emissions will peak around 2030 and that it will increase its forest stock volume by 4.5 billion cubic meters (com- pared with 2005).3 ▪▪ China has committed to increase the share of non- fossil fuels used in its primary energy consumption to about 20 percent by 2030. This requires China to deploy an additional 800–1,000 gigawatts of non-fossil generation capacity, which is close to the entire installed capacity of all the power plants in the United States.4 The climate policies described below include actions from these national climate plans, as well as other policies that countries have put in place. 150COUNTRIES HAVE SUBMITTED NATIONAL CLIMATE PLANS FROM COUNTRIES REPRESENTING NEARLY 90% OF GLOBAL EMISSIONS ▪▪ In 2014 China was the world’s number one investor in renewable energy, investing $83.3 billion—nearly a third of total global investment (Figure 1).5 ▪▪ China plans6 to establish a national emissions trading system7 starting in 2017.8 It currently has seven city and provincial carbon-trading pilots, which together constitute the second largest carbon market in the world, after the European Union Emission Trading System.9 ▪▪ China’s Top 10,000 Energy-Consuming Enterprises program (actually about 17,000 enterprises) covers mostly the industrial firms that account for two-thirds of the country’s energy use. It targets energy savings of 250 million metric tons of coal equivalent10 over the 12th Five Year Plan (2011–15),11 equivalent to shutting down 143 coal-fired plants for one year.12
  • 2. October 2015 | wri.org/countryactions | 2 MEXICO ▪▪ In 2012 Mexico passed one of the first climate laws in a developing country, the General Law on Climate Change, outlining the country’s transition to a low- carbon economy with a 50 percent reduction in emis- sions from 2000 levels by 2050.13 ▪▪ Mexico committed to reduce its greenhouse gas emis- sions by 22 percent and its black carbon (soot) by 51 percent by 2030 relative to business-as-usual levels.14 ▪▪ Mexico set a target for 40 percent of its energy to come from low-emission energy sources by 2035, and 50 percent by 205015 including renewables as well as nuclear and fossil fuels with carbon capture and stor- age. ▪▪ Mexico set a target to cut deforestation rates to zero by 2030.16 ▪▪ In 2013, Mexico adopted light-duty vehicle CO2 and fuel economy standards that aim to avoid 265 million tons of CO2 emissions by 2032,17 equivalent to annual greenhouse gas emissions from 50 million passenger vehicles.18 Figure 1 | Global Investment in Renewable Energy in 2014 (US$ Billions) 31% 30.8% 21.3% 14.2% 2.7% INDIA $7.4 OTHER $83.7 CHINA $83.3 EUROPE $57.5 U.S. $38.3 Source: See endnote 5 INDONESIA ▪▪ Indonesia committed to cut emissions by 29 percent from business-as-usual levels by 2030.32 ▪▪ Indonesia aims to achieve 87 percent of its 2020 miti- gation target by reducing emissions from deforesta- tion and peat land conversion. ▪▪ In May 2015, the Indonesian government renewed a two-year moratorium on new palm oil plantation con- cessions in primary natural forests and peat lands.33 The first moratorium, set in 2011, aimed to protect an area the size of Japan from development.34 ▪▪ Indonesia has also targeted 12.7 million hectares for social forestry and ecosystem restoration by 2019 as part of its national development plan.35 INDIA ▪▪ India has set targets to substantially increase its renewable energy capacity, including increasing its solar capacity to 100 gigawatts by 2022—a twentyfold increase from current levels of 4 gigawatts (Figure 2)—and increasing its wind power capacity to 60 gigawatts by 2022 from current levels of 23.76 gigawatts.19 ▪▪ India has committed to increase its non-fossil fuel en- ergy sources to 40% of total energy sources by 203020 . ▪▪ India has committed to reduce CO2 emissions per unit of GDP 33–35 percent below 2005 levels by 2030.20 ▪▪ India is the first developing country to adopt a mar- ket based mechanism, “Perform, Achieve and Trade” (PAT), to improve energy intensity in industries and aims for an emissions reduction of 26 million met- ric tons of carbon dioxide equivalent by 2015, thus contributing to the national target,21 and avoiding CO2 emissions from the equivalent of six power plants an- nually.22 ▪▪ India’s Ministry of Power set average fuel consump- tion standards for passenger cars in January 2014 to take effect in April 2017 and result in a cumulative re- duction of 22.97 million metric tons of fuel consump- tion, avoiding more than 66 million metric tons of CO2 emissions by 2025.23 This is equivalent to avoiding the CO2 emissions of 13 million cars annually.24
  • 3. October 2015 | wri.org/countryactions | 3 BRAZIL ▪▪ Brazil committed to reduce greenhouse gas emissions 37 percent in absolute terms below 2005 levels by 2025.25 ▪▪ Brazil has set a target to increase its share of renew- ables other than hydropower to 28–33 percent of its total energy mix by 2030.25 Currently hydropower gen- erates about 66 percent of Brazil’s electricity; and other renewable energy sources, less than 10 percent.26 ▪▪ Over the past decade, the rate of deforestation27 in the Brazilian Amazon has dropped 70 percent compared with the previous decade, keeping 3.2 billion metric tons of CO2 emissions out of the atmosphere (Figure 3).28 This is equivalent to taking all U.S cars off the road for three years.29 ▪▪ In a recent U.S.–Brazil Joint Statement,30 Brazil indicated that it will restore and reforest 12 million hectares by 2030, which is equivalent in size to the state of Pennsylvania.31 ▪▪ The national energy policy, revised in 2014, aims to increase renewable energy to 23 percent of primary energy supply and to reduce the share of oil in the energy mix to less than 25 percent by 2025.36 EUROPEAN UNION ▪▪ The European Union has decoupled greenhouse gas emissions from economic growth: its 1990–12 GDP growth was more than 44 percent while emissions decreased by 19 percent (Figure 4).37 ▪▪ The European Union has adopted policies to reduce emissions by at least 40 percent below 1990 levels by 2030 and established a target to reduce emissions by 80–95 percent by 2050.38 Figure 2 | India Plans to Increase its Solar Power Figure 3 | Over the Past Decade the Brazilian Amazon’s Rate of Deforestation Dropped 70 Percent Compared with the Previous Decade 0 5 10 15 20 25 30 3.25 GtCO2 96 97 98 99 00 01 02 03 04 05 06 07 08 09 10 11 12 13 Annual Deforestation Deforestation Reduction Baseline AnnualDeforestation(Sq.km) Year Solar Panels Installed: 4 GW Previous 2022 Solar Goal: 20 GW New 2022 Solar Goal: 100 GW
  • 4. October 2015 | wri.org/countryactions | 4 Source: Nepstad et al. 2014, Science 344. ▪▪ European Union policies aim to increase the share of renewable energy in its energy consumption mix to at least 27 percent and increase energy efficiency by 30 percent by 2030. ▪▪ The European Union Emissions Trading Scheme, launched in 2005, is operational in all 28 EU mem- ber states plus Iceland, Norway, and Liechtenstein. It was the first large greenhouse gas emissions trading scheme in the world and remains the largest, covering 45 percent of EU greenhouse gas emissions.39 ETHIOPIA ▪▪ Ethiopia aims to achieve middle-income status by 2025 in a carbon neutral way through its climate resil- ient green economy strategy.40 ▪▪ In line with the strategy, Ethiopia committed to re- duce emissions by 64 percent from business-as-usual by 2030 (Figure 5).41 ▪▪ Ethiopia made a significant pledge to restore 15 mil- lion hectares of degraded and deforested land—one- sixth of its land area—to productivity by 2025.42 CHILE ▪▪ Chile committed to reduce CO2 emissions per unit of GDP 30 percent below 2007 levels by 2030.43 ▪▪ Chile is the first country in Latin America to set a binding renewable energy generation target that re- quires that by 2025 at least 20 percent of the country’s energy will come from renewable sources excluding large hydroelectric plants (solar, wind, geothermal, tidal, biomass, and small-hydro).44 ▪▪ Chile also set an ambitious target to generate 70 per- cent of its electricity from renewable sources, mainly solar and wind, by 2050, a sevenfold increase from current levels.45 ▪▪ To reduce emissions from power generation, Chile approved a carbon tax on thermal power generators of 50 megawatts or more as part of a broader fiscal re- form. Starting in 2017, emitters will have to pay US$5 per metric ton of CO2 emissions.46 Figure 4 | The European Union Decoupled Economic Growth from Emissions Figure 5 | Ethiopia Plans to Reduce Emissions by 64 Percent by 2030 0 6 12 18 0 2000 4000 6000 1990 1992 1994 1996 1998 2000 2002 2004 2006 2008 2010 2012 TotalGHGEmission(MtCO2 e) Year GDP-USD[TrillionUS$(2005)] Total GHG Emissions Including Land-Use Change and Forestry GDP-USD [Trillion US$ (2005)] 2010 2030: Business as Usual 2030: Green Economy 64% 0 100 200 300 400 EmissionsPerYear(MtCO2 e) 150 145 400
  • 5. October 2015 | wri.org/countryactions | 5 ENDNOTES 1. China FAQs, “China’s State Council Unveils 40–45% Carbon Intensity Target,” Blog, March3, 2015, http://www.chinafaqs.org/blog-posts/ chinas-state-council-unveils-40-45-carbon-intensity-target. 2. “Enhanced Actions on Climate Change: China’s Intended Nationally Determined Contributions,” submitted to UNFCCC June 30, 2015, http://www4.unfccc.int/submissions/INDC/Published%20Documents/ China/1/China’s%20INDC%20-%20on%2030%20June%202015.pdf. 3. The White House, “U.S.–China Joint Announcement on Climate Change and Clean Energy Cooperation,” Fact Sheet/Press Release, November 11, 2014, https://www.whitehouse.gov/the-press-office/2014/11/11/ fact-sheet-us-china-joint-announcement-climate-change-and-clean- energy-c. 4. ChinaFAQs, “U.S.-China Accord Includes Important Steps on Non-Fos- sil Energy,” Blog, March 3, 2015 http://www.chinafaqs.org/blog-posts/ us-china-accord-includes-important-steps-non-fossil-energy#sthash. ImwtH7GZ.dpuf. 5. China installed 13 gigawatts of solar photovoltaic projects in 2014, roughly 70 percent more than any other country had ever installed in a single year, see http://www.chinafaqs.org/files/chinainfo/Chi- naFAQs_Renewable_Energy_Graphical_Overview_of_2014.pdf; China also installed a record 20.7 gigawatts of wind power capacity in 2014. Bloomberg Business, January 22, 2015 “ U.S. Wind-Power Installations Rose Sixfold in 2014: BNEF,” http://www.bloomberg. com/news/articles/2015-01-22/u-s-wind-power-installations-rose- sixfold-in-2014-bnef. 6. U.S.-China Joint Presidential Statement on Climate Change, September 25, 2015. In the joint statement, China made other announcements, including climate assistance to developing countries, and limits on financing for projects with carbon emissions. https://www.whitehouse. gov/the-press-office/2015/09/25/us-china-joint-presidential-statement- climate-change. 7. China’s national emissions trading system will initially cover key industrial sectors such as iron and steel, power generation, chemicals, building materials, paper-making, and non-ferrous metals, see https:// www.whitehouse.gov/the-press-office/2015/09/25/us-china-joint- presidential-statement-climate-change. 8. Some provinces will be allowed to delay participation in the emissions trading system if they do not have the technical infrastructure to partici- pate from the beginning, see http://uk.reuters.com/article/2014/08/31/ china-carbontrading-idUKL3N0R107420140831. 9. ChinaFAQs, “Emissions Trading in China: First Reports from the Field,” January 23, 2014, http://www.chinafaqs.org/blog-posts/emissions- trading-china-first-reports-field. 10. This is equivalent to about 600 million tons of CO2 . ChinaFAQs, “China’s Ten Key Energy Efficiency Projects,” Blog, November 11, 2009, http://www.chinafaqs.org/library/chinafaqs-chinas-ten-key-energy- efficiency-projects#sthash.iAEjcrD4.dpuf. 11. Institute for Industrial Productivity, “Top-10,000 Energy-Consuming Enterprises Program,” http://iepd.iipnetwork.org/policy/top-10000-en- ergy-consuming-enterprises-program. 12. U.S. Environmental Protection Agency, Greenhouse Gas Equivalencies Calculator, http://www.epa.gov/cleanenergy/energy-resources/calcula- tor.html#results. 13. Camara de Diputados del H. Congresso de la Union, June 2012. Ley General de Cambio Climatico, Estados Unidos Mexicanos, http://www. diputados.gob.mx/LeyesBiblio/pdf/LGCC_130515.pdf. 14. This commitment implies a net emissions peak starting in 2026, de- coupling greenhouse gas emissions from economic growth: emissions intensity per unit of GDP will reduce by around 40 percent from 2013 to 2030. “Mexico Intended National Determined Contribution,” submit- ted to UNFCCC March 30, 2015, http://www4.unfccc.int/submissions/ INDC/Published%20Documents/Mexico/1/MEXICO%20INDC%20 03.30.2015.pdf. 15. International Renewable Energy Agency (IRENA), 2015, “Renewable Energy Prospects: Mexico, REmap 2030 Analysis,” IRENA, Abu Dhabi, http://www.irena.org/DocumentDownloads/Publications/IRENA_RE- map_Mexico_report_2015.pdf. 16. Government of Mexico, “Mexico Intended National Determined Contri- bution,” submitted to UNFCCC March 30, 2015, http://www4.unfccc.int/ submissions/INDC/Published%20Documents/Mexico/1/MEXICO%20 INDC%2003.30.2015.pdf. 17. International Council for Clean Transportation, “Mexico Light-duty Vehicle CO2 and Fuel Economy Standards,” Policy Update, July 2013, http://www.theicct.org/sites/default/files/publications/ICCTupdate_ Mexico_LDVstandards_july2013.pdf. 18. U.S. Environmental Protection Agency, Greenhouse Gas Equivalencies Calculator, http://www.epa.gov/cleanenergy/energy-resources/calcula- tor.html#results. 19. World Resources Institute, “As Obama and Modi Meet, 4 Opportunities for US-India Action on Clean Energy and Climate,” Blog, January 21, 2015, http://www.wri.org/blog/2015/01/obama-and-modi-meet-4-op- portunities-us-india-action-clean-energy-and-climate. 20. Government of India, “India’s Intended Nationally Determined Contribu- tion: Working towards Climate Justice,” submitted to UNFCCC on Octo- ber 1, 2015, http://www4.unfccc.int/submissions/INDC/Published%20 Documents/India/1/INDIA%20INDC%20TO%20UNFCCC.pdf. 21. Climate and Development Knowledge Network, “Inside Stories: Creating Market Support for Energy,” January 2013, http://r4d.dfid.gov.uk/PDF/ Outputs/CDKN/India-PAT_InsideStory.pdf. 22. U.S. Environmental Protection Agency, Greenhouse Gas Equivalencies Calculator http://www2.epa.gov/energy/greenhouse-gas-equivalencies- calculator. 23. Shakti Sustainable Energy Foundation, “India Climate Report,” July 2015, http://shaktifoundation.in/wp-content/uploads/2015/07/India- Climate-Report-Vol.-1.pdf. 24. U.S. Environmental Protection Agency, Greenhouse Gas Equivalencies Calculator http://www2.epa.gov/energy/greenhouse-gas-equivalencies- calculator.
  • 6. October 2015 | wri.org/countryactions | 6 25. Government of Brazil, “Intended Nationally Determined Contribution towards Achieving the Objective of the United Nations Framework Convention on Climate Change,” submitted to UNFCCC on September 28, 2015, http://www4.unfccc.int/submissions/INDC/Published%20 Documents/Brazil/1/BRAZIL%20iNDC%20english%20FINAL.pdf. 26. World Resources Institute, “A Closer Look at Brazil’s New Climate Plan (INDC)”, Blog, September 30, 2015 http://www.wri.org/blog/2015/09/ closer-look-brazils-new-climate-plan-indc. 27. Brazil’s forest laws aim to reduce annual deforestation by 80 percent in the Amazon by 2020, compared with the 1996–2005 historical average, and to reduce annual deforestation in the savannahs by 40 percent by 2020, compared with the 1999–2000 historical average. 28. Through a tremendous decline in the rate of Amazon deforestation from 2006–13, Brazil has avoided 3.2 gigatons of CO2 emissions to the atmosphere, compared with the historic baseline (annual average 1996–2005). Nepstad et al. , 2014, Science 344, http://earthinnovation. org/our-work/global/redd-policy-initiative/. 29. National Geographic, “Brazil Leads World in Reducing Carbon Emis- sions by Slashing Deforestation,” June 5, 2014, http://news.national- geographic.com/news/2014/06/140605-brazil-deforestation-carbon- emissions-environment/. 30. The White House, “U.S.-Brazil Joint Statement on Climate Change,” Press Release, June 30, 2015, https://www.whitehouse.gov/the-press- office/2015/06/30/us-brazil-joint-statement-climate-change. 31. The state of Pennsylvania has a total area of 46,054.35 square miles (11928021.89 hectares). 32. Government of Indonesia, “Intended Nationally Determined Contribu- tion of Indonesia,” submitted to UNFCCC on September 24, 2015, http://www4.unfccc.int/submissions/INDC/Published%20Documents/ Indonesia/1/INDC_REPUBLIC%20OF%20INDONESIA.pdf. 33. Kemen Austin , Ariana Alisjahbana, Taryono Darusman, Rachmat Boediono, Bambang Eko Budianto, Christian Purba, Giorgio Budi Indrarto, Erica Pohnan, Andika Putraditama, and Fred Stolle, 2014, “In- donesia’s Forest Moratorium: Impacts and Next Steps,” Working Paper, World Resources Institute, Washington DC, http://www.wri.org/sites/ default/files/indonesia-forest-moratorium-next-steps.pdf . 34. World Resources Institute, “2 Things You Need to Know about Indone- sia’s Forest Moratorium,” Blog, January 30, 2014, http://wri-indonesia. org/blog/2-things-you-need-know-about-indonesias-forest-morato- rium#sthash.OBErRjua.dpuf. 35. Republic of Indonesia, Rencana Pembangunan Jangka Menengah Na- sional RPJMN 2015-2019, http://www.bpkp.go.id/public/upload/unit/ sesma/files/Buku%20II%20RPJMN%202015-2019.pdf . 36. International Energy Agency (IEA), 2014, World Energy Outlook special report for Southeast Asia, IEA, Paris. 37. EU Submission Technical Annex “Kyoto Ambition Mechanism Report,” April 2014, Technical Paper, http://ec.europa.eu/clima/policies/inter- national/negotiations/docs/eu_submission_20140430_technical_an- nex_en.pdf. 38. Adopted by EU leaders in October 2014, the plan builds on the 2020 climate and energy package. “2030 Climate Energy Framework,” http://ec.europa.eu/clima/policies/strategies/2030/index_en.htm. 39. A ‘Cap and Trade’ System, http://ec.europa.eu/clima/policies/ets/ index_en.htm. 40. Federal Democratic Republic of Ethiopia, 2011, “Ethiopia’s Climate- Resilient Green Economy Green Economy Strategy,” http://www.undp. org/content/dam/ethiopia/docs/Ethiopia%20CRGE.pdf. 41. Federal Democratic Republic of Ethiopia, “Intended Nationally Determined Contribution (INDC) of the Federal Democratic Republic of Ethiopia,” submitted to UNFCCC on June 10, 2015, http://www4. unfccc.int/submissions/INDC/Published%20Documents/Ethiopia/1/ INDC-Ethiopia-100615.pdf. 42. World Resources Institute, “Ethiopia Commits to Restore One-Sixth of its Land,” October 2014, Blog, http://www.wri.org/blog/2014/10/ ethiopia-commits-restore-one-sixth-its-land . 43. Government of Chile, “Intended Nationally Determined Contributions of Chile,” submitted to UNFCCC on September 29, 2015, http://www4. unfccc.int/submissions/INDC/Published%20Documents/Chile/1/ INDC%20FINAL%20SEPT%202015.pdf . 44. International Renewable Energy Agency (IRENA), 2015, “Renewable Energy in Latin America 2015: An Overview of Policies,” IRENA Policy Brief, http://www.irena.org/DocumentDownloads/Publications/IRENA_ RE_Latin_America_Policies_2015.pdf . 45. Chilean Association for Renewable Energies, ACERA AG, “Las energias renovables son un eje esencial para las politicas publicas de energia al 2050”, http://www.acera.cl/las-energias-renovables-son-un-eje- esencial-para-las-politicas-publicas-de-energia-al-2050/. 46. IRENA, 2015. Contact CHRISTINA DECONCINI Director, Government Affairs cdeconcini@wri.org | +1 (202) 729-7738