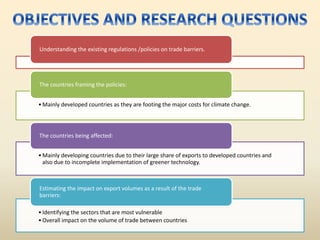
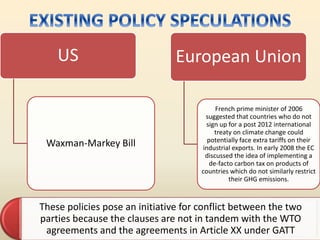
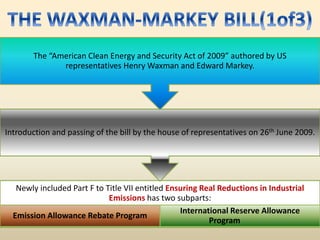
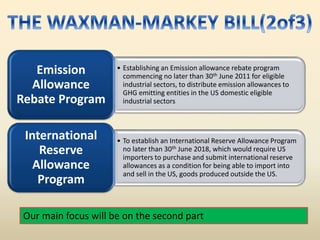
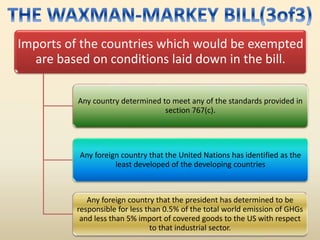
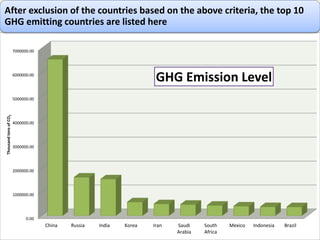
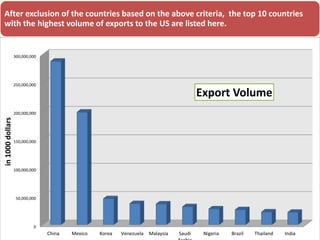
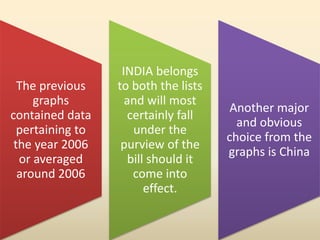
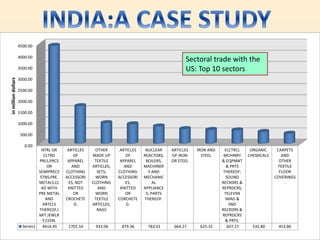
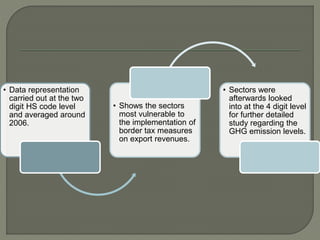
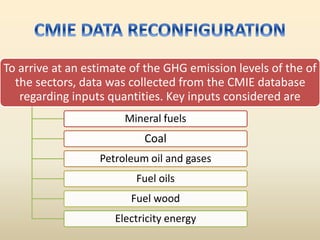
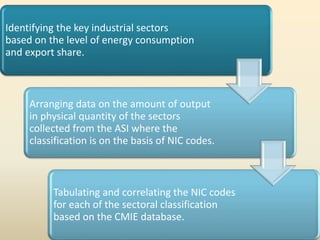
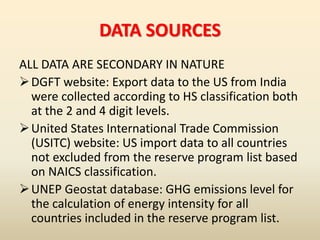
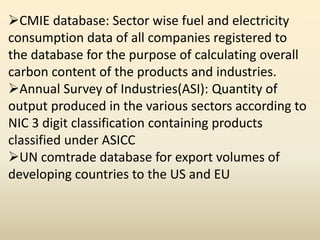
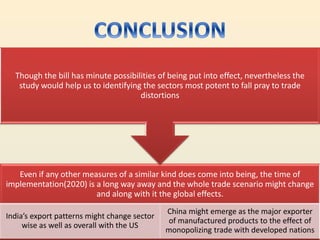
This document discusses potential trade barriers related to climate change. It analyzes the Waxman-Markey Bill, which proposes border tax measures for imports into the US from countries that do not regulate greenhouse gas emissions. The document examines India's trade with the US and identifies sectors that would be most affected by such border taxes, such as precious metals, apparel, machinery, and organic chemicals. It outlines methods used to estimate sectors' greenhouse gas emission levels and potential impacts on India's export revenues. While the bill may not pass, the analysis identifies industries vulnerable to future climate-related trade barriers.
Farm support in Russia and Ukraine under the rules of the WTOLars Brink
Ukraine’s and Russia’s WTO commitments on domestic support, notified AMS support, accommodation of planned support within limits, issues in adjusting reference prices. Presented at IATRC meeting, December 2013.
Across the Pond: Canada-EU Comprehensive Economic and Trade Agreement (CETA)Brenda Swick
Presentation from the Dickinson Wright Webinar "Across the Pond: Canada-EU Comprehensive Economic and Trade Agreement (CETA)" presented by Brenda Swick on May 16, 2017.
Malaysia is known for its economic records in Asia. Its export value as of 2018 in the electrical and electronic equipment industry stands at $82 billion, with its valuable locations for export being Japan, China, US, Singapore and Hong Kong. The country is also rich in its export business of oil and mineral fuel, mainly crude petroleum oil and petroleum gases that have an export value of $38 billion.
This report also shows that the country is backed up in terms of chemical products and optical & medical equipment. Malaysia exports its products to various countries including India, Australia, Korea, Pakistan, Netherlands and Germany, and has more than a hundred suppliers in every industry – big or small. Take a look at the entire report and talk to Malaysia sourcing service providers to gain in-depth graphical representations and stats.
This presentation is based on my discussion in the session exploring impacts of COVID-19 on employment in Asia and the Pacific and it is focused on the GVC-trade as the channel of transmission to the labour markets.
The textile and clothing (T&C) exports from Vietnam are rapidly touching heights. Over the years, it has shown promising growth in the T&C exports and the last year only it surpassed Bangladesh to become the 2nd largest garment exporter in the world after China. Team Apparel Resources has made the presentation for its readers to let them know about the T&C industry of this South East Asian country.
This was a college presentation that was done for the subject of Export Import and International Business. It highlights the trade disputes that took place between the EU and USA in a simple manner.
On June 23rd 2016 the UK voted in a referendum to leave the European Union.
Prime Minister David Cameron resigned the morning after the vote
A few weeks later, Theresa May was elected leader of the Conservative Party and new Prime Minister.
The terms of the UK’s new economic relationship with the EU remain uncertain.
Hard Brexit
Means that the United Kingdom leaves the EU Single Market and trades under World Trade Organization rules
Under WTO rules, each member must grant the same market access—including charging the same tariffs—to all other members as the most favoured nation
Soft Brexit
Involves the option of staying in the Single Market (like Norway)
As a member of the European Economic Area (EEA), Norway has a free trade agreement with the European Union, which means that there are no tariffs on trade between the two
How big is the Vietnamese Garment Industry?ThreadSol
With the speeding and sustainable development, Vietnamese textile and garment industry has witnessed great heights in terms of trade! Read this post by industry expert Mausmi Ambastha to know more.
EU: Hats And Other Headgear - Market Report. Analysis And Forecast To 2020IndexBox Marketing
IndexBox Marketing has just published its report: “EU: Hats And Other Headgear - Market Report. Analysis And Forecast To 2020”. This report focuses on the EU hat market, providing a comprehensive analysis and the most recent data on its market size and volume, EU trade, price dynamics, domestic production, and turnover in the industry. The market trends section reveals the main issues and uncertainties concerning the industry, while the medium-term outlook uncovers market prospects. The attractivity index (IB Index) summarizes the source of existing opportunities as they appear in this market, as well as an interpretation of the trade figures.
Seminar: Effects of the EU bilateral trade agreements on agriculture and food sectors 16 December 2016, Helsinki
The impacts of the TTIP agreement on the EU and Finnish agricultural sector
Mrs Ellen Huan-Niemi, Senior Research Scientist, Natural Resources Institute Finland
Ellen Huan-Niemi (Luke), Jyrki Niemi (Luke), Janne Niemi (VATT): The impacts of the TTIP agreement on the EU and Finnish agricultural sector. Seminar 16.12.2016: Effects of the EU bilateral trade agreements on agriculture and food sectors
A tariff is a charge a nation imposes on imports of goods and services from another nation. Certain tariffs, which are set by the government and collected by the customs authorities, stipulate a fixed fee on a specific kind of commodity.
In the present era, tariffs have less of an impact on global trade. The emergence of international organisations aimed at enhancing free trade, such as the World Trade Organization, is one of the main causes of the drop (WTO). Such groups can lessen the risk of retaliatory levies and make it more difficult for a nation to impose tariffs and taxes on imported goods. As a result, nations have switched to non-tariff barriers including quotas and export restrictions.
There are always issues that are taken into consideration when creating foreign policy. History and public opinion had a role in the trade conflict that erupted between South Korea and Japan. The decision-makers take this into account when determining their foreign policy toward Japan. The historical element that the South Korean side of the two countries still views the World War II era as unsolved is a frequent source of friction in the bilateral relations. The topic of compensation demands for South Korean forced labourers today still has a connection to the past.
The problem of recompense for the World War II era and official acknowledgement or an apology from Japan, according to Holsti, is one of the internal elements that makes South Korea most commonly used against Japan. Every year, the public's perception of Japan's previous atrocities against South Korea likewise tends to worsen. However, internal forces still outweigh external ones, which tend to deteriorate relations between the two nations.
Manufacturing, Import & Export - comparing USA and India pptHarbans Buttar, MBA
In this paper & presentation, i have cover Manufacturing and its content, Import, and export in the USA and then comparing the USA vs India on Manufacturing, imports, & exports etc.
Manufacturing, Import & Export - Comparision between USA & India pptHarbans Buttar, MBA
In this paper & presentation, I have cover Manufacturing and its content, Import, and export in the USA and then comparing the USA vs India on Manufacturing, imports, & exports etc.
Shifting Trade Rules and the Future for North America’s Auto IndustryBoston Consulting Group
Two major initiatives by the US to overhaul trade rules could have a massive impact on North America’s automotive manufacturing industry. Here’s how companies should prepare.
Non agriculture market_access_issues_and_concerns_for_indiaYogesh Bandhu
A key element of the Doha Round of trade negotiations is the liberalisation of trade in industrial products, commonly known as non-agricultural market access (NAMA). Negotiations under NAMA focus on market access for all products that are not covered under the negotiations on agriculture or services and aim to reduce, if not possible to completely eliminate, tariff and non-tariff barriers (NTBs) that restrict trade in these products. The framework adopted for modalities for negotiations under NAMA, known as the ‘July Package’, envisages reduction of industrial tariffs in both developed and developing countries, according to a formula that is yet to be agreed. These negotiations are important for developing countries, as these will determine the market access opportunities available to developing countries through which they can improve their growth prospects.
As per the WTO text on NAMA of December 6, 2008, the developing countries have been asked to undertake tariff reductions of 60 - 70 per cent while the developed countries are offering a reduction of only 20 - 30 per cent based on Swiss formula for tariff reduction which gives a coefficient of 8 for developed countries and 22 on an average for developing countries. The insistence on developing countries to cut their bound tariffs in NAMA or agriculture until they go below the applied levels along with the continuation of US practice of having a bound level that is twice its actual spending on agricultural domestic subsidies has been objected by India and China.
India desires that the modalities for tariff cuts should reflect the mandate of less than full reciprocity in reduction commitments and comparability in ambition between NAMA and Agriculture.
So far as the tariff reduction is concerned, it may be mentioned that the Swiss formula should not be used for making commitments on tariff reduction as it involves the use of an arbitrary coefficient, a, which can be manipulated by member countries. Even, the simple average formula has its own limitations. For instance, it overlooks the values that are either very high or very low and thus cannot solve the problem of tariff peaks.
The simplest way is to reduce the bound levels of developed countries to 5 or 10 per cent for all tariff lines as their industries have already developed. Otherwise, the developed countries can be asked to bring their bound tariff rates to 5 to 8 per cent for those tariff lines that cover at least 98 per cent of the potential exports, and not the actual exports as that may be lower because of existing high import tariff or domestic support in importing country, of developing countries to developed countries. This potential of exports for developing countries can be calculated through revealed comparative advantage or by matching the developing countries exports and developed countries imports at different commodity classification levels.
The trade landscape, as we know it, is changing: Is India prepared?aakash malhotra
In report of August 2022, Deloitte India discusses the crucial changes occurring in the Indian economy and how exports contribute to India's GDP and vision of becoming a US$5 trillion economy.
Year-End Update on the Chinese Tariffs: Section 232 & 301Trade Risk Guaranty
Trade Risk Guaranty joined by Gregg Cummings from their sister company, Strix, for a year-end update on the tariffs imposed on goods imported from China and steel & aluminum imports. This presentation introduces Section 201 and the Miscellaneous Tariff Bill.
The presentation is a packed hour discussing the following topics:
- Introducing Section 201 & The Miscellaneous Tariff Bill
- Recap on Import Tariffs; Section 232 & Section 301
- Announcements from the G20 Leader Summit
- Reactions to the G20 Leader Summit
- What Can You Do? And Tools To Help
DOWNLOAD THE HTSUS LOOKUP : https://traderiskguaranty.com/section-301-tariff-htsus-lookup/
Watch the webinar here: https://youtu.be/F31244rULqU
techUK: UK CRM Strategy Overview & Next Stepsraj takhar
Review of the UK approach to Critical Raw Minerals, covering both the original UK CRM strategy (2022) and its official status updated, the UK CRM Refresh (2023)
Presented as part of a techUK webinar, entitled 'UK approach to Critical Minerals' conducted on Thursday March 23rd 2023
Productivity and Competitiveness of RMG Industry and policy for ImprovementAshikul Kabir Pias
BANGLADESH IS A DEVELOPING COUNTRY.RMG PLAY A VITAL ROLE IN OUR ECONOMY. THE APPAREL INDUSTRY IS ONE OF THE PILLAR INDUSTRIES OF BANGLADESH. BANGLADESH IS THE 3RD LARGEST APPAREL EXPORTING COUNTRY IN THE WORLD. THE READYMADE GARMENTS (RMG) INDUSTRY IS THE LARGEST SINGLE ECONOMIC SECTOR IN BANGLADESH WHICH CONTRIBUTES TO 76% OF NATIONAL EXPORTS AND 90% OF MANUFACTURING GOODS EXPORTS .
Our NEW report out now: ‘The Paris Effect’ demonstrates that countries, companies and investors now have a once-in-a-generation opportunity to scale zero-carbon industries in the 2020s, creating prosperous growth, millions of jobs and more resilient economies.
Country overview & investment opportunities - Argentina
CLIMATE CHANGE AND TRADE
1. CLIMATE CHANGE AND
CARBON BARRIERS TO
TRADE
PRESENTED AT
THE ENERGY AND RESOURCES INSTITUTE
By Raktim Ray (Intern)
Resources and Global Security Division
2. Linking climate change to trade.
The North-South divide
Trade instruments used for the purpose of
distorting free trade.
•tariffs
• Border Tax measures
•non-tariff barriers
•Quotas
•Product standardization
3. R&D investments to reduce GHG emissions involves
• Higher compliance Costs
• Higher product prices
Stiff competition from products of developing nations who
are not cutting back on emissions as a result of trade
Given the present scenario it is not possible for only the
developed nation to take the burden alone
4. Implementation of greener technology is
difficult due to high costs and strict IPR whereas
other issues domestically needs to be taken care
of for the sake of growth.
Burden should be borne by the developed
nations because their contribution to
environmental degradation is much more than
developing nations.
5. The Cancun Climate Conference held between 29th
November-11th December 2010 had some useful
highlights:*
Establishment of Green Climate Fund(GCF) to support projects, programmes
and other activities in developing countries, using thematic funding windows.
Commitment by developed countries transfer $100 billion a year by 2020 to
developing countries for adaptation and mitigation.
Invitation to developed country parties to submit information on resources for
fast-start financing and long-term finance.
Scaled-up, new and additional, predictable and adequate funding for
developing countries for GHG reduction.
*Data source: International Institute for Sustainable development (IISD)
7. In all the cases the US is the leading market for
Exports followed by the EU with the US being the only
country to have import shares in double figures.
18%
8%
74%
BRAZIL:EXPORT VOLUME BREAKUP
USA UK, France and Germany Others
11%
19%
70%
S.AFRICA:EXPORT VOLUME BREAKUP
USA UK, France and Germany Others
8. Understanding the existing regulations /policies on trade barriers.
•Mainly developed countries as they are footing the major costs for climate change.
The countries framing the policies:
•Mainly developing countries due to their large share of exports to developed countries and
also due to incomplete implementation of greener technology.
The countries being affected:
•Identifying the sectors that are most vulnerable
•Overall impact on the volume of trade between countries
Estimating the impact on export volumes as a result of the trade
barriers:
9. US
Waxman-Markey Bill
European Union
French prime minister of 2006
suggested that countries who do not
sign up for a post 2012 international
treaty on climate change could
potentially face extra tariffs on their
industrial exports. In early 2008 the EC
discussed the idea of implementing a
de-facto carbon tax on products of
countries which do not similarly restrict
their GHG emissions.
These policies pose an initiative for conflict between the two
parties because the clauses are not in tandem with the WTO
agreements and the agreements in Article XX under GATT
10. Newly included Part F to Title VII entitled Ensuring Real Reductions in Industrial
Emissions has two subparts:
Emission Allowance Rebate Program
International Reserve Allowance
Program
Introduction and passing of the bill by the house of representatives on 26th June 2009.
The “American Clean Energy and Security Act of 2009” authored by US
representatives Henry Waxman and Edward Markey.
11. • Establishing an Emission allowance rebate program
commencing no later than 30th June 2011 for eligible
industrial sectors, to distribute emission allowances to
GHG emitting entities in the US domestic eligible
industrial sectors
Emission
Allowance
Rebate Program
• To establish an International Reserve Allowance Program
no later than 30th June 2018, which would require US
importers to purchase and submit international reserve
allowances as a condition for being able to import into
and sell in the US, goods produced outside the US.
International
Reserve
Allowance
Program
Our main focus will be on the second part
12. Imports of the countries which would be exempted
are based on conditions laid down in the bill.
Any country determined to meet any of the standards provided in
section 767(c).
Any foreign country that the United Nations has identified as the
least developed of the developing countries
Any foreign country that the president has determined to be
responsible for less than 0.5% of the total world emission of GHGs
and less than 5% import of covered goods to the US with respect
to that industrial sector.
15. The previous
graphs
contained data
pertaining to
the year 2006
or averaged
around 2006
INDIA belongs
to both the lists
and will most
certainly fall
under the
purview of the
bill should it
come into
effect.
Another major
and obvious
choice from the
graphs is China
17. • Data representation
carried out at the two
digit HS code level
and averaged around
2006.
• Shows the sectors
most vulnerable to
the implementation of
border tax measures
on export revenues.
• Sectors were
afterwards looked
into at the 4 digit level
for further detailed
study regarding the
GHG emission levels.
18. To arrive at an estimate of the GHG emission levels of the of
the sectors, data was collected from the CMIE database
regarding inputs quantities. Key inputs considered are
Mineral fuels
Coal
Petroleum oil and gases
Fuel oils
Fuel wood
Electricity energy
19. Identifying the key industrial sectors
based on the level of energy consumption
and export share.
Arranging data on the amount of output
in physical quantity of the sectors
collected from the ASI where the
classification is on the basis of NIC codes.
Tabulating and correlating the NIC codes
for each of the sectoral classification
based on the CMIE database.
20. DATA SOURCES
ALL DATA ARE SECONDARY IN NATURE
DGFT website: Export data to the US from India
were collected according to HS classification both
at the 2 and 4 digit levels.
United States International Trade Commission
(USITC) website: US import data to all countries
not excluded from the reserve program list based
on NAICS classification.
UNEP Geostat database: GHG emissions level for
the calculation of energy intensity for all
countries included in the reserve program list.
21. CMIE database: Sector wise fuel and electricity
consumption data of all companies registered to
the database for the purpose of calculating overall
carbon content of the products and industries.
Annual Survey of Industries(ASI): Quantity of
output produced in the various sectors according to
NIC 3 digit classification containing products
classified under ASICC
UN comtrade database for export volumes of
developing countries to the US and EU
22. Even if any other measures of a similar kind does come into being, the time of
implementation(2020) is a long way away and the whole trade scenario might change
and along with it the global effects.
India’s export patterns might change sector
wise as well as overall with the US
China might emerge as the major exporter
of manufactured products to the effect of
monopolizing trade with developed nations
Though the bill has minute possibilities of being put into effect, nevertheless the
study would help us to identifying the sectors most potent to fall pray to trade
distortions