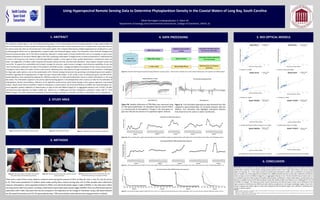
The southeast coastal region is one of the fastest growing regions in the United States and the increasing utilization of open water bodies has
led to the deterioration of water quality and aquatic ecology, placing the future of these resources at risk. In coastal zones, a key index that can
be used to assess the stress on the environment is the water quality. This is heavily influenced by multiple biogeochemical constituents or color
producing agents (CPAs) such as, phytoplankton, suspend matter, and dissolved organic carbon. The interaction of the chemical, biological and
physical components gives rise to the optical complexity, observed in coastal waters of South Carolina (SC) such as in Long Bay, an open ocean,
shallow embayment on the South Atlantic Bight of the USA, producing turbid waters. Ecological stress on these environments is reflected by the
increase in the frequency and severity of Harmful Algal Blooms (HABs), a prime agent of water quality deterioration, including foul odors and
tastes, de-oxygenation of bottom waters (hypoxia and anoxia), toxicity, fish kills, and food web alterations. These aspects threaten human and
marine life. To support the sustainability and to better manage the resources, water resource managers need enhanced capabilities of near real
-time monitoring to understand the state of the conditions and better protect, manage and address the question of how various natural and an-
thropogenic factors affect the health of these environments. Obtaining these observations through conventional in-situ methods is challenging
for large open water systems, such as the coastal waters of SC. Remote sensing has become very promising in providing temporal and spatial in-
formation regarding the bio-geodynamics in large and open coastal water bodies. In this study, a suite of exiting blue-green and NIR-red bio-
optical algorithms were evaluated by applying the reflectance data from an ASD spectroradiometer sensor to predict chlorophyll a in the Long
Bay waters. The chlorophyll a pigment is the primary light harvesting pigment in all phytoplankton and is used as an index for the estimation of
phytoplankton density concentrations. Efficiency of the algorithms performances were tested through a least squares regression and residual
analysis. Results show that for prediction models of chlorophyll a concentrations, the Oc4v4 by O’Reilly et al (2000), two -band blue-green em-
pirical algorithm yielded coefficients of determination as high as 0.64 with RMSE=0.29µg/l for an aggregated dataset (n=62, P<0.05). The NIR-
red based two-band algorithm by Dekker (1993) and Gitelson et al. (2000) gave the best chlorophyll a prediction model, with R2
=0.79,
RMSE=0.19µg/l. The results illustrate the potential of remote sensing to quantify concentrations of CPAs in turbid waters such as Long Bay, SC.
1. ABSTRACT
There were a total of five cruises aboard a research vessel during the summer of 2013 on May 28, June 4, June 25, July 10, and Ju-
ly 18. There were preselected 15 stations where water quality data, remote sensing data, and 1L filter samples were collected to
measure chlorophyll a, total suspended sediments (TSM), and colored dissolved organic matter (CDOM). In-situ data were collect-
ed using various field instruments including a field-based submersible water quality logger (6600V4-YSI) and a field-based spectro-
radiometer (GER 1500). Data were then further analyzed in the laboratory at the College of Charleston using a lab-based radiome-
ter, lab-based fluorometer and UV-VIS spectrophotometer. TSM concentrations were determined using gravimetric methods.
Figure 1a. Global view of Long Bay in North America Figure 1b. Long Bay South Carolina Figure 1c. Distribution of the 15 stations at Long Bay SC
Figure 2a. YSI measurements were taken and recorded
every half meter until sea depth was reached.
Figure 2b. TSM measurements were taken with the ASD lab-
based radiometer.
Figure 2c. Measurements of Chl a were taken with a lab-
based fluorometer and a maceration method.
500mL filter residue
LabSpecPro Spectrometer
Analysis
Hyperspectral absorption data ob-
tained between 300-2500nm
500mL filter residue Pigment Extraction
Fluorometer Analysis to determine
Chl a Concentration
1 L water sample Obtained 500mL filtrate CDOM Data from UV-VIS Spectro-
photometer
Figure 3a. Flowchart describing lab-based techniques followed in sample analysis. Three primary methods were used to obtain TSM (purple), Chl a (green) and CDOM (yellow).
Figure 3c. First Derivative hyperspectral data obtained from ASD
LabSpecPro Spectroradiometer for all bands between 400 and
2400nm. First derivative data highlights absorption features
that characterize the various in-water constituents.
Figure 3d. Chl a concentrations (ÎĽg/L) varied by date and across the fifteen stations sampled. Stations with higher Chl a concentrations were often near freshwater inputs.
Figure 3e. Total suspended matter (TSM) from each cruise (mg/L). TSM concentrations varied, but higher concentrations were often measured at the mouth of Winyah Bay (station 15).
Chlorophyll a concentrations in aquatic bodies can be predicted remotely by applying various bio-optical models to
satellite data. However, not all remote sensing models perform well in Case II type turbid waters such as the coastal
waters of Long Bay, SC. In this study, several two-band based blue-green models were considered and among the
suite of models, the Oc4v4 algorithm by O’Reilly et al. (2000) produced the best results with coefficients of determi-
nation as high as 0.64 and RMSE=0.29µg/l for an aggregated dataset (n=62, P<0.05). Red-NIR based models were al-
so considered and were able to give even higher determination coefficients in these turbid waters. Among those con-
sidered a modified version of the NIR-red based model after Dekker (1993) and Gitelson et al. (2000) gave R2
of 0.79
and RMSE of 0.19µg/l. The improved model results indicated by the NIR-red based model can be attributed to the
lower amount of interference by CDOM and other detritus constituents in the longer wavelength region, hence chlo-
rophyll a signals have higher signal to noise ratio making the NIR-red optical region more efficient in detecting chlo-
rophyll a induced signals.
REFERENCES
1. Singpiel, R. (2007). “Using Airborne Hyperspectral Imagery to Estimate Chlorophyll-a and Phycocyanin in Three Central Indiana Mesotrophic to Eutrophic Reservoirs.” Ocean color models: Zimba et al.
(2005), Dekker (1993) and Gitelson et al. (2000).
2. Witter, D. L., J. D. Ortiz, S. Palm, R. T. Heath, J. W. Budd. (2009). Assessing the Application of SeaWiFS Ocean Color Algorithms to Lake Erie. Journal of Great Lakes Research, 35, 361-370. Ocean color mod-
els: O’Reilly et al. (2000), Darecki and Stramski (2004).
a. O’Reilly et al. (1998) b. Darecki and Stramski (2004)
c. O’Reilly et al. (2000) d. O’Reilly et al. 2000
e. modified after Dekker (1993) and Gitelson et al. (2000) f. modified after Zimba et al. (2005)
g. modified after Dekker (1993) and Gitelson et al. (2000) h. modified after Dekker (1993) and Gitelson et al. (2000)
2. STUDY AREA
3. METHODS
4. DATA PROCESSING
Using Hyperspectral Remote Sensing Data to Determine Phytoplankton Density in the Coastal Waters of Long Bay, South Carolina
Elliott Harrington (undergraduate), K. Adem Ali
Department of Geology and Environmental Geosciences, College of Charleston, 29424, SC
5. BIO-OPTICAL MODELS
6. CONCLUSION
Figure 3b. Relative reflectance of TSM filters was measured using
an ASD spectroradiometer. An absorption feature around 670nm
is a characteristic of chlorophyll a. Troughs in the blue–green re-
gion also indicate the presence of suspended organic material.
Water sample
from depth of 1 meter
Relative Reflectance of TSM First Derivative Hyperspectral Data
Cruise 2 Cruise 3 Cruise 4 Cruise 5
Color Dissolved Organic Matter (CDOM) Absorption along Long Bay, SC
Figure 3f. Color Dissolved Organic Matter (CDOM) from each cruise (m-1). CDOM characteristically absorbs at lower wavelengths, which may interrupt blue and green reflectance patterns of Chl a.
Cruise 2 Cruise 3 Cruise 4 Cruise 5 Cruise 6

ElliottHarrington_Poster_AGU-2013

  • 1.
    The southeast coastalregion is one of the fastest growing regions in the United States and the increasing utilization of open water bodies has led to the deterioration of water quality and aquatic ecology, placing the future of these resources at risk. In coastal zones, a key index that can be used to assess the stress on the environment is the water quality. This is heavily influenced by multiple biogeochemical constituents or color producing agents (CPAs) such as, phytoplankton, suspend matter, and dissolved organic carbon. The interaction of the chemical, biological and physical components gives rise to the optical complexity, observed in coastal waters of South Carolina (SC) such as in Long Bay, an open ocean, shallow embayment on the South Atlantic Bight of the USA, producing turbid waters. Ecological stress on these environments is reflected by the increase in the frequency and severity of Harmful Algal Blooms (HABs), a prime agent of water quality deterioration, including foul odors and tastes, de-oxygenation of bottom waters (hypoxia and anoxia), toxicity, fish kills, and food web alterations. These aspects threaten human and marine life. To support the sustainability and to better manage the resources, water resource managers need enhanced capabilities of near real -time monitoring to understand the state of the conditions and better protect, manage and address the question of how various natural and an- thropogenic factors affect the health of these environments. Obtaining these observations through conventional in-situ methods is challenging for large open water systems, such as the coastal waters of SC. Remote sensing has become very promising in providing temporal and spatial in- formation regarding the bio-geodynamics in large and open coastal water bodies. In this study, a suite of exiting blue-green and NIR-red bio- optical algorithms were evaluated by applying the reflectance data from an ASD spectroradiometer sensor to predict chlorophyll a in the Long Bay waters. The chlorophyll a pigment is the primary light harvesting pigment in all phytoplankton and is used as an index for the estimation of phytoplankton density concentrations. Efficiency of the algorithms performances were tested through a least squares regression and residual analysis. Results show that for prediction models of chlorophyll a concentrations, the Oc4v4 by O’Reilly et al (2000), two -band blue-green em- pirical algorithm yielded coefficients of determination as high as 0.64 with RMSE=0.29µg/l for an aggregated dataset (n=62, P<0.05). The NIR- red based two-band algorithm by Dekker (1993) and Gitelson et al. (2000) gave the best chlorophyll a prediction model, with R2 =0.79, RMSE=0.19µg/l. The results illustrate the potential of remote sensing to quantify concentrations of CPAs in turbid waters such as Long Bay, SC. 1. ABSTRACT There were a total of five cruises aboard a research vessel during the summer of 2013 on May 28, June 4, June 25, July 10, and Ju- ly 18. There were preselected 15 stations where water quality data, remote sensing data, and 1L filter samples were collected to measure chlorophyll a, total suspended sediments (TSM), and colored dissolved organic matter (CDOM). In-situ data were collect- ed using various field instruments including a field-based submersible water quality logger (6600V4-YSI) and a field-based spectro- radiometer (GER 1500). Data were then further analyzed in the laboratory at the College of Charleston using a lab-based radiome- ter, lab-based fluorometer and UV-VIS spectrophotometer. TSM concentrations were determined using gravimetric methods. Figure 1a. Global view of Long Bay in North America Figure 1b. Long Bay South Carolina Figure 1c. Distribution of the 15 stations at Long Bay SC Figure 2a. YSI measurements were taken and recorded every half meter until sea depth was reached. Figure 2b. TSM measurements were taken with the ASD lab- based radiometer. Figure 2c. Measurements of Chl a were taken with a lab- based fluorometer and a maceration method. 500mL filter residue LabSpecPro Spectrometer Analysis Hyperspectral absorption data ob- tained between 300-2500nm 500mL filter residue Pigment Extraction Fluorometer Analysis to determine Chl a Concentration 1 L water sample Obtained 500mL filtrate CDOM Data from UV-VIS Spectro- photometer Figure 3a. Flowchart describing lab-based techniques followed in sample analysis. Three primary methods were used to obtain TSM (purple), Chl a (green) and CDOM (yellow). Figure 3c. First Derivative hyperspectral data obtained from ASD LabSpecPro Spectroradiometer for all bands between 400 and 2400nm. First derivative data highlights absorption features that characterize the various in-water constituents. Figure 3d. Chl a concentrations (μg/L) varied by date and across the fifteen stations sampled. Stations with higher Chl a concentrations were often near freshwater inputs. Figure 3e. Total suspended matter (TSM) from each cruise (mg/L). TSM concentrations varied, but higher concentrations were often measured at the mouth of Winyah Bay (station 15). Chlorophyll a concentrations in aquatic bodies can be predicted remotely by applying various bio-optical models to satellite data. However, not all remote sensing models perform well in Case II type turbid waters such as the coastal waters of Long Bay, SC. In this study, several two-band based blue-green models were considered and among the suite of models, the Oc4v4 algorithm by O’Reilly et al. (2000) produced the best results with coefficients of determi- nation as high as 0.64 and RMSE=0.29µg/l for an aggregated dataset (n=62, P<0.05). Red-NIR based models were al- so considered and were able to give even higher determination coefficients in these turbid waters. Among those con- sidered a modified version of the NIR-red based model after Dekker (1993) and Gitelson et al. (2000) gave R2 of 0.79 and RMSE of 0.19µg/l. The improved model results indicated by the NIR-red based model can be attributed to the lower amount of interference by CDOM and other detritus constituents in the longer wavelength region, hence chlo- rophyll a signals have higher signal to noise ratio making the NIR-red optical region more efficient in detecting chlo- rophyll a induced signals. REFERENCES 1. Singpiel, R. (2007). “Using Airborne Hyperspectral Imagery to Estimate Chlorophyll-a and Phycocyanin in Three Central Indiana Mesotrophic to Eutrophic Reservoirs.” Ocean color models: Zimba et al. (2005), Dekker (1993) and Gitelson et al. (2000). 2. Witter, D. L., J. D. Ortiz, S. Palm, R. T. Heath, J. W. Budd. (2009). Assessing the Application of SeaWiFS Ocean Color Algorithms to Lake Erie. Journal of Great Lakes Research, 35, 361-370. Ocean color mod- els: O’Reilly et al. (2000), Darecki and Stramski (2004). a. O’Reilly et al. (1998) b. Darecki and Stramski (2004) c. O’Reilly et al. (2000) d. O’Reilly et al. 2000 e. modified after Dekker (1993) and Gitelson et al. (2000) f. modified after Zimba et al. (2005) g. modified after Dekker (1993) and Gitelson et al. (2000) h. modified after Dekker (1993) and Gitelson et al. (2000) 2. STUDY AREA 3. METHODS 4. DATA PROCESSING Using Hyperspectral Remote Sensing Data to Determine Phytoplankton Density in the Coastal Waters of Long Bay, South Carolina Elliott Harrington (undergraduate), K. Adem Ali Department of Geology and Environmental Geosciences, College of Charleston, 29424, SC 5. BIO-OPTICAL MODELS 6. CONCLUSION Figure 3b. Relative reflectance of TSM filters was measured using an ASD spectroradiometer. An absorption feature around 670nm is a characteristic of chlorophyll a. Troughs in the blue–green re- gion also indicate the presence of suspended organic material. Water sample from depth of 1 meter Relative Reflectance of TSM First Derivative Hyperspectral Data Cruise 2 Cruise 3 Cruise 4 Cruise 5 Color Dissolved Organic Matter (CDOM) Absorption along Long Bay, SC Figure 3f. Color Dissolved Organic Matter (CDOM) from each cruise (m-1). CDOM characteristically absorbs at lower wavelengths, which may interrupt blue and green reflectance patterns of Chl a. Cruise 2 Cruise 3 Cruise 4 Cruise 5 Cruise 6