1. Sediment chlorophyll a and organic matter content along the Rhode Island coast
Nicole Leporacci1
, Lindsey Fields2
, Scott Nixon2
1
Coastal Fellow, University of Rhode Island, Kingston, R.I. 02881 2
Graduate School of Oceanography, Narragansett, R.I. 02882
Acknowledgements
References
Introduction Results Discussion
Station
Mean
Depth (m) % OM
Chl a
(µg cm2
)
Phaeo
(µg cm2
)
PROV
(1) 5
9.4-12.8 17.1-42.3 138.0-324.5
(10.8) (31.8) (233.8)
BAY
(2) 7
4.8-7.3 5.0-21.5 37.6-84.9
(5.9) (9.6) (61.7)
RIS
(3) 36
2.6-5.1 4.0-21.6 18.7-73.2
(3.3) (12.7) (40.9)
BIS
(4) 34
4.7-6.5 7.7-28.7 15.6-89.6
(5.5) (19.5) (48.0)
Conclusion
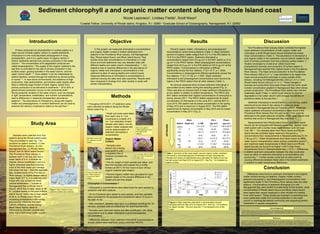
Figure 1. Map of stations where
sediment samples were collected.
Objective
Methods
Top of syringe used to collect
small sub-cores of sediment
from each core.
Study Area
• Throughout 2010-2011, 27 sediment cores
were collected at stations along the Rhode
Island coast (Fig. 1).
• The dry weight of each sample was taken, and
then the samples were placed into a muffle
furnace at 550°C for four hours to burn off any
organic material (ash weight).
• Percent organic matter was calculated for each
sample based on the percent difference in dry
weight and ash-free weight.
Chlorophyll a Concentration 8
• Chlorophyll a concentrations were determined for each sample by
extraction with 90% acetone.
• 35 ml of acetone were added to each sample, and then samples
were sonicated for 30 seconds and extracted for about 16 hours in
the dark on ice.
• After extraction, samples were spun in a tabletop centrifuge for 10
minutes, and then read on a Beckman AU spectrophotometer.
• Samples were read both before and after acidification with dilute
hydrochloric acid to obtain chlorophyll a and phaeopigment
concentrations.
• Differences between mean sediment chlorophyll a concentrations
at each station were examined using a one-way ANOVA.
Box-core used to
collect sediment cores
from BIS & RIS
stations.
Sediment core used
for collection at each
station.
Long-core pole used
to collect sediment
cores from PROV
station.
Organic Matter
Content
• Samples were
placed into a drying
oven at 65°C until
completely free of
moisture (constant dry
weight).
Table 1. Summary of the mean depth, percent organic matter, sediment
chlorophyll a, and phaeopigment concentration at each sampling site.
Ranges and means (in parenthesis) were calculated for stations over two
annual cycles from May 2010 to August 2011. See Fig. 1 for locations by
station number
Figure 2. Mean sediment chlorophyll a concentrations at each
sampling site from May 2010 to August 2011. See Fig. 1 for locations
by station number. The error bars are +/- the standard error of the
mean.
OFFSHORE
• Small sub-cores were taken
from each core in 1 cm
increments to a depth of 5
cm. Two replicates of each
sample were taken, one for
organic matter analysis and
one for determination of
sediment chlorophyll a
concentration.
MAY
2010
AUG
2011
MAY
2011
FEB
2011
AUG
2010
NOV
2010
Date
Percent organic matter, chlorophyll a, and phaeopigment
concentrations varied among stations (Table 1). Mean sediment
percent of organic matter ranged from 3.3 % in the RIS station to
10.8 % in the PROV station. Sediment chlorophyll a
concentrations ranged from 9.6 μg cm2
in the BAY station to 31.8
μg cm2
in the PROV station. Mean phaeopigment concentrations
ranged from 40.9 μg cm2
in the RIS station to 233.8 μg cm2
at the
PROV station. Concentrations in chlorophyll a differed
significantly across the four stations, F (3) = 9.17, p = .0004.
Concentrations in phaeopigments differed significantly across the
four stations, F (3) = 41.49, p = <.0001. Mean sediment
chlorophyll a and phaeopigment concentrations were found to be
higher in the PROV station than all other stations (Table 1).
No obvious seasonal trend of mean sediment chlorophyll a
was evident at any station during the sampling period (Fig. 2).
There was also no obvious trend of mean sediment chlorophyll a
at any station in relation to bottom temperature. The PROV and
BAY station exhibited their highest concentrations of chlorophyll a
during January 2011. The PROV station experienced its lowest
concentration of chlorophyll a in the June 2011, and the BAY in
June 2010. BIS station had its lowest concentration in the spring
of May 2010 and a maximum in August 2010. The RIS station
experienced its highest concentration in May 2010 and its lowest
concentration in May 2011 (Fig. 2).
Samples were collected from four
stations along the Rhode Island coast.
They are located in (see Fig. 1 for
locations by station number): (1) the
Providence River estuary, (2) mid-
Narragansett Bay, (3) Rhode Island
Sound, and (4) Block Island Sound.
The Providence River estuary is
farthest north in the bay and has a
mean depth of 5 m. It exhibits an
intense vertical stratification and is a
highly urbanized area that receives
most of the fresh water and sewage
that enters the bay 5
. Mid-Narragansett
Bay, located south of the Providence
River estuary, is slightly deeper with a
mean depth of 7 m. It is relatively well-
mixed with only occasional weak
vertical stratification 1
. Outside of
Narragansett Bay is Rhode Island
Sound, which has a mean depth of 36
m. Located nearby to the west is Block
Island Sound, which has a mean depth
of 34 m. In Rhode Island Sound,
increasing temperature in the spring
and summer stabilizes the water
column, inhibiting vertical mixing 7
.
Block Island Sound, which is
influenced by stronger currents and
tides, has a well-mixed water column 7
.
The Providence River estuary station exhibited the highest
mean sediment concentrations of both organic matter and
chlorophyll a while Rhode Island Sound exhibited the lowest
mean concentrations (Table 1). The abundance of chlorophyll a
and organic matter in the sediments may be directly related to the
level of primary production from the overlying surface waters 4,9
.
Studies conducted by Oviatt et al. (2002) found that
phytoplankton biomass and production of surface waters in
Narragansett Bay reached their highest levels in the Providence
River estuary. The mean annual production in the Providence
River estuary (559 g C m-2
y-1
) was estimated to be higher than
mean annual production estimates in areas outside of the
estuary, including mid-Narragansett Bay (323 g C m-2
y-1
) and
Rhode Island Sound (232 g C m-2
y-1
) 6
. These changes in
biomass and productivity have been linked with the north–south
nutrient concentration gradient in Narragansett Bay which drives
primary production6
. The Providence River station also had the
shallowest depth (Table 1), which could reduce the time for
degradation in the water column and increase the delivery of
planktonic debris to the sea floor 9
.
Sediment chlorophyll a concentrations in the mid-bay station
were found to be close to the values of a previous study
conducted in Narragansett Bay by Fulweiler (2007). Relatively
higher sediment chlorophyll concentrations were found in the
Providence River estuary than the past study 2
.This could be
attributed to the great seasonal variability of the water column and
benthos that occurs in Narragansett Bay over time 1,5
.
Measurements from Rhode Island Sound and Block Island
Sound can be compared with Massachusetts Bay, another inner-
shelf system with a similar mean depth located north of Cape
Cod, MA 3,7
. Our samples taken from Block Island and Rhode
Island Sounds exhibited higher sediment chlorophyll a
concentrations than measurements in Massachusetts Bay (1.70-
2.36 µg cm3
) 3
. Water temperatures have been known to affect
water column characteristics where primary production occurs 6
,
and maximum water temperatures in Block Island and Rhode
Island Sounds are found to be higher (~24°C) than those
temperatures found in Massachusetts Bay (~12°C) 3
. Differences
in bottom sediment composition between the sites could also
have an affect on sediment chlorophyll a concentrations and
productivity 3,7
. Further studies could look at what could be
causing differences between these sites in the bottom sediments
in addition to water temperature differences.
Differences were found in sediment chlorophyll a and organic
matter content among our stations. Organic matter content,
sediment chlorophyll a, and phaeopigment concentrations were
significantly higher in the Providence River estuary than the other
stations. Concentrations of sediment chlorophyll a in mid
Narragansett Bay were similar to a past study at this location, while
concentrations in Rhode Island Sound and Block Island Sound
were higher than values measured in other studies of a nearby
inner-shelf system. These results are important in examining how
much particulate matter from primary production in the water
column is reaching the benthic community and supporting benthic
metabolism in aquatic ecosystems.
In this project, we measured chlorophyll a concentrations
and organic matter content in bottom sediments from
stations in the Providence River estuary, mid-Narragansett
Bay, Rhode Island Sound, and Block Island Sound. Past
studies show that concentrations of chlorophyll a in near
shore and shelf sediments may vary between sites with
different depths and water-column characteristics 1, 9
. Our
objective was to examine differences in the abundance of
organic matter and chlorophyll a concentrations in the
sediment at sites of varying depths and nutrient inputs.
Seasonal differences of chlorophyll a concentrations in
sediment among the sites were also examined. Results were
then compared to findings from other studies in areas with
similar characteristics.
Primary production by phytoplankton in surface waters is a
major source of labile organic carbon to coastal sediments.
Chlorophyll a is the most abundant photopigment in living
phytoplankton, and it is a useful tracer of organic carbon in
bottom sediments derived from primary production in the water
column 4
. The concentration of its degradation products are
called phaeopigments 9
.The supply of this organic material to the
sea floor is controlled by the rate of primary production in the
surface ocean, grazing activities in the water column, and the
water column depth 4, 9
. Once settled, it can be metabolized by
bottom-dwellers, worked through the sediment by animal activity,
or buried 3, 4
. In near-shore environments, the existence of high
productivity, high sedimentation, and shallow water depths often
allow a relatively large fraction of fresh organic carbon from
primary production to be delivered to sediments 4
. 30 to 50% of
global primary production occurs on the continental shelf 1
.
Strong seasonal variation in the water column, such as changes
in light, temperature, stratification, and nutrient concentrations,
lead to differences in seasonal phytoplankton abundance
patterns 6
. The abundance of chlorophyll a, along with organic
matter and phaeopigments, in surface sediments can be used to
examine the delivery of planktonic debris to the sea floor 9
.
(1) Fulweiler, R.W. & Nixon, S. 2009. Hydrobiologia 629: 147-156. (2) Fulweiler, R.W. 2007. The impact of climate change on benthic-pelagic coupling and the
biogeochemical cycling of Narragansett Bay, RI. Ph.D. thesis, University of Rhode Island, Narragansett, RI. (3) Hopkinson, C.S. et al. 2001. Marine Ecology Progress
Series 224: 1-10. (4) Ingalls, A.R. et al. 2000. Journal of Marine Research 58: 631-651. (5) Nixon, S. et al. 2009. Estuarine, Coastal, and Shelf Science 82: 1-18. (6) Oviatt
C. et al. (2002) Estuarine, Coastal and Shelf Science 54: 1013-1026. (7) Shonting, D. & Cook, G. 1970. Limnol. Oceanogr 15:100-112. (8) Strickland, J. & Parsons, T.
1972. A practical handbook of seawater analysis. Fisheries research board of Canada, Ottawa 310 pp. (9) Sun, M. et al. 1991. Journal of Marine Research 49: 379-401.
Chlorophylla(μgcm2
)
I would like to thank my mentor Lindsey Fields, as well as Scott Nixon, at the URI Graduate School of Oceanography. Thank you to the National Science
Foundation (NSF) and Rhode Island Sea Grant for the funding of this project. I would like to thank the URI’s Coastal Fellowship Program, as well as Brianne
Neptin, for also providing funding and giving me this amazing opportunity. The Coastal Fellows Program is supported in part by the URI Offices of the President
and Provost and the College of Environmental and Life Sciences.