Assessment of Groundwater Quality in the Faria Catchment, Palestine.PDF
LIMESTONE BED CONTACTORS
1. LIMESTONE BED CONTACTORS FOR
CONTROL OF CORROSION AT SMALL
WATER UTILITIES
by
Raymond D. Letterman
Charles T. Driscoll, Jr.
Marwan Haddad
H. Alan Hsu
Syracuse University
Syracuse, New York 13210
Cooperative Agreement No. CR-809979-0l-3
Project Officer
Gary S. Logsdon
Drinking Water Research Division
Water Engineering Research Laboratory
Cincinnati, Ohio 45268
WATER ENGINEERING RESEARCH LABORATORY
OFFICE OF RESEARCH AND DEVELOPMENT
U.S. ENVIRONMENTAL PROTECTION AGENCY
CINCINNATI, OHIO 45268
EPA/600/2-86/099
PB87-112058
2. FOREWORD
The U.S. Environmental Protection Agency is charged by Congress with
protecting the Nation's land, air, and water systems. Under a mandate of
national environmental laws, the agency strives to formulate and implement
actions leading to a compatible balance between human activities and the
ability of natural systems to support and nurture life. The Clean Water
Act, the Safe Drinking Water Act, and the Toxic Substances Control Act are
three of the major congressional laws that provide the framework for restoring
and maintaining the integrity of our Nation's water, for preserving and en-
hancing the water we drink, and for protecting the environment from toxic
substances. These laws direct the EPA to perform research to define our
environmental problems, measure the impacts, and search for solutions.
The Water Engineering Research Laboratory is that component of EPA's
Research and Development program concerned with preventing, treating, and
managing municipal and industrial wastewater discharges; establishing prac-
tices to control and remove contaminants from drinking water and to prevent
its deterioration during storage and distribution; arid assessing the nature
and controllability of releases of toxic substances to the air, water, and
land from manufacturing processes and subsequent product uses. This publi-
cation is one of the products of that research and provides a vital communi-
cation link between the researcher and the user co~unity.
Use of limestone contactors to raise the pH, calcium content, and alkalinity
of low pH, soft water was evaluated in this project. Studies were conducted
in pilot plant cplumns at Syracuse University, and field evaluations of three
types of contactors were carried out at Big Moose Lake in the Adirondacks.
The limestone contactors were shown to be capable of reducing the corrosive
tendency of water, as measured by copper and lead concentration increases
in water held in plumbing of cottages at Big Moose Lake. The model for water
quality changes in a limestone column hold promise for application to design
of limestone beds placed in upwelling zones (submerged springs) on the beds
of acidified lakes.
ii
3. DISCLAIMER
The information in this document has been funded in part by the United States
Environmental Protection Agency under assistance agreement number
CR-809979-0l-) to Syracuse University. It has been subject to the Agency's
peer and administrative review, and it has been approved for publication
as an EPA document. Mention of trade names or commercial products does not
constitute endorsement or recommendation for use.
iii
4. ABSTRACT
A study was conducted to investigate the use of limestone contactors
as a technique for mitigating corrosion in small water supply systems that
use dilute acidic water. As water is transported through a packed bed of
crushed limestone, calcium carbonate dissolves and the pH, calcium ion concen-
tration, and alkalinity increase.
A mathematical model was derived for use in contactor design. The model
is based on the interfacial transport of calcium ion and relates the depth
of limestone required in the contactor to the desired effluent water chemistry,
influent water chemistry, limestone particle size and shape, limestone bed
porosity, and water temperature, and superficial velocity. The model was
calibrated and tested using laboratory column experiments.
In a contactor monitored for 2.5 years (except for the initial few months)
the water quality following treatment was essentially constant. No gradual,
long-term degradation in performance was noted. After several months of
operation, however~the rate of CaC03 dissolution was not as high as that
observed in the laboratory using fresh limestone. The rate of dissolution
is possibly reduced by an alumino-silicate residue that remains after the
CaC03 is dissolved from the limestone matrix. A microbiological film may
also have been a limiting factor.
Field study results indicated that limestone contactors can be used
to effectively reduce the tendency of water to take up corrosion byproducts
(copper, lead, and zinc) from surfaces in piping systems. Copper and lead
concentrations in first-flush samples of cottage tapwater receiving untreated
spring water were 1.9 ± 0.31 mg CulL and 0.046 + 0.004 mg pblL, respectivley.
Contactor-treated water at Bay Side cottage contained copper concentrations
of 0.030 + 0.037 mg CulL and lead concentrations of 0.0084 + 0.0084 mg Pb/L.
This report was submitted in fulfillment of Cooperative Agreement CR-809979-01-3
by Syracuse University under the sponsorship of the U.S. Environmental Protec-
tion Agency. This report covers the period August 1, 1982 to July 31, 1985
and work was cQmp1eted,as of July 31, 1985.
iv
5. CONTENTS
Foreward ..•.•..........•..............•........................••.•..... i i
Abstract ..•.•••......••...•..............•••......................•..... iv
List of Figures •..........•...........•..................•....••.•••.... vii
List of Tables •.•.•...•.•......•.............•......•.................•. xii
Acknowledgments ...•........................•............•........•....•. xiv
Section 1
Introduction ...•..•.............•..•..•................•...•...•....• 1
Statement of Problem.•..•.•...•...•...............•....•...•.•• l
Study Objective ..•......•.....•.........•..•.................•. 1
Section 2
Conc1us ions .....................•...••.....•..............•.......... 3
Section 3
Recommendations .......•....•.•......•....•.......•...•...........•... 5
Section 4
Literature Review.•.••.•...•....•...•..............•................•. 6
Introduction .......•.....•.............•....................... 6
Limestone Properties ......•.................•....•..•.......... 6
Kinetics of Limestone Dissolution 8
Packed Bed Reactors ....•......•..•............•................ 22
Metal Release from Pipes .........•.•........................... 24
Section 5
Methods and Materials ....•.......•...............•..•................ 32
Apparatuses - Laboratory and Field Contactor Units 32
Laboratory contactors ..•.......................•........... 32
Fie ld Contactors '....................• 34
Limestone Characteristics ..............•...........•....... 40
Limestone Bed Characteristics .......•............•........• 45
Pipesection Procedures .......•...•...........•................. 55
Sampling and Analytical Procedures 55
Gener'al Procedures •............••................•......•.. 55
Laboratory contactors ....••.......•........................ 57
Quality Assurance/Quality Control Information Data 57
Computative Analysis ..•.•.....•..••..•..•••................•... 65
Section 6
Derivation of Contactor Design Equations 69
Equilibrium Calcium Concentration .....................•........ 71
Section 7
Results and Discussion ................................•.............. 74
Model Verification ..................•......•.........•......... 74
Equilibrium Calcium Concentration ...•.....................• 74
Contactor Design Equations •.....•.......................... 8l
v
6. Section 7 (con't)
Field Study Results 94
Baffled Box Contactor 94
Bayside Cottage Wound Fiberglass Column 116
Culligan (Cullneu®) Contactor 119
Evaluation of Contactor Design Equations Using
Field Measurements 127
Sensitivity Analysis - Design Equations 133
Thermodynamic Calculations of Trace Metal Chemistry 138
Pipe Leaching Experiments 156
Metal Release from Field Site 164
Spring Contactor Treatment 164
Lake Contactor Treatment 167
References 177
Appendices
A - Chemical Equilibrium Model used in Contactor Design Equation 184
B - Dissolution Rate Data from Column Experiments 199
C - Estimates of Limestone Contactor Costs 205
vi
7. Number
1
2
3
4
5
6
7
8
9
10
11
12
13
14
15
16
FIGURES
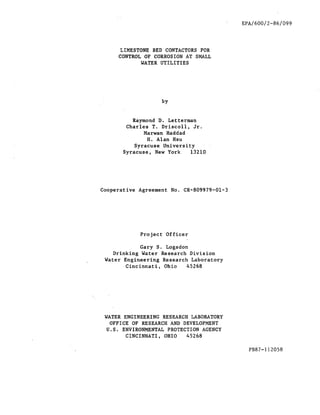
Locations of major chalk and limestone deposits in the
continental United States .................•.•.................. 9
Schematic representation of the calcium carbonate dissolution
process 13
Initial rate of calcite dissolution as a function of the bulk
solution pH from Sjoberg and Rickard (1984a) 18
Initial rate of calcite dissolution as a function of bulk
solution pH and partial pressure of carbon dioxide (Plummer
et al., 1975) .......................................•...•...... 19
Initial rate of calcite dissolution as a function of the
square root of rotating disk rotational speed 21
Laboratory columns with water supply and flow control system... 33
Baffled-box contactor used in the field study 35
Wound-fiberglass and Culligan contactors used in the field
study •...•..................................................... 36
Map of the Covewood'lodge property located near Old Forge,
N. Y. Site of the field study ............•..................... 38
Diagram showing the installation of the baffled-box contactor
in the spring at Covewood ...................•.....•............ 39
Measured porosity plotted as a func tion of container surface
area to volume ratio for four limestone particle effective
diameters ..................•....•.............................. 46
Measured effluent tracer concentration plotted as a function
of time elapsed after tracer injection for four values of the
superficial velocity ...................•.........•..•...•.....• 50
Mean residence time calculated using the superficial velocity
and measured porosity plotted as a function of the mean
residence time from the tracer experiments 53
Measured effluent tracer concentration plotted as a function
of the time elapsed after tracer injection for the baffled-box
contactor (Figure 7) .......................•...•..........•.... 54
Measured and calculated alkalinity for field measurements ...•.. 61
pH plotted as a function of the axial distance to the sampling
port and influent pH, pHo •....•................................ 75
vii
8. Number
17
18
19
20
21
22
23
24
25
26
27
28
29
Calcium concentration plotted as a function of the axial
distance to the sampling port and influent pH, pHo '" 76
Dissolved inorganic carbon concentration plotted as a
function of the axial distance to the sampling port and
influent pH, pHo 77
Equilibrium pH, dissolved inorganic carbon and calcium concentrations
plotted as a function of the influent pH and the
following conditions; Curve A - closed systen and Cbo = 0;
Curve B closed system and Cbo = 28 mgCa/L; Curve C - closed/
open system and Cbo = 0; Curve D - closed/open systen and
Cbo = 28 mgCa/L 79
Influent calcium concentration plotted as a function of the
influent dissolved inorganic cargon concentration and the
equilibrium pH for an influent pH of 6.0 80
Sum of the square of the difference between the observed and
the model predicted calcium concentration plotted as a
function of the dissolution rate constant for run number 32,
Appendix B •..•.••.•.••••••.••.••..•••.••..•.•.•.••.•.•.•.••..•. 83
Model predicted and measured calcium concentrations plotted as
a function of the axial distance to the sampling port for run
number 32 and Ko = 0.032 cm/min 84
In [CbL - Ceq)/(Cbo - Ceq)] plotted as a function of the
axial distance to the sampling port for runs 29, 31 and 32 ..... 85
Dissolution rate constant determined by the least squares
method (Method II) plotted as a function of the value obtained
using plots such as Figure 23 (Method I) 86
Mass transfer factor, jD' plotted as a function of a modified
Reynold's number using the equations derived by Chu and
Khalil (1953) 88
Values of the dissolution rate constant calculated using the
model equations plotted as a function of the experimental
(best-fit) values listed in Appendix B 90
Observed calcium concentration plotted as a function of the
model predicted value. The points include all sampling port
locations for the runs listed in Appendix B 91
Model predicted and measured pH plotted as a function of the
axial distance to the sampling port for run number 32 and Ko =
0.032 em/min 93
Observed pH plotted as a function of the model predicted values
for all sampling port locations for the runs listed in
Appendix B · ··· 95
viii
9. Number
31
32
33
34
35
36
37
38
39
40
41
42
43
44
45
Model predicted and measured alkalinity plotted as a function
of the axial distance to the sampling port for run number
32 and Ko = 0.032 em/min 98
Measured change in alkalinity within the laboratory contactors
plotted as a function of the model predicted change 99
Water temperature plotted as a function of time for the
baffled-box contactor 100
Influent and effluent pH plotted as a function of time for the
baffled-box contactor 101
Influent and effluent calcium concentration plotted as a
function of time for the baffled-box contactor 103
Influent and effluent alkalinity plotted as a function of time
for the baffled-box contactor 104
Influent and effluent dissolved inorganic carbon concentration
plotted as a function of time for the baffled-box contactor .... l05
Influent and effluent standard plate count bacteria concentration
plotted as a function of time for the baffled-box
contactor 106
Influent and effluent total coliform bacteria concentration
plotted as a function of time for the baffled-box contactor .... l07
Calculated partial pressure of carbon dioxide plotted as a
function of time for the influent and effluent of the
baffled-box contactor 111
X-ray energy spectra for the following samples: A - fresh
limestone, B - limestone after prolonged dissolution in the
baffled-box contactor, com~artment 1, C - same as B except
compartment 5, D - limestone after prolonged dissolution
in the laboratory .....................................•........ 117
Influent and effluent pH plotted as a function of time for the
wound-fiberglass contactor in Bayside Cottage 120
Influent and effluent calcium concentration plotted as a
function of time for the wound-fiberglass contactor in
Bayside Cottage 121
Influent and effluent alkalinity plotted as a function of
time for the wound-fiberglass contactor in Bayside Cottage ..... 123
Influent and effluent dissolved inorganic carbon concentration
plotted as a function of time for the wound-fiberglass contactor
in Bayside Cottage ...............•...............•......... 123
ix
10. Number
46
47
48
49
50
51
52
53
54
55
56
57
58
X-ray energy spectrum for a limestone sample taken from the
wound-fiberglass contactor at the end of the experiment 125
X-ray energy spectra for fresh Cullneu® medium (A) and Cullneu®
used in the Culligan contactor for 9 months (B) ••..•.....••...• 128
Total depth of limestone required to obtain an effluent pH
of 8.5 plotted as a function of the ionic strength 140
Predominance area diagram for the stability of lead passivation
films over a range of pH and dissolved inorganic carbon
concentrations at 25°C p*Kso = -8.15 142
Predominance area diagram for the stability of lead passivation
films over a range of pH and dissolved inorganic carbon
concentrations at 250°C p*Kso = -13.07 143
Lead concentrations calculated with the chemical equilibrium
model MINEQL as a function of pH for several concentrations of
dissolved inorganic carbon 144
Predominance area diagram for the stability of lead passivation
films over a range of pH and partial pressures of C02 at
25°C p*Kso = 8.15 146
Predominance area diagram for the stability of lead passivation
films over a range of pH and partial pressures of C02 at
25°C p*Kso = 13.07 147
Lead concentrations calculated with the chemical equilibrium
model MINEQL as a function of pH for several partial pressures
of C02 148
Predominance 'area diagram for the stability of copper passivation
films over ranges of pH and dissolved inorganic carbon
concentrations at 25°C 149
Copper concentrations calculated with the chemical equilibrium
model MINEQL as a function of pH for several concentrations
of dissolved inorganic carbon •................................. 150
Copper concentrations calculated with the chemical equilibrium
model MINEQL as a function of pH for several partial pressures
of C02 151
Predominance area diagram for the stability of zinc passivation
films over a range of pH and dissolved inorganic carbon concen-
trations at 25°C ..•............................................ 152
x
11. Number
59
60
61
62
63
64
65
66
67
68
69
70
71
72
Zinc concentrations calculated with the chemical equilibrium
model MINEQL as a function of pH for several dissolved inorganic
carbon concentrations .....................................•.... 153
Predominance area diagram for the stability of zinc passivation
films over ranges of pH and partial pressures of G02
at 25°G .....................................•...............•.. 154
Zinc concentrations calculated with the chemical equilibrium
model MINEQL as a function of pH for several partial pressures
of G02 155
Lead concentrations from lead pipe sections leaching
experiments 157
Zinc concentrations from galvanized steel pipe"section
leaching experiments ................•.......................... 158
Total and filtered concentrations of lead from lead pipe section
leaching experiments 159
Variations in pH (a), dissolved inorganic carbon (nIG) concen
tration (b) and measured copper (c) and lead (d) concentrations
from pipe section leaching experiments as a function of column
treatment by GaG03 160
Gopper concentrations from copper pipe section leaching
experiments at various levels of GaG03 treatment (variations
in pH) 162
Lead concentrations from copper pipe section with lead-tin
solder leaching experiments at various levels of laboratory
GaG03 treatment (variations in pH) 163
The probability of copper concentrations in untreated and
GaG03 treated lake and spring waters exceeding a given
concentration 168
The probability of lead concentrations in untreated and GaG03
treated lake and springwaters exceeding a given concentration .. 169
A comparison of measured copper concentrations from first flush
tapwater derived from GaG03 treated lakewater and calculated
values from the chemical equilibrium model MIEQL as a function
of pH 173
A comparison of measured copper concentrations from first flush
tapwater derived from GaG03 treated lakewater and calculaated
values from the chemical equilibrium model MINEQL .............• 174
A comparison of measured lead concentrations from first flush
tapwater derived from GaG03 treatment and calculated values
from the chemical equilibrium model MINEQL as a function
of pH ...•....•...............•........•....•........•.•........ 176
xi
12. Number
1
2
3
4
5
6
7
8
9
10
11
12
13
14
15
16
17
TABLES
Representative Chemical Analysis of Different Types of Limestone
(from Boynton, 1980) . . . . . . . . . . . . . . . .
Major Impurities in High Calcium Limestone (45 U. S. Samples
(from Murray et al., 1954) .
Minor Impurities in High Calcium Limestone (25 U. S. Samples)
(from Murray' et al., 1954) .
Oxidation Potential of Metallic Materials
Passivation Film Minerals That May Be Important In Regulating
Metal Solubility to Water Distribution Systems . . .
Effective Solubility of Crushed Limestone Experimental
Results. . . . . . . . . . . . . . . .
Limestone Particle Size and Sphericity Analysis Results
Bed Porosity and Limestone Particle Surface Area Per Unit
Volume of Interstitial Water .
Results of Tracer Response Measurements Obtained Using Laboratory
Columns (Figure 6) ,
Analytical Methods.
Summary of Sampling and Analytical Precision from Sample
Triplicate Program . . . . . . . . . . . .
Estimates of Sample Collection and Analytical Precision from
4 x 4 Analysis for Big Moose Lake. .. . . . . .
Summary of Blind Sample Analysis Obtained from USEPA Clinic
Municipal Environmental Research Laboratory. . . . .
Summary_~f USEPA CERL of Blind Audit Analysis. All Values in
eq 1 Except Where Indicated. . . . . . . .
Equilibrium Constants at 25°C for the Solids Considered in the
MINEQL Calculations ..
Reactions and Equilibrium Constants at 25°C for the Aqueous
Complexes Considered in the MINEQL Calculations . . . . .
Summary of Baffled-Box Contactor Results Field Measurements
xii
7
10
11
26
29
42
44
48
51
56
59
60
62 & 63
64
66
67
109
13. Number
18
19
20
21
22
23
24
25
26
27
28
29
30
Baffled-Box Contactor - Limestone Dissolution June 28, 1982
September 26, 1983 . . . . . . . . . .
Summary of Bay Side Cottage Wound Fiberglass Column Results . . . .
Culligan Contactor - Summary of Results November 3, 1983 July 31,
1984. . . . .. . .
Baffled-Box and Wound Fiberglass Contactors - Special Test of
Model Equations. Experimental Conditions and Results . . .
Special Test of Model Equations Calculated Equ1ibrium pH and
Calcium Concentration. . . . . . . . .
Results of Field Test of Model Equations.
Results of Chemical Equilibrium Model Calculations.
Sensitivity Analysis Results ..
Effect of Ionic Strength on the Equilibrium and Contactor
Effluent (pH = 8.5) Calcium Concentrations. . . . .
Comparison of Trace Metal Concentration (as mg/1) in Spring Water
and from the First Flush of Treated (Hillside, Bay Side) and
Untreated (Covewood) Cottages .
Comparison of Copper and Lead Concentrations (Mean ± Std. Dev.
as mg/1) from First Flush and Three Minutes of Flowing Tapwater
Derived from the Box Contactor Treated Spring . . . . .
Metal Concentrations (as mg/1) in Lake Influent, Untreated and
Treated First Flush Tapwater at Bay Side . . . . . . .
Comparison of Copper and Lead Concentrations (Mean ± Std. Dev,.
as mg/1) from First Flush and After Three Minutes of Flowing
Tapwater Derived from Both CaC0
3
Treated and Untreated
Lakewater .
xiii
114
124
126
129
130
131
135
137
139
165
166
171
172
14. ACKNOWLEDGMENTS
The field study part of this project was conducted with the help and
cooperation of C.V. "Major" Bowes, proprietor of Covewood Lodge on Big Moose
Lake. The first contactor at Covewood was built and installed by Major Bowes
and it was his interest in water quality that led to our first measurements
and eventually to this research project. We would also like to acknowledge
Dr. Gary S. Logsdon of the U.S. Environmental Protection Agency for his con-
tinuous assistance, review comments and patience.
xiv
15. SECTION I
INTRODUCTION
STATEMENT OF PROBLEM
In many areas of the United States individual homeowners and small public
and private water supply systems use water that is potentially corrosive
to the materials used in the water distribution system. Corrosion is a concern
to the owners and users of small water supply systems because of the potential
health problems associated with the ingestion of corrosion byproducts, the
degradation of the esthetic quality of the water and the significant economic
consequences of piping system deterioration.
Corrosion and the contamination of the water by corrosion by-products
may be caused by the use of dilute acidic waters that generally have low
pH, alkalinity and concentrations of dissolved solids. Dilute acidic ground
and surface waters are found in a number of regions of the country, particu-
larly in regions underlain by siliceous bedrock. These waters are naturally
low in buffering capacity and they are corrosive. They are also prone to
acidification by atmospheric deposition of strong acids (acid precipitation)
or other factors such as changes in land use. In some areas (for example
the Adirondack Region of New York State) it is possible that the corrosivity
of water has been increased by acidic deposition. In any event, until recent
concern developed about acidic deposition and the deterioration of water
quality as a result of acidification residents and visitors tolerated or
ignored the problems caused by the use of corrosive water. Now this indiffer-
ence has changed to a signficant concern, and many home and resort owners
as well as those responsible for village water supplies have begun to adopt
techniques designed to mitigate drinking water corrosivity.
Low cost is a very important criterion in establishing the feasibility
of a corrosion mitigation technique for a small water supply system. Also
the maintenance required should be minimal, and the technique should present
a low potential for public health hazard resulting from improper construction,
installation or maintenance. Limestone contactors are water treatment devices
that tend to meet these requirements.
In a limestone contactor water flows through under a closed-to-the-atmo-
sphere condition and dissolves a packed bed of crushed limestone. The chemistry
of the water is altered as the limestone dissolves. Sources of CaC0
3
other
than high calcium limestone (eg., seashells,) are sometimes used. L~mestone
contactors are simple but effective devices with low capital cost and minimum
maintenance requirements. They have been used for the neutralization of
acid mine drainage, acidic industrial wastes, and dilute acidic surface waters.
STUDY OBJECTIVES
The overall objective of this project was to investigate the use of
limestone contactors as a technique for the mitigating corrosion in small
I
16. water supply systems that use dilute acidic water. The research plan included
the development and testing of a rational method for contactor design and
the evaluation of the field operation of a contactor with respect to corrosion
control and operation and maintenance problems. The study had the following
specific objectives:
(1) to derive and test (using laboratory, column-type reactors) a mathe-
matical model for limestone contactor design,
(2) to develop design objectives by experimentally determining the
relationship between contactor-treated water quality and metal
release from pipes, and
(3) to evaluate the practical application of the design equations and
objectives by monitoring the field performance of full-scale contac-
tors and to determine the feasibility of long-term operation and
the type and frequency of maintenance required. -
2
17. SECTION 2
CONCLUSIONS
As dilute acidic water is transported through a packed bed of crushed
limestone, calcium carbonate in the limestone dissolves, the pH, calcium ion
concentration, and alkalinity increase, and the tendency may decrease for
water to dissolve corrosion by-products from surfaces in piping systems.
The depth of limestone, L, required to achieve a given level of treatment
can be calculated using a mathematical model based on interfacial transport
of calcium ion,
In[(Ceq - CbL)/(Ceq - Cbo)]
L = Ko a E: rKo a E:
I 2
- 2 d
Us ! Us I
J~
where a is the interfacial area of limestone per unit volume o! interstitial
water, E: is the bed porosity, Us is the superficial velocity, d is the effective
diameter of the limestone particles, and Ko is the overall CaC03 dissolution
rate constant. Cbo is the influent calcium concentration. The results of
this study indicate that Ko can be estimated using an existing correlation
of dim~nsionless mass transfer parameters. The quantity "a" can be estimated
using d and the particle sphericity. The equilibrium and effluent calcium
concentrations, Ceq and CbL l are determined using a chemical equilibrium
model. The magnitudes of these parameters are a function of the characteristics
of the influent solution, particularly the temperature, pH, and calcium and
dissolved inorganic carbon (DIC) concentrations. As the influent calcium
and/or DIC concentrations increase the maximum pH (pHeq ) that can be attained
in a contactor decreases, and the depth of limestone required to reach a given
effluent pH « pHeq ) increases. The depth of limestone required to achieve
a given treatment objective also increases with decreasing influent pH, increasing
superficial velocity, and increasing limestone particle size.
An evaluation of a limestone c0ntactor in the field suggests that except
for the initial few months, water quality following treatment was constant
through the 2.5-year study period. There was no evidence of a gradual, long-
term reduction in performance. However, after 3 or 4 months of continuous
operation, the rate of GaG03 dissolution was not as high as that predicted
by the laboratory results obtained with fresh limestone. Analysis of the
limestone surfaces by x-ray energy spectrometry indicated that prolonged opera-
tion altered the surface of the limestone; the relative abundance of calcium
on the surface decreased, and aluminum and silicon increased. Apparently,
alumino-silicate impurities in the limestone remained as a thin "residue"
after the CaG03 was leached from the limestone surface matrix. This residue
may have slowed the dissolution rate. Also possible is that the dissolution
process was adversely affected by a microbiological film on the limestone.
The model developed for contactor design assumes that the water flows
through the limestone under a closed-to-gaseous carbon dioxide condition.
3
18. Equilibration of the column effluent with atmospheric carbon dioxide can have
a significant effect on the pH of the solution and hence on the tendency to
dissolve corrosion by products. When the influent DIG is high, (e.g., greater
than 10 mg GIL), equilibration with the atmosphere may cause the pH to increase.
When the influent DIG concentration is less than several mg GIL, the pH tends
to decrease.
Results of the study suggest that dilute acidic waters facilitate the
release of elevated concentrations of trace metals from metal piping systems.
Passivation films of most significance include GU2(OH)2 G03 and Gu(OH)2 for
copper, PbG03, Pb3(OH)2(G03)2 or Pb(OH)2 for lead and Zn5(OH)6(G03)2 for zinc.
Because of the pH and inorganic carbon-dependent solubility of these minerals,
metal corrosion can generally be mitigated by increases in pH and dissolved
inorganic carbon concentrations. However, elevated inorganic carbon concentrations
coupled with high pH values can facilitate the solubilization of trace metals
through the formation of soluble metal carbonate complexes. This problem
is most significant for lead, as copper and zinc do not form strong aqueous
complexes with carbonate.
Laboratory pipe section experiments using copper pipe with lead-tin solder
indicate that limestone contactor treatment reduces copper, and to a smaller
extent, lead leaching. Theoretical thermodynamic calculations were consistent
with measured copper concentrations in the neutral pH (pH 6.5 to 7.5) region.
However, copper concentrations in acidic waters (pH i 6.0) were substantially
undersaturated with respect to theoretical metal solubility. Lead derived
from lead-tin solder in pipe section experiments was highly undersaturated
with respect to the solubility of lead passivation films.
Trace metal field results were generally consistent with laboratory obser-
vations. Spring and lake waters with and without limestone contactor treatment
were corrosive. Elevated metal concentrations were observed in first-flush
tapwater from both treated and untreated cottages. Running tapwater (3 minutes)
significantly reduced copper, lead, and zinc concentrations. Although treated
waters were generally corrosive, trace metal concentrations were significantly
reduced in both treated spring and lake water, relative to untreated water.
For example, first-flush copper and lead concentrations in cottage tapwater
receiving untreated spring water were 1.9 + 0.31 mg GulL and 0.0046 + 0.004
pblL, respectively. While treated spring ;ater at Bay Side cottage ~ontained
copper concentrations of 0.030 + 0.037 mg CulL and lead concentrations of
0.0084 + 0.0084 mg Pb/L. Likewise, CaG03 treatment of acidic lakewater at
Bayside cottage significantly reduced copper concentrations in first-flush
tapwater from 1.9 + 0.35 mg GulL to 0.54 + 0.30 mg GulL and reduced lead concen-
trations from 0.033+ 0.009 mg PblL to 0.015 ~ 0.014 mg Pb/L. Limestone treat-
ment greatly reduced the probability of metal concentrations exceeding the
secondary MGL of 1.0 mg GulL from greater than 75% to less than 15%. The
probability of consuming elevated lead concentrations in first-flush tapwater
was also reduced by GaG03 treatment.
Measured trace metal concentrations from first-flush tapwater were compared
with theoretical calculations from the chemical equilibrium model. Generally
untreated lakewater was highly acidic (pH 4.6), and measured copper concentra-
tions were highly undersaturated with respect to the theoretical solubility
of GU2(OH)2G03. However, following treatment, measured copper values
were in close agreement to thermodynamic predictions. Concentrations of lead
largely derived from lead-tin solder were highly undersaturated with respect
to the solubility of lead passivation films.
4
19. SECTION 3
RECOMMENDATIONS
The results of this study suggest that as calcium carbonate is dissolved
from the limestone particle matrix a layer of residue forms. It appears that
transport across this layer eventually limits the overall rate of dissolution.
This has important implications for the design of a contactor for long term
use. In this study there was limited evidence that the performance of a contac-
tor operated for two years in the field was influenced by the formation of
a residue layer.
It seems reasonable to assume that the rate of build-up of a residue
layer will be a function of the level of insoluble impurities in the limestone.
Additional research is needed to determine this relationship. Long-term exper-
iments should be conducted using contactor columns filled with limestones
of varying purity. The rotating disk apparatus has been used to effectively
study the kinetics of calcite dissolution and should be coniidered for use
in measuring the effect of limestone purity on the rate of dissolution. Until
the significance of the residue layer has been determined the results of this
study should be used with an awareness that limestone purity may be an important
variable.
5
20. SECTION 4
LITERATURE REVIEW
INTRODUCTION
This review of the literature is divided into three parts. In the first
section the characteristics of limestone are discussed. Limestone is, in
most parts of the country, a readily available and inexpensive source of
CaC0
3
. However because it is a natural material, its physical and chemical
characteristics are variable and this variability may affect its use as a
neutralizing substance.
The engineering design of a limestone contactor requires an understanding
of the kinetics of the neutralization (CaC0
3
dissolution) reaction. This
topic is covered in the second part of the literature review.
In the third part of the literature review the effect of water chemistry
on the release of corrosion by-products such as lead from lead-tin solder
and copper from copper pipes is discussed.
LIMESTONE PROPERTIES
Limestone is a general term used to describe sedimentary rock composed
primarily of calcium carbonate or combinations of calcium and magnesium carbon-
ate with varying amounts of impurities, the most common of which are silica
and alumina. There are numerous forms and types of limestone, varying in
chemical composition, mineralogy, crystallinity, color, texture and hardness.
Next to sand and gravel, limestone, including all of its carbonate forms,
is the second greatest tonnage material produced in the United States.
The two most fundamental types of limestone are high calcium and dolomitic
limestone. Pure high calcium limestone is 100 percent calcium carbonate
(calcite or aragonite). Pure dolomite is 54.3% CaC0
3
and 45.7% MgC0
3
. High-
quality, high calcium limestone is 97-99% CaC0
3
. (54-56% CaO). Chemical
analyses for a number of U.S. limestones are summarized in Table 1.
High calcium limestone was used exclusively in this study. Since there
is considerable evidence to suggest that the dissolution rate of dolomitic
limestone is substantially less than high calcium limestone (Pearson and
McDonnell 1975a, 1975b) the results of this study should therefore, only
6
22. be applied to the use of high calcium stone. Active sources (quarries and
mines) of high calcium limestone are present in essentially every state (See
Figure 1).
Care must be taken in selecting a high calcium stone for use in a lime-
stone contactor. Some states have either high calcium or dolomitic or abundant
quantities of both types. The distribution of these materials is however
without a predictable pattern, in some cases they occur in separate broad
expanses, while in other cases both types may be present in close proximity,
for example, on opposite sides of a quarry.
Limestone may contain a number of impurities. Clay, silt and sand (or
other forms of silica) may have become incorporated in the stone when it
was first deposited or material may have collected later in crevices and
between strata. These mineral contaminants are the sources of the major
impurities, silica and alumina. Other impurities, in a rough order of relative
amounts are iron, phosphorus and sulfur. Trace substances such as manganese,
copper, titanium, sodium, potassium, fluorine, arsenic and strontium may
be present.
Murray et al. (1954) analyzed 45 different high calcium limestones from
the United States. The principal impurities are listed in Table 2. All
stone analyzed contained measurable amounts of silica, alumina and magnesium
oxide. Potassium, sodium and sulfur were present in some samples.
Murray et al. (1954) also examined 25 high calcium limestones spectro-
graphically for 25 metallic elements. The findings obtained for elements
other than calcium, magnesium, silicon and iron are listed in Table 3. Alumi-
num, barium, manganese , phosphorus , potassium, sodium, strontium and tin were
detected in all 25 samples. Titanium, zinc and chromium were detected in
20 of the samples. The metals present at a concentration greater than 1000 ppm
in at least one sample are aluminum, manganese, potassium, sodium, strontium,
titanium and zinc.
KINETICS OF LIMESTONE DISSOLUTION
The engineering design of a limestone contactor requires an understanding
of the kinetics of the CaC0
3
dissolution process and the effect of this dis-
solution on the chemistry of the bulk solution. The overall neutralization/
dissolution reaction is given by
8
23. legend
~ Chalk deposits
c=:J limutollc deposits
".t.····
Figure 1. Locations of major chalk and limestone deposits in the continental
United States.
24. Table 2 Major Impurities in High Calcium Limestone
(45 U.S. Samples) (from Murray et al., 1954)
Si0
2
0.10 - 2.89%
A1
2
0
3
0.13 - 0.92%
K
2
0 0.00 - 0.21%
Na
2
0 0.00 - 0.16%
S03 0.00 - 0.56%
MgO 0.12 - 3.11%
10
25. Table 3 Minor Impurities in High Calcium Limestone
(25 u.s. Samples) (from Murray et al., 1954)
Number of Samples With
Element Detectable Amount
Al 25
Ba 25
B 3*
Cr 20
Co 9
Pb 15*
Mn 25
Hg 4
Mo 8*
Ni 22
P 25
K 25
Ru 17*
Ag 13*
Na 25
Sr 25
Sn 25*
Ti 23
Zn 23
Maximum
Amount
0.35-0.60%
(5 samples)
not given
10 ppm+
C3 samples)
10 ppm+
(2 samples
0.1%+
(1 sample)
0.01%
(1 sample)
0.001-0.01%
(2 samples)
0.2%
C1 sample)
0.1%+
C3 samples)
0.01-0.1%
(all samples)
0.1%+
(1 sample)
0.1%+
C1 sample)
*trace amounts only
11
26. + ++CaC0
3
+ H ~ Ca + DIC
*where, DIC, the dissolved inorganic carbon, includes the species, H
2
C0
3
(C0
2
+ H
2
C0
3
), HC0
3
and C0
3
.
The dissolution reaction at the solid surface is influenced by the trans-
fer of the reactants (e.g., hydrogen ion) to the interface and the products
(calcium and DIC species) away from it. In addition, if the objective is
to understand the effect of dissolution on the chemistry of the bulk solution,
the rates of homogeneous reactions involving dissolution products in the
solution and, if a gas phase is present, the rate of transport of inorganic
carbon to or from the aqueous phase must be considered.
A schematic diagram illustrating the overall dissolution process in
a system which includes a CaC0
3
solid phase, the aqueous solution and a gas
phase which may contain carbon dioxide or may act as an infinite sink for
CO
2
released from the aqueous phase is presented in Figure 2. The rate of
change in bulk solution chemistry is affected by one or more of the reactions
shown.
Reaction A in Figure 2 represents the decomposition of the solid phase,
i.e., the net release of calcium and carbonate to the solution. This step
might be a combination of reactant adsorption (e.g., H+ or H
2
0) on the CaC0
3
surface, chemical reaction with the surface and desorption of reaction products.
The rate of decomposition of the surface (and the rate of change in
the bulk solution chemistry) may be controlled by the transport of hydrogen
ions to the surface (reaction C) or the transport of reaction products (Ca++,
C0
3
=, HC0
3
-, and H
2
C0
3
) away from the surface (reaction B). If a gas phase
is present, as shown in Figure 2, the bulk solution chemistry may be affected
by the transport of reaction products or gas phase components to or from
the bulk solution (reactions 0 and E). It is also possible, as indicated
by reaction E, that a homogeneous solution phase reaction such as the proton-
ation of the bicarbonate ion or the dehydration of carbon dioxide may effect
the time varying chemical characteristics of the bulk solution and the solution
within the boundary layers.
12
27. ®--t-I
I
I
I
---"---....,.. 1.- Gas -J
1 Phose -I
LIQUID
PHASE
CDH++ CO=: - HCO;
H+ + HCO-. --loo. Hz CO, --H-C-O~·
J I
DIFFUSION BOUNDARY
-- LAYERS --1
'I~
I
I
I Co!""pldeteblYUlk
H+ mlxe
~ solution
I~
I
ISolid IPhose -.....r - - - -
......
w
Figure 2. Schematic representation of the calcium carbonate dissolution
process.
28. A significant amount of research has been conducted on mineral dissolution
kinetics. The dissolution of calcite and limestone has been investigated
for applications such as the formation of antacids (Lund et al., 1975), the
neutralization of pickling acids (Eden and Truesdale, 1950; Gehm, 1944; Hoak
et al., 1944, 1945, 1947; Reidl, 1947; Galloway and Colville, 1970), the
neutralization of acid mine drainage (Pearson and McDonnell, 1975a, 1975b;
Jarret, 1966, Mihok et al., 1968; Vatanatham, 1975), the effect of CaC0
3
sediments on the pH of sea water (Morse, 1978; Morse, 1974; Morse and Berner,
1972; Berner and Morse, 1974), the neutralization of CO
2
-saturated waters
(Frear and Johnson, 1929; Erga and Terjesen, 1956; Terjesen et al., 1961;
Plummer et al., 1978; Plummer and Wigley, 1976), the neutralization of dilute
acidic ground and surface waters (Bjerle and Rochelle, 1982, Vaillancourt,
1981; Sverdrup and Bjerle, 1982; Driscoll et al., 1982; Haddad, 1983), the
neutralization of nitric acid solutions (Wentzler, 1971), sulfuric acid solu-
tions (Vatanatham, 1975) and hydrochoric acid solutions (Lund et al., 1975;
Tominaga, 1939).
It has been recognized for a long time that mass transport to or from
the dissolving CaC03 surface has at least some effect on the kinetics of
the process and therefore most recent, investigators have been careful to
control (to some extent) the hydrodynamic conditions in their experimental
reactor. A number of experimentors controlled the mixing intensity in mechan-
ically agitated batch reactors containing suspensions of powdered calcite
(Erga and Terjesen, 1956; Terjesen et al., 1961; Berner and Morse, 1974;
Sjoberg, 1976; Sverdrup and Bjerle, 1982; Rickard and Sjoberg, 1983). Others
have mounted rotating cylinders (King and Liu, 1933) or rotating disks (Wentzler,
1972; Lund et al., 1975; Rickard and Sjoberg, 1983; Sjoberg and Rickard,
1983) made of CaC0
3
in batch reactors. A few investigators have studied
the dissolution reaction using flow-through packed-bed reactors (Pearson
and KcDonnell, 1975a, 1975b; Vaillancourt, 1981; Haddad, 1983). In one case
(Weyl, 1958) a fluid jet was directed against a calcite crystal.
In the cases where a batch reactor is used the rate of CaC0
3
dissolution
is usually monitored by either a "pH stat" or "free drift" technique. The
pH stat technique involves maintaining the bulk solution at a set-point pH
by the controlled addition of mineral acid. The rate of CaC0
3
dissolution
14
29. is then related to the rate of hydrogen ion addition. The free drift technique
involves measuring the pH and/or calcium ion concentration as a function
of time as the suspended particles, rotating disk, etc. dissolve in the batch
reactor.
Most batch reactor studies have been conducted using an "open" system,
where the solution is in contact with a gas phase with a carbon dioxide partial
pressure ranging from 0 to 100%. The packed column is usually operated as
a closed system; inorganic carbon does not enter or leave the solution during
the course of the dissolution reaction. The closed system is less complicated
than the open system to model because, as noted in regard to Figure 2, the
open system model may require an understanding of the rates of transport
and reaction at the gas-solution interface (reactions D and E in Figure 2).
There is no gas/liquid interface in an ideal closed system.
A review of the literature suggests that many investigators have recog-
nized the complexity of the CaC0
3
dissolution process. Most have attempted
to simplify the modeling of this process by delineating the rate limiting
steps. It is, however, apparent that in making assumptions and interpre-
tations of experimental data the various investigators have often been limited
by the type of apparatus used and the experimental conditions. Consequently,
it is difficult to generalize results.
Various processes have been proposed to regulate the dissolution of CaC03:
The diffusion of hydrogen ion to the solid surface (King and Liu,
1933, Tominaga et a1., 1939, Kaye, 1957, Gortikova and Panteeva,
1937, Neirode and Williams, 1971, Berner and Morse, 1974, Wentz1er,
1972, Vaillancourt, 1981, Haddad, 1983).
A heterogeneous "dissolution" reaction at the solid surface (Erga
and Terjesen, 1956, Terjesen et a1., 1961, Plummer and Wigley, 1976,
Plummer et a1., 1978, Berner and Morse, 1974, Sjoberg, 1976).
Mixed kinetics in which transport and a heterogeneous reaction at
the surface acting in series are important (Pearson and Mcdonnell,
1975, Rickard and Sjoberg, 1983, Lund et a1., 1975, Berner and Morse,
1974, Plummer et a1., 1978, 1976).
The diffusion of reaction by-products, e.g. ca++, away from the solid
surface (Wey1, 1958, Bjer1e and Rochee1e, 1982, Berner and Morse,
1974, Haddad, 1983).
15
30. The dissolution and/or exso1ution of carbon dioxide in or from the
solution (Vo1pice11i et a1., 1981).
Recent papers by Sjoberg and Rickard (Sjoberg and Rickard, 1983; Sjoberg
and Rickard, 1984a; Sjoberg and Rickard, 1984b, Rickard and Sjoberg, 1983)
provide a detailed analysis of the dissolution process. Sjoberg and Rickard
used a rotating-disk/batch reactor apparatus and determined the initial rate
of calcite dissolution using the pH-stat technique.
Rickard and Sjoberg (1983) concluded that in neutral to alkaline solutions
at ambient temperature the dissolution of calcite was controlled by a mass
transfer resistance and a surface reaction acting in series. In this scheme
the observed rate of dissolution is a function of a transport rate, RL , where
and a first order surface reaction rate, Rc ' where,
(2)
R = K (C
c c eq
C )
s
(3)
and K are the mass transfer and surface reaction rate constants and C ,
c s
C
b
and C are the molar calcium concentrations at the calcite surface, in
eq
the bulk solution and at equilibrium, respectively. The equations for ~
and R can be combined by assuming a steady state condition near the inter-
c
face. The result is an expression for the overall rate of dissolution, R,
Le. ,
R = K (C - C
b
)
o eq
where the overall rate constant, Ko ' is given by
(4)
K =o
(5)
According to Eq. (5), when K
c
» ~ the dissolution rate is controlled by
mass transfer and when ~ » K
c
the surface reaction controls.
16
31. Rickard and Sjoberg (1983) concluded that at low pH the initial rate
of calcite dissolution was controlled entirely by the rate of mass transfer
of the hydrogen ion to the calcite surface. They determined that for pH < 4,
where [H+]b is the bulk solution hydrogen ion concentration and ~ is an
"apparent" mass transfer coefficient for the hydrogen ion. It is not clear
exactly why Rickard and Sjoberg found it necessary to change from calcium
ion transport control at neutral pH values and above to hydrogen ion transport
at low pH. In any case, their assumptions and rate expression for low pH,
Eq. (6), are generally consistent with low pH rate equations presented by
a number of other investigators (Miadokova and Bednarova ; Lund et al., 1975;
Berner and Morse, 1974; Plummer et al., 1975a; Nierode and Williams, 1971).
A plot from Sjoberg and Rickard (1984a) of the initial rate of calcite
dissolution as a function of the bulk solution pH for a batch reactor/rotating
disk/pH-stat system operating at 25°C and a disk rotational speed of 1000 rpm
is presented in Figure 3. Note, the initial rate of dissolution was highest
at low bulk solution pH. The rate decreased with increasing pH and approached
a minimum (asymptotically) at pH > 5. Under the conditions used to obtain
the data of Figure 3 the minimum initial rate of dissolution was approximately
6.3 x 10-
10
moles calcium cm-
2
s-
1
. Sjoberg and Richard (1984a)concluded
that the magnitude of this minimum rate was determined by both the mass transfer
and surface reaction rate constants (Eq. 5).
Plummer et al. (1978) obtained the initial calcite dissolution rate
as a function of the bulk solution pH. The results are presented in Figure
4. The pH-stat technique was used in conjunction with a mechanically agitated
batch reactor containing crushed calcite (Iceland Spar). The CO
2
partial
pressure was a controlled parameter and the temperature was 25°C.
The results plotted in Figure 4 are similar to those obtained by Sjoberg
and Rickard, (1984a). As the bulk solution pH increased above pH = 4 the
initial rate of dissolution asymptomatically approached a minimum value.
-10 -2 -1
The minimum rate (for pC0
2
= 0.00) was approximately 3 x 10 moles cm s .
17
33. -6
-- 25°CI
U)
N
I
E -7
u
U)
cu
(5
E
-8-cu
-0
~
c: A.9 -9
-::J
8(5
CU)
peozU)
"0
A 0.97-10.52
8 0.30-c:
C 0.00
-0'
0
-II
I I I
2 3 4 5 6 7
pH
Figure 4. Inicial rate of calcite dissolution as a funccion of bulk solution
pH and parcial pressure of carbon dioxide (Plummer et al., 1975),
19
34. Sjoberg and Rickard (1984b) plotted the initial rate of dissolution
~
as a function of the square root of the disk rotational velocity, w2
, to
At a bulk solution pH of
~
is linear only at low values of w2
8.4 the relationship between
~
As w2
increased, the surface reaction apparently became an increasingly impor-
illustrate the effect of the mass transfer coefficient, ~' on the dissolution
rate. An example for carrara marble, a bulk solution pH of 8.4, a background
electrolyte of 0.7 M KC1 and temperatures of 1 and 25°C is illustrated in
~
Figure 5. In the rotating disk system ~ was directly proportional to w2
and, therefore, if mass transfer was the controlling step, the dissolution
~
rate, R, would be directly proportional to w2
•
~
Rand w 2
tant factor in determining the initial rate of dissolution.
For the results obtained at 25°C (Figure 5)) the relationship between
~ ~ -1
Rand w was linear and mass transfer apparently controlled up to w2
= 5 s
where R was approximately equal to 7 x 10-
10
moles cm
2
-s-
1
. At 1°C the effect
of the surface reaction on R seemed to be even greater than at 25°C. The
upper limit for mass transfer control was R ~ 1 x 10-
10
moles cm-
2
s-
1
at
~ -1
w2 = 2 s
It will be indicated in a subsequent section that in packed bed limestone
contactors operated under the conditions used in this study, the maximum
rate of dissolution for bulk solution pH values greater than 4 is generally
-10 -2 -1
less than 1 x 10 moles cm s . It therefore seems reasonable to assume
that, based on Sjoberg and Rickard's results (Figure 3)), the rate of transport
of calcium ion away from the interface controlled the dissolution rate through-
out the entire depth of the packed columns used in this study.
It has been shown that the presence of certain substances can reduce
the rate of calcite dissolution. This effect has been noted for ferric and
chromic ions, (King and Liu, 1933), copper (Erga and Terjesen, 1956), aluminum
(Vo1pice11i et a1., 1981), scandium (Nestaas and Terjesen, 1969), organic
matter, magnesium and orthophosphate (Morse 1974a, 1974b; Berner and Morse,
1974). The effect of contaminants on the rate of dissolution can be significant
at very low contaminant concentrations. Nestaas and Terjesen (1969) concluded
that metal ions adsorb at active spots or kinks on the surface of the dissolving
crystal, blocking the dissolution process at that location. At the present
time there are no methods available for quantifying the effect of contaminants
20
35. 20
5
15
c:
c
)(
o I I
o 10 20
w '12t 5-' /2)
~ 10c
a::
c:
o
-
-
-
Q
o
-I
Figure 5. Initial rate of calci:e dissolution as a func:ion of the square
root of the rotating disk rotational speed. Bulk solution pH was
constant at 8.4 and the system was closed to atmospheric CO
2(Sjoberg and Rickard, 1984b).
21
36. on the dissolution rate, particularly the dissolution rate of limestone.
Eventually, for example, relationships between the contaminant concentration
and K , the surface reaction constant, may be developed.
c
PACKED-BED REACTORS
Only a few studies have involved attempts to model the kinetics of lime-
stone dissolution in continuous flow, packed-bed reactors (Pearson and McDon-
nell,l975a, 1975b; Barton and Vatanatham, 1976; and Vaillancourt, 1981).
Pearson and McDonnell (1975a, 1975b) studied the neutralization of acidic
drainage from coal mines. using packed columns and in-stream barriers of large
(6.4 to 10 cm. effective diameter) limestone particles. Their open-to-the-
atmosphere experiments were conducted at ambient temperature and in the pre-
sence and absence of dissolved metal ions.
Pearson and McDonnell (1975a) indicated that a rate equation based on
hydrogen ion transport coupled with a surface reaction can be used to describe
limestone dissolution kinetics. The proposed model is given by:
V
A
dC
o
dt
K C.
n
a 1
C.)
1
(7)
where VIA is the inverse of the interfacial area per unit volume of fluid
in the column, K is an overall rate constant, K is a surface reaction rate
a
constant, K
d
is the mass transfer coefficient, Co is the hydrogen ion con-
centration in the bulk solution, C. is the hydrogen ion concentration at
1
the limestone/water interface and n' and n are exponents.
Pearson and McDonnell (1975a, 1975b) did not use their experimental
data to test the proposed rate equation, Eq. 7, but instead developed an
empirical expression which related the rate of limestone dissolution to water
temperature, pH, solution ionic strength, the bicarbonate ion concentration
and the hydraulic shear stress. Their overall model included an expression
for predicting the rate of CO
2
exolution at the air/water interface above
the packed bed. The experimental conditions used by Pearson and McDonnell
(1975a) to develop their empirical equations are appropria~e for the treatment
22
37. of acidic drainage from coal mines but not the dilute acidic surface waters
used as potable supplies.
Two groups of investigators, Barton and Vatanatham (1976) and Vaillancourt
(1981) assumed that the rate of limestone dissolution in closed and open-to-
the atmosphere, packed-columns is controlled by the rate of hydrogen ion
transport from the bulk solution to the limestone surface. Vaillancourt
(1981) used the conventional relationship,
U dI +
: dx = -K a (~ - H:q ) (8 )
where U is the superficial velocity, E is the bed porosity, K is the mass
s
transfer coefficient for hydrogen ion, a is the surface area of limestone
per unit volume of interstitial water, x is distance in the axial direction,
a+ is the hydrogen ion concentration in the bulk solution and H+ is the
-1> eq
hydrogen ion concentration when the solution and limestone solid phase are
at equilibrium (under a closed-to-the-atmosphere condition). Vaillancourt
(1981) correlated experimentally determined mass transfer coefficients with
the limestone particle diameter, superficial velocity and fluid properties
using dimensionless parameters.
Unfortunately, Vaillancourt (1981) used very short packed-columns with
high Reynolds numbers in his experiments and did not consider the adverse
effect these conditions had on his assumption of plug flow. He also did
not consider the effect of raw water chemistry on the magnitude of H+ .
eq
A constant value was incorrectly used for all solutions studied.
Vatanatham (1975) and Barton and Vatanatham (1976) studied the kinetics
of limestone dissolution in acidic solutions using an open-to-the-atmosphere
batch reactor and a recycle-downflow, packed-bed reactor system. Several
models were tested including, zero order reaction controls, carbon dioxide
transport controls, surface reaction controls and hydrogen ion transport
controls. Barton and Vatanatham (1976) concluded that in the pH range of
2 to 6 hydrogen ion transport controls. They did not determine the rate
limitirrg step outside this range but assumed that the lack of agreement
between the experimental data and the hydrogen ion transport model was due
to experimental error or the increasing importance of other transport or
rate limiting mechanisms.
23
38. The kinetic equation used by Barton and Vatanatham (1976) for pH values
between 2 and 6 is given by,
(9)
where Wand Wo are the mols of CaC03 present at any time, t, and at t = 0,
M is the molecular weight of CaC03' Do is the initial diameter of the lime-
stone particles, P is the mass density of limestone, H+ is the hydrogen
eq +
ion concentration in the bulk solution at equilibrium and ~ is the hydro-
gen ion concentration in the bulk solution at any time. Eq. 9 is essentially
a first order (film) transport equation modified to incl~de the change in
interfacial area as the particles dissolve and decrease in size. Unfortunately
Barton and Vatanatham (1976) made an error in deriving Eq. 9. The number
six should appear in the numerator and not in the denominator and therefore
all their model calculated results were in error by a factor of 36.
METAL RELEASE FROM PIPES
There is considerable concern over the corrosion of water distribution
systems. Elevated corrosion rates may substantially reduce the service period
of piping systems resulting in increased operation and maintenance expenses
(Anderson and Berry, 1981). Metal release from water distribution systems
may also cause water supplies to exceed the U.S. Environmental Protection
Agency (U.S. EPA) Standards for maximum contaminant levels (MCL) or secondary
maximum contaminant levels (SMCL). Maximum contaminant levels (MCL) are
established for concentrations of compounds that may result in human health
problems, while SMCL are primarily established for esthetic criteria.
Metal release may occur from copper, galvanized steel, iron and lead
pipes, and from lead-tin solder coated on copper piping materials. Human
health concerns are largely associated with the leaching of lead from lead
pipe or lead-tin solder coated on copper pipe. The toxic effects of lead
are well established (NAS 1977; Waldbott, 1978). Lead is an active and
cumulative toxicant which alters neurological and metabolic functions. It
has been associated with hyperactivity, hypertension, mental retardation
and motor disfunctions (NAS 1977; Patterson and O'Brien, 1979). Several studies
24
39. have established a link between high concentrations of lead in drinking water,
and elevated concentrations of lead in blood and subsequent health problems
(Beeners et a1, 1976; Campbell et a1., 1977; Cameron and Wunderlich, 1976).
Because of human health concerns, the U.S. EPA established a MCL for lead
of 0.05 mg Pb· L-1.
Although copper is an essential trace metal, at elevated concentrations
it has been implicated as a gastrointestinal poison (Dou11 et a1., 1980).
The U.S. EPA Secondary MCL for copper is 1.0 mg Cu·L-1. This standard has
largely been established for esthetic considerations, such as the taste and
staining characteristics associated with elevated concentrations.
Elevated corrosion rates have been reported for a number of regions
(Hudson and Gi1creas, 1976; Danse1, 1976; Patterson and O'Brien, 1979; Kara-
lekas, et a1., 1983; Maessen et a1., 1985). Of particular concern are soft-
water supplies such as in the northeastern, southeastern and northwestern
United States (Patterson and O'Brien, 1979).
Corrosion is a deterioration of a metal which usually occurs as a result
of an electrochemical reaction. For corrosion to occur, an electrochemical
cell must be established including an anode, a cathode, an electrolyte solu-
tion, and an electrical (metal) connection between the anode and cathode.
As an electrochemical reaction proceeds oxidation occurs at the anode releasing
electrons which are transmitted through the electrical connection to the
cathode. These electrons are accepted at the cathode through a reduction
reaction. The tendency for a metal to oxidize (and subsequently exhibit
corrosion) is measured through its oxidation potential (EO). Some values
of oxidation potential for some relevant reactions are summarized in Table
4. Note the reaction with the highest oxidation potential will have the
greatest tendency to undergo oxidation in an electrochemical reaction. For
example, if copper and lead form an electrochemical cell at a copper-lead
solder joint, lead would be oxidized (corroded) while copper would be reduced
by virtue of their values of oxidation potential.
There are two conditions by which corrosion may be restricted. First,
the electrochemical (redox) potential and pH may not thermodynamically favor
oxidation. This condition is termed immunity. The second condition involves
the formation of a sparingly soluble solid phase with an oxidation by-product,
25
41. such as an oxide, hydroxide or salt. If this solid adheres as a film on
the metal surface, then it may mitigate corrosion. This process is referred
to as passivation. The effectiveness of passivation films is highly variable,
and depends on the affinity of the solid phase for the metal and whether
coverage is complete or partial.
Hilburn (1983) developed two conceptual models for uniform corrosion.
The direct-dissolution model is applicable when the metal is oxidized and
directly released to solution. Under these conditions the corrosion rate
is controlled by either the kinetics of the reaction, or the transport of
reactants and products to and from the metal surface through solution. The
dissolution-and-film-growth-model applies to metals which form a passivation
film. The overall corrosion rate may be regulated by reaction kinetics,
transport through the passivation film or solution transport, whichever is
the rate-limiting process.
Corrosion is an extremely complicated process. For example factors
such as pipe age, pipe length, impurities in the pipe material, interval
of solder joints, temperature, turbulence and water chemistry can all contri-
bute to corrosion (Herrera et al., 1982; Hilburn, 1983, 1983; Schock, 1984;
Maesson et al., 1985; Treweek et al., 1985). A~ a result, it is often diffi-
cult to evaluate factors regulating metal release from piping systems. Maessen
et al. (1984) studied metal mobilization in home well-water systems in Nova
Scotia. They assessed bedrock type (e.g. granite, limestone), proximity
to the coast, well-type (e.g. dug, drilled) and depth, plumbing data (e.g.
length of piping, age of piping, type of piping), as well as solution chemistry
on the extent of metal release from water distribution systems. They found
significant leaching of copper, lead and zinc occurred in some systems.
Concentrations of metals were elevated in water that had been in contact
with piping material for a prolonged periods of time (e.g. overnight, standing)
relative to running water samples. Although a wide range of bedrock, water
chemistry and plumbing conditions were evaluated, no factor could be found
to systematically predict the extent of metal leaching. Moreover, indexes
commonly used to assess the corrosive tendency of a water (Langelier, Ryznar,
Aggressiveness indexes, and the ratio of SO~ and Cl-l to alkalinity) and
pH were poor predictors of metal release.
27
42. Meranger et al. (1983) evaluated metal leaching from cottage piping
systems that contacted acidic lakewater in northern Ontario. They found ele-
vated leaching of cadmium, copper, lead and zinc. Mobilization rates were
greatest during the first two hours of contact time with the pipe, but concen-
trations continued to increase for a period of up to 10 days. Highest metal
concentrations were again obtained with the first sample collected and concen-
trations decreased by up to 97% in the third liter of water collected. Al-
though the authors were concerned that acidic deposition to the region resulted
in surface water acidification and enhanced the corrosivity of lake water,
because these wate'rs are naturally soft and corrosive this effect is not
clear.
Although it is often difficult to interpret field data because of all
the physical and chemical factors which contribute to corrosion, considerable
progress has been made in recent years through controlled laboratory experi-
ments in evaluating the chemistry of passivation films and processes regulating
the formation of films. Housing and building systems frequently have sections
of pipe that remain stagnant for prolonged periods of time. Initially metal
release is regulated by mass-transport reactions, however over time concentra-
tions can approach and reach saturation with respect to mineral phase solubi-
lity (Schock, 1984). Therefore, solubility calculations may be used as worst-
case assessment of metal leaching.
In recent years thermodynamic calculations have been used as a tool
to assess trace metal chemistry and the stability of passivation films within
water distribution systems. Several types of passivation films may form
on metal pipe depending on the chemical characteristics of the water supply
(Table 5). Patterson and O'Brien (1979) discussed the role of inorganic
carbon in regulating the release of lead from lead pipe. Using thermodynamic
calculations, they found that the solubility of lead decreases with increasing
inorganic carbon concentrations. Moreover, they suggested that elevated
inorganic carbon concentrations result in the formation of an insoluble lead
carbonate passivation film. This film not only reduces lead solubility but
also strongly adheres to the pipe surface, limiting the release of particulate
lead to water. Their calculations suggest that reduced inorganic carbon
28
43. TABLE 5
Passivation film minerals that may be important in
regulating metal solubility in water distribution systems
COMPOUND
Lead Pipe
Lead hydroxide
Lead carbonate (cerussite)
Basic lead carbonate (hydrocerussite)
Lead Sulfate
Copper Pipe
Copper hydroxide
Copper carbonate
Basic copper carbonate (malachite)
Basic copper carbonate (azurite)
Copper sulfate
Basic copper sulfate(brochantite)
Basic copper chloride(atacamite)
Galvanized Steel Pipe
Zinc hydroxide
Zinc carbonate
Basic zinc carbonate(hydrozincite)
Zinc sulfate
Basic zinc silicate(hemimorphite)
29
STOICHIOMETRY
Pb(OH)2
Pb C03
Pb3(C03)2(OH)2
Pb S04
Cu(OH)2
CuC03
CU2(OH)2C03
CU3(OH)2(C03)2
CuS04
CU4(OH)6S04
CU2(OH)2Cl
Zn(OH)2
ZnC03
ZnS(OH)6(C03)2
ZnS04
Zn4 Si2 ~7(OH)2 . H20
44. concentrations facilitate the formation of a lead hydroxide film which does
not adhere strongly to the pipe surface and periodically is released to the
water supply as particulate lead.
In a series of papers, Schock (1980), Schock and Gardels (1983), and
Schock (1984) greatly elaborate on the role of inorganic carbon in controlling
trace metal concentrations in water distribution systems. Schock (1980)
suggested that the thermodynamic analysis by Patterson and O'Brien (1979)
was incorrect due to a failure to consider soluble lead-carbonate complexes.
Lead forms strong aqueous complexes with carbonate and therefore elevated
dissolved inorganic carbon concentrations can significantly enhance aqueous
lead concentrations. As a result, the contention by Patterson and O'Brien
(1979) that increases in dissolved inorganic carbon concentration reduce
aqueous lead concentrations is incorrect and may suggest counter-productive
water treatment strategies.
Due to the relatively high solubility of lead at low pH and the potential
to form lead-carbonate complexes at higher pH values the conditions under
which the theoretical solubility of lead is below the U.S. EPA MCL of 0.05
mg Pb'L-l are limited to relatively high pH values (8.0 - 10) and low dissolved
inorganic carbon concentrations. Schock (1984) indicated that under these
conditions the concentrations of lead would be generally regulated by the
solubility of hydrocerussite (Pb3(C03)2(OH2), a tightly adhering passivation
film. These conditions would limit the release of particulate lead to water
supplies.
In addition to lead solubility, Schock (1984) evaluated the theoretical
solubility of passivation films from copper and galvanized steel pipe. Because
both zinc and copper are hydrolyzing metals and form soluble complexes with
carbonate, it is reasonable to expect their solubility to mimic lead. Copper
exhibits a considerable variation in solubility over a range of pH and dis-
solved inorganic carbon concentrations. Generally the solubility of copper
in the pH range 7 to 11 is well below the U.S. EPA secondary MCL of 1 mg
Cu·L-l. It is, therefore not as difficult to meet the U.S. EPA secondary
MCL for copper as it is to meet the MCL for lead. Like lead, the minimum
theoretical solubility occurs at elevated pH values (9-10) and the solubility
is enhanced at high pH values due to the formation of soluble carbonate com-
30
45. plexes. Schock (1984) indicates that in the pH range of 9-10 the theoretical
solubility of copper is regulated by tenorite (CuD).
The theoretical solubility of zinc has a minimum value near pH 9 and
in this pH range is thought to be regulated by the solubility of hydrozincite
(ZnS(C03)2(OH)6) (Schock 1984). Hydrozincite is not a strongly adhering
passivation film. Therefore, zinc concentrations in water supplies using
galvanized steel pipe may be significantly enhanced by the release of particu-
late Zn. Unlike lead and to a lesser extent copper, zinc does not form strong
soluble complexes with carbonate. Therefore, pH is the major factor regulating
variations in the solubility of dissolved zinc from galvanized steel pipe.
However within the pH range 7 to 11, the theoretical solubility of dissolved
zinc is well below the USEPA SMCL of 5 mg Zn·L-l (Schock 1984).
While thermodynamic calculations represent an important tool to assess
trace metal solubility and the stability of passivation films, they clearly
have many limitations. As indicated previously, thermodynamic calculations
should be viewed as an upper-limit of dissolved metal concentrations. Under
many conditions, particularly when water has been in contact with piping
material for a short period of time, the release of corrosion by-products
will be controlled by mass-transport reactions. Physical factors such as
the poor adherence of passivation films to piping material and/or erosion
of these films due to turbulance can significantly increase metal concentra-
tions through the release of particulate metal. Moreover, our understanding
of the temperature dependence (standard enthalpy values) of metal complexation
and solubility reactions is limited. So it is difficult to make thermodynamic
solubility calculations at temperatures other than 25°C with confidence.
Finally, while thermodynamic calculations provide theoretical values of dis-
solved metal concentration which may be useful in evaluating compliance with
U.S. EPA drinking water standards, no information is obtained on the destruc-
tion of the metal pipe. While an insoluble passivation film may restrict
the release of metal to solution, if it is not impervious to molecular oxygen
then oxidation may continue and substantially diminish the lifetime of the
metallic piping material.
31
46. SECTION 5
METHODS AND MATERIALS
APPARATUSES - LABORATORY AND FIELD CONTACTOR UNITS
Laboratory Contactors
Four downflow, packed-column contactors were used in the laboratory
study. Each column contained a different limestone particle size. The column
diameters were chosen to yield a column-to-particle diameter ratio of at
least ten to minimize the effect of the higher porosity at the wall on the
flow through the bed The four columns and the water feed system are illus-
trated in Figure 6.
Column A in Figure 6 was constructed of clear acrylic plastic and con-
tained limestone particles with a 0.96 cm mean diameter. The column inside
diameter was 15.2 cm and the length was 3.5 m. Columns B, C and D were con-
structed of polyvinyl chloride pipe. Columns Band C both had inside diameters
of 15.2 cm and Column D had an inside diameter of 38.1 cm. The stone sizes
(mean diameter) in these columns were 0.54 cm, 1.5 cm, and 3.2 cm for Columns
B, C, and D respectively. All three columns were 2.1 m. long.,
All four columns in Figure 6 were equipped with through-the-wall sampling
tubes. The tubes were spaced in the axial direction at 15.2 cm intervals
at the influent end and at 30.4 cm intervals over the remaining portion of
each column.
Each sampling tube (0.6 cm diameter acrylic plastic) extended to the
center of the column. Five 0.25 cm diameter holes were drilled in the upper
part of each tube. Each tube was cemented to a plastic adaptor which was
threaded into the column wall. A short length of plastic tubing with a hose
clamp was attached to the plastic adaptor. A drawing of a typical sampling
tube is included within Figure 6.
The water supply and flow control system used with the four laboratory
columns is shown in Figure 6. The raw water was pumped from a 200 L plastic
tank to a constant head tank located above Column A. Overflow from the con-
stant head tank returned to the plastic tank. Flow control for each column
effluent was accomplished using a flowmeter with a micrometer controlled
32
47. Figure 6. Laboratory columns with water supply and flow cont=ol system.
Insert is a drawing of a typical through-the-wall sampli~g tube.
33
48. valve assembly. From the flowmeter the water discharged to a small open
chamber and from this unit to a floor drain. The flowmeter calibration was
checked frequently using a volumetric cylinder and a stopwatch.
The limestone was washed with tap water and placed in each column layer
by-layer to facilitate installation of the sampling tubes and to minimize
later compaction of the bed. Gentle tapping and shaking of the column were
used to consolidate the bed as it was installed.
Field Contactors
Three devices were studied in the field investigation. These included
a large baffled-box device which was submerged in a mountainside spring at
the head end of a rural resort water supply system and two small column-type
units which were used for individual resort cabins. One of these small units
was obtained from Culligan, Inc.*
The baffled-box contactor is described in Figure 7. The unit was con-
structed several years ago at Syracuse University using 1.9 cm thick marine-
grade plywood covered with 2 mm thick plexig1ass sheets. The overall dimen-
sions are 0.6 x 0.6 x 1.2 m. Sampling cells which also serve as baffles
to direct the flow along the bottom of the chambers were constructed of 0.6
and 1.3 cm plexiglass (each is 12.7 cm x 12.7 cm x 0.6 m). The sides and
lid were braced with fiberglass resin coated aluminum angles. Fiberglass
resin was also used to coat small areas of the contactor not covered by plexi-
glass sheets. The unit contained approximately 479 Kg. of 0.96 cm mean dia-
meter limestone particles and the length of the flow path through the limestone
was approximately 354 cm. The cross-sectional area perpendicular to the
direction of flow was approximately 915 cm2 .
The two smaller column type units used in the field study are shown
in Figure 8. Column 1 had an inside diameter of 20.2 cm and an overall length
of 130 cm. Flow entered this column at the top, passed down through the
bed and exited through a cylindrical plastic strainer connected to a 2 cm,
inside diameter plastic pipe which passed up through the center of the bed.
Column 1 was constructed of wound fiberglass and contained 60 Kg of crushed
limestone (0.96 mean diameter particle size). The overall depth of limestone
was 122 cm. Column 1 was a slightly modified version of a container used
in ion exchange systems.
*Mention of trade names or commercial products does not constitute endorsement
or recommendation for use.
34
49. Plexigloss
sampling Cell
lid o{ the
conlactor--
Inlet of the
contactDr~
-"2~£WCX2D IOOGL
UMESTQNE CONTACTOR
Figure 7. Baffled-box contactor used in the field study. Entire unit was
submerged in a mountain-side spring.
50. Cullneu
Medium
Galvanized
Steel with
Heat Treated
Resin Coo ting
r;:::==:::::;-~==---
valves for
Backwashirq medium
I 9"oft _I
I,
~I
1
.1
I
/5" ,I
32,"
1.5"0 Section
of PVC Pipe with
/14"0 holes
Wourxi
Fiberglass
Limestone
Medium
i 'f> pvC pipe
-inlet
•• •
•
a"
I" -I
outlet
4"
--:------,
-,
"'0 •lU
CD
~
~
48" (1
-III
lU I
E
.,.
~
.-
0
COLUMN COLUMN 2
Figure 8. Wound-fiberglass and Culligan contactors used in the field study.
The wound-fiberglass contactor was filled with li~estone and the
Culligan unit contained Cullneu, a for~ of CaC0
3
sold by Culligan,
Inc. The wound-fiberglass unit was installed in Bayside cottage
and the C~lligan unit in Henry Covey cottage. (See Figure 9)
36
51. Column 2 illustrated in Figure 8, was rented from Culligan, Inc. It
had an inside diameter of 23 cm and a total length of 127 cm. It was con-
structed of galvanized steel coated with a heat treated epoxy resin.
A granular, calcium carbonate medium (Cullneu®, neutralizing medium,
catalog number 1600-10) sold by Culligan, Inc.* was used in place of limestone
in Column 2. The column was filled to a depth of 40 cm with Cullneu®. The
flow conditions within Column 2 were very similar to those in Column 1, however,
Column 2 was equipped with a valve arrangement at the top which allowed one
to direct water into the effluent pipe to backwash the medium by upflow through
the bed.
The baffled-box contactor and the two column units were installed at
the Covewood Lodge, a resort with housekeeping cottages and a rustic lodge
located in the Adirondack Region of New York State near Old Forge. A map
illustrating the layout of the gravity-fed supply system is presented in
Figure 9. The baffled-box contactor was installed, completely submerged,
in the spring which serves the seven cottages on the west side of the resort.
The spring water elevation was approximately fifteen meters above the ground
floors of the cottages. Water flowed for a distance of approximately 20
ft. (6 m) into two, 400 gallon, (1600 L) galvanized steel storage tanks.
Flow to the cottages from the storage tanks was through a 3.8 cm diameter
plastic pipe. The plumbing in each cottage was copper pipe soldered with
50/50 lead-tin solder. The installation of the baffled-box contactor installed
within the spring is illustrated in Figure 10. Bay Side and Hillside cottages
contained approximately 30 m (100 ft) and 15 m (50 ft) of 1.3 cm (~ in.)
diameter copper pipe, respectively with approximately forty 50/50 lead-tin
solder joints per cottage or two joints per meter of copper pipe.
The wound fiberglass column with limestone particles (Column 1, Figure
8) was installed in the heated basement of Bay Side cottage (see Figure 9).
The unit was used during the months of January, February, March and April
1984 when the plastic line from the spring and baffled-box contactor became
frozen and it was necessary for the resort owner to supply water to the winter-
ized cottages by pumping water directly from Big Moose Lake. The contactor
in Bay Side Cottage was installed on the pressure side of a pressure switch
activated supply pump. The cottage contains two small living units, each
*Mention of trade names or commercial products does not constitute endorsement
or recommendation for use.
37
52. 600" to 5ptl"9
1('0101 h.oJ ....40".
BIG MOOSE LAKE'
---
to
t10WII
I~OO" '0 Sp,Ing,
801 (on,ot'o, gr,d
GOhlllllll • .J Sitel Wol"
5'o,oQ' lun'"
/10101 h.o~-~6h)
i •
Figure 9. Map of the Covewood Lodge property located near Old Forge, NY.
Site oy the field study.
54. has a kitchen and a bathroom with a toilet, sink and shower. Normal total
occupancy during the winter (most but not all guests limit their stay to
a weekend) is four adults.
The Culligan column with Cullneu® medium was installed in the basement
of a cottage (Henry Covey, Figure 9) on the east side of the resort. The
east side of the resort receives water from a spring, which at the time of
this study, contained a marginally effective limestone contactor installed
by the resort owner. The unit in this spring was somewhat ineffective because
of significant short-circuiting. The Henry Covey cottage is winterized and
has a kitchen and a bathroom with sink, toilet and shower. Normal occupancy
is two persons.
Estimates of limestone contactor cost are given in Appendix C.
Limestone Characteristics
The limestone used throughout the study was obtained from a quarry in
Boonville, New York. The limestone was analyzed in the laboratory to determine
its physical and chemical characteristics.
Chemical Characteristics - A sample of limestone was ground to a powder (parti-
cle diameter less than 0.29 mm) and then washed with tap water and dried
24 hours at 105°C.
Three 0.2 gram portions of the powdered limestone were dissolved in
SO ml 1:1 HCL/HN03. After dilution with deionized water elemental analysis
was conducted by atomic absorption spectrophotometry.
It was determined that the cation content of the Boonville limestone
is (by mass) 85 percent calcium, 12.3 percent aluminum and 2.4 percent magne-
sium. Iron, Mn, Zn, Cu and Cd were present at less than 0.1 percent and
Pb, K and Na were not detected. These results indicate that the Boonville
limestone is essentially a "high calcium" limestone.
A supplemental experiment was conducted in which a measured quantity
of Boonville limestone was dissolved in concentrated hydrochloric acid in
a closed system. The C02 evolved was captured and its amount measured.
This result combined with the calcium measurement indicates that the Boonville
stone contains 79% CaCO) by mass. Therefore, although it can be labeled
a high calcium stone it is not of high purity.
40
55. The effective CaC03 solubility product for the limestone was determined
by placing 0.10 gram samples of the powdered limestone in twelve open flasks
containing 100 ml of deionized water. Different amounts of acid were added
to each flask (between 0.25 to 1000 ~eq/L using IN HCl) so that the initial
pH of the samples was between 3.00 and 6.60. The flasks were agitated on
a shaker table in the 20°C room for one week. At the end of the equilibration
period samples were filtered using 0.45 ~m mil1ipore membrane filter and
analyzed to determine Ca, Mg, DIC and pH.
The molar concentrations of these constituents for each sample were
input to the MINEQL chemical equilibrium computer program (Westall et a1.,
1976) using the following conditions:
a - Fixed carbon dioxide partial pressure of 10-3 . 5 atm.
b - Fixed pH (measured final value for each sample)
c - Total hydrogen ion concentration equal to the molar concentration
of acid initially added to the sample.
A solubility product of CaC03 for the limestone of each sample was calcu-
lated as the product of the equilibrium activities of calcium and carbonate
computed by the computer program. The average effective solubility product
of CaC03 in Boonville limestone was found to be 10-8 . 71 (20°C). The experi-
mental results and the computed values of the effective solubility product
are listed in Table 6.
Physical Characteristics - The four size fractions of limestone particles
obtained from the Boonville quarry were analyzed to determine particle size,
sphericity and mass density.
The median particle size for each size fraction was determined using
a standard ASTM (ASTM Manual 447-4) sieve analysis. The percent by weight
finer than a given sieve opening was plotted as a function of the size of
the sieve opening on arithmetic probability graph paper. The median particle
size was determined by interpolation from this graph. In the case of the
0.96 cm median size fraction, 90 percent of the particles were between 0.7
and 1.3 cm.
The volume-weighted mean particle diameter was determined by measuring
the volume of at least 1200 particles in each size fraction. Particle volume
41
57. was measured by drying a random sample of particles at 105°C for 24 hours.
Each particle in the sample was weighed and numbered and then carefully sus-
pended in a small volumetric cylinder filled with water. The volume displaced
was accurately measured with a 1 ml pipet. The volume-weighted mean diameter,
dp ' for each fraction was calculated using
[
6 V 1/3
d =.:.........:...p n 1T
(10)
where Vp is the total measured volume and n is the number of particles included
in the measurement. In the case of the size fraction with a 1.01 cm median
diameter (sieve analysis) the volume weighted mean diameter was 0.93 cm.
The results of the particle size measurements for the four fractions are
given in Table 7. The diameter used for a given fraction in model calculations
was the average of the value obtained by the sieve analysis and the value
obtained by fluid displacement. The sieve analysis results were approximately
normally distributed and therefore it is reaonable to assume that the median
size from the sieving/weighing procedure and the mean size from the fluid
displacment measurements should be nearly the same since the particles all
have the same density.
The sphericity of a particle is equal to the surface area of a sphere
with the same volume as the particle divided by the measured surface area
of the particle. The sphericity of each particle, Wi' was determined by
(6 Vi/1T )2/3 ( 1T/4)
Ai
(11)
where Vi is the volume of the particle measured by fluid displacment and
Ai is the actual surface area measured planimetrically. The sphericity listed
in Table 7 for each size fraction is the average value for the particles
in the sample. The sample size for each size fraction was approximately
fifty particles.
The average sphericity ranged from 0.83 for the 3.20 cm size fraction
to 0.78 for the 1.50 cm fraction. In the case of the 0.96 cm fraction the
measured sphericities ranged from 0.50 to 0.98, with an average value of
0.79.
43
58. TABLE 7 Limestone Particle Size and Sphericity Analysis Results
Size
Fraction
I
II
III
IV
Mean Diameter
Sieve Analysis
(cm)
3.20
1.45
1.01
0.55
Volume Weighted
. Mean Diameter,
dp (em)
1.55
0.93
0.54
Diameter Used
in Design
Calculations, d(cm)
3.20
1.50
0.97
0.54
Particle
Sphericity
(dimensionless)
0.83
0.78
0.79
0.81
59. The mean density of the particles was determined by dividing the sum
of the particle weights by the sum of their measured volumes. The calculated
density was 2.64 g/cm3 .
Cullneu is described by the manufacturer, Culligan, Inc., as "a specially
graded calcium carbonate compound for neutralizing acid waters which provides
consistent dissolving rate for treatment." The particle size is 6-30 mesh
or a mean effective diameter of approximately 2.2 rom. The bulk density is
approximately 1.5 g/cm3 . No other information is available on the Cullneu
material.
Limestone Bed Characteristics
A number of tests were conducted to measure pertinent physical character-
istics of the packed-bed contactors used in the study. The bed porosity
was measured and used with the mean particle diameter and particle sphericity
to calculate the area of limestone particle surface per unit volume of inter-
stitial water. This quantity is important in modeling dissolution kinetics.
Tracer studies were conducted to measure fluid residence time and axial disper-
sion in the contactor.
The porosity of a#packed bed is the ratio of the void space and the
total enclosed volume of the bed. The porosity of each column was determined
by measuring the volume of fluid required to displace all the air from the
bed. This volume was divided by the total volume of the column to obtain
the porosity. The complete procedure was repeated five times.
To evaluate the effect of the column wall on the bed porosity a series
of special tests were conducted. Beakers of various sizes and hence various
wall plus bottom area to volume ratios were filled with each of four limestone
particle sizes and the porosity was measured. The measured porosities have
been plotted as a function of the vessel contact area to volume ratio (A/V
in cm- l ) in Figure 11.
The measured porosity for the column which contained the 0.96 cm limestone
particles was 0.41 and the vessel contact area to volume ratio was 2.25 cm- l .
From the least square regression line fitted to the 0.96 cm particle size
data points in Figure 11, the expected porosity for a vessel contact area
to volume ratio of 0.25 cm- l is 0.43 + 0.04. The measured porosity of 0.41
45
60. 0.60-
'">-.
-0.50 -en 0
0
....
0 ~
Q.
.p-
O'
6
O~
0.40
o 0.5 1.0 1.5 2.0
Cantoiner surface area to volume ratio (em"')'
Figure 11. Measured porosity plotted as a function of container surface area
to volume ratio for four limestone particle effective diameters.
Lines were fitted to the data by the method of least squares.
61. falls within this range. This result also suggests that under these conditions
the column wall has a negligible effect on the overall bed porosity.
The effect of the vessel contact area to volume ratio on the porosity
increases with increasing particle size (Figure 11). For example using the
four least squares regression lines, for Alv = 1 cm- 1 , the overall porosity
is 0.62 for 3.2 cm limestone, 0.55 for 1.5 cm limestone, 0.49 for 0.96 cm
limestone and 0.43 for 0.54 cm limestone. The porosities measured (or esti-
mated using Figure 11) for each of the columns used in this study, except
the Culligan unit are listed in Table 8.
The limestone particle surface area per unit volume of interstitial
water (a, cm- 1 ), which was used in modeling the dissolution process, is also
listed in Table 8. This quantity was calculated for each column using the
measured or estimated porosity (€ ) and the measured mean particle size (d)
and sphericity (tJ; ). The equation used is
a = 6(1-£)
d tJ; €
(12)
The contactors described in Figure 6 were used in a set of experiments
designed to determine the effect of limestone particle size, f10wrate and
the depth of the packed-bed on axial dispersion and mean fluid residence
time. Axial dispersion may be an important factor in modeling the effect
of limestone dissolution on effluent chemistry. Tracer studies were conducted
to evaluate axial dispersion and to test calculated values of mean fluid
detention time within the bed.
Lithium chloride was used as a tracer salt. Lithium is easily detected
(by atomic absorption spectrophotometry), it does not react with nor is it
significantly adsorbed by the contents of the columns and the background
concentration of lithium was negligible in the tap water used in the tracer
experiments.
In most experiments a 200 mg quantity of LiC1 dissolved in 10 mL of
deionized water (20g Li/L) was injected with a syringe into the feed port
at the top of the column. Samples from the effluent port were collected
every 15-30 seconds around the peak concentration of the tracer curves and
every minute for the remainder of the test. The tracer study was repeated
47
62. TABLE 8 Bed porosity and Limestone Particle Surface Area
per unit volume of Interstitial Water
Limestone Particle
Surface Area
Limestone Particle Per Unit Volume of
Diameter, d Interstitial Water,
Column (cm) Porosity a (cm- l )
A, Figure 6 0.96 0.41 11.4
B, Figure 6 0.54 0.43 18.2
C, Figure 6 1. 50 0.49 5.3
D, Figure 6 3.20 0.49 2.6
Wound Fiberglass 0.96 0.44* 9.7
Figure 8
Baffled-Box 0.96 0.44* 9.7
Figure 8
*Estimated Using Figure 11 and measured vessel contact area to volume ratios.
Wound Fiberglass Column, A/V = 0.21 cm- l ;
Baffled-Box Contactor, A/V = 0.19 em-I.
48
63. three times for each flowrate. The results of four experiments are plotted
in Figure 12.
The results from each tracer test were analyzed to determine the total
mass of lithium injected passing the sampling port using the following equa-
tion:
[Mass of Lithium Recovered} ( 13)
The quantity ~ Ci ti is the area under the tracer response curve and Q is
i=l
the volumetric flowrate.
The mean fluid residence time, t, was determined using the first moment
of the tracer response curve, i.e.,
t (14)
The axial dispersion number was determined by the second moment matching
procedure described by Levenspiel and Smith (1957). For low levels of axial
dispersion
- 0.5 (15 )
where ND is the dimensionless axial dispersion number.
The axial dispersion number and mean fluid residence time were determined
for ranges of superficial velocity, limestone particle size and depth of
packed-bed. The results obtained are listed in Table 9. Note that the axial
dispersion number was less than 0.02 in all cases and therefore the use of
Eq. 15 was reasonably appropriate.
A number of investigators including Edwards and Richardson (1968) and
Wilhelm (1962) have compiled data from various researchers and noted that
for axial dispersion in liquids in packed beds the Peclet number, i.e.,
Peclet number =
d Us
D e:
-d
L'
49
(16)
64. 40 -
55cm/min
limestone size-D.96 cm
Temperature - 16OC
Superficial velocity -as
indicated
5.5cm/min
16.5 em/min
".0 cm/min
0l----.:.1~~...A.D~~u.-.~~-~~........~~-~~-~~~~
o 5 10 15 20 25 40
Time ofter tracer injection. mm
10
20-
30
-.J
"-0'
E..c
.Q
....Vl 0
a ........
fDu
c:
0
u
E
.2
:E.---J
Figure 12. Measured effluent tracer concentration plotted as a function of
time elapsed after tracer injection for four values of the super-
ficial velocity. Results 'Were obtained using Column At Figure 6.