Download as PDF, PPTX

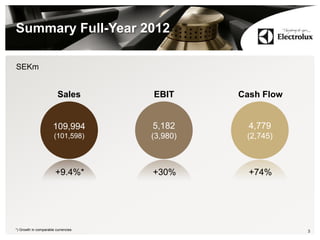
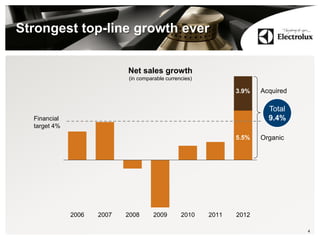
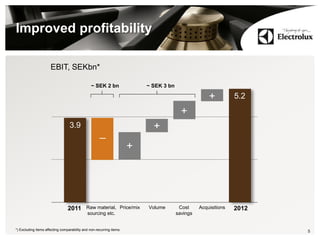
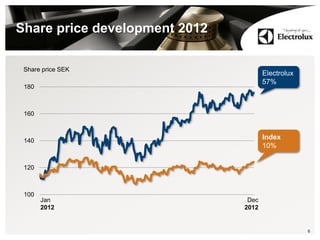
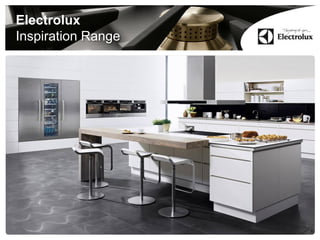

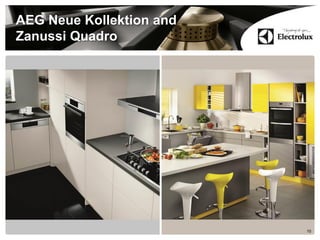
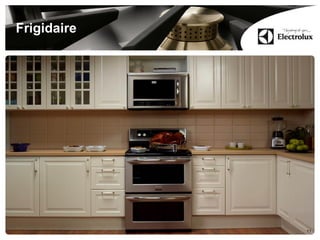
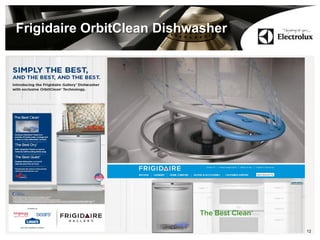

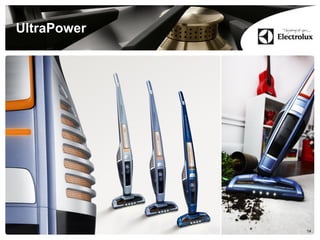

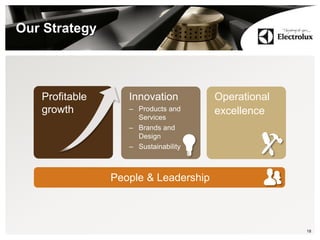

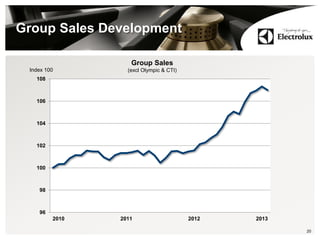
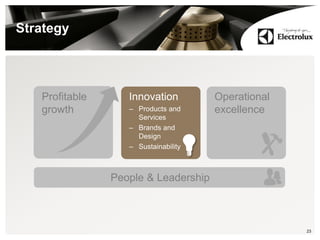
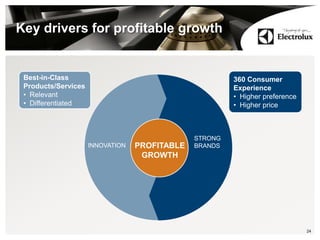


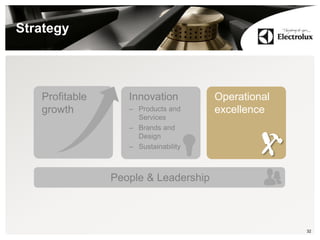
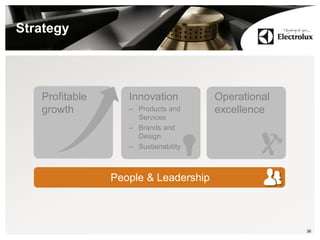


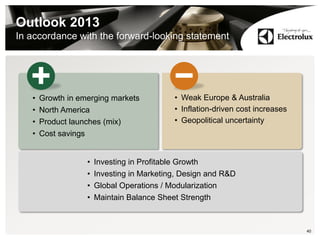
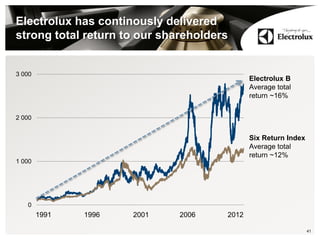

The document summarizes Electrolux's annual general meeting in 2013. It discusses Electrolux's strong financial performance in 2012 with sales growth of 9.4% and improved profitability. The CEO outlines their strategy of focusing on profitable growth through innovation, operational excellence, and developing their brands and products. Key initiatives discussed include new appliance ranges launched in 2012 and goals for continued growth in emerging markets.


