Downloaded 23 times
![LAPPEENRANTA
UNIVERSITY OF TECHNOLOGY
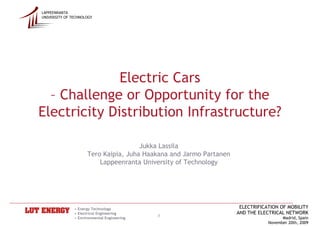
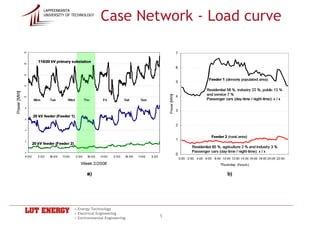
Input Parameters on Electric Car Network Simulation
National passenger transport survey
National passenger transport survey Area-specific
Area-specific
-- Spatial and temporal variations in passenger trips additional
additional
Spatial and temporal variations in passenger trips Charging profile
-- Length of daily trips
energy
energy
Length of daily trips
-- Annual length of driving (region dependent)
Annual length of driving (region dependent) __ kWh/day
__ kWh/day
Power
-- Length of daily trips according to housing type
Length of daily trips according to housing type (working hours/
(working hours/
-- Length of daily trips according to residential area
Length of daily trips according to residential area leisure time)
leisure time)
Hours
-- Length of daily trips according to the month of year
Length of daily trips according to the month of year
-- Length of trips according to the time of day
Length of trips according to the time of day
-- Number of cars in households
Number of cars in households
Properties of electric cars
Properties of electric cars Network simulations and analysis results
Network simulations and analysis results
-- Energy consumption, kWh/km
Energy consumption, kWh/km -- Load flow and loss calculations
Load flow and loss calculations
-- Capacity of the batteries, kWh
Capacity of the batteries, kWh -- Estimation of reinforcements required
Estimation of reinforcements required
-- Charging power, kW
Charging power, kW
-- Required charging time, h/day (battery properties)
Required charging time, h/day (battery properties)
Town planning statistics
Town planning statistics
-- Workplaces according to the area and time of day
Workplaces according to the area and time of day
-- Residential areas (detached houses, terraced houses,
Residential areas (detached houses, terraced houses,
apartment houses)
apartment houses) Electricity distribution network
Electricity distribution network
MARTINKYLÄ
-- Network topology and customer information
Network topology and customer information
Penetration of electric cars
Penetration of electric cars -- Feeder and hourly-specific actual load curves
MASSBY
Feeder and hourly-specific actual load curves
KALLBÄCK
LANDBO
-- Development of electric car markets
Development of electric car markets -- Network volume
Network volume 8
7
-- Replacement value
Replacement value 6
5
Power [MW]
Tariffs and supplier
Tariffs and supplier -- Parameters: loss costs, load growth, lifetime,
Parameters: loss costs, load growth, lifetime,
4
3
unit price of network components
unit price of network components
2
-- Distribution fee
Distribution fee
1
0
0:00 2:00 4:00 6:00 8:00 10:00 12:00 14:00 16:00 18:00 20:00 22:00
Thursday (hours)
• Energy Technology
• Electrical Engineering
• Environmental Engineering
3](https://image.slidesharecdn.com/electrificationofmobilityfinlandlassila-091124103316-phpapp02/85/Electrification-of-Mobility_Finland-Lassila-3-320.jpg)
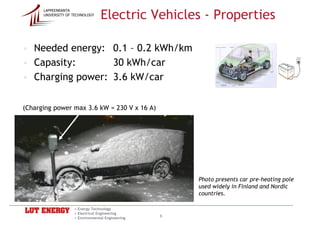
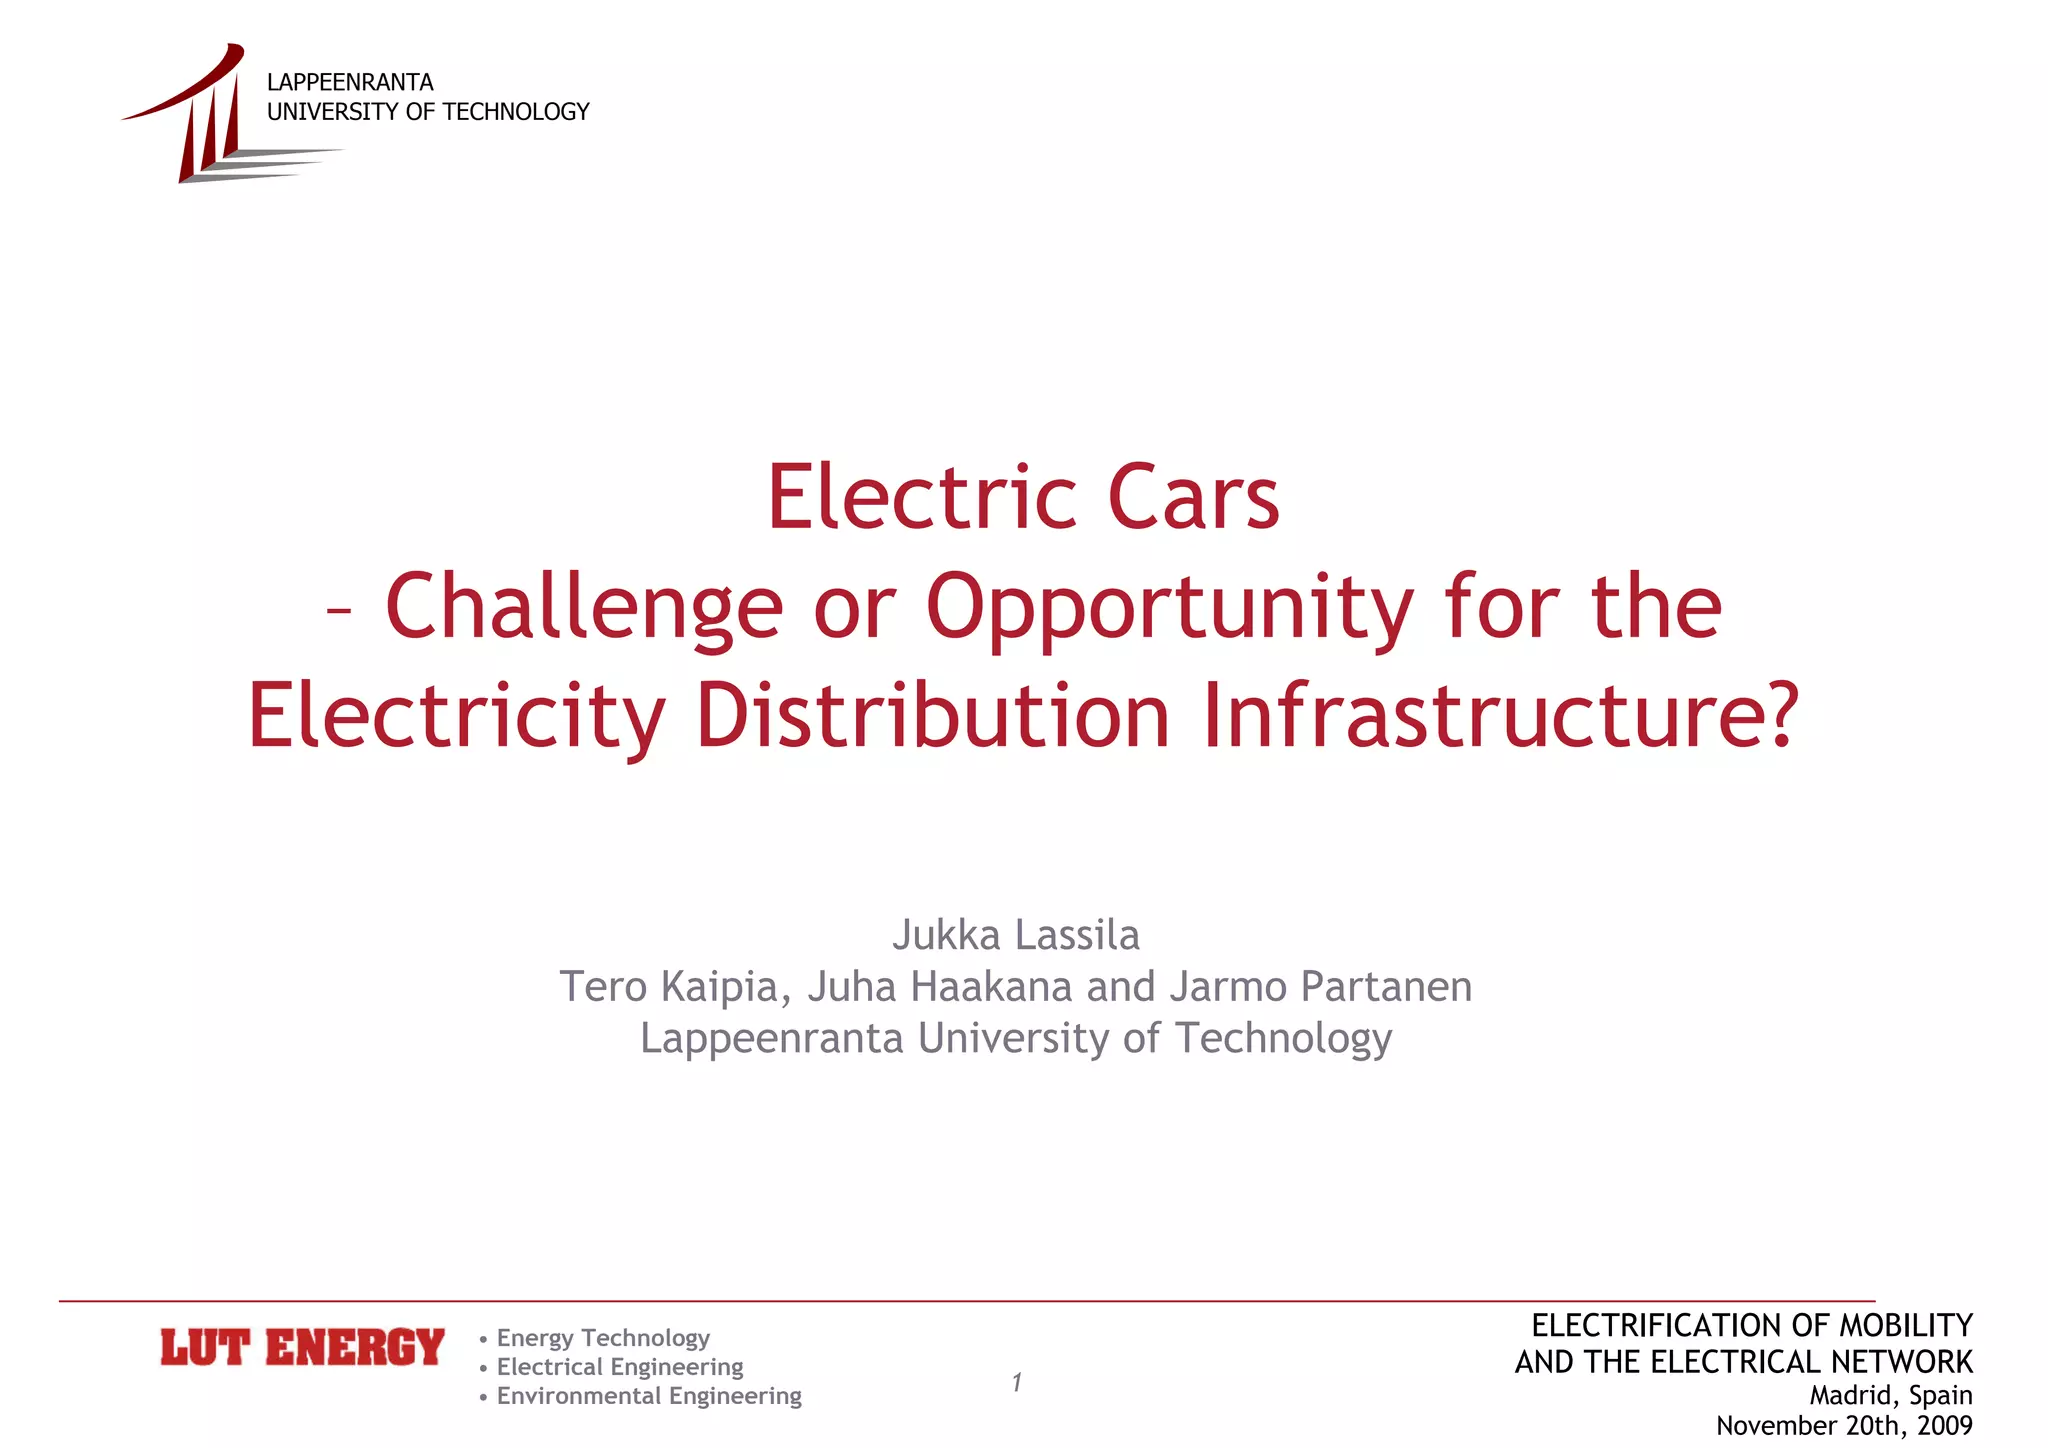
![Case Network - Losses
LAPPEENRANTA
UNIVERSITY OF TECHNOLOGY
400
Losses in medium voltage network
350
Direct night-time charging
Working-hour and
300
time-off charging
Split-level
Load losses [kW]
250
night-time
charging
200
150
100
Optimised charging
50
Present losses
0
0:00 2:00 4:00 6:00 8:00 10:00 12:00 14:00 16:00 18:00 20:00 22:00
• Energy Technology
• Electrical Engineering
• Environmental Engineering
9](https://image.slidesharecdn.com/electrificationofmobilityfinlandlassila-091124103316-phpapp02/85/Electrification-of-Mobility_Finland-Lassila-9-320.jpg)
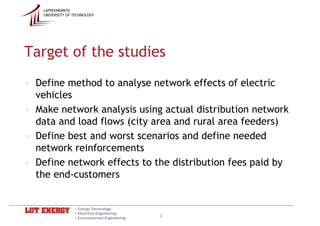
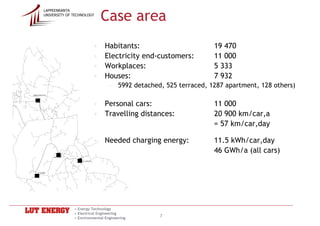
![Case Network - Losses
LAPPEENRANTA
UNIVERSITY OF TECHNOLOGY
200
180
160
Cost of losses [€/day]
140
120
100
80
60
40
20
0
Present losses Direct night- Split-level night- Working-hour Optimised
time charging time charging and time-off charging
charging
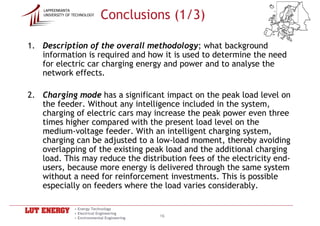
No remarkable differences in charging profiles from loss
costs point of view in medium voltage network!
• Energy Technology
• Electrical Engineering
• Environmental Engineering
10](https://image.slidesharecdn.com/electrificationofmobilityfinlandlassila-091124103316-phpapp02/85/Electrification-of-Mobility_Finland-Lassila-10-320.jpg)
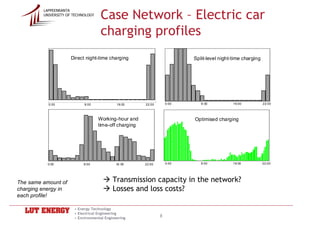
![LAPPEENRANTA
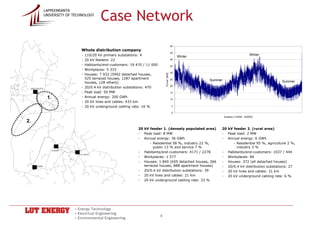
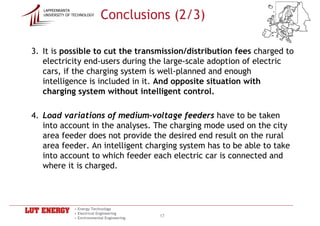
UNIVERSITY OF TECHNOLOGY Case Network – Feeder 1 (city area)
10 10
9 9
Feeder load with
8 8 electric cars City area feeder:
7 7
- Peak load of the day: 6.6 MW
6 E
E
6
- Minimum load of the day: 4.0 MW
5 5
4
4
3
Present load
Peak power [MW]
3 - Number of electric cars: 2000
2 2
Direct night-time charging 1
Split-level night-time charging - Driving distance: 57 km/car,day
1
0
0 - Energy consumption: 0.2 kWh/km
0 2 4 6 8 10 12 14 16 18 20 22
0 2 4 6 8 10 12 14 16 18 20 22 - Charging energy: 11.5 kWh/car,day
22.9 MWh/day for all cars
10 10
9 9
8 8 - Charging power: 3.6 kW/car
7
7 - Additional power: 0 – 3.5 MW
6 6
5 5 (depending on charging method)
4 4
3
3
Working-hour and - Charging energy (E) is equal in each
2 2
time-off charging Optimised charging charging alternative
1 1
0 0
0 2 4 6 8 10 12 14 16 18 20 22 0 2 4 6 8 10 12 14 16 18 20 22
• Energy Technology
• Electrical Engineering
• Environmental Engineering
11](https://image.slidesharecdn.com/electrificationofmobilityfinlandlassila-091124103316-phpapp02/85/Electrification-of-Mobility_Finland-Lassila-11-320.jpg)
![LAPPEENRANTA
UNIVERSITY OF TECHNOLOGY Case Network – Feeder 2 (rural area)
4.0 4.0
3.5 3.5 Rural area feeder:
3.0 3.0 - Peak load of the day: 1.25 MW
Direct night-time charging Split-level night-time charging
2.5 2.5 - Minimum load of the day: 0.75 MW
2.0 2.0
Peak power [MW]
1.5
1.5 - Number of electric cars: 750
1.0
1.0 - Driving distance: 57 km/car,day
0.5
0.5 - Energy consumption: 0.2 kWh/km
0.0
0.0
0 2 4 6 8 10 12 14 16 18 20 22
- Charging energy: 11.5 kWh/car,day
0 2 4 6 8 10 12 14 16 18 20 22
8.6 MWh/day for all cars
4.0 4.0
3.5 3.5
Working-hour and - Charging power: 3.6 kW/car
3.0 3.0
time-off charging Optimised charging - Additional power: 0 – 1.75 MW
2.5 2.5
2.0 2.0
(depending on charging method)
1.5 1.5
1.0 1.0 Charging energy is equal in each
0.5 0.5 charging alternative
0.0 0.0
0 2 4 6 8 10 12 14 16 18 20 22 0 2 4 6 8 10 12 14 16 18 20 22
• Energy Technology
• Electrical Engineering
• Environmental Engineering
12](https://image.slidesharecdn.com/electrificationofmobilityfinlandlassila-091124103316-phpapp02/85/Electrification-of-Mobility_Finland-Lassila-12-320.jpg)
![LAPPEENRANTA
UNIVERSITY OF TECHNOLOGY Case Network – Whole company
60 60
Direct night-time charging Split-level night-time charging
50 50
40 40
Whole company:
- Peak load of the day: 36 MW
30 30
- Minimum load of the day: 25 MW
20 20
Peak power [MW]
10 10 - Number of electric cars: 11 000
0 0
- Driving distance: 57 km/car,day
0 2 4 6 8 10 12 14 16 18 20 22 0 2 4 6 8 10 12 14 16 18 20 22 - Energy consumption: 0.2 kWh/km
60 - Charging energy: 11.5 kWh/car,day
60
Working-hour and Optimised charging 126 MWh/day for all cars
50 50
time-off charging
40 40 - Charging power: 3.6 kW/car
30 30 - Additional power: 0 – 24 MW
20 20 (depending on charging method)
10 10
0 0
0 2 4 6 8 10 12 14 16 18 20 22 0 2 4 6 8 10 12 14 16 18 20 22
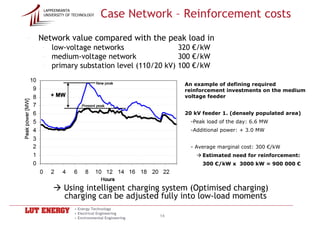
Using intelligent charging system (Optimised charging)
charging can be adjusted fully into low-load moments
• Energy Technology
• Electrical Engineering
• Environmental Engineering
13](https://image.slidesharecdn.com/electrificationofmobilityfinlandlassila-091124103316-phpapp02/85/Electrification-of-Mobility_Finland-Lassila-13-320.jpg)

The document discusses the impact of electric vehicles on electricity distribution infrastructure at Lappeenranta University of Technology, highlighting the need for network analysis to assess electric vehicle integration. It examines various parameters influencing load flow and energy consumption, and emphasizes the importance of intelligent charging systems to mitigate peak load increase and reduce distribution fees. The study outlines scenarios for network reinforcement and charging strategies to accommodate the growing electric vehicle market.


