Electoral maps
•Download as PPT, PDF•
0 likes•344 views
In an election year, maps are used by government, candidates and the media to communicate information about our democracy. They influence decisions about how you vote and how candidates are elected.
Report
Share
Report
Share

Recommended
The Power of Maps: A Cartographic Journey along the World's Borders
The Power of Maps: A cartographic journey along the world’s borders. Contribution by Benjamin Hennig (University of Oxford) for the Geography New Teacher Subject Day ‘Geopolitics and borders’ . Organised by the Prince’s Teaching Institute at Altrincham Girls’ Grammar School (UK), 5th March 2016.
3D Geospatial Visualization Using Power Map
This document summarizes a presentation about 3D geospatial visualization using Power Map. It introduces the presenter and discusses key topics like datums, Microsoft BI geospatial tools including SSRS, Power View, and Power Map. It provides details on Power Map like system requirements and examples of using it to visualize time-stamped 3D charts and animated tours of geographic data. The presentation concludes with instructions on getting started with Power Map and contact information.
Business Intelligence solutions using Excel 2013 and Power BI
Presented for the "Colegio de Ingenieros y Agrimensores de Puerto Rico (CIAPR) - Ponce" (Feb 8, 2014). Presented in Spanish.
sec Presentation.pdf
This document provides an overview of survey research and contemporary challenges in political leadership and communication. It discusses the importance of survey research, including opinion polls and exit polls, for understanding public opinion, evaluating campaigns, and informing policy. Contemporary challenges in political communication mentioned include the spread of misinformation and issues of transparency and trust. Challenges in political leadership include balancing objectives, restoring trust in government, and addressing issues like climate change and inequality. The document also introduces the field of psephology, the study of elections, and outlines some common career paths in political communication and leadership.
Geograhy lesson presented by the Spanish school
Geography workshop presented by the Spanish team during the meeting in Florida Secundaria, Catarroja, Spain- 13-17 December 2016
5 Mini Investigations
This document describes five mini fieldwork investigations about everyday life that can be conducted from home based on the Dear Data project. Each investigation provides a question, method, and example of how the data could be collected and analyzed over one week. The investigations examine mobility, attitudes, variations in quality of life, identity, and connections to different places. Conducting these investigations allows students to explore topics like transport, perspectives on issues, life experiences, and global awareness through collecting small amounts of personal data.
Election Campaign Planning-Research and Targeting
The document provides guidance on developing an effective campaign plan. It stresses that the plan should be written, flexible, explainable, research-based, and include clear goals, targets, messaging, and voter contact strategies. It emphasizes building the plan based on research into the candidate, district, voters, and past election trends to determine the path to victory and goals. The research then drives the messaging and strategy to most efficiently focus efforts on turning out the base and persuading undecided voters.
How opinion polls work
This document provides guidelines for journalists on appropriately reporting opinion polls. It discusses [1] determining whether a poll meets professional standards, [2] deciding if a poll's findings have newsworthiness, and [3] the appropriate way to publish poll findings. Key points include checking a poll's methodology, sample size, and margin of error; using polls to enhance issues coverage rather than set the agenda; and providing full context and disclosure when publishing poll results. The guidelines aim to help journalists identify valid, reliable polls and determine the most meaningful way to communicate poll findings to their audience.
Map Making 101
The document provides an overview of a webinar on making maps for research and advocacy using HealthyCity.org. The webinar teaches participants how maps can be used for community organizing, advocacy, program planning, and grant writing. It covers types of maps, data sources, and best practices for effective map design and analysis. The webinar aims to equip community groups with mapping skills to conduct action-oriented research and social change efforts.
Communication competence and new challenges for politicians: From public spea...
Keynote lecture in the Conference of ECREA section for Interpersonal Communication and Social Interaction. In Aarhus, Denmark 2015
Increasing Voter Knowledge with Pre-Election Interventions on Facebook
As part of our Data Science to Solve Social Problems series, Facebook Data Scientist Winter Mason presented on efforts to increase online civic engagement.
Social Media and the U.S. Election: Aftermath
slides from November 12, 2012, the fourth and final session of the course Social Media and the U.S. Election. The course is taught by Janelle Ward and hosted by the John Adams Institute in Amsterdam, the Netherlands.
3.1 day 2 ppt electoral process
The document summarizes the process for nominating and electing presidential candidates in the United States. It describes the initial steps candidates must take to declare their candidacy and gain support. It then explains how candidates are chosen through state primaries and caucuses, with delegates selected to attend the national conventions. At these conventions, the parties officially nominate their candidate for president. It outlines the campaign process from the national conventions through election day in November and the role of the electoral college in electing the president.
Describe a time when you took a great risk. What was the outcome
The document describes the respondent's experience working on Antanas Mockus' 2010 presidential campaign in Colombia as the director of procurement and budgeting. Some key details:
- The campaign took significant financial risks with limited funding but relied on volunteer support.
- The respondent managed a small team and was responsible for purchasing and distributing millions of campaign materials across Colombia on a limited budget.
- The campaign significantly outperformed expectations in early polling and voter turnout but ultimately lost in a close race in the first round of voting.
- Though they did not win the presidency, the respondent viewed it as one of the most meaningful experiences of their life and an example of civic participation and grassroots campaigning.
Geography political maps
Political maps show the human-made boundaries and divisions of land, including countries, states, counties, and other political units. They delineate imaginary lines that separate two places for political purposes. Political maps also indicate which areas belong to which country or state, using different colors to differentiate political entities. They can display information like states, capitals, major cities, and physical features, with each state typically shown in a unique color. Political maps are useful for finding information about cities, roads, voting precincts, and school districts.
US presidential selection: the Electoral College challenged (again)
Constitutional design for selecting the chief executive
Historical evolution since 1789
The Electoral College
How it works today
Implications and criticism
Alternatives
Reapportionment and post-2020 projections
Critical review newspapers impact on citizens political attitudes and behaviour
1) The document examines the influence of newspapers, particularly The Sun, on voter attitudes and behaviour during the 1997 UK general election through a detailed study of newspaper readership and shifting loyalties.
2) It finds that unprecedented support for Labour from national newspapers, including The Sun, corresponded with Labour's most successful election result in terms of seats won.
3) However, the document also notes that while newspapers can impact elections, individual voter choices are complex and unpredictable, and any election study cannot be fully generalized due to the diversity of citizens and issues.
Web Analytics
The document discusses strategies for the Brooklyn Nets to develop their local audience on social media, particularly Twitter. It analyzes the Nets' Twitter presence in comparison to other NBA teams like the Lakers and Knicks. The analysis finds that Nets fans on Twitter are mostly young, local to New York or New Jersey, and demographically aligned with the team's interests. However, the Nets' current social media strategy is unfocused. The recommendations suggest the Nets better engage and cultivate fans on Twitter by leveraging influencers, analyzing tweet sentiment and content, and conveying the excitement of games.
Paper toader gutu
This paper examines the communicational strategies used by Romanian politicians on Facebook in order to mobilize voters during the 2012 parliamentary elections and the 2014 euro-parliamentary campaign.
Different models of issue voting in britain
This document discusses various models of issue voting and how they explain voting behavior in recent British elections. It summarizes the key models including the Michigan Model, Clarke's proximity model, valence voting model, and position issue model. It analyzes how these models have helped understand factors like party alignments, issue salience, economic conditions, and leadership images that influence how British voters make choices. However, it also notes limitations of these models in fully capturing an increasingly disengaged electorate and failures to consider strategic versus sincere voting behavior with multiple candidates.
Informed Citizen Akron #2: Improving Candidate-Focused Media Coverage in the ...
Following the momentum of the first Informed Citizen Akron, 18 Akron-area residents continued to learn from media experts, to deliberate, and to generate recommendations for how local and Ohio-based media partners can improve issue-based coverage during the 2016 presidential election.
2018 Minnesota State Election Prediction
The document describes the 2018 MinneMUDAC challenge to predict election results in Minnesota. The objectives are to predict votes for each party in 8 US House races, 2 US Senate races, and the Minnesota governor's race. The approach uses regression models to predict total votes (Y) based on demographic, economic, political, social media, and traffic data from 2000-2016. Data is preprocessed through feature selection and dimensionality reduction before modeling with techniques like ridge regression, SVM, random forest, and gradient boosting. Models are cross validated and averaged to generate predictions that are then validated against true results.
Public Opinion and Political Participation
The document provides an overview of public opinion and political participation in the US. It discusses how Americans learn about politics through socialization agents like family, education, and media. It also examines how public opinion is measured through polls and surveys, and outlines Americans' varied political ideologies and levels of participation in the political process through activities like voting, protesting, and contacting elected officials.
Page 1 of 2 Summer 2020 AFR 110N Sec. 101, Dr. Gove.docx
Page 1 of 2
Summer 2020
AFR 110N Sec. 101, Dr. Govere
Country Project Step 1: Colonial History and Current Political Context
Country Project Step 1 Rubric
Main Tasks Components of the Tasks Total
points
1. Basic
information
about your
country of study
What is the name of the country you are researching? What
was its name prior to colonial rule? (I point)
What is the capital city of the country being researched?
Did the capital city change its name after colonial rule? (I
point)
What is the geographical location (latitude and longitude,
and topography (e.g., tropical, desert, savanna, mountainous
or a combination)? (I point)
3
2. Colonial
history of your
country of study
Which European colonial power ruled this territory and
when? (I point)
What was the nature and type of colonial rule in the country
you are researching? (I point)
How did colonial occupation impact the following?
o local political structures;(3 points)
o social and cultural institutions (e.g., land ownership,
marriage, inheritance, gender relations, etc.); (3
points)
o traditional religions and/or spiritual practices; (3
points)
o the economy (3 points)
What were the two major events during colonial occupation
that catalyzed the process of independence? (3 points)
When (the date) did the country gain independence? Who
became the leader of the country at independence? How is
independence celebrated in contemporary society? (3
points)
20
Page 2 of 2
3. Current
political context
What type of political system was introduced immediately
after independence, and what changes were made in the
TWO decades AFTER independence? (3 points)
Explain how the politics of the country have changed over
the last twenty years. (3 points)
Who is the present leader of your assigned country? (1
point)
What is the current political system in place? Name the
main political parties. (3 points)
When were the last elections held, and what was the
outcome, that is, which political party gained power and
which political party ceded power (if relevant)? (2 points)
How did the contending parties, the populace, the media,
and election observers react to the election results? (2
points)
When is the next election scheduled to be held? (I point)
Assess the state of the political system and the role of the
media in the country you are researching. (3 points)
What is the current relationship between the U.S. and your
assigned country? (2 points)
20
4. Conclusion
Using all the data you have collected and the analyses you
have conducted pertaining to the above questions, write a
conclusion addressing how the current political context in
your country of study has not only been influenced by
colonial rule but also by African regional political
developments and the international political context. (3
points)
3
5. Other
requirements
Referencing: Evidential Proof .
The Journey of 500 Journeys
This document summarizes research from 500 interviews and observations over 5 years investigating the voter experience. The research involved 70 researchers, partners, and volunteers conducting studies in 6 states. Major findings include:
- Voters face many more steps to vote than generally understood and burden increases for those without support networks
- Voters are making rational decisions to drop out at each difficult step rather than from apathy
- Understanding this problem space required cataloging 145 websites, 600 interviews, workshops, diary studies and prototypes to understand obstacles voters face.
Data augmented ethnography:
using big data and ethnography to explore candi...
Data augmented ethnography:
using big data and ethnography to explore candi...Salla-Maaria Laaksonen
In this paper we propose data augmented ethnography as a novel mixed methods approach to combine ethnographic, qualitative, observations with social media data collection and computational analysis. Using two brief studies on online interaction as examples we discuss the benefits and challenges of the combination of these two perspectives. We posit that the observations made in the qualitative phase can be quantified and hypothesized together with the data collected later during the analysis stage. Through our case studies we aim to shed light to the differences apparent on the party level and seek to understand how candidates, based on their parties political standing, differ in terms of interactivity. We ask, what insights does a mixed-method approach combining ethnographic observations to computational social science offer to the study of interactivity and its many pregnant forms? To answer this question, we use a large data set collected from different social media platforms before and during the 2015 Parliament Election in Finland. This data consists of both textual data including all candidate updates and the conversations they elicited, as well as field notes written and collected during ethnographic field work period before the elections.Tania
Local newspapers' online election coverage from October 25-29, 2004 was analyzed. 77% of stories changed over time, with most uploading by 9am. Coverage focused on local and regional stories (90%) rather than national. Endorsements did not affect tone of coverage. While some focused on "horse race" aspects, most stories were neutral (66%). Further analysis of bylines, story movement, lack of endorsements, and direction of online political news was recommended.
Political Map of Africa
The document provides instructions for students to complete a learning task where they will color and label a political map of Africa. It includes directions to label each country on the map with pencil first before using a black fine point marker and to color each country lightly using colored pencils going in one direction. Sources for the activity are also listed.
LAND USE LAND COVER AND NDVI OF MIRZAPUR DISTRICT, UP
This Dissertation explores the particular circumstances of Mirzapur, a region located in the
core of India. Mirzapur, with its varied terrains and abundant biodiversity, offers an optimal
environment for investigating the changes in vegetation cover dynamics. Our study utilizes
advanced technologies such as GIS (Geographic Information Systems) and Remote sensing to
analyze the transformations that have taken place over the course of a decade.
The complex relationship between human activities and the environment has been the focus
of extensive research and worry. As the global community grapples with swift urbanization,
population expansion, and economic progress, the effects on natural ecosystems are becoming
more evident. A crucial element of this impact is the alteration of vegetation cover, which plays a
significant role in maintaining the ecological equilibrium of our planet.Land serves as the foundation for all human activities and provides the necessary materials for
these activities. As the most crucial natural resource, its utilization by humans results in different
'Land uses,' which are determined by both human activities and the physical characteristics of the
land.
The utilization of land is impacted by human needs and environmental factors. In countries
like India, rapid population growth and the emphasis on extensive resource exploitation can lead
to significant land degradation, adversely affecting the region's land cover.
Therefore, human intervention has significantly influenced land use patterns over many
centuries, evolving its structure over time and space. In the present era, these changes have
accelerated due to factors such as agriculture and urbanization. Information regarding land use and
cover is essential for various planning and management tasks related to the Earth's surface,
providing crucial environmental data for scientific, resource management, policy purposes, and
diverse human activities.
Accurate understanding of land use and cover is imperative for the development planning
of any area. Consequently, a wide range of professionals, including earth system scientists, land
and water managers, and urban planners, are interested in obtaining data on land use and cover
changes, conversion trends, and other related patterns. The spatial dimensions of land use and
cover support policymakers and scientists in making well-informed decisions, as alterations in
these patterns indicate shifts in economic and social conditions. Monitoring such changes with the
help of Advanced technologies like Remote Sensing and Geographic Information Systems is
crucial for coordinated efforts across different administrative levels. Advanced technologies like
Remote Sensing and Geographic Information Systems
9
Changes in vegetation cover refer to variations in the distribution, composition, and overall
structure of plant communities across different temporal and spatial scales. These changes can
occur natural.
Chapter 4 - Islamic Financial Institutions in Malaysia.pptx
Chapter 4 - Islamic Financial Institutions in Malaysia.pptxMohd Adib Abd Muin, Senior Lecturer at Universiti Utara Malaysia
This slide is special for master students (MIBS & MIFB) in UUM. Also useful for readers who are interested in the topic of contemporary Islamic banking.
More Related Content
Similar to Electoral maps
Map Making 101
The document provides an overview of a webinar on making maps for research and advocacy using HealthyCity.org. The webinar teaches participants how maps can be used for community organizing, advocacy, program planning, and grant writing. It covers types of maps, data sources, and best practices for effective map design and analysis. The webinar aims to equip community groups with mapping skills to conduct action-oriented research and social change efforts.
Communication competence and new challenges for politicians: From public spea...
Keynote lecture in the Conference of ECREA section for Interpersonal Communication and Social Interaction. In Aarhus, Denmark 2015
Increasing Voter Knowledge with Pre-Election Interventions on Facebook
As part of our Data Science to Solve Social Problems series, Facebook Data Scientist Winter Mason presented on efforts to increase online civic engagement.
Social Media and the U.S. Election: Aftermath
slides from November 12, 2012, the fourth and final session of the course Social Media and the U.S. Election. The course is taught by Janelle Ward and hosted by the John Adams Institute in Amsterdam, the Netherlands.
3.1 day 2 ppt electoral process
The document summarizes the process for nominating and electing presidential candidates in the United States. It describes the initial steps candidates must take to declare their candidacy and gain support. It then explains how candidates are chosen through state primaries and caucuses, with delegates selected to attend the national conventions. At these conventions, the parties officially nominate their candidate for president. It outlines the campaign process from the national conventions through election day in November and the role of the electoral college in electing the president.
Describe a time when you took a great risk. What was the outcome
The document describes the respondent's experience working on Antanas Mockus' 2010 presidential campaign in Colombia as the director of procurement and budgeting. Some key details:
- The campaign took significant financial risks with limited funding but relied on volunteer support.
- The respondent managed a small team and was responsible for purchasing and distributing millions of campaign materials across Colombia on a limited budget.
- The campaign significantly outperformed expectations in early polling and voter turnout but ultimately lost in a close race in the first round of voting.
- Though they did not win the presidency, the respondent viewed it as one of the most meaningful experiences of their life and an example of civic participation and grassroots campaigning.
Geography political maps
Political maps show the human-made boundaries and divisions of land, including countries, states, counties, and other political units. They delineate imaginary lines that separate two places for political purposes. Political maps also indicate which areas belong to which country or state, using different colors to differentiate political entities. They can display information like states, capitals, major cities, and physical features, with each state typically shown in a unique color. Political maps are useful for finding information about cities, roads, voting precincts, and school districts.
US presidential selection: the Electoral College challenged (again)
Constitutional design for selecting the chief executive
Historical evolution since 1789
The Electoral College
How it works today
Implications and criticism
Alternatives
Reapportionment and post-2020 projections
Critical review newspapers impact on citizens political attitudes and behaviour
1) The document examines the influence of newspapers, particularly The Sun, on voter attitudes and behaviour during the 1997 UK general election through a detailed study of newspaper readership and shifting loyalties.
2) It finds that unprecedented support for Labour from national newspapers, including The Sun, corresponded with Labour's most successful election result in terms of seats won.
3) However, the document also notes that while newspapers can impact elections, individual voter choices are complex and unpredictable, and any election study cannot be fully generalized due to the diversity of citizens and issues.
Web Analytics
The document discusses strategies for the Brooklyn Nets to develop their local audience on social media, particularly Twitter. It analyzes the Nets' Twitter presence in comparison to other NBA teams like the Lakers and Knicks. The analysis finds that Nets fans on Twitter are mostly young, local to New York or New Jersey, and demographically aligned with the team's interests. However, the Nets' current social media strategy is unfocused. The recommendations suggest the Nets better engage and cultivate fans on Twitter by leveraging influencers, analyzing tweet sentiment and content, and conveying the excitement of games.
Paper toader gutu
This paper examines the communicational strategies used by Romanian politicians on Facebook in order to mobilize voters during the 2012 parliamentary elections and the 2014 euro-parliamentary campaign.
Different models of issue voting in britain
This document discusses various models of issue voting and how they explain voting behavior in recent British elections. It summarizes the key models including the Michigan Model, Clarke's proximity model, valence voting model, and position issue model. It analyzes how these models have helped understand factors like party alignments, issue salience, economic conditions, and leadership images that influence how British voters make choices. However, it also notes limitations of these models in fully capturing an increasingly disengaged electorate and failures to consider strategic versus sincere voting behavior with multiple candidates.
Informed Citizen Akron #2: Improving Candidate-Focused Media Coverage in the ...
Following the momentum of the first Informed Citizen Akron, 18 Akron-area residents continued to learn from media experts, to deliberate, and to generate recommendations for how local and Ohio-based media partners can improve issue-based coverage during the 2016 presidential election.
2018 Minnesota State Election Prediction
The document describes the 2018 MinneMUDAC challenge to predict election results in Minnesota. The objectives are to predict votes for each party in 8 US House races, 2 US Senate races, and the Minnesota governor's race. The approach uses regression models to predict total votes (Y) based on demographic, economic, political, social media, and traffic data from 2000-2016. Data is preprocessed through feature selection and dimensionality reduction before modeling with techniques like ridge regression, SVM, random forest, and gradient boosting. Models are cross validated and averaged to generate predictions that are then validated against true results.
Public Opinion and Political Participation
The document provides an overview of public opinion and political participation in the US. It discusses how Americans learn about politics through socialization agents like family, education, and media. It also examines how public opinion is measured through polls and surveys, and outlines Americans' varied political ideologies and levels of participation in the political process through activities like voting, protesting, and contacting elected officials.
Page 1 of 2 Summer 2020 AFR 110N Sec. 101, Dr. Gove.docx
Page 1 of 2
Summer 2020
AFR 110N Sec. 101, Dr. Govere
Country Project Step 1: Colonial History and Current Political Context
Country Project Step 1 Rubric
Main Tasks Components of the Tasks Total
points
1. Basic
information
about your
country of study
What is the name of the country you are researching? What
was its name prior to colonial rule? (I point)
What is the capital city of the country being researched?
Did the capital city change its name after colonial rule? (I
point)
What is the geographical location (latitude and longitude,
and topography (e.g., tropical, desert, savanna, mountainous
or a combination)? (I point)
3
2. Colonial
history of your
country of study
Which European colonial power ruled this territory and
when? (I point)
What was the nature and type of colonial rule in the country
you are researching? (I point)
How did colonial occupation impact the following?
o local political structures;(3 points)
o social and cultural institutions (e.g., land ownership,
marriage, inheritance, gender relations, etc.); (3
points)
o traditional religions and/or spiritual practices; (3
points)
o the economy (3 points)
What were the two major events during colonial occupation
that catalyzed the process of independence? (3 points)
When (the date) did the country gain independence? Who
became the leader of the country at independence? How is
independence celebrated in contemporary society? (3
points)
20
Page 2 of 2
3. Current
political context
What type of political system was introduced immediately
after independence, and what changes were made in the
TWO decades AFTER independence? (3 points)
Explain how the politics of the country have changed over
the last twenty years. (3 points)
Who is the present leader of your assigned country? (1
point)
What is the current political system in place? Name the
main political parties. (3 points)
When were the last elections held, and what was the
outcome, that is, which political party gained power and
which political party ceded power (if relevant)? (2 points)
How did the contending parties, the populace, the media,
and election observers react to the election results? (2
points)
When is the next election scheduled to be held? (I point)
Assess the state of the political system and the role of the
media in the country you are researching. (3 points)
What is the current relationship between the U.S. and your
assigned country? (2 points)
20
4. Conclusion
Using all the data you have collected and the analyses you
have conducted pertaining to the above questions, write a
conclusion addressing how the current political context in
your country of study has not only been influenced by
colonial rule but also by African regional political
developments and the international political context. (3
points)
3
5. Other
requirements
Referencing: Evidential Proof .
The Journey of 500 Journeys
This document summarizes research from 500 interviews and observations over 5 years investigating the voter experience. The research involved 70 researchers, partners, and volunteers conducting studies in 6 states. Major findings include:
- Voters face many more steps to vote than generally understood and burden increases for those without support networks
- Voters are making rational decisions to drop out at each difficult step rather than from apathy
- Understanding this problem space required cataloging 145 websites, 600 interviews, workshops, diary studies and prototypes to understand obstacles voters face.
Data augmented ethnography:
using big data and ethnography to explore candi...
Data augmented ethnography:
using big data and ethnography to explore candi...Salla-Maaria Laaksonen
In this paper we propose data augmented ethnography as a novel mixed methods approach to combine ethnographic, qualitative, observations with social media data collection and computational analysis. Using two brief studies on online interaction as examples we discuss the benefits and challenges of the combination of these two perspectives. We posit that the observations made in the qualitative phase can be quantified and hypothesized together with the data collected later during the analysis stage. Through our case studies we aim to shed light to the differences apparent on the party level and seek to understand how candidates, based on their parties political standing, differ in terms of interactivity. We ask, what insights does a mixed-method approach combining ethnographic observations to computational social science offer to the study of interactivity and its many pregnant forms? To answer this question, we use a large data set collected from different social media platforms before and during the 2015 Parliament Election in Finland. This data consists of both textual data including all candidate updates and the conversations they elicited, as well as field notes written and collected during ethnographic field work period before the elections.Tania
Local newspapers' online election coverage from October 25-29, 2004 was analyzed. 77% of stories changed over time, with most uploading by 9am. Coverage focused on local and regional stories (90%) rather than national. Endorsements did not affect tone of coverage. While some focused on "horse race" aspects, most stories were neutral (66%). Further analysis of bylines, story movement, lack of endorsements, and direction of online political news was recommended.
Political Map of Africa
The document provides instructions for students to complete a learning task where they will color and label a political map of Africa. It includes directions to label each country on the map with pencil first before using a black fine point marker and to color each country lightly using colored pencils going in one direction. Sources for the activity are also listed.
Similar to Electoral maps (20)
Communication competence and new challenges for politicians: From public spea...
Communication competence and new challenges for politicians: From public spea...
Increasing Voter Knowledge with Pre-Election Interventions on Facebook
Increasing Voter Knowledge with Pre-Election Interventions on Facebook
Describe a time when you took a great risk. What was the outcome
Describe a time when you took a great risk. What was the outcome
US presidential selection: the Electoral College challenged (again)
US presidential selection: the Electoral College challenged (again)
Critical review newspapers impact on citizens political attitudes and behaviour
Critical review newspapers impact on citizens political attitudes and behaviour
Informed Citizen Akron #2: Improving Candidate-Focused Media Coverage in the ...
Informed Citizen Akron #2: Improving Candidate-Focused Media Coverage in the ...
Page 1 of 2 Summer 2020 AFR 110N Sec. 101, Dr. Gove.docx
Page 1 of 2 Summer 2020 AFR 110N Sec. 101, Dr. Gove.docx
Data augmented ethnography:
using big data and ethnography to explore candi...
Data augmented ethnography:
using big data and ethnography to explore candi...
Recently uploaded
LAND USE LAND COVER AND NDVI OF MIRZAPUR DISTRICT, UP
This Dissertation explores the particular circumstances of Mirzapur, a region located in the
core of India. Mirzapur, with its varied terrains and abundant biodiversity, offers an optimal
environment for investigating the changes in vegetation cover dynamics. Our study utilizes
advanced technologies such as GIS (Geographic Information Systems) and Remote sensing to
analyze the transformations that have taken place over the course of a decade.
The complex relationship between human activities and the environment has been the focus
of extensive research and worry. As the global community grapples with swift urbanization,
population expansion, and economic progress, the effects on natural ecosystems are becoming
more evident. A crucial element of this impact is the alteration of vegetation cover, which plays a
significant role in maintaining the ecological equilibrium of our planet.Land serves as the foundation for all human activities and provides the necessary materials for
these activities. As the most crucial natural resource, its utilization by humans results in different
'Land uses,' which are determined by both human activities and the physical characteristics of the
land.
The utilization of land is impacted by human needs and environmental factors. In countries
like India, rapid population growth and the emphasis on extensive resource exploitation can lead
to significant land degradation, adversely affecting the region's land cover.
Therefore, human intervention has significantly influenced land use patterns over many
centuries, evolving its structure over time and space. In the present era, these changes have
accelerated due to factors such as agriculture and urbanization. Information regarding land use and
cover is essential for various planning and management tasks related to the Earth's surface,
providing crucial environmental data for scientific, resource management, policy purposes, and
diverse human activities.
Accurate understanding of land use and cover is imperative for the development planning
of any area. Consequently, a wide range of professionals, including earth system scientists, land
and water managers, and urban planners, are interested in obtaining data on land use and cover
changes, conversion trends, and other related patterns. The spatial dimensions of land use and
cover support policymakers and scientists in making well-informed decisions, as alterations in
these patterns indicate shifts in economic and social conditions. Monitoring such changes with the
help of Advanced technologies like Remote Sensing and Geographic Information Systems is
crucial for coordinated efforts across different administrative levels. Advanced technologies like
Remote Sensing and Geographic Information Systems
9
Changes in vegetation cover refer to variations in the distribution, composition, and overall
structure of plant communities across different temporal and spatial scales. These changes can
occur natural.
Chapter 4 - Islamic Financial Institutions in Malaysia.pptx
Chapter 4 - Islamic Financial Institutions in Malaysia.pptxMohd Adib Abd Muin, Senior Lecturer at Universiti Utara Malaysia
This slide is special for master students (MIBS & MIFB) in UUM. Also useful for readers who are interested in the topic of contemporary Islamic banking.
How to Manage Your Lost Opportunities in Odoo 17 CRM
Odoo 17 CRM allows us to track why we lose sales opportunities with "Lost Reasons." This helps analyze our sales process and identify areas for improvement. Here's how to configure lost reasons in Odoo 17 CRM
South African Journal of Science: Writing with integrity workshop (2024)
South African Journal of Science: Writing with integrity workshop (2024)Academy of Science of South Africa
A workshop hosted by the South African Journal of Science aimed at postgraduate students and early career researchers with little or no experience in writing and publishing journal articles.clinical examination of hip joint (1).pdf
described clinical examination all orthopeadic conditions .
DRUGS AND ITS classification slide share
Any substance (other than food) that is used to prevent, diagnose, treat, or relieve symptoms of a
disease or abnormal condition
Pollock and Snow "DEIA in the Scholarly Landscape, Session One: Setting Expec...
Pollock and Snow "DEIA in the Scholarly Landscape, Session One: Setting Expec...National Information Standards Organization (NISO)
This presentation was provided by Steph Pollock of The American Psychological Association’s Journals Program, and Damita Snow, of The American Society of Civil Engineers (ASCE), for the initial session of NISO's 2024 Training Series "DEIA in the Scholarly Landscape." Session One: 'Setting Expectations: a DEIA Primer,' was held June 6, 2024.ANATOMY AND BIOMECHANICS OF HIP JOINT.pdf
it describes the bony anatomy including the femoral head , acetabulum, labrum . also discusses the capsule , ligaments . muscle that act on the hip joint and the range of motion are outlined. factors affecting hip joint stability and weight transmission through the joint are summarized.
BÀI TẬP BỔ TRỢ TIẾNG ANH 8 CẢ NĂM - GLOBAL SUCCESS - NĂM HỌC 2023-2024 (CÓ FI...
BÀI TẬP BỔ TRỢ TIẾNG ANH 8 CẢ NĂM - GLOBAL SUCCESS - NĂM HỌC 2023-2024 (CÓ FI...Nguyen Thanh Tu Collection
https://app.box.com/s/y977uz6bpd3af4qsebv7r9b7s21935vdDigital Artifact 1 - 10VCD Environments Unit
Digital Artifact 1 - 10VCD Environments Unit - NGV Pavilion Concept Design
How to Add Chatter in the odoo 17 ERP Module
In Odoo, the chatter is like a chat tool that helps you work together on records. You can leave notes and track things, making it easier to talk with your team and partners. Inside chatter, all communication history, activity, and changes will be displayed.
Walmart Business+ and Spark Good for Nonprofits.pdf
"Learn about all the ways Walmart supports nonprofit organizations.
You will hear from Liz Willett, the Head of Nonprofits, and hear about what Walmart is doing to help nonprofits, including Walmart Business and Spark Good. Walmart Business+ is a new offer for nonprofits that offers discounts and also streamlines nonprofits order and expense tracking, saving time and money.
The webinar may also give some examples on how nonprofits can best leverage Walmart Business+.
The event will cover the following::
Walmart Business + (https://business.walmart.com/plus) is a new shopping experience for nonprofits, schools, and local business customers that connects an exclusive online shopping experience to stores. Benefits include free delivery and shipping, a 'Spend Analytics” feature, special discounts, deals and tax-exempt shopping.
Special TechSoup offer for a free 180 days membership, and up to $150 in discounts on eligible orders.
Spark Good (walmart.com/sparkgood) is a charitable platform that enables nonprofits to receive donations directly from customers and associates.
Answers about how you can do more with Walmart!"
The History of Stoke Newington Street Names
Presented at the Stoke Newington Literary Festival on 9th June 2024
www.StokeNewingtonHistory.com
Azure Interview Questions and Answers PDF By ScholarHat
Azure Interview Questions and Answers PDF By ScholarHat
Community pharmacy- Social and preventive pharmacy UNIT 5
Covered community pharmacy topic of the subject Social and preventive pharmacy for Diploma and Bachelor of pharmacy
Recently uploaded (20)
LAND USE LAND COVER AND NDVI OF MIRZAPUR DISTRICT, UP
LAND USE LAND COVER AND NDVI OF MIRZAPUR DISTRICT, UP
Chapter 4 - Islamic Financial Institutions in Malaysia.pptx
Chapter 4 - Islamic Financial Institutions in Malaysia.pptx
How to Manage Your Lost Opportunities in Odoo 17 CRM
How to Manage Your Lost Opportunities in Odoo 17 CRM
South African Journal of Science: Writing with integrity workshop (2024)
South African Journal of Science: Writing with integrity workshop (2024)
Pollock and Snow "DEIA in the Scholarly Landscape, Session One: Setting Expec...
Pollock and Snow "DEIA in the Scholarly Landscape, Session One: Setting Expec...
Film vocab for eal 3 students: Australia the movie
Film vocab for eal 3 students: Australia the movie
BÀI TẬP BỔ TRỢ TIẾNG ANH 8 CẢ NĂM - GLOBAL SUCCESS - NĂM HỌC 2023-2024 (CÓ FI...
BÀI TẬP BỔ TRỢ TIẾNG ANH 8 CẢ NĂM - GLOBAL SUCCESS - NĂM HỌC 2023-2024 (CÓ FI...
Walmart Business+ and Spark Good for Nonprofits.pdf
Walmart Business+ and Spark Good for Nonprofits.pdf
Azure Interview Questions and Answers PDF By ScholarHat
Azure Interview Questions and Answers PDF By ScholarHat
Community pharmacy- Social and preventive pharmacy UNIT 5
Community pharmacy- Social and preventive pharmacy UNIT 5
Electoral maps
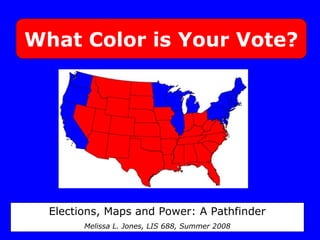
- 1. What Color is Your Vote? Elections, Maps and Power: A Pathfinder Melissa L. Jones, LIS 688, Summer 2008
- 2. Research Questions: •How are maps used by the general public during an election year? •How are maps used by candidates and political parties during an election year? •How do maps influence our votes?
- 3. In an election year, we use maps to… 1) Draw election districts
- 4. In an election year, we use maps to… 2) Follow polls and election results
- 5. In an election year, we use maps to… 3) Communicate information about winners and losers
- 6. In an election year, we use maps to… 4) Make sense of our national identity
- 9. Conclusions Election Maps in the media don’t reflect the complexity of our votes Maps play a large role in voter education Those with the power to manipulate our electoral map have the power to decide who gets elected You can play a role in making these decisions!
- 10. Conclusions Election Maps in the media don’t reflect the complexity of our votes Maps play a large role in voter education Those with the power to manipulate our electoral map have the power to decide who gets elected You can play a role in making these decisions!
Editor's Notes
- Hi, I’m Melissa and I’m a dork. For my project, I did something a little different. I decided to look at the theme of election maps. I started thinking about the red and blue map that we all look at on election night Misleading - looks like there are more red folks in the country than blue, right?
- Not only that, but this way of mapping election results serves to divide us, rather than bring us together. Are you an American, or a resident of Bushiana? Are you from the city or the country?Are you liberal or conservative?Religious or amoral? One of us or one of them? I wanted to find out how maps affect us in an election year. QUESTIONS In my research, which I compiled in a digital pathfinder, I found that there are four main reasons we use maps during an election year…
- Maps are used by local and state governments every year to redraw district boundaries… CLICK OVER TO SITE Show Digital Libraries Books (Monmonier) Electoral Geography They Represent Us
- HOLD UP Battle of Ballots - web 0.0 CLICK OVER TO SITE SHOW Web Apps - Web 2.0
- CLICK OVER TO SITE Show Websites
- CLICK OVER TO SITE Show Periodicals
- Is this who we are? Or is the picture more complex?CLICK OVER TO SITE Show Electoral Geography ATLASES
- Thank you! Yay!