Science 7 - LAND and SEA BREEZE and its Characteristics
Effects of long term
1. Journal of Sports Sciences, June 2007; 25(8): 927 – 935
Field and laboratory correlates of performance in competitive
cross-country mountain bikers
LOUISE PRINS1,2, ELMARIE TERBLANCHE1, & KATHRYN H. MYBURGH2
1
Department of Sport Science and 2Department of Physiological Sciences, University of Stellenbosch,
Stellenbosch, South Africa
(Accepted 4 July 2006)
Abstract
We designed a laboratory test with variable fixed intensities to simulate cross-country mountain biking and compared this to
more commonly used laboratory tests and mountain bike performance. Eight competitive male mountain bikers participated
in a cross-country race and subsequently did six performance tests: an individual outdoor time trial on the same course as the
race and five laboratory tests. The laboratory tests were as follows: an incremental cycle test to fatigue to determine peak
power output; a 26-min variable fixed-intensity protocol using an electronically braked ergometer followed immediately by a
1-km time trial using the cyclist’s own bike on an electronically braked roller ergometer; two 52-min variable fixed-intensity
protocols each followed by a 1-km time trial; and a 1-km time trial done on its own. Outdoor competition time and outdoor
time trial time correlated significantly (r ¼ 0.79, P 5 0.05). Both outdoor tests correlated better with peak power output
relative to body mass (both r ¼ 70.83, P 5 0.05) than absolute peak power output (outdoor competition: r ¼ 70.65;
outdoor time trial: r ¼ 70.66; non-significant). Outdoor performance times did not correlate with the laboratory tests. We
conclude that cross-country mountain biking is similar to uphill or hilly road cycling. Further research is required to design
sport-specific tests to determine the remaining unexplained variance in performance.
Keywords: Mountain bike, performance, onset of blood lactate accumulation, relative power output, time trial
involves exercise intensities similar to those in short
Introduction
(540 km) road cycling time trials (Impellizzeri et al.,
Mountain biking is a comparatively new sport, with 2002), but higher than those in longer (440 km)
cross-country racing being officially recognized by road cycling stages as predicted by Padilla et al.
the International Cycling Union in 1990. The first (2001). Specific physiological requirements for
World Cup series took place in 1991 and mountain mountain biking may also differ from road cycling
bike cross-country racing made its debut at the because of different riding techniques, terrain con-
Olympics in 1996 in Atlanta. Despite the growing ditions, and strategies incorporated in the sport.
popularity of the sport, mountain bikers have not Therefore, laboratory performance prediction tests
been investigated extensively by exercise physiolo- used for road cyclists are probably not applicable to
gists. Four studies have investigated the physiological mountain bikers.
profiles of mountain bikers (Baron, 2001; Impellizzeri, A common laboratory performance test for road
Sassi, Rodriguez-Alonso, Mognoni, & Marcora, cyclists is the progressive incremental test to exhaus-
2002; Mastroianni, Zupan, Chuba, Berger, & Wile, tion. Maximal performance variables covered by this
2000; Wilber, Zawadzki, Kearney, Shannon, & _
test include maximal oxygen consumption (V O2max)
Disalvo, 1997), while another two examined the (Coyle, Coggan, Hopper, & Walters, 1988) and
effects of bicycle technology on physiological re- absolute sustained peak power output (Coyle et al.,
sponses to cycling, without addressing performance 1991; Hawley & Noakes, 1992), both typically
(MacRae, Hise, & Allen, 2000; Seifert, Luetkemeier, achieved in the final minute of the test. Sub-maximal
Spencer, Miller, & Burke, 1997). variables that could be associated with performance
In many ways, mountain biking is different from include those related to plasma lactate concentration
road cycling. Cross-country mountain bike racing or the dynamics of plasma lactate accumulation.
Correspondence: K. H. Myburgh, Department of Physiological Sciences, University of Stellenbosch, Private Bag XI, Matieland 7602, South Africa.
E-mail: khm@sun.ac.za
ISSN 0264-0414 print/ISSN 1466-447X online Ó 2007 Taylor & Francis
DOI: 10.1080/02640410600907938
2. 928 L. Prins et al.
These include the lactate threshold, defined as the mountain bike performance; (2) to compare the
_
%V O2max when plasma lactate has increased by predictive power of variables from commonly used
1 mmol Á l71 above the baseline value (Coyle et al., laboratory tests as well as non-traditional tests; and
1991), and the onset of blood lactate accumulation (3) to determine the most relevant mountain bike
(Padilla, Mujika, Cuesta, & Goiriena, 1999), both of performance prediction test(s).
which have been shown to predict different aspects of
road cycling. For example, peak power output was
shown to be correlated with time trial performance Methods
(time to complete a set distance) in a simulated
Participants
indoor race (Hawley & Noakes, 1992). Similarly,
mean power output during a simulated indoor race Eight competitive male cross-country mountain
correlated well with performance in an outdoor race bikers participated in the study. All participants had
event (Coyle et al., 1991). In the latter study, outdoor had to have competed in mountain bike races for at
_
race performance was correlated with V O2 at the least two consecutive seasons. After being fully
lactate threshold determined from an incremental informed of the risks associated with the study,
_
test to exhaustion, and mean absolute V O2 during a the participants provided their written consent. The
simulated indoor 1-h performance test, but not mean study was approved by the ethics committee of
_
V O2 expressed relative to body mass. However, the authors’ institution. The eight participants
cross-country mountain biking differs substantially completed all of the tests.
from road cycling and the best laboratory predictor
of uphill cycling over either 1 km or 6 km (on a
Test procedures: Overview
treadmill with a gradient of 12% and 6% respec-
tively) was shown to be the mean power produced All participants took part in an outdoor competition
during a Wingate test expressed relative to body mass and then completed four laboratory tests and an
(Davison, Swan, Coleman, & Bird, 2000). These outdoor time trial within 2 months of the competi-
contrasting results suggest that the requirements for tion. One of the laboratory tests was done on two
success in flat and hilly cycling are completely occasions to determine reproducibility. All tests were
different. completed in the winter season in temperate condi-
In contrast to road cycling (Coyle et al., 1988, tions with low humidity.
1991; Mujika & Padilla, 2001; Padilla et al., 1999; Laboratory testing was performed during
Schabort, Hawley, Hopkins, Mujika, & Noakes, five separate visits, with a maximum of 7 days
1998), no cycling studies that have used laboratory- of recovery between tests. All participants
based tests to predict performance for mountain completed the following laboratory tests in random
biking, or to design a sport-specific laboratory test order:
for mountain bikers. One option would be to take
account of the variability in terrain and thus the 1. A progressive incremental exercise test to
variability in intensity in a cross-country mountain _
exhaustion to determine V O2max and peak
bike race, and then design a test with variable power output.
intensities to reflect these characteristics. For such 2. A 1-km time trial performed in a fresh
a test to be reproducible between participants but condition (no previous laboratory test on the
also variable, the intensity and duration at the same day).
various intensities should be fixed rather than 3. A variable fixed-intensity bout lasting 26 min
freely selected such as during free-range exercise (approximately equivalent to one lap of the
(Schabort et al., 1998; Terblanche, Wessels, original race) and followed immediately by a
Stewart, & Koeslag, 1999). Exercise tests with fixed 1-km time trial.
but variable intensities are rare in the literature 4. A variable fixed-intensity test consisting of
(Palmer, Borghouts, Noakes, & Hawley, 1999; two consecutive bouts each lasting 26 min
Palmer, Noakes, & Hawley, 1997). This could be and followed immediately by a 1-km time trial.
because they need to be performed in combination
with a time trial to assess performance. The latter The latter was repeated on a separate day to
could be the time taken to complete a specific determine the reproducibility of the variable fixed-
distance (the approach used in the present study), intensity protocol.
or a specific amount of external mechanical work Field testing took place on two occasions. On the
that can be completed in a set time (as used by first occasion, all riders participated in the same
Coyle et al., 1991). outdoor competition. On the second occasion, they
The aims of this study were: (1) to design and performed an individual outdoor time trial over the
evaluate a laboratory test to simulate cross-country same course.
3. Mountain bike performance 929
(0 and 5 mmol Á l71). The exercise intensity corre-
Progressive incremental test to exhaustion
sponding to the onset of blood lactate accumulation
All participants completed a progressive incremental was identified on the lactate – power output curve
test to fatigue on a calibrated cycle ergometer by straight line interpolation between the two closest
(Technogym Bikerace, Gambettola, Italy) for the points eliciting a blood lactate concentration of
_
determination of V O2max, peak power output, and 4 mmol Á l71 (Sjodin & Jacobs, 1981).
¨
the onset of blood lactate accumulation. After a Percent maximal heart rate (%HRmax) was plotted
10-min warm-up, the test began at an intensity against peak power output (PPO) for each partici-
of 3.33 W Á kg71 body mass. Every 2½ min, the pant. Each participant’s individual graph was used to
intensity was increased by 30 W until the participant calculate the %PPO for a specific %HRmax value to
reached exhaustion (modified from Kuipers, determine the variable fixed-intensity protocol,
Verstappen, Keizer, & Guerten, 1985). The criteria which aimed to simulate one lap of the outdoor time
for ending the test included one or a combination of trial (see below for more details).
the following: a heart rate greater than 90% of the
age-predicted maximum heart rate, a respiratory
Field tests
exchange ratio (RER) greater than 1.1, or a plateau
in oxygen consumption (5150 ml Á min71 difference Outdoor competition. All participants competed in the
in oxygen consumption for the final two stages). same regional cross-country championship race.
During the test, the participants wore a mask that Approximately 100 mountain bikers competed in
covered the nose and mouth and expired air passed the event. The course was approximately 8 km long
through an on-line computer system attached to an and, depending on fitness, experience, and age, the
automated gas analyser (Oxycon Version 4.5, Jaeger, riders had to complete either four or six laps of the
Hoechberg, Germany). Before each test, the gas course during competition. For the purpose of this
analyser was calibrated with room air and a carbon study, the race time for the first four laps was used as
dioxide – oxygen – nitrogen gas mixture of known a performance measure.
composition. Analyser outputs were processed by
the computer, which calculated oxygen uptake, Outdoor time trial. Each participant had individually
carbon dioxide production, minute ventilation, and to perform an outdoor time trial of four laps on the
the RER for every 10 s of the test. Each participant’s same course as used for the outdoor competition.
_
V O2max was taken as the highest oxygen uptake They were requested to go ‘‘all out’’ as if they were
measured during any 10-s period of the test. Peak competing in a race. Each participant wore a
power output was calculated as follows (Kuipers downloadable heart rate monitor (Accurex Plus,
et al., 1985): Polar Electro, Kempele, Finland) to record their
heart rate and to determine when they finished a lap
peak power output ¼ Wf þ ðt=150 Á 30Þ and the complete time trial. Total outdoor time trial
time was also used as a performance measure.
where Wf is the final completed intensity and t is the
time in seconds of the final uncompleted workload.
Variable fixed-intensity bouts
Heart rate was recorded every 5 s using a down-
loadable heart rate monitor (Accurex Plus, Polar After the first four participants completed the
Electro, Kempele, Finland). Each participant’s individual outdoor time trial, their heart rate data
maximal heart rate was taken as the highest heart were used to design a variable fixed-intensity
rate measured during any 10-s period of the test. laboratory test. We decided to only use the heart
Blood samples were obtained from an indwelling rate data of the second lap to avoid the initial stress
cannula (JelcoTM IV Catheter, Brussels, Belgium) in caused by the start of the outdoor time trial and the
the participant’s left forearm vein. Blood samples possible effects of cardiac drift (Jeukendrup & Van
(5 ml) were taken at rest, 15 s before the end of each Diemen, 1998) during the last two laps. Heart rate
intensity, and at 2 and 4 min into recovery. Samples (expressed as a percentage of each individual’s
were immediately centrifuged at 48C at 3000 maximal heart rate obtained in the progressive
rev Á min71 and plasma was frozen for later analysis. incremental test to exhaustion) was then plotted
Plasma lactate concentration was later determined against time standardized to 100% (every 5-s interval
using an electroenzymatic technique with an was expressed as a percentage of that person’s total
automatic analyser (YSI1 1500 Sport, Yellow time to complete the second lap of the outdoor time
Springs Instruments, Yellow Springs, OH). Follow- trial). The data for the four participants were then
ing the recommendations of the manufacturer, the superimposed onto one graph and through inspec-
analyser was calibrated before each batch with tion 15 stages with different durations and %HRmax
standard solutions of known lactate concentrations values were identified as being typical for all four
4. 930 L. Prins et al.
participants. The %HRmax – PPO graphs that were As previously described (Myburgh, Viljoen, &
constructed after the peak power output test were Tereblanche, 2001), the Spin-Trainer was set to
then used to determine each individual’s corre- difficulty level 8 (a standardized electromagnetic
sponding %PPO for each of the 15 stages. The resistance), calibrated for each person’s body weight,
mean %PPO for the four participants was then and the wheel pressure was standardized at 70 psi for
calculated for each of the 15 stages. As one all participants. The test – retest reproducibility for a
participant completed the time trial with great 20-km time trial for 12 individuals who were
difficulty, we decided to reduce the intensities of previously accustomed to the equipment was 0.9%
the recovery stages to create ‘‘resting periods’’ more (coefficient of variation) in our laboratory (unpub-
similar to those a mountain biker would experience lished data). For 13 other individuals who were just
when going downhill, but which were not reflected accustomed to the equipment, the coefficient of
immediately in the participant’s heart rate. The variation for a 5-km time trial was 0.6% (unpub-
average time it took for the participants to complete lished data). For the latter participants, the correla-
the second lap of the outdoor time trial was 26 min tion between peak power output and 5-km time trial
and that was taken as the duration of the one-lap time was r ¼ 70.66 (unpublished data). One time
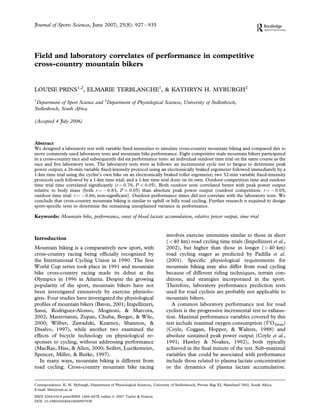
variable fixed-intensity protocol (Figure 1). trial was undertaken on its own (TT0) after a 5-min
All participants performed one variable fixed- warm-up. The other three time trials were done
intensity bout simulating one lap and two variable within 30 s of finishing either the one- (TT1) or the
fixed-intensity bouts simulating two laps of the two-lap (TT2) variable fixed-intensity protocols. The
outdoor time trial on a calibrated cycle ergometer participants were requested to ride ‘‘as fast as
(Technogym Bikerace, Gambettola, Italy), relative to possible’’ and the times they achieved were used as
each individual’s peak power output. Heart rate was a performance measure. A 1-km time trial was
recorded using a downloadable heart rate monitor chosen because mountain biking seldom involves
(Accurex Plus, Polar Electro, Kempele, Finland). long stretches of sprints during cross-country com-
The average %HRmax for each stage was then plotted petition. The TT0 time trial would be representative
against time. Each variable fixed-intensity bout was of a sprint at the start of the race to obtain a
followed by a sprint time trial performance test (see favourable racing position, while TT1 and TT2
below for details). would be representative of either sprints to get past
other riders on the single track or sprints to the
finish.
Laboratory time trials
Each participant completed a total of four 1-km time
Data analysis
trials on separate occasions on a calibrated Spin-
Trainer (Techonogym, Gambettola, Italy) on which For descriptive between-participant comparisons
the participant’s own mountain bike was mounted. and within-participant comparisons, data are pre-
sented as the mean and standard deviation (s). Paired
t-tests were performed to compare the performance
times of the outdoor competition and outdoor time
trials. One-way analysis of variance (ANOVA) with
repeated measures was used to compare the mean
heart rates for the different laps of the outdoor time
trials and to compare the mean times for the different
laps of the outdoor competition. Paired t-tests were
performed to compare the mean heart rates of the
first laps of the different variable fixed-intensity
bouts. Thereafter, we compared the mean heart
rates of the second laps of the outdoor time trials
with the second lap of the second two-lap variable
fixed-intensity protocol, also using a paired t-test.
Significant differences revealed by the ANOVA were
further analysed using Tukey (HSD) post-hoc analy-
sis. Pearson’s correlation coefficients were calculated
to investigate the association between the different
time trials, race times, and metabolic variables for
Figure 1. One lap of the simulated cross-country mountain bike the total group. Then, 95% confidence limits for the
test consisting of a variable fixed-intensity protocol standardized correlation coefficients (r) were calculated using
for each individual. PPO ¼ peak power output. the methods of Hopkins (2000). The coefficient of
5. Mountain bike performance 931
variation (CV) was used to estimate the reproduci- (P 4 0.05) and they also correlated (r ¼ 0.79;
bility of the variable fixed-intensity bouts. The P 5 0.05). The onset of blood lactate accumulation
coefficient of variation was calculated using a two- occurred at a power output of 289+60 W, at
way ANOVA on the natural logarithm of the a power output relative to body mass of
variable, then transforming the within-participant _
4.0+0.7 W Á kg71, at 78.7+9.0% V O2max, and at
standard deviation using the following formula: 85.9+6.6% maximal heart rate.
CV ¼ 100(es 7 1), where e is the base of natural Only peak power output relative to body mass
logarithms (Schabort et al., 1998). Statistical sig- correlated with both outdoor competition and out-
nificance was set at P 5 0.05. door time trial time (Table II). Power output relative
to body mass at OBLA correlated with outdoor time
trial time only (Table II). Other variables that did not
Results correlate with outdoor competition were age
_
(r ¼ 0.12), body mass (r ¼ 0.07), absolute V O2max
Characteristics of the participants and outdoor _ O2max (r ¼ 70.59), absolute
(r ¼ 70.35), relative V
performance
power output at the onset of lactate accumulation
Physiological responses at maximal exercise (r ¼ 70.59), and peak power output (r ¼ 70.65).
and outdoor performance times for the eight Similarly, none of the above variables correlated with
participants are reported in Table I. There were the outdoor time trial time: age (r ¼ 0.24), body mass
no significant differences in lap times for laps 1 to _
(r ¼ 0.07), absolute V O2max (r ¼ 70.34), relative
4 (26:52+1:38, 26:19+1:57, 26:59+1:29, and V_ O2max (r ¼ 70.55), absolute power output at the
26:53+1:39 min:s, respectively; P 4 0.05) of the onset of lactate accumulation (r ¼ 70.66), and peak
outdoor competition. power output (r ¼ 70.67).
Both maximal RER and maximal blood lactate
concentration indicate that maximal efforts were
1-km time trials
achieved. No difference was found between outdoor
competition and outdoor time trial performance The reproducibility of both 1-km time trial tests after
the two-lap variable fixed-intensity protocol was
Table I. Participant (n ¼ 8) characteristics and outdoor perfor- good (CV ¼ 3.3%). For further analysis, the best
mances. of the two attempts was used. The group means for
1-km time trial performances for TT0, TT1, and the
Mean + s Range best of the two TT2 trials (hereafter called TT2B) are
Age (years) 28 + 5 20 – 35
shown in Figure 2.
Body mass (kg) 72.9 + 5.6 66 – 81 There were significant differences between the
Maximal heart rate 189 + 5 183 – 196 group means for performance time for the TT0
(beats Á min71) (83.4+5.2 s) and both TT1 (88.3+5.7 s) and TT2 B
_
V O2max (l Á min71) 4.65 + 0.64 3.70 – 5.68 (87.4+5.3 s) (P 5 0.05). There was no statistically
_
V O2max (ml Á kg71 Á min71) 63.6 + 5.7 56.1 – 72.8
significant difference between TT1 and TT2B. There
Peak power output (W) 372 + 37 314 – 446
Peak power output (W Á kg71) 5.1 + 0.4 4.5 – 5.7
was no correlation between any 1-km time trial
[La]max (mmol Á l71) 11.9 + 4.5 5.2 – 17.0 performance time and either outdoor competition or
Maximal RER 1.22 + 0.05 1.15 – 1.31 outdoor times times, although better r-values were
Outdoor competition 106:47 + 6:43 99:06 – 120:49 seen for TT2 and the best of the two TT2 trials
time (min:s) (i.e. TT2B) (Table III).
Outdoor time trial 109:00 + 4:41 99:46 – 116:00
time (min:s)
In addition, we determined whether there was a
relationship between either outdoor competition or
Note: [La]max, maximal blood lactate concentration. outdoor time trial time and the decrement in 1-km
Table II. The relationship between outdoor performances and different laboratory power output variables (95% confidence limits in
parentheses).
Outdoor competition time (min:s) P-value Outdoor time trial time (min:s) P-value
PPO (W) r ¼ 70.65 (70.93 to 0.10) N.S. r ¼ 70.66 (70.93 to 0.08) N.S.
PPO (W Á kg71) r ¼ 70.83 (70.97 to 70.30) 50.05 r ¼ 70.83 (70.97 to 70.30) 50.05
PO at OBLA (W) r ¼ 70.56 (70.91 to 0.24) N.S. r ¼ 70.67 (70.93 to 0.07) N.S.
PO at OBLA (W Á kg71) r ¼ 70.64 (70.93 to 0.12) N.S. r ¼ 70.74 (70.95 to 70.07) 50.05
Note: PPO ¼ peak power output; OBLA ¼ onset of blood lactate accumulation; PO at OBLA ¼ power output at a blood lactate concentration
of 4 mmol Á l71; N.S. ¼ non-significant.
6. 932 L. Prins et al.
time trial performance (DTT) when comparing (87.9+6.1% vs. 89.3+4.3%; P 4 0.05). The clearly
either TT1 or TT2B with TT0 (e.g. TT1 7 demarcated differences in exercise intensity for the
TT0 ¼ DTT1). No significant relationships were stages of the variable fixed-intensity protocol
observed between outdoor competition performance (Figure 1) are not reflected by the group mean
and DTT1 (r ¼ 0.43, non-significant) or DTT2B %HRmax profiles for the variable fixed-intensity
(r ¼ 0.38, non-significant). Even poorer r-values protocol or the outdoor time trial (Figure 3).
were seen for the relationship between outdoor time However, the reproducibility of %HRmax between
trial time and DTT1 (r ¼ 0.04, non-significant) or the first and second two-lap variable fixed-intensity
DTT2B (r ¼ 0.29, non-significant). protocol was estimated by comparing the coefficient
of variation for heart rate at each stage. The
coefficient of variation for all stages ranged from
Heart rate monitoring
1.0 to 4.1 (mean CV for all stages was 2.0).
The mean exercise intensity (expressed as a percen-
tage of HRmax) for the outdoor time trial was
Discussion
88.4+0.6%. There were no significant differences
in mean heart rate (expressed as a percentage of In this study, mountain bikers took part in a
HRmax) for laps 1 to 4 of the outdoor time trial competitive race and subsequently also completed
(88.3+6.0%, 89.3+4.3%, 88.3+3.8%, and an outdoor time trial over the same course, as well as
87.8+5.1% respectively; P 4 0.05). other laboratory tests. The main finding of the study
Figure 3 shows that there was no significant was that both outdoor competition and outdoor time
difference in mean heart rate (expressed as a trial performances were better related to peak power
percentage of HRmax) between the second lap of output in relation to body mass than to absolute peak
the second two-lap variable fixed-intensity protocol power output or any other physiological variable, or
and the second lap of the outdoor time trial performance in laboratory tests.
Participants
The mountain bikers in our study had lower
absolute (4.65 vs. 4.86 l Á min71) and relative
_
(63.6 vs. 75.2 ml Á kg71 Á min71) V O2max values
than international high-standard mountain bikers
(Impellizzeri et al., 2002), but better relative
_
V O2max values than recreational off-road cyclists
(52.7 ml Á kg71 Á min71) (Mastroianni et al., 2000).
Their maximal power (372 W and 5.1 W Á kg71)
was also somewhat lower compared with cyclists
representing the US National Off-Road Bicycle
Association’s (NORBA) cross-country team
(420 W and 5.9 W Á kg71) (Wilber et al., 1997).
Several of the mountain bikers in our study only
competed in regional mountain bike competitions,
Figure 2. Performance times for 1-km time trials presented as while the NORBA and high-standard mountain
group means (+s) for time trials done on their own (TT0), after bikers were internationally competitive cyclists and
one (TT1) or after two laps of the variable fixed-intensity protocol. therefore we assume, better trained. Nevertheless,
Since the 1-km time trial after two laps of the protocol was
performed on two occasions, the best performance is presented the above data indicate that our participants
here (TT2B). Asterisks denote difference between time trials were competitive athletes rather than recreationally
(P 5 0.05). active cyclists.
Table III. The relationships between outdoor performances and performance times for the novel laboratory tests (95% confidence limits in
parentheses).
Outdoor competition time (min:s) P-value Outdoor time trial time (min:s) P-value
TT0 r ¼ 0.29 (70.52 to 0.83) N. S . r ¼ 0.24 (70.56 to 0.81) N.S.
TT1 r ¼ 0.53 (70.28 to 0.90) N. S . r ¼ 0.25 (70.55 to 0.81) N.S.
TT2B r ¼ 0.59 (70.20 to 0.91) N. S . r ¼ 0.46 (70.36 to 0.88) N.S.
Note: TT0 ¼ 1-km time trial from rested; TT1 ¼ 1-km time trial after one lap of the variable fixed-intensity protocol; TT2B ¼ 1-km time trial
after two laps of the variable fixed-intensity protocol (best of two tests); N.S. ¼ non-significant.
7. Mountain bike performance 933
Saris, & Wagenmakers, 1999). Not all of our
participants fitted the criteria for national elite
cyclists and it was therefore not unexpected that
varying abilities were observed. This was clearly
_
evident in the wide ranges of V O2max, age, and body
mass (Table I). Although V _ O2max is traditionally
regarded as an important determinant of endurance
performance (Coyle et al., 1988), neither absolute
_
nor relative V O2max (r ¼ 70.35 and r ¼ 70.59
respectively) correlated with outdoor performance
times.
It has been shown that the absolute peak power
output obtained during a maximal incremental cycle
test can be used as a predictor of performance in
endurance road cyclists (Coyle et al., 1991; Schabort,
Killian, St. Clair Gibson, Hawley, & Noakes, 2000)
Figure 3. Mean %HRmax for the second lap of the second two-lap _
variable fixed-intensity protocol (~) and the second lap of the
and that it is in fact a better predictor than V O2max
outdoor time trial (¤). (Hawley & Noakes, 1992). Schabort et al. (2000)
reported a high correlation (r ¼ 70.91; P 5 0.01)
between maximum power output during a progres-
Outdoor competition vs. outdoor time trial performance
sive incremental cycling test to exhaustion and
The outdoor competition and outdoor time trial performance time for 40-km cycling (n ¼ 10) during
were both completed over four laps of the same National Triathlon Championships. In the present
outdoor course. The only difference was that one study, the relationship between peak power output
was completed in a race with a mass start and the and both outdoor competition and outdoor time trial
other as an individual time trial. Despite the lack of performance (r ¼ 70.65 and r ¼ 70.66 respectively)
competition, there were no differences in the was not significant (P 4 0.05).
performances of mountain bikers during the outdoor On the other hand, Davison et al. (2000) found
competition and outdoor time trial (P 4 0.05). that the best predictor of hill climbing performance
Three participants performed better during the in road cycling was the mean power per unit of body
competition than the outdoor time trial, while the mass as tested during the Wingate test (r ¼ 70.90).
other five performed better in the outdoor time trial. Padilla et al. (1999) also found that uphill road
In mountain biking it is very important to obtain a cycling specialists competing in the Tour de France
good position at the start of the race, since there are had the highest power output relative to body mass
usually few chances of passing other riders, especially (tested during an incremental test) when compared
if the course consists of mainly ‘‘single-track’’. Other with cyclists who specialized in other areas, such as
factors that could prevent passing are the steepness flat terrain or time trials. Our results support these
of the hills and hazards such as rocks embedded in previous findings, as peak power output relative to
the track. Performing well in a race is therefore body mass (obtained during an incremental test)
dependent on fitness, technique, and clever strate- correlated better with both outdoor performances
gies to overcome these difficulties. These factors (r ¼ 70.83; P 5 0.05) than absolute peak power,
could explain why the relatively good relationship despite a relatively small sample size in our study.
(r ¼ 0.79; P 5 0.05) between the performance times This could indicate that mountain biking can be
of the two outdoor tests in our current study was not compared with uphill or hilly road cycling, but to a
even better. lesser extent with time trialling. Indeed, even out-
door time trialling on the mountain bike course did
not correlate better with outdoor competition than
Maximal exercise and other participant characteristics
did peak power output relative to body mass.
For prediction of performance, physiological vari- Higher correlations were obtained when power
ables can be expressed both in absolute terms and output at the onset of blood lactate accumulation was
relative to anthropometric variables. For example, expressed relative to body mass (r ¼ 70.74 for the
body mass and frontal area influence gravity-depen- outdoor time trial; P 5 0.05). This again stresses
dent or aerodynamic resistance (Padilla et al., 1999). the fact that mountain biking can be classified in the
Maximal oxygen uptake is commonly expressed same way as road cycling in hilly terrain in terms of
relative to body mass, but many authors have chosen the physiological requirements for good perfor-
to report absolute values (Febbraio & Koukoulas, mance. This finding could be important for cyclists
2000; Palmer et al., 1999; Van Loon, Jeukendrup, are yet to choose between road and off-road racing as
8. 934 L. Prins et al.
their specialty. If a cyclist has a particularly good
Evaluating the variable fixed-intensity protocol
power to weight ratio, this advantage might be more
clearly seen in mountain bike races. A finding that is Individual heart rates (expressed as a percentage of
more difficult to explain is the non-significant HRmax) between the two simulated two-lap variable
correlation between power output relative to body fixed-intensity protocols were reproducible when the
mass at the onset of blood lactate accumulation and coefficient of variation was calculated for each stage.
outdoor competition performance (r ¼ 70.64). The mean coefficient of variation of all the stages was
This could have arisen because competition perfor- 2.0%. This indicates that individual variation from
mance (as opposed to individual performance over day to day was minimal.
the same course) is influenced by the other compe- The heart rate response during the outdoor time
titors and tactical decisions related to the other trial was related to course profile, which is in line
competitors, which might be different from the with Fernandez-Garcıa and colleagues (Fernandez-
´ ´ ´
tactical decisions made when cycling alone. Garcıa, Terrados, Perez-Landaluce, & Rodrıguez-
´ ´ ´
Alonso, 2000), who recorded heart rate during stages
of the Tour de France and the Vuelta e Espana ˜
Less traditional testing
(albeit both road stage races). The mean heart rate
Laboratory-based testing in this study included a (88.4% HRmax) we observed for the outdoor time
variety of 1-km time trials (in the rested condition trial was comparable to the mean heart rate (90.0%
and after variable fixed intensities equivalent to one HRmax) of four international cross-country mountain
or two laps of the outdoor time trial course). A 1-km bike competitions (Impellizzeri et al., 2002). No
time trial takes 80 to 95 s to complete. Therefore, it difference was found between the %HRmax values for
is longer than a Wingate test, but a lot shorter than laps one to four of the outdoor time trial. Mean
other tests such as the incremental test to fatigue. %HRmax of lap four was slightly lower than for the
No correlation or trend was observed between the other laps, which could be due to slower completion
sprint done on its own and outdoor competition time of that lap and the effect of fatigue setting in.
performance. A difference was observed between Within each lap, %HRmax typically varied between
TT0 and both TT1 and TT2B (P 5 0.05). Sprinting 80 and 95% in both the outdoor time trial and the
in a race is never done on its own, but always in indoor variable fixed-intensity protocol (see Figure 3
conjunction with various other exercise intensities. for a representative example of one lap), indicating
Therefore, a sprint following varying-intensity bouts that the intensity did vary quite substantially from the
lasting about an hour could be a better representa- mean of 88%.
tion of a mountain biker’s racing ability. The The ideal way of designing a simulated variable
correlation between the sprint done after the two- fixed-intensity laboratory test would be to base the
lap variable fixed-intensity protocol and outdoor intensities on power output variations measured in
competition performance, although not significant the field (and the duration at each specific power
(r ¼ 0.59), was higher. It is possible that it could be a output). Although this technology is not yet widely
Type II error (see confidence limits in Table III), so used, it will benefit future research. Nevertheless,
with more participants it could be a meaningful heart rate during the variable fixed-intensity proto-
performance test. Sprint cycling has a high anaerobic col followed closely the same pattern as during the
component to ATP provision and promotes rapid outdoor time trial (Figure 3), despite more clearly
muscular fatigue, as evidenced by, for example, demarcated and abrupt changes in exercise inten-
typical power decrements seen in the 30-s Wingate sity for the variable fixed-intensity protocol (Figure 1).
test. We also used the decrement in 1-km time trial This could be explained by the relatively slow rate
performance between those tested in the rested of recovery for heart rate when exercise intensity
condition and those tests done after the variable was reduced. Therefore, our conclusions would
fixed-intensity tests to assess fatigability in our correspond with those of Gilman (1996), that heart
cyclists. Individual fatigability was, however, also rate does not always reflect energy utilization.
not related to outdoor competition or outdoor time Factors other than exercise intensity that could
trial performances. In contrast to our study, 1-km as influence heart rate include cardiac drift, dehy-
well as 4-km sprints were used by Schabort et al. dration, environmental factors, and competition
(1998). They designed a laboratory test of cycling stress. Also, although power output can drop
performance incorporating a series of sprints in a dramatically in a short time (e.g. when a steep
100-km time trial to evaluate its reproducibility. One downhill follows quickly after a steep uphill), the
of their conclusions was that laboratory protocols in heart rate response to the easier workload of
which participants are allowed freely to choose their downhill cycling may take some time to resolve due
effort might be more reliable than constant-load to the oxidative requirements of recovery from
exercise tests. anaerobic work.
9. Mountain bike performance 935
Hopkins, W. G. (2000). A new view of statistics. Internet Society for
Conclusions Sport Science (available at: http://www.sportsci.org/resource/stats/).
Impellizzeri, F., Sassi, A., Rodriguez-Alonso, M., Mognoni, P., &
The main finding of this study was that both outdoor Marcora, S. (2002). Exercise intensity during off-road cycling
competition and outdoor time trial performances competitions. Medicine and Science in Sports and Exercise, 34,
were better related to peak power output in relation 1808 – 1813.
to body mass than to absolute peak power output Jeukendrup, A., & Van Diemen, A. (1998). Heart rate monitoring
during training and competition in cyclists. Journal of Sports
(Table II). This indicates that mountain biking can
Sciences, 16, S91 – S99.
be placed in the same category as uphill or hilly road Kuipers, H., Verstappen, F. T. J., Keizer, H. A., & Guerten, P.
cycling. Also, peak power output in relation to body (1985). Variability of aerobic performance in the laboratory and
mass correlated as well with outdoor competition its physiological correlates. International Journal of Sports
performance as with individual outdoor time trial Medicine, 6, 197 – 201.
performance. This may indicate that the typical MacRae, H. S., Hise, K. J., & Allen, P. J. (2000). Effects of front
and dual suspension mountain bike systems on uphill cycling
incremental test to fatigue used for many years by performance. Medicine and Science in Sports and Exercise, 32,
sport scientists is sufficient to predict mountain bike 1276 – 1280.
performance and there is no need for a more sport- Mastroianni, G. R., Zupan, M. F., Chuba, D. M., Berger, R. C.,
specific laboratory test. On the one hand, the results & Wile, A. L. (2000). Voluntary pacing and energy cost of off-
of our study did not support our hypothesis that road cycling and running. Applied Ergonomics, 31, 479 – 485.
Mujika, I., & Padilla, S. (2001). Physiological and performance
parameters from our specific variable fixed-intensity characteristics of male professional road cyclists. Sports
protocol would correlate better with outdoor perfor- Medicine, 31, 479 – 487.
mances than parameters from an incremental test to Myburgh, K. H., Viljoen, A., & Tereblanche, S. (2001). Plasma
exhaustion. On the other hand, peak power output lactate concentrations for self-selected maximal effort lasting
per kilogram only explained about 70% of the 1 h. Medicine and Science in Sports and Exercise, 33, 152 – 156.
Padilla, S., Mujika, I., Cuesta, G., & Goiriena, J. J. (1999). Level
variance in mountain biking race performance in ground and uphill cycling ability in professional road cycling.
our participants. Therefore, future studies should Medicine and Science in Sports and Exercise, 31, 878 – 885.
design alternative performance-related tests that will Padilla, S., Mujika, I., Orbananos, J., Santisteban, J., Angulo, F.,
benefit our ability to predict mountain bike race & Goiriena, J. J. (2001). Exercise intensity and load during
performance. We suggest a shift in the focus of mass-start stage races in professional road cycling. Medicine and
Science in Sports and Exercise, 33, 796 – 802.
researchers studying the physiology of mountain Palmer, G. S., Borghouts, L. B., Noakes, T. D., & Hawley, J. A.
biking towards the design of less traditional, and (1999). Metabolic performance responses to constant-load vs.
more sport-specific, laboratory tests. variable-intensity exercise in trained cyclists. Journal of Applied
Physiology, 87, 1186 – 1196.
Palmer, G. S., Noakes, T. D., & Hawley, J. A. (1997). Effects of
steady-state versus stochastic exercise on subsequent cycling
References performance. Medicine and Science in Sports and Exercise, 29,
684 – 687.
Baron, R. (2001). Aerobic and anaerobic power characteristics of Schabort, E. J., Hawley, J. A., Hopkins, W. G., Mujika, I., &
off-road cyclists. Medicine and Science in Sports and Exercise, 33, Noakes, T. D. (1998). A new reliable laboratory test of
1387 – 1393. endurance performance for road cyclists. Medicine and Science
Coyle, E. F., Coggan, A. R., Hopper, M. K., & Walters, T. J. in Sports and Exercise, 20, 1744 – 1750.
(1988). Determinants of endurance in well-trained cyclists. Schabort, E. J., Killian, S. C., St. Clair Gibson, A., Hawley, J. A.,
Journal of Applied Physiology, 64, 2622 – 2630. & Noakes, T. D. (2000). Prediction of triathlon race time from
Coyle, E. F., Feltner, M. E., Kautz, S. A., Hamilton, M. T., laboratory testing in national triathletes. Medicine and Science in
Montain, S. J., Baylor, A. M. et al. (1991). Physiological and Sports and Exercise, 32, 844 – 849.
biomechanical factors associated with elite endurance cycling Seifert, J. G., Luetkemeier, M. J., Spencer, M. K., Miller, D., &
performance. Medicine and Science in Sports and Exercise, 23, Burke, E. R. (1997). The effects of mountain bike suspension
93 – 107. systems on energy expenditure, physical exertion, and time trial
Davison, R. C., Swan, D., Coleman, D., & Bird, S. (2000). performance during mountain bicycling. International Journal of
Correlates of simulated hill climb performance. Journal of Sports Sports Medicine, 18, 197 – 200.
Sciences, 18, 105 – 110. Sjodin, B., & Jacobs, I. (1981). Onset of blood lactate accumula-
¨
Febbraio, M. A., & Koukoulas, I. (2000). HSP72 gene expression tion and marathon running performance. International Journal
progressively increases in human skeletal muscle during of Sports Medicine, 2, 23 – 26.
prolonged, exhaustive exercise. Journal of Applied Physiology, Terblanche, E., Wessels, J. A., Stewart, R. I., & Koeslag, J. H.
89, 1055 – 1060. (1999). A computer simulation of free-range exercise in the
Fernandez-Garcıa, B., Terrados, N., Perez-Landaluce, J., &
´ ´ ´ laboratory. Journal of Applied Physiology, 87, 1386 – 1391.
Rodrıguez-Alonso, M. (2000). Intensity of exercise during
´ Van Loon, L. U. C., Jeukendrup, A. E., Saris, W. H. M., &
road race pro-cycling competition. Medicine and Science in Sports Wagenmakers, A. J. M. (1999). Effect of training status on fuel
and Exercise, 32, 1002 – 1006. selection during submaximal exercise with glucose ingestion.
Gilman, M. B. (1996). The use of heart rate to monitor the Journal of Applied Physiology, 87, 1413 – 1420.
intensity of endurance training. Sports Medicine, 21, 73 – 79. Wilber, R. L., Zawadzki, K. M., Kearney, J. T., Shannon, M. P.,
Hawley, J. A., & Noakes, T. D. (1992). Peak sustained power & Disalvo, D. (1997). Physiological profiles of elite off-road and
_
output predicts V O2max and performance in trained cyclists. road cyclists. Medicine and Science in Sports and Exercise, 29,
European Journal of Applied Physiology, 65, 79 – 83. 1090 – 1094.