Validity the 6MWT in simulated altitude within humans poster
Kerherve 2016 GNW peerj-2591
1. Submitted 13 May 2016
Accepted 21 September 2016
Published 27 October 2016
Corresponding author
Hugo A. Kerhervé,
hkerherv@usc.edu.au
Academic editor
Martin Daumer
Additional Information and
Declarations can be found on
page 10
DOI 10.7717/peerj.2591
Copyright
2016 Kerhervé et al.
Distributed under
Creative Commons CC-BY 4.0
OPEN ACCESS
Pacing during an ultramarathon running
event in hilly terrain
Hugo A. Kerhervé1
, Tom Cole-Hunter2,3
, Aaron N. Wiegand4
and
Colin Solomon1
1
School of Health and Sport Sciences, University of the Sunshine Coast, Sippy Downs, QLD, Australia
2
ISGlobal, Barcelona Institute for Global Health, Barcelona, Spain
3
Department of Environmental and Radiological Health Sciences, Colorado State University, Fort Collins, CO,
United States
4
School of Science and Engineering, University of the Sunshine Coast, Sippy Downs, QLD, Australia
ABSTRACT
Purpose. The dynamics of speed selection as a function of distance, or pacing, are used
in recreational, competitive, and scientific research situations as an indirect measure
of the psycho-physiological status of an individual. The purpose of this study was
to determine pacing on level, uphill and downhill sections of participants in a long
(>80 km) ultramarathon performed on trails in hilly terrain.
Methods. Fifteen ultramarathon runners competed in a 173 km event (five finished
at 103 km) carrying a Global-Positioning System (GPS) device. Using the GPS data,
we determined the speed, relative to average total speed, in level (LEV), uphill (UH)
and downhill (DH) gradient categories as a function of total distance, as well as the
correlation between overall performance and speed variability, speed loss, and total
time stopped.
Results. There were no significant differences in normality, variances or means in the
relative speed in 173-km and 103-km participants. Relative speed decreased in LEV,
UH and DH. The main component of speed loss occurred between 5% and 50% of
the event distance in LEV, and between 5% and 95% in UH and DH. There were no
significant correlations between overall performance and speed loss, the variability of
speed, or total time stopped.
Conclusions. Positive pacing was observed at all gradients, with the main component of
speed loss occurring earlier (mixed pacing) in LEV compared to UH and DH. A speed
reserve (increased speed in the last section) was observed in LEV and UH. The decrease
in speed and variability of speed were more important in LEV and DH than in UH.
The absence of a significant correlation between overall performance and descriptors
of pacing is novel and indicates that pacing in ultramarathons in trails and hilly terrain
differs to other types of running events.
Subjects Kinesiology
Keywords Performance, Global positioning system, Digital elevation model, Running, Elevation
gain and loss
INTRODUCTION
The dynamics of speed during self-paced locomotor exercise, or pacing, are used in
recreational, competitive and scientific settings as an indicator of exercise intensity
How to cite this article Kerhervé et al. (2016), Pacing during an ultramarathon running event in hilly terrain. PeerJ 4:e2591; DOI
10.7717/peerj.2591
2. (Abbiss & Laursen, 2008), and fatigue (Knicker et al., 2011). Three general types of pacing
(negative, even, positive) are commonly identified in the analysis of running performance,
using the direction of the changes in time per km or speed, as a function of distance or
exercise duration. Events longer than the marathon (ultramarathon, UM) are increasingly
popular in recreational and competitive settings and are increasing being used in scientific
research. However, there is a relative paucity of systematic descriptions of pacing in
long (>80 km) UM, especially those performed on trails and in hilly or mountainous
terrain, which could be due to the difficulties associated with the monitoring of individual
participants in remote areas and over long durations.
Positive pacing (decreasing speed) and a subset of positive pacing including a final
end-spurt referred to as parabolic pacing (Abbiss & Laursen, 2008), were observed in UM,
such as during a short (45 km) trail UM in recreational runners (Angus & Waterhouse,
2011), a 100 km event on a level, multi-loop course in elite runners (Lambert et al., 2004),
a 105 km mountain trail UM in competitive runners (Kerhervé, Millet & Solomon, 2015),
and a 161 km mountain trail UM in the five fastest runners over a 28 year period (Hoffman,
2014). Positive pacing has also been observed in other forms of ultra-endurance exercise,
such as a 24 h treadmill run (Gimenez et al., 2013), or during an ultra-endurance triathlon
event consisting of ten consecutive Ironman distance triathlons (10 × 3.8 km swimming,
180 km cycling, 42 km running) in 10 days (Herbst et al., 2011). Pacing is also characterised
by the magnitude of speed loss and the variability of speed (using the coefficient of variation
of speed), which were found to be lower in faster compared to slower participants during
UM running events (Lambert et al., 2004; Hoffman, 2014), in agreement with what has
been observed in events up to the marathon distance (Ely et al., 2008; Haney & Mercer,
2011).
In contrast to these findings, we measured in a previous study on trained UM runners
a higher magnitude of speed loss in faster compared to slower runners, no significant
relationship between the variability of speed and performance level, and a novel significant
negative relationship between the total time stopped and performance level, in a long
mountain UM (Kerhervé, Millet & Solomon, 2015). Additionally, speed on level, uphill and
downhill sections increased in the last 10% of the event. These results indicate that pacing
may have been regulated conservatively in anticipation of topographic difficulties, and
that faster runners paced less conservatively than slower runners. Overall, the literature
specific to UM and ultra-endurance exercise has highlighted the protective nature of fatigue
in situations where the physical integrity of participants could be compromised, such as
greater neuromuscular (Millet et al., 2011b) or biomechanical alterations (Morin et al.,
2011b) in events with large elevation gain and loss compared to UM events on level ground
(Martin et al., 2010; Morin, Samozino & Millet, 2011a).
Therefore, the aim of this study was to record the individual pacing of participants in a
long trail UM in hilly terrain, in order (i) to measure the dynamics of speed selection as a
function of terrain (level, uphill and downhill sections), and (ii) to further investigate the
relationship between performance and pacing characteristics (speed loss, speed variability,
total time stopped). Speed was expected to decrease in all participants and at all gradients
as a function of the distance and duration of the event.
Kerhervé et al. (2016), PeerJ, DOI 10.7717/peerj.2591 2/13
3. METHODS
This study was approved by the university research ethics committee (Queensland
University of Technology, project 0900001233). The study participants were recruited
using advertisements on a specialised forum and researchers networks, from individuals
already registered to compete in the Great North Walk 100s (NSW, Australia), a long
(∼173 km) and hilly UM running event including 6 checkpoints and a total elevation gain
and loss of approximately 3,000 m. This event offered the opportunity to receive an official
classification and time for participants failing to complete the entire event if they reached the
4th checkpoint at ∼103 km, which we included in the study. Both distances are presented
in this article as 173-km and 103-km. After providing written informed consent, 19
participants were equipped with a commercially-available Global Positioning System (GPS)
device (BT-Q1000; Qstarz International, Taipei, Taiwan) fitted to their clothing or pack.
The GPS devices used in this study were selected for their light weight (∼100 g including
the battery) and long battery life (tested to record for more than 40 continuous hours at
a sampling rate of 0.2 Hz). The accuracy of measures of geographical position and speed
were tested following published procedures (Townshend, Worringham & Stewart, 2008).
Positional accuracy was found to be within the range provided by the manufacturer (100%
of measures within 3 m of a known geodetic survey landmark, 84.5% of observations
measured within 2 m, and had a mean distance of 1.57 ± 0.43 m). The calculated velocity
(see following section) was found to be in excellent agreement (95% limits of agreement =
0.24 ± 0.12, typical error expressed as a % of CV = 1.2, standardized error of the estimate
= 0.03 km h−1) and perfectly correlated to speed determined using chronometry over a
known distance (100 m) over 50 trials (r = 1.00, p < 0.001).
Distance and Speed
The distance between points at the surface of a sphere can be calculated using simple
spherical trigonometry. However, the earth is not a sphere, but an oblate spheroid akin
to an ellipsoid with the following dimensions: equatorial radius ≈6,378.13 km, polar
radius ≈6,356.752 314 245 km and flattening f ≈1/298.257223563 (Defense Mapping
Agency, 1990). The calculation of point to point distances at the surface of an ellipsoid
can be improved compared to spherical trigonometry using the inverse Vincenty formulae
(Vincenty, 1975). The point-to-point distances were obtained from an internet-based utility
(GPS Visualizer; http://www.gpsvisualizer.com) using geographical positions (latitude and
longitude). We found the distances obtained were in exact agreement (r = 1.00, p < 0.001)
with our preliminary measures of point-to-point distances using the Vincenty formulae
performed on 10 data sets. Therefore, we used the internet-based calculations of the
formulae as a simple and generalisable procedure to obtain point-to-point distances.
Point-to-point speed was subsequently calculated using the ratio of point-to-point
distances and time (one data point every 5 s) between each datum. Preliminary calculations
revealed that GPS devices did not discriminate for speeds slower than 1 km h −1
(0.28 m s−1 or 1.39 m in 5 s) based on the typical error in speed in a static position
(drift, when a device will record speed values due to the non geo-synchronous nature of
the constellation of satellites). At the other end of the speed spectrum, it was considered
Kerhervé et al. (2016), PeerJ, DOI 10.7717/peerj.2591 3/13
4. that speeds higher than 20 km h −1 (5.56 m s−1 or 27.8 m in 5 s) were not expected during
a long UM and originated in signal jamming (which can occur due to the signal from a
satellite being too weak which forces the ground based receiver to pair to another satellite).
These erroneous distance and speed data were assigned a value of zero, and all speed values
were then smoothed in order to further increase the signal-to-noise ratio. For smoothing,
a 9-pt weighted average was graphically compared with 3-pt and 15-pt weighted averages
and considered satisfactory as it provided a balanced sensitivity to individual observations
for slow and high speeds. This procedure limited the effect of signal drift and jamming
(higher distance and speed due to erroneous values). These procedures were sensitive to
periods of zero speed values, which corresponded to the location, via expected relative
distances, of checkpoints in the race.
Elevation changes
We used previously published procedures (Kerhervé, Millet & Solomon, 2015) to alleviate
the inaccuracies in GPS-based elevation (Townshend, Worringham & Stewart, 2008). The
online utility (GPS Visualizer; http://www.gpsvisualizer.com) was used to match the
recorded geographical positions (determined by latitude and longitude) to a DEM elevation
datum from the National Aeronautics and Space Administration (NASA) Shuttle Radar
Topography Mission (SRTM) database. As the resolution of DEM is relatively low for the
study of human locomotion (90 m, only the SRTM3 was available where the current study
was conducted), the procedure can create a series of steps when increasing or decreasing
elevation every time a contour line is crossed. Likewise, it can also mean that actual changes
in elevation are not detected when data points were recorded inside the same contour line.
In the absence of an existing method to reconstruct accurate elevation data, we applied the
same 9-point weighted average smoothing procedure we used in the speed data to calculate
more realistic elevation data. Gradient was then calculated as the change in elevation
divided by the horizontal distance between two points.
Variables and statistical analysis
The identification of relevant data was performed for each participant using official race
results, GPS time-stamps and variations of speed (increase or decrease) indicating changes
in position at the start and finish lines. Speed and gradient values were computed as a
function of relative distance for each participant, where total individual distance represents
100% of the distance completed for the 173-km, and 60% for the 103-km event participants.
Relative distance was used instead of the actual distance values because of the difference in
total distances across participants. The dynamics of speed were determined relative to each
participant’s average speed over the entire event (100%) in order to increase the relevance
of inter-individual comparisons. The mean relative speed values corresponding to level
(LEV; −2.5 to 2.5% gradient), uphill (UH; 2.5–100% gradient), and downhill (DH; −100
to −2.5% gradient) were computed in sections of 5% of the total distance completed, which
ensured a sufficient amount of data points in each section in the three gradient categories.
The minimal amount of data points within one section occurred at 25% of total distance
in the level gradient category (64 observations for one participant, which corresponded
Kerhervé et al. (2016), PeerJ, DOI 10.7717/peerj.2591 4/13
5. to 2.76 km for the participant), for an average number of observations in each gradient
category of 360 ± 98 (LEV), 439 ± 60 (UH) and 386 ± 67 (DH).
Weinitiallyassessed thenormality(Kolmogorov–Smirnovtest)and homogeneityofvari-
ances (Fisher’s F test) of the 173-km and 103-km participants for LEV, UH, DH, and overall
relative speeds. We then used independent t-tests to evaluate whether differences in relative
speed existed between the 173-km and 103-km participants in the same categories. Due to
varying lengths of data sets (173-km and 103-km distances), we investigated the dynamics
of speed within each gradient category using a one-way ANOVA on ranks (Kruskal–Wallis
test) and a pairwise multiple comparison (Dunn’s method) when required, to determine
and locate potentially significant differences between sections of relative distance.
The relationship between the level of performance (individual average speed) and the
variability of speed (coefficient of variation of speed), the magnitude of speed loss (slope of
the linear regression of speed over the entire event) and the total time stopped (assumed to
correspond to resting, eating, clothing and gear change, toilet, other), were assessed using
correlations. Assumptions of normality were first tested using a Shapiro–Wilk test, and
Pearson’s product-moment correlation was used to calculate each relationship.
All statistical analyses were performed using the computing program and its associated
packages R (R Development Core Team, 2015). The level of significance was set at p < 0.05.
RESULTS
The datasets from four participants were not included in the analysis, due to either not
completing the event, or discrepancies between official results and GPS data (difference in
finish time greater than 5%). A total of 15 GPS datasets were used for analysis (see Fig. 1):
ten participants completed the 173-km distance averaging 32.9 ± 3.6 h (range 26.5–36.3 h),
with a mean total distance of 173.0 ± 4.0 km (5.68 ± 1.51 km h−1), and five participants
completed the 103-km distance averaging 18.9 ± 2.3 h (range 15.6–21.1 h) with a mean
total distance of 101.9 ± 2.3 km (5.91 ± 1.48 km h−1). Weather conditions on race day
were dry (no precipitations), the temperatures ranged 14.9–22.8 ◦C at the start point,
10.2–29.1 ◦C at the 103-km checkpoint, and 11.4–26.8 ◦C at the finish line, respectively.
The initial testing for normality and homogeneity of variances did not reveal any
significant differences between 173-km and 103-km participants. There were no significant
differences in means in the relative speed of the 173-km and 103-km participants for
all categories of gradients (overall: F = −1.38,p = 0.17; LEV: F = −0.99,p = 0.32; UH:
−1.37,p = 0.18; DH: F = −0.27,p = 0.79). Therefore, all remaining analysis include the
173-km and 103-km participants.
Positive pacing was observed in all participants and in all gradient categories, except in
one participant in negative gradients. The mean decrease in speed was −4.35 ± 3.0 km
h−1 (LEV), −2.26 ± 1.4 h−1 (UH), and −4.36 ± 2.2 h−1 (DH). Relative speed was the
most variable in LEV (coefficient of variation: 0.32) and reached a minimum at 50% of
total distance (significantly lower than all observations between 5% and 40%). The relative
speed increased from 50% to 60%, 85%, 90%, and 100%, and did not significantly decrease
between any sections before 50% and 100% (Fig. 2A). Relative speed was the least variable
Kerhervé et al. (2016), PeerJ, DOI 10.7717/peerj.2591 5/13
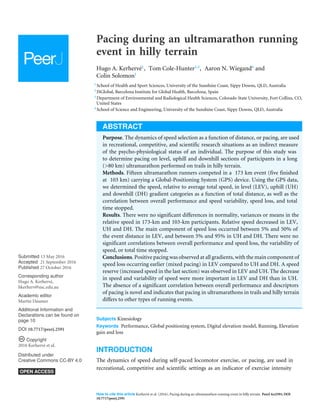
6. Figure 1 Elevation and speed. (A) Mean (SD) group DEM data from geographical positions. (B) Mean
(±SD) group calculated speed. Abbreviation: CP are official race checkpoints.
in UH (coefficient of variation: 0.22) and reached a minimum at 95% of total distance.
Relative speed increased from 35%, 40%, 45% and 50% to 60%. Relative speed increased
from 95% to 100%, which was not different to any other observation (Fig. 2B). Relative
speed in DH reached a minimum at 95% of total distance (coefficient of variation: 0.26).
The relative speed at 20% increased compared to 15%, but no other significant increase was
observed. The relative speed at 60% was not significantly different to any other observation,
and the relative speed at 100% was significantly lower than 5%, 10%, 15%, 20%, 30% and
35% (Fig. 2C).
There were no significant correlations between overall performance and variables of
pacing (Table 1). The dynamics of total time stopped as a function of relative distance are
presented in Fig. 3.
DISCUSSION
In this study, we collected and reported the longest systematic description of pacing of
runners in a long, hilly UM running event, using a method that created no disturbances to
normal running event situations.
The primary finding of this study was that positive pacing (overall decrease in speed)
was used in all gradient categories, with three direct observations. Firstly, the variability of
speed was higher in LEV, and, unlike in UH and DH, speed loss was the greatest in the first
half of the event. These observations are characteristic of a subset of the three main types
of pacing referred to as parabolic or mixed pacing, with a positive pacing strategy during
Kerhervé et al. (2016), PeerJ, DOI 10.7717/peerj.2591 6/13
7. Figure 2 Dynamics of speed. Group level (A), uphill (B), and downhill (C) speed relative to average, re-
spectively. Symbols * and brackets are used to denote and locate significant differences (p < 0.05).
Kerhervé et al. (2016), PeerJ, DOI 10.7717/peerj.2591 7/13
8. Table 1 Correlation between race performance and pacing characteristics.
All participants 103-km 173-km
r P r p r p
Speed variability −0.23 0.42 −0.24 0.70 −0.25 0.48
Speed loss −0.24 0.39 −0.43 0.47 0.00 1.00
Total time stopped −0.35 0.21 −0.15 0.81 −0.45 0.20
Figure 3 Total time stopped. Time stopped as a function of relative distance in all study participants, us-
ing the cumulated durations associated with speed <1 km h−1
.
the first half of the event, and more evenly pace for the remainder of the event. Secondly, a
speed reserve (increase in the last stage of an event) was measured in LEV and UH. Thirdly,
the decrease in speed was greater in DH and LEV compared to UH, and the decrease in
relative speed continued until the last section in DH only. Together, these findings clearly
indicate that despite slowing down overall, LEV, UH and DH were paced differentially.
A secondary finding of this study was that neither the characteristics of relative speed
(no significant differences in normality, variances or means), nor the characteristics of
pacing (no differences in speed loss, variability of speed or total time stopped) were
different in the 103-km and 173-km distances. This allowed us to compare the two groups
and increase the relevance of our findings, but this finding also introduces the possibility
that the additional ∼70 km did not significantly alter pacing in an ultramarathon performed
in hilly terrain.
Kerhervé et al. (2016), PeerJ, DOI 10.7717/peerj.2591 8/13
9. A recent study from our group also reported parabolic pacing during a 105 km mountain
UM, characterised by a decrease of speed at all gradient categories in the later stages of the
event (70–90% of total event duration), and by a final increase in speed in the last 10% of
the event (Kerhervé, Millet & Solomon, 2015). The presence of an increase in speed in the
last 10% section of the event was discussed as an indicator of conservative pacing strategies
in anticipation of upcoming topographic difficulties, and the use of a speed reserve (Millet,
2011) when the last topographic difficulty was passed. In the current study, both the
longer distance and smaller elevation gain and loss could potentially explain the absence
of a speed reserve in DH. Other research have noted the determinant role of elevation
gain and loss in the type and magnitude of fatigue on neuromuscular (Martin et al., 2010;
Millet et al., 2011b) and biomechanical alterations (Millet et al., 2011a; Morin et al., 2011b).
Alternatively, this finding could also potentially highlight the selective effects of fatigue as
a function of gradient category, specifically to limit the effect of the transmission of force
or vibrations to the musculo-skeletal systems, as previously indicated by the alteration of
running economy in LEV and DH gradient categories, but not in UH (Morin et al., 2011b;
Vernillo et al., 2015).
The absence of significant correlations between overall performance and indicators of
speed variability, speed loss and total time stopped are novel. While speed loss and total
time stopped were found to be significantly correlated with performance in a mountain
UM (Kerhervé, Millet & Solomon, 2015), speed loss and speed variability were found to be
significantly correlated with performance obtained in marathon (Ely et al., 2008; Haney &
Mercer, 2011) and UM (Hoffman, 2014; Lambert et al., 2004) running. Therefore, additional
research is required to determine if specific pacing characteristics are useful predictors of
performance in long UM, and whether other variables currently not measured could be
better predictors of pacing, including but variables of gait kinematics (stride frequency,
stride length, ground contact and aerial times) or gait biomechanics (leg and vertical
stiffness), which are known to be influenced by fatigue and gradient (Morin, Samozino
& Millet, 2011a; Morin et al., 2011b; Vernillo et al., 2016; Vernillo et al., 2015; Vernillo et
al., 2014). Additionally, it has been proposed that the correlation between the level of
performance and a more even pace is due to learning (Foster et al., 1994; Green et al., 2010),
and that the previous practice of a specific distance produces more even pacing (Ansley
et al., 2004; Green et al., 2010). However, ultra-endurance events require longer recovery
periods than shorter events and hence, the opportunities to practice a specific distance are
relatively less than for shorter events, which could partly explain both the relative lack of
data on longer events (Abbiss & Laursen, 2008), and the lack of a significant correlation of
these variables in the current study.
There were three direct limitations to this study. First, the findings related to the
variations of speed within sections of relative distance used binary results (different or
not), but do not provide an estimation of the magnitude of differences. A simple level
of analysis is not only acceptable, but also warranted, for the type of data used in this
study. Future studies are required to describe more accurately the direction and magnitude
of changes. Second, the inclusion of participants from both the 103-km and 173-km
distances could have implications for the results, due to any differences in a priori pacing
Kerhervé et al. (2016), PeerJ, DOI 10.7717/peerj.2591 9/13
10. strategies across the two distances, or information relative to the decision to stop for the
103-km group. For example, the five participants who had entered the 173-km event
and stopped at the 103-km distance might have done so due to an inappropriate pacing
strategy, or to a deliberate strategy. Irrespective, we reported the outcomes of pacing,
which incorporate both inappropriate and deliberate strategies, and provided evidence
that the general patterns of pacing did not differ across groups. Third, there are potential
carry-over effects at transitions between types of gradients during running (Townshend,
Worringham & Stewart, 2009). However, the spatial and temporal resolutions permitted
by non-differential GPS do not currently allow sufficient accuracy for this level of analysis
during UM events, and future studies using alternative methodologies are necessary to
investigate these effects.
CONCLUSION
In conclusion, in this study we determined the dynamics and characteristics of speed of UM
runners in an actual event, which provides a basis for future studies of ultra-long duration
exercise. While the speed of all participants decreased as a function of distance over the
entire event in all gradient categories, pacing was not comparable in those categories.
Finally, overall performance was not correlated to expected predictors of overall running
performance (variability of speed, speed loss), or to the total time stopped. Future studies
are required to study the dynamics of speed during multiple formats of UM, to determine
the effects of a priori pacing strategies, distance, and elevation gain and loss, on pacing. As
has been done in other ultra-endurance disciplines (Herbst et al., 2011), future studies are
also warranted to investigate the importance of variables related to participant experience
(number of years of practice, number of starts at a certain distance) in order to further
characterise pacing and performance in UM events.
ACKNOWLEDGEMENTS
The authors would like to thank Dr. Andrew Townshend for his valuable comments in the
conception of the study.
ADDITIONAL INFORMATION AND DECLARATIONS
Funding
There was no specific research funding for this project. General university (USC, QUT)
research funds and scholarships supported the project and two authors (HK: USC and
Queensland Education and Training; TC-H: Australian Postgraduate Award). The funders
had no role in study design, data collection and analysis, decision to publish, or preparation
of the manuscript.
Grant Disclosures
The following grant information was disclosed by the authors:
USC, QUT research funds.
Kerhervé et al. (2016), PeerJ, DOI 10.7717/peerj.2591 10/13
11. Australian Postgraduate Award: TC-H.
USC and Queensland Education and Training: HK.
Competing Interests
The authors declare there are no competing interests.
Author Contributions
• Hugo A. Kerhervé conceived and designed the experiments, analyzed the data, wrote the
paper, prepared figures and/or tables, reviewed drafts of the paper.
• Tom Cole-Hunter performed the experiments, wrote the paper, prepared figures and/or
tables, reviewed drafts of the paper.
• Aaron N. Wiegand analyzed the data, wrote the paper, prepared figures and/or tables,
reviewed drafts of the paper.
• Colin Solomon conceived and designed the experiments, performed the experiments,
analyzed the data, wrote the paper, prepared figures and/or tables, reviewed drafts of the
paper.
Human Ethics
The following information was supplied relating to ethical approvals (i.e., approving body
and any reference numbers):
Ethics committee of the Queensland University of Technology, project 0900001233.
Data Availability
The following information was supplied regarding data availability:
Datasets, R code and results are available at Figshare:
Kerherve H, Cole-Hunter T, Wiegand AN, Solomon S. 2016. Pacing during an
ultramarathon running event in hilly terrain. Figshare: https://dx.doi.org/10.6084/m9.
figshare.3369790.v1.
Supplemental Information
Supplemental information for this article can be found online at http://dx.doi.org/10.7717/
peerj.2591#supplemental-information.
REFERENCES
Abbiss CR, Laursen PB. 2008. Describing and understanding pacing strategies during
athletic competition. Sports Medicine 38:239–252
DOI 10.2165/00007256-200838030-00004.
Angus SD, Waterhouse BJ. 2011. Pacing strategy from high-frequency field data:
more evidence for neural regulation? Medicine and Science in Sports and Exercise
43:2405–2412 DOI 10.1249/MSS.0b013e3182245367.
Ansley L, Schabort E, St Clair Gibson A, Lambert MI, Noakes TD. 2004. Regulation of
pacing strategies during successive 4-km time trials. Medicine and Science in Sports
and Exercise 36:1819–1825 DOI 10.1249/01.MSS.0000142409.70181.9D.
Kerhervé et al. (2016), PeerJ, DOI 10.7717/peerj.2591 11/13
12. Defense Mapping Agency. 1990. Datums, ellipsoids, and grids reference systems
(Technical Manual 8358.1). Fairfax: US DoD.
Ely MR, Martin DE, Cheuvront SN, Montain SJ. 2008. Effect of ambient temperature on
marathon pacing is dependent on runner ability. Medicine and Science in Sports and
Exercise 40:1675–1680 DOI 10.1249/MSS.0b013e3181788da9.
Foster C, Schrager M, Snyder AC, Thompson NN. 1994. Pacing strategy and athletic
performance. Sports Medicine 17:77–85 DOI 10.2165/00007256-199417020-00001.
Gimenez P, Kerhervé H, Messonnier LA, Féasson L, Millet GY. 2013. Changes in the
energy cost of running during a 24-h treadmill exercise. Medicine and Science in
Sports and Exercise 45:1807–1813 DOI 10.1249/MSS.0b013e318292c0ec.
Green MJ, Sapp AL, Pritchett RC, Bishop PA. 2010. Pacing accuracy in collegiate
and recreational runners. European Journal of Applied Physiology 108:567–572
DOI 10.1007/s00421-009-1257-5.
Haney TAJ, Mercer JA. 2011. A description of variability of pacing in marathon distance
running. International Journal of Exercise Science 4: Article 6.
Herbst L, Knechtle B, Lopez CL, Andonie JL, Fraire OS, Kohler G, Rüst CA, Rosemann
T. 2011. Pacing strategy and change in body composition during a Deca Iron
triathlon. Chinese Journal of Physiology 54:255–263 DOI 10.4077/CJP.2011.AMM115.
Hoffman MD. 2014. Pacing by winners of a 161-km mountain ultramarathon.
International Journal of Sports Physiology and Performance 9:1054–1056
DOI 10.1123/ijspp.2013-0556.
Kerhervé HA, Millet GY, Solomon C. 2015. The dynamics of speed selection and psycho-
physiological load during a mountain ultramarathon. PLoS ONE 10:e0145482
DOI 10.1371/journal.pone.0145482.
Knicker AJ, Renshaw I, Oldham AR, Cairns SP. 2011. Interactive processes link the
multiple symptoms of fatigue in sport competition. Sports Medicine 41:307–328
DOI 10.2165/11586070-000000000-00000.
Lambert MI, Dugas JP, Kirkman MC, Mokone GG, Waldeck MR. 2004. Changes in
running speeds in a 100 km ultra-marathon race. Journal of Sports Science and
Medicine 3:167–173.
Martin V, Kerhervé H, Messonnier LA, Banfi J-C, Geyssant A, Bonnefoy R, Féasson
L, Millet GY. 2010. Central and peripheral contributions to neuromuscular fatigue
induced by a 24-h treadmill run. Journal of Applied Physiology 108:1224–1233
DOI 10.1152/japplphysiol.01202.2009.
Millet GY. 2011. Can neuromuscular fatigue explain running strategies and per-
formance in ultra-marathons? The flush model. Sports Medicine 41:489–506
DOI 10.2165/11588760-000000000-00000.
Millet GY, Banfi J-C, Kerhervé H, Morin J-B, Vincent L, Estrade C, Geyssant A, Féasson
L. 2011a. Physiological and biological factors associated with a 24 h treadmill ultra-
marathon performance. Scandinavian Journal of Medicine and Science in Sports
21:54–61 DOI 10.1111/j.1600-0838.2009.01001.x.
Kerhervé et al. (2016), PeerJ, DOI 10.7717/peerj.2591 12/13
13. Millet GY, Tomazin K, Verges S, Vincent C, Bonnefoy R, Boisson R-C, Gergelé L,
Féasson L, Martin V. 2011b. Neuromuscular consequences of an extreme mountain
ultra-marathon. PLoS ONE 6:e17059 DOI 10.1371/journal.pone.0017059.
Morin J-B, Samozino P, Millet GY. 2011a. Changes in running kinematics, kinetics, and
spring-mass behavior over a 24-h run. Medicine and Science in Sports and Exercise
43:829–836 DOI 10.1249/MSS.0b013e3181fec518.
Morin J-B, Tomazin K, Edouard P, Millet GY. 2011b. Changes in running mechanics
and spring–mass behavior induced by a mountain ultra-marathon race. Journal of
Biomechanics 44:1104–1107 DOI 10.1016/j.jbiomech.2011.01.028.
R Development Core Team. 2015. R: a Language and Environment for Statistical Com-
puting. Vienna: R Project for Statistical Computing. Available at https://www.r-
project.org/.
Townshend AD, Worringham CJ, Stewart IB. 2008. Assessment of speed and position
during human locomotion using nondifferential GPS. Medicine and Science in Sports
and Exercise 40:124–132 DOI 10.1249/mss.0b013e3181590bc2.
Townshend AD, Worringham CJ, Stewart IB. 2009. Spontaneous pacing during
overground hill running. Medicine and Science in Sports and Exercise 42:160–169
DOI 10.1249/MSS.0b013e3181af21e2.
Vernillo G, Giandolini M, Edwards WB, Morin J-B, Samozino P, Horvais N, Millet GY.
2016. Biomechanics and physiology of uphill and downhill running. Sports Medicine
Epub ahead of print DOI 10.1007/s40279-016-0605-y.
Vernillo G, Savoldelli A, Zignoli A, Skafidas S, Fornasiero A, Torre AL, Bortolan
L, Pellegrini B, Schena F. 2015. Energy cost and kinematics of level, uphill and
downhill running: fatigue-induced changes after a mountain ultramarathon. Journal
of Sports Sciences 33:1998–2005 DOI 10.1080/02640414.2015.1022870.
Vernillo G, Savoldelli A, Zignoli A, Trabucchi P, Pellegrini B, Millet GP, Schena F.
2014. Influence of the world’s most challenging mountain ultra-marathon on energy
cost and running mechanics. European Journal of Applied Physiology 114:929–939
DOI 10.1007/s00421-014-2824-y.
Vincenty T. 1975. Direct and inverse solutions of geodesics on the ellipsoid with applica-
tion of nested equations. Survey Review XXIII 23:88–93
DOI 10.1179/sre.1975.23.176.88.
Kerhervé et al. (2016), PeerJ, DOI 10.7717/peerj.2591 13/13