Effect of moisture stress timing and nitrogen on growth and yield of upland rice
•
1 like•1,147 views


Recommended
Recommended
More Related Content
Viewers also liked
Viewers also liked (11)
Recently uploaded
Recently uploaded (20)
Effect of moisture stress timing and nitrogen on growth and yield of upland rice
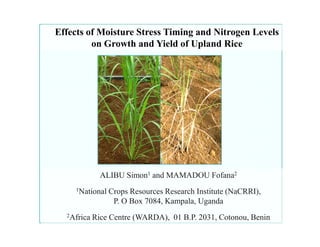
- 1. Effects of Moisture Stress Timing and Nitrogen Levels on Growth and Yield of Upland Rice ALIBU Simon1 and MAMADOU Fofana2 1National Crops Resources Research Institute (NaCRRI), P. O Box 7084, Kampala, Uganda 2Africa Rice Centre (WARDA), 01 B.P. 2031, Cotonou, Benin
- 2. INTRODUCTION Moisture stress and insufficient nitrogen are important factors that simultaneously limit growth and yield of upland rice These two factors have repeatedly been studied but little is known about their interactive effects on growth and yield when the timing of stress is varied. The main purpose of this study was to examine the interactive effects of nitrogen and water stress occurring at different growth stages of upland rice on phenology, grain yield, yield components and biomass production Knowledge of this is important for planning interventions like supplementary irrigation and fertilization in the context of Africa where rainfall patterns are erratic and fertilizer unaffordable.
- 3. MATERIALS & METHODS Experimental Layout: 2 Factor RCBD with 2 Replications Replication 1 Replication 2 Factors: 3 Nitrogen levels and 5 stress treatments + Control N Levels: 30 kg N ha-1, 60 kg N ha-1 and 90 kg N ha-1 60% applied as basal and 40% as topdress
- 4. STRESS TREATMENTS Sowing Maximum Tillering 10 DAH Active Tillering Early Vegetative 20 DAH 1 2 3 4 5 6 7 8 9 10 11 12 13 14 15 16 17 18 19 20 Weeks Aft er Sowing Control treatment (S-6) watered with 30 mm wk-1 Soil moisture stress initiated at 11 days, 32 days and 53 days after sowing for S-1, S-2 and S-3 respectively
- 5. DATA COLLECTION Plant height, tiller number, yield & yield component measurements Leaf area and dry matter measurements Tiller numbers plant height measured weekly from vegetative to heading and at harvest. On last day of stress, 3 hills harvested per plot to measure dry matter accumulation. Dry weight taken after drying at 70o c for 72 h. FreshWeight - Dry Weight LRWC = X 100 Turgid- DryWeight
- 6. MONITORING SOIL MOISTURE A Calibration curve was used to transform moisture meter readings to true soil moisture values Moisture Meter Callibration Curve 70 Moisture Meter Reading Moisture Meter 60 y = 0.6091x + 21.607 type HH2 R2 = 0.9464 http://www.delta- http://www.delta-t.co.uk 50 40 30 20 0 20 40 60 80 True Value Due to large variation in single point M.C readings within each box, average of 10 readings taken/box
- 7. RESULTS AND DISCUSSION Changes in volumetric water content 50 50 50 Early Veg. Stage Active Till. Stage Max. Till. Stage 45 45 45 40 40 40 35 35 35 Soil Water Content (%) 30 30 30 25 25 25 0 7 14 21 28 0 7 14 21 28 0 7 14 21 28 50 50 10 Days After Heading 20 Days After Heading 45 45 Volumetric soil water content 40 40 declined gradually from over 35 35 40% to less than 30% within 30 30 2 – 3 weeks 25 25 Changes in soil water status were 0 7 14 21 28 0 7 14 21 similar for all stress treatments Duration of Stress (Days) Control N-1 N-2 N-3
- 8. EARLY VEGETATIVE STAGE STRESS 100 89 87 88 80 77 Control Stressed 71 71 Moisture stress had a LRWC % 60 small effect on LRWC 40 20 Nitrogen had negligible 0 S W S W S W effect on LRWC N-1 N-2 N-3 Stress effects mild S: Stressed, W: Well watered Stress effects (leaf rolling & tip drying) developed slowly and occurred at lower soil moisture status than in older plants probably due to limited water requirements of rice at this stage. Dry matter production reduced by 44% because moisture stress inhibited formation of new leaves. LAI reduced by 82%. Plant height was not significantly affected by moisture stress and Nitrogen
- 9. ACTIVE TILLERING STAGE STRESS 100 90 89 91 80 Moisture stress LRWC % 62 considerably reduced 60 51 50 40 LRWC 20 0 Nitrogen had a minor S W S W S W effect on LRWC N-1 N-2 N-3 S: Stressed, W: Well watered Stress effects severe Stress effects developed quickly due to a Control Stressed large demand for transpiration water 140 Dry matter production was reduced by 37% 120 T i l l e rs m-2 because moisture stress prevented tillering. 100 LAI reduced by 50%. 80 60 Tillering was reduced by moisture stress at 40 higher N levels. 30 60 90 -1 Nitogen Level (Kg Ha )
- 10. Control Stressed MAXIMUM TILLERING STAGE STRESS 100 91 90 87 80 Moisture stress had a large effect on LRWC LRWC % 60 57 50 48 40 20 Increased N supply 0 decreased LRWC in the S W S W S W stressed rice plants N-1 N-2 N-3 S: Stressed, W: Well watered Stress effects appeared almost immediately after the onset of stress A high degree of leaf senescence was observed – signifying severity of the stress. Dry matter and LAI were reduced by 49% and 58% accordingly
- 11. GROWTH AFTER STRESS Crop Growth Rate (CGR) 0.08 0.08 S1 S2 S3 Crop growth rate (gg-1 Day -1) 0.07 0.07 S1 S2 S3 0.06 0.06 0.05 0.05 0.04 0.04 0.03 0.03 0.02 0.02 0.01 0.01 0.00 0.00 30 60 90 30 60 90 Nitrogen level (kg ha-1) -1 Nitrogen Level (kg ha ) Post stress crop growth rate was highest in S-1 and lowest in S-3 Raising N level to 60 kg ha-1 increased the CGR in S-1. Beyond 60 kg ha-1, CGR declined. N application reduced the CGR in S-2 and S-3 due to severity of soil moisture stress during active vegetative growth.
- 12. Tillering Rate 0.14 0.14 S1 S-1 Tillering rate (tiller tiller day ) -1 0.12 0.12 S-2 S2 S-3 -1 0.10 0.10 S3 0.08 0.08 0.06 0.06 0.04 0.04 0.02 0.02 0.00 0.00 30 60 90 30 60 90 -1 -1 Nitrogen level (Kg ha ) Nitrogen Level (kg ha ) Tillering rate was highest in S-1 and lower in S-2 and S-3 respectively. A high correlation (r = 0.946) found between tillering rate and CGR Raising N level to 60 kg ha-1 increased the tillering rate in S-1. Over 60 kg ha-1, the tillering rate declined. Low tillering rate in S-3 is because the maximum tiller number had already been attained at the onset of stress
- 13. Recovery After Stress Nitrogen application enhanced recovery in rice stressed at the early vegetative stage (S-1)
- 14. TIME TO HEADING S-3 S-2 S-1 Control DAS 90 92 94 96 98 100 102 104 106 108 110 112 114 116 118 120 122 124 126 : 10 % Heading : 50 % Heading : 80 % Heading Soil moisture stress in all the vegetative stages lengthened vegetative growth and subsequently delayed heading. Stress at early vegetative stage (S-1) delayed heading by 13 days. Stress at active tillering (S-2) and maximum tillering delayed heading by 16 and 19 days respectively. Time to heading was little affected by nitrogen application
- 15. YIELD AND YIELD COMPONENTS 3000 N1 N2 N3 Filled Grain Ratio (%) 90 80 F ille d G ra in R a tio (% )) 2500 70 Y ie ld (k g /h a )) 2000 60 50 1500 40 1000 30 20 500 10 0 0 S0 S1 S2 S3 S4 S5 Stage of Stress Moisture stress reduced grain yield averaged for N treatments Stress during grain filling reduced grain yield by 50% due to poor grain filling Stress at active tillering stage and maximum tillering reduced yield by 18% and 19% respectively
- 16. Yield components cont… Mean grain weight was reduced by 10% and 7% in S-4 and S-5 Moisture stress at maximum tillering reduced grains per panicle only slightly Yield difference between rice stressed in the early vegetative stage and control was negligible due extended recovery period after stress Conclusion N application caused greater growth reduction in rice stressed in the active vegetative stage (S-2 & S-3), despite causing minor yield increases. N found to be effective in boosting vegetative recovery in rice stress in early vegetative stage rather than later vegetative growth. Rice found to be most sensitive to moisture stress after heading due to poor grain filling. This underscores the importance of supplementary irrigation during grain filling in drought prone environments