Using Game-based Learning for University Success
•
0 likes•112 views

2016 Educause Annual Conference - Poster Session
Recommended

Recommended
More Related Content
What's hot
What's hot (20)
Similar to Using Game-based Learning for University Success
Similar to Using Game-based Learning for University Success (20)
Recently uploaded
Recently uploaded (20)
Using Game-based Learning for University Success
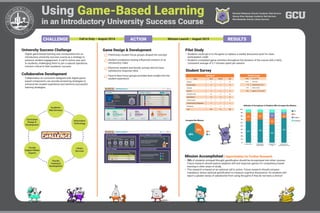
- 1. CHALLENGE ACTION RESULTS Using Game-Based Learning in an Introductory University Success Course Miranda Hildebrand, Director Academic Web Services Shanna Wise, Manager Academic Web Services Nita Mailander, Director Library Services Game Design & Development Preliminary student focus groups shaped the concept Student acceptance testing influenced creation of an introductory video Electronic student and faculty surveys did not have satisfactory response rates Face-to-face focus groups provided keen insight into the student experience University Success Challenge Digital game-based learning was incorporated into an introductory university success course as a strategy to enhance student engagement. A call to action was sent to students, challenging them to join a special operations mission critical to their academic success. Collaborative Development Collaboration on curriculum designed with digital game- based components can provide pioneering strategies to enhance the student experience and reinforce successful learning strategies. Pilot Study • Students could opt-in to the game to replace a weekly discussion post for class participation credit • Students completed game activities throughout the duration of the course with a fairly consistent average of 5.7 minutes spent per session Mission Accomplished | Opportunities for Further Research • 78% of students surveyed thought gamification should be incorporated into other courses. Future research should explore adaptive drill and response games for competency based learning in other areas of study. • This research is based on an optional call to action. Future research should compare mandatory versus optional gamification to measure cognitive dissonance. Do students still report a greater sense of satisfaction from using the game if they do not have a choice? Call to Duty – August 2014 Mission Launch – August 2015 Curriculum Design Development Faculty Subject Matter Experts Faculty Training Development Academic Web Services Library Services Information Technology Student Survey Accepted the Mission Student Usage ~4,000 total enrolled 31,617 total logins 18 average logins per user 1,775 profiles created 1,272 logged in 3 or more times By Degree Degree Opt-In Opt-Out Total Business 21 9 30 Christian Studies 5 2 70 Education 3 1 4 Fine Arts 9 3 12 Nursing/Pre-Med 38 12 50 Social Sciences 16 13 29 Exercise Science 9 7 16 Computer Science Engineering 3 1 4 No Response 5 3 8 Total: 109 51 160 68% 32% No Yes Attitudes Perceptions of Students Who Accepted the Mission 100% 90% 80% 70% 60% 50% 40% 30% 20% 10% 0% 9% 6% 6%16% 20% 54% 9% 9% 65% 82% 75% Continued Use Greater Sense of Satisfaction Increased Time on Task Increase Focus on Learning Outcomes Yes No No Impact No Response 21%26% 10% 10%