Download to read offline

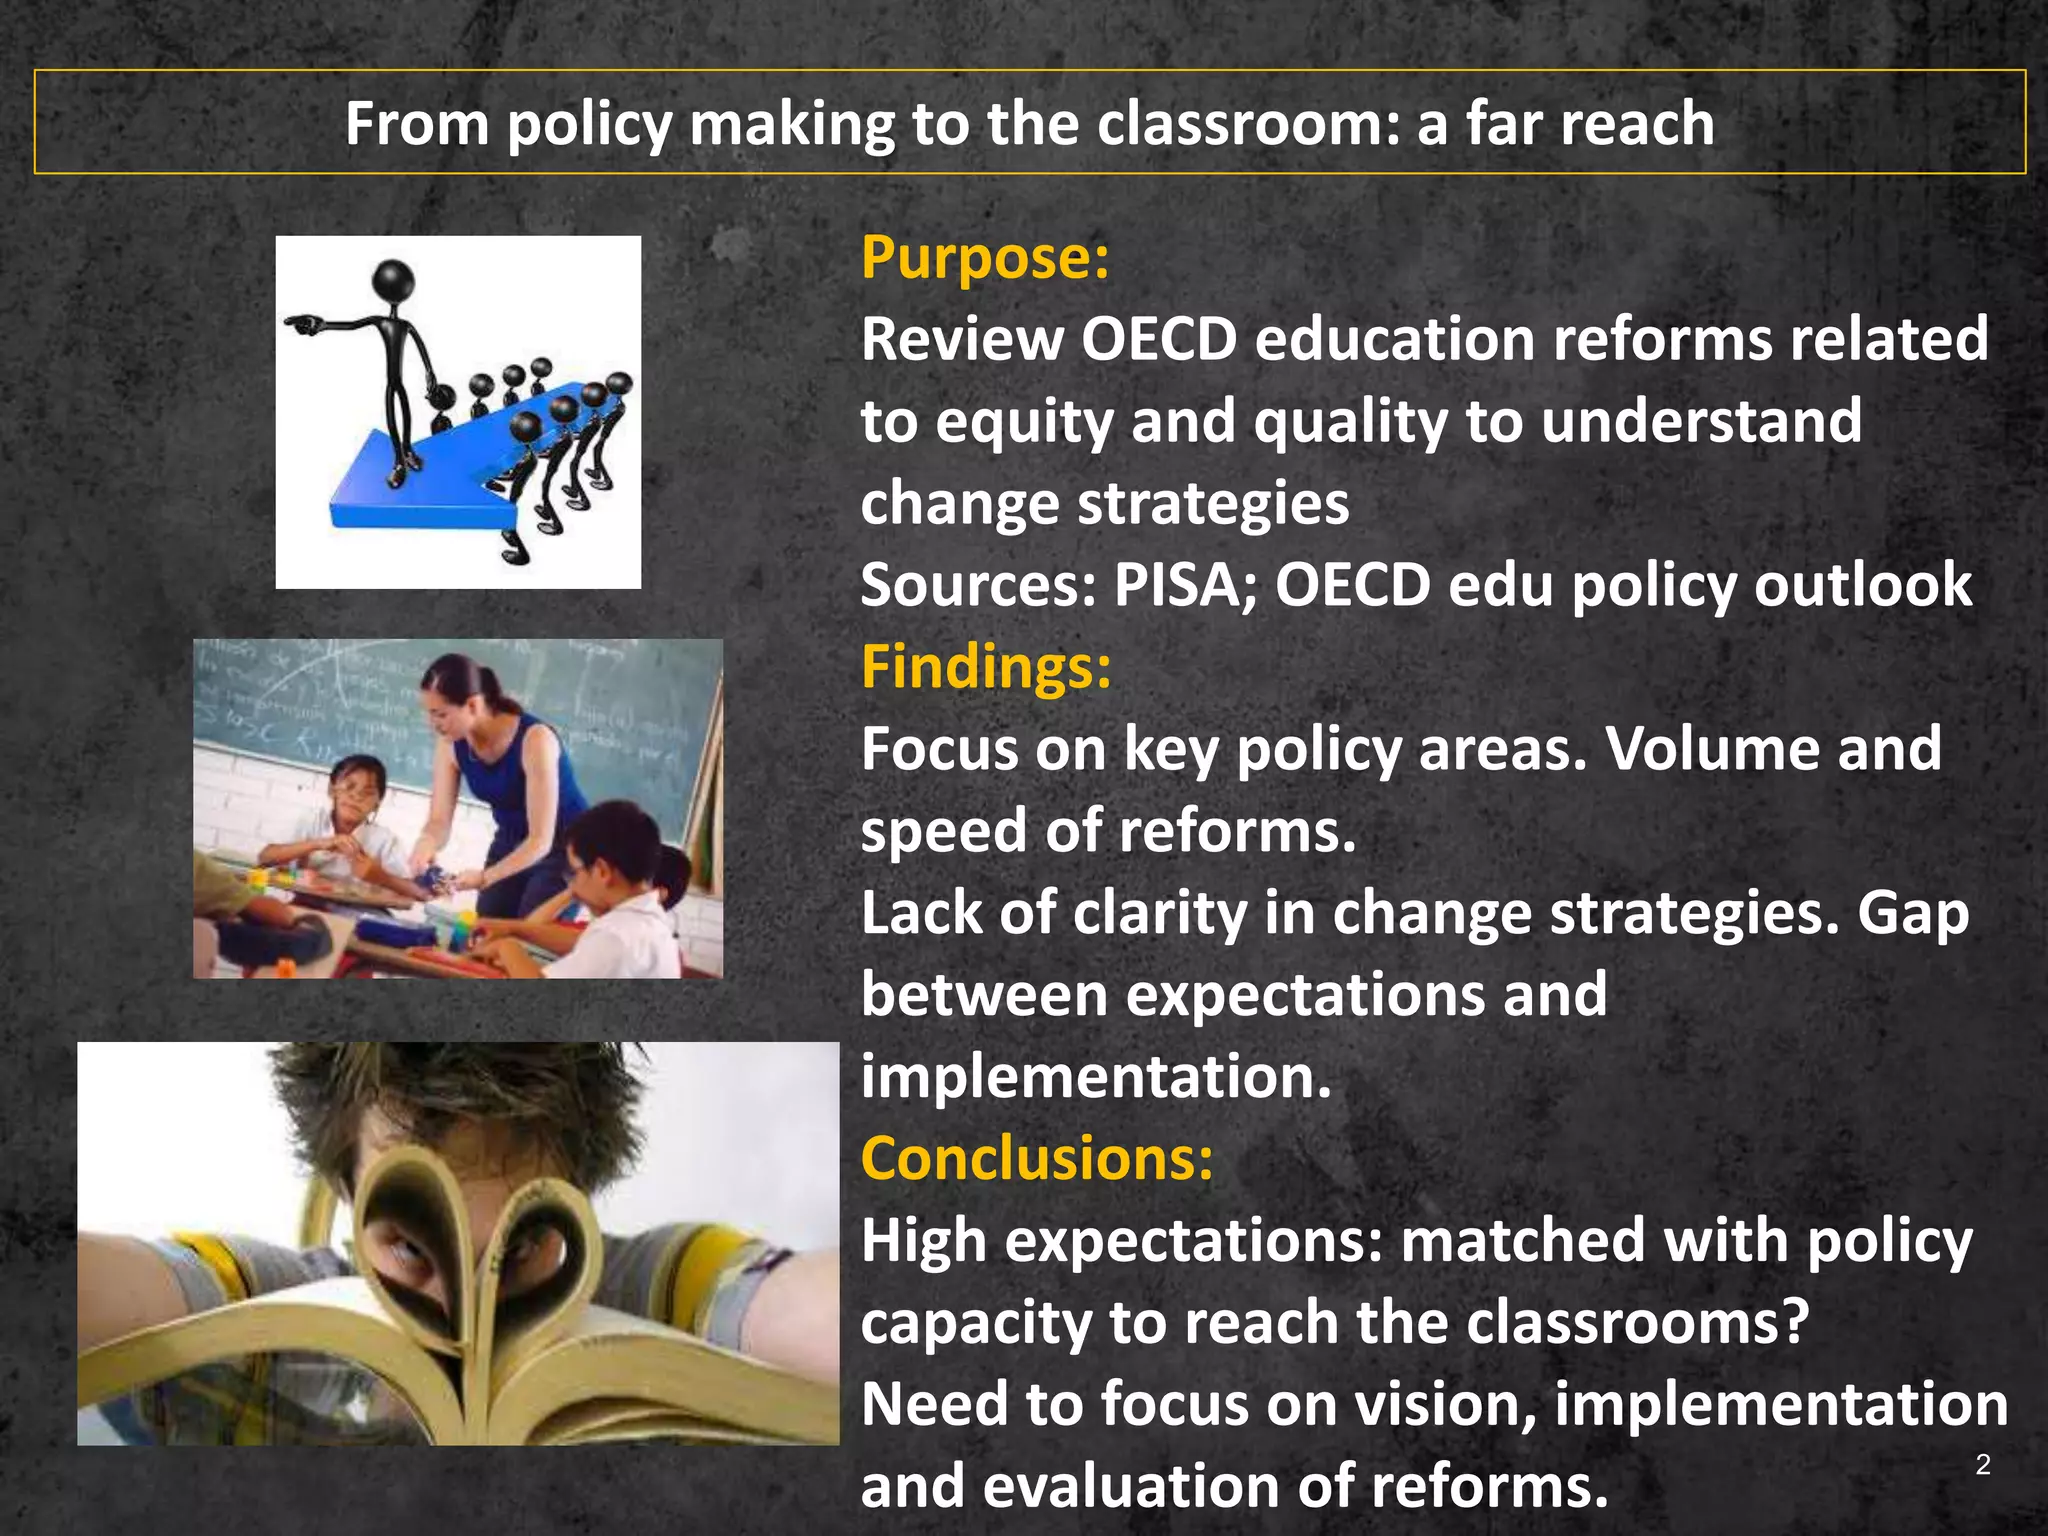
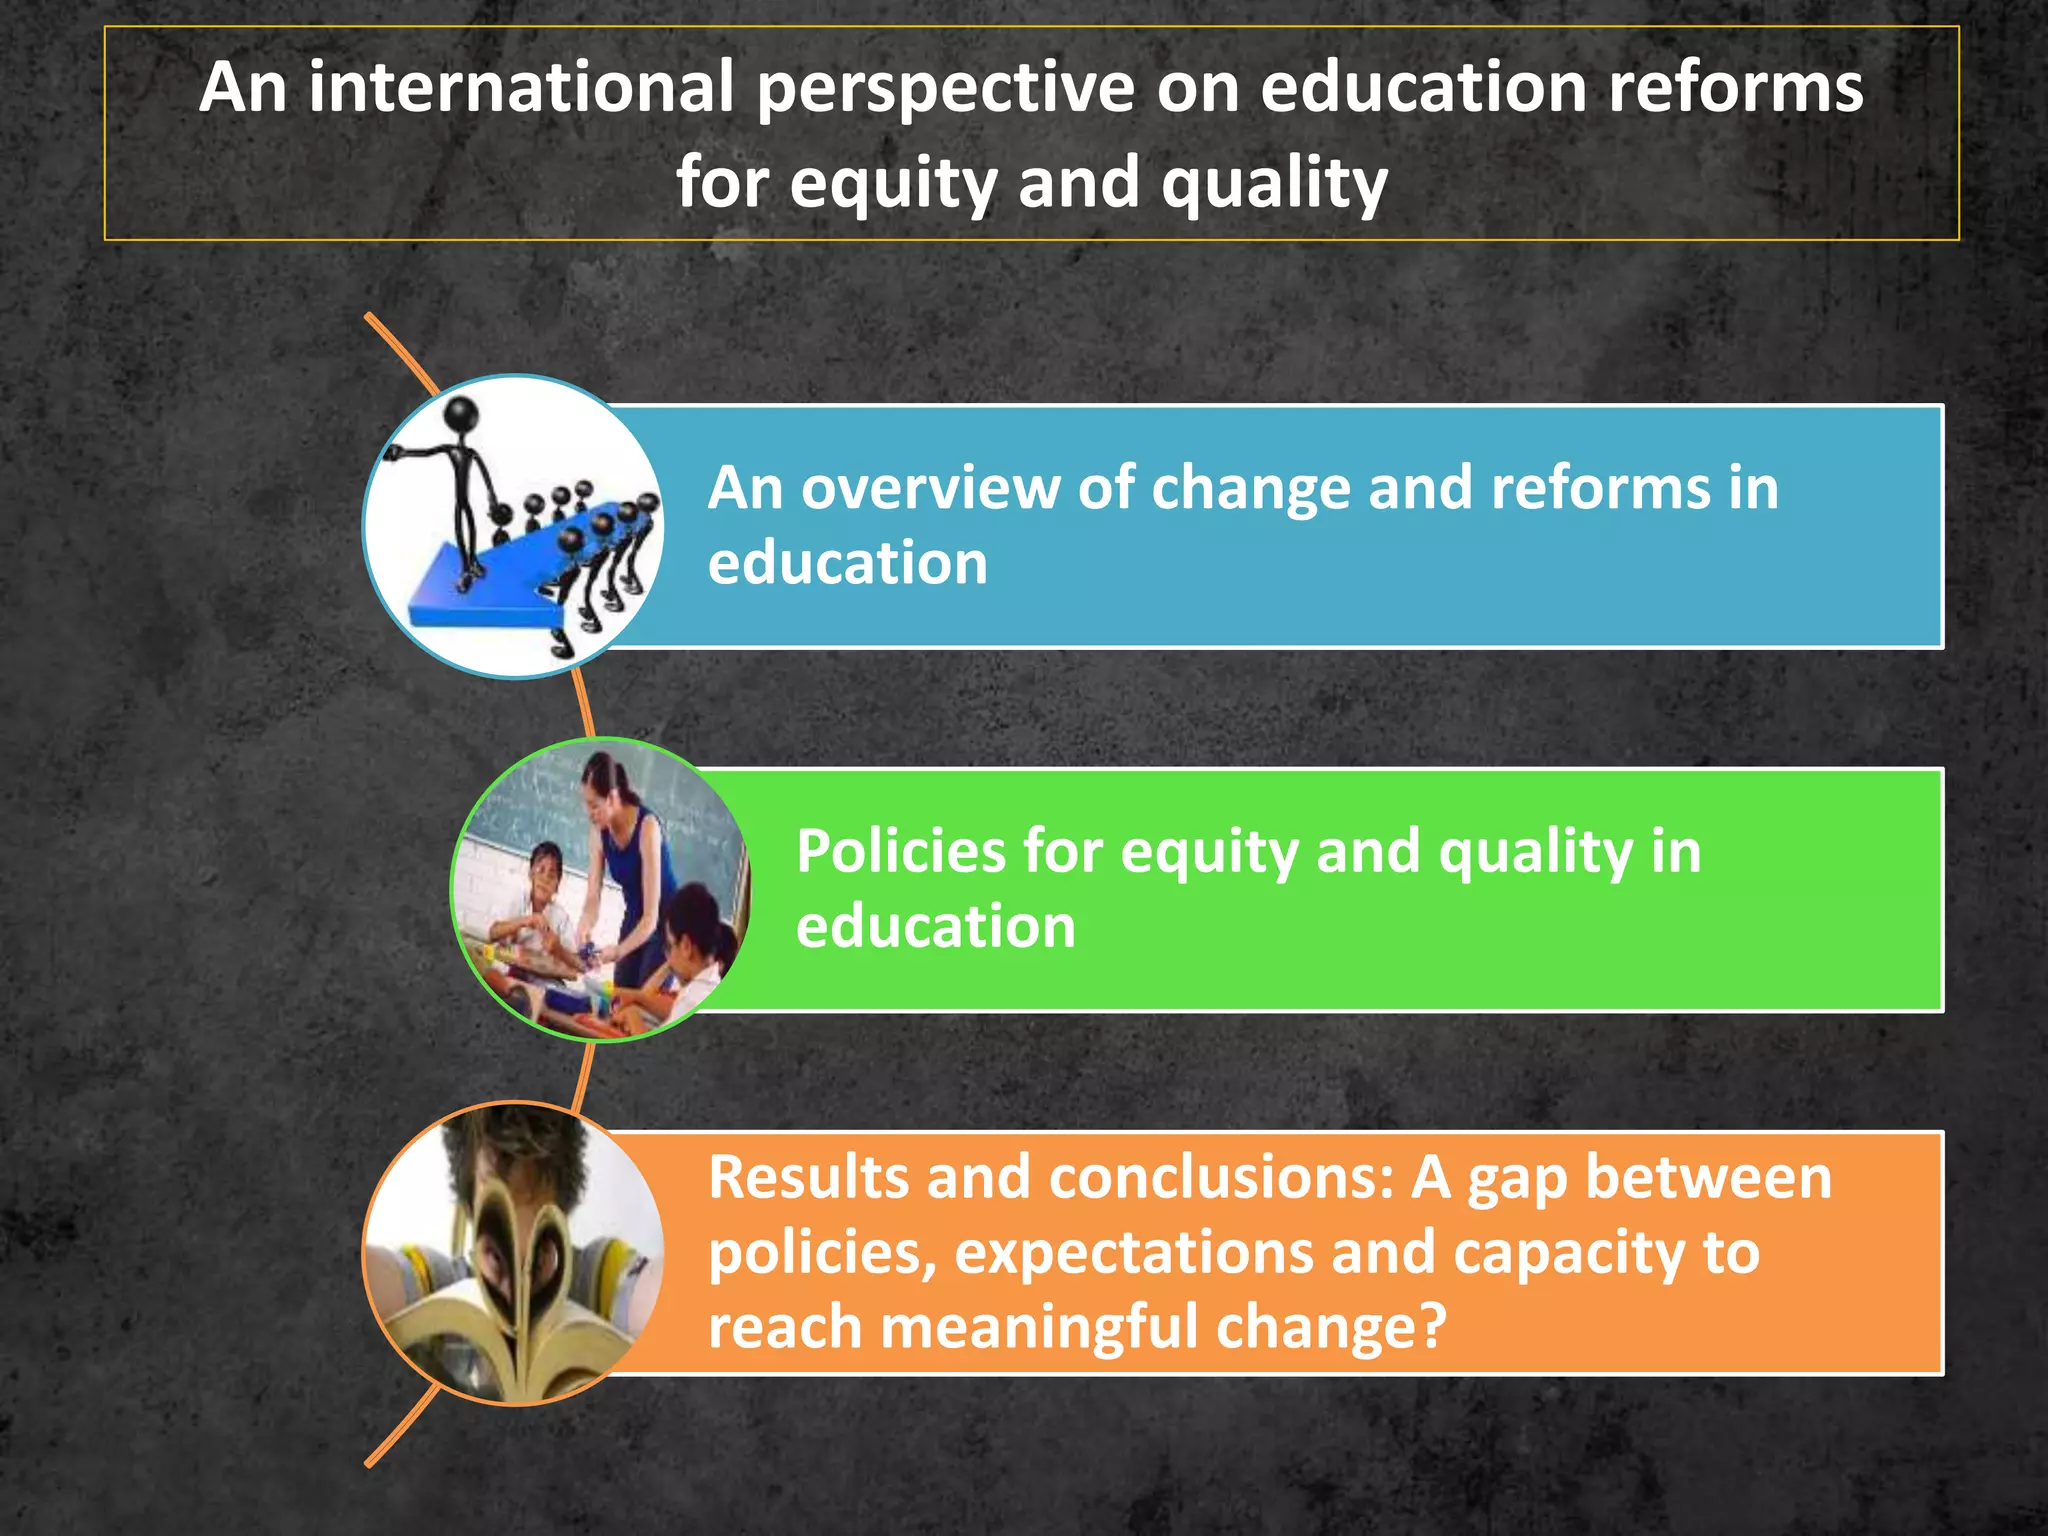
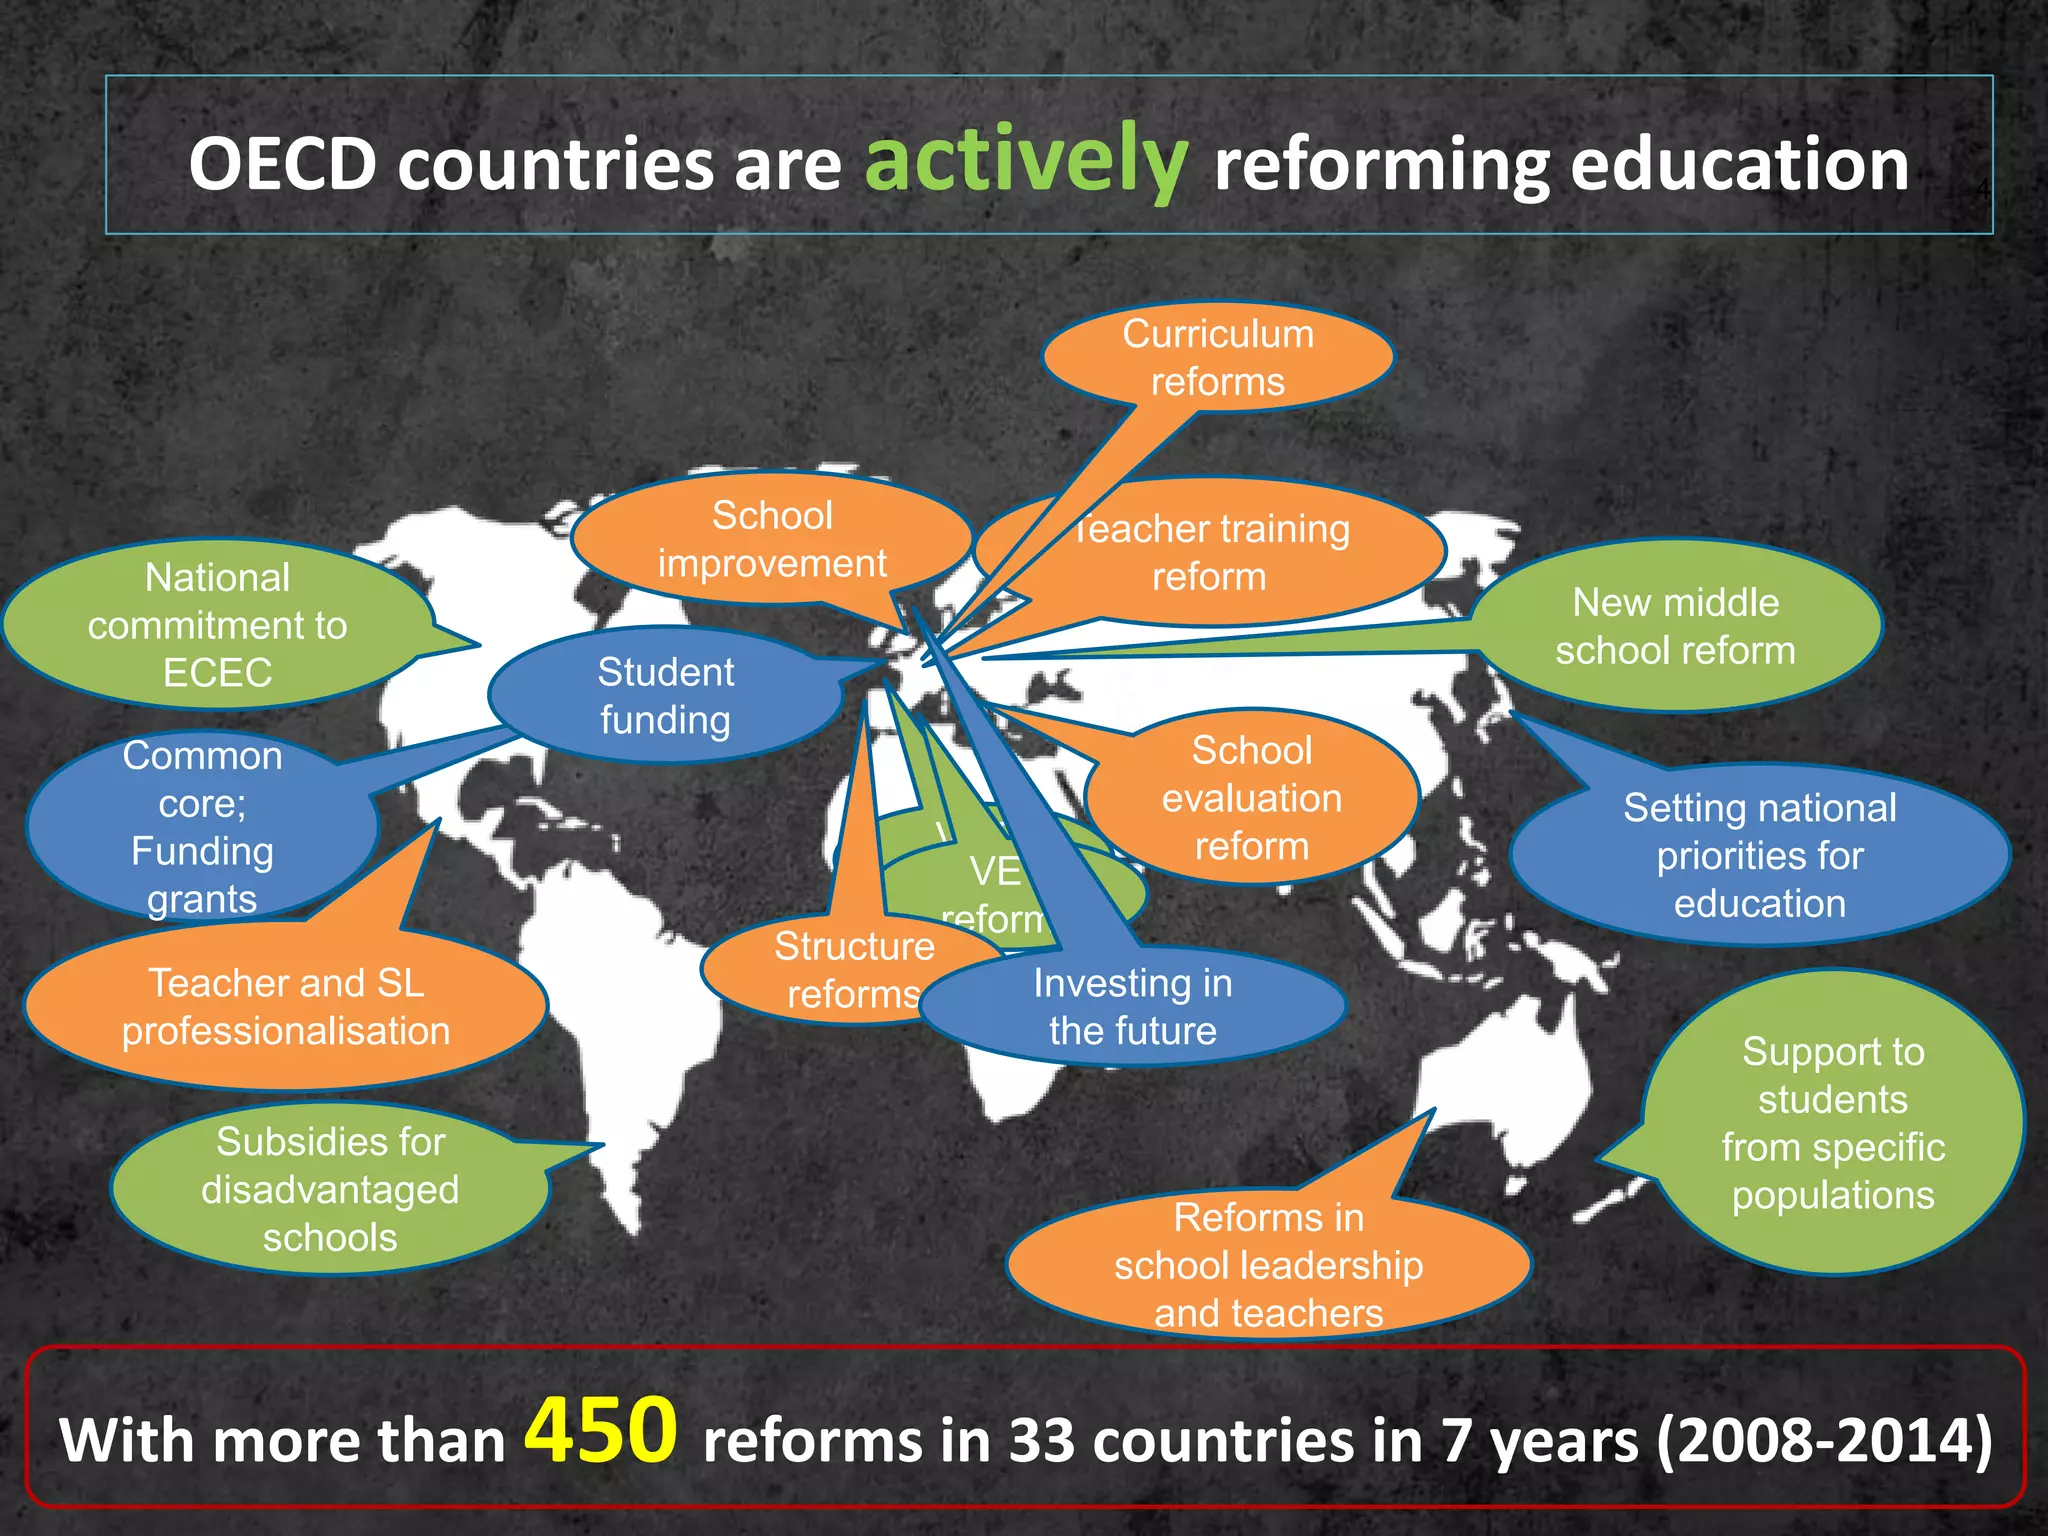
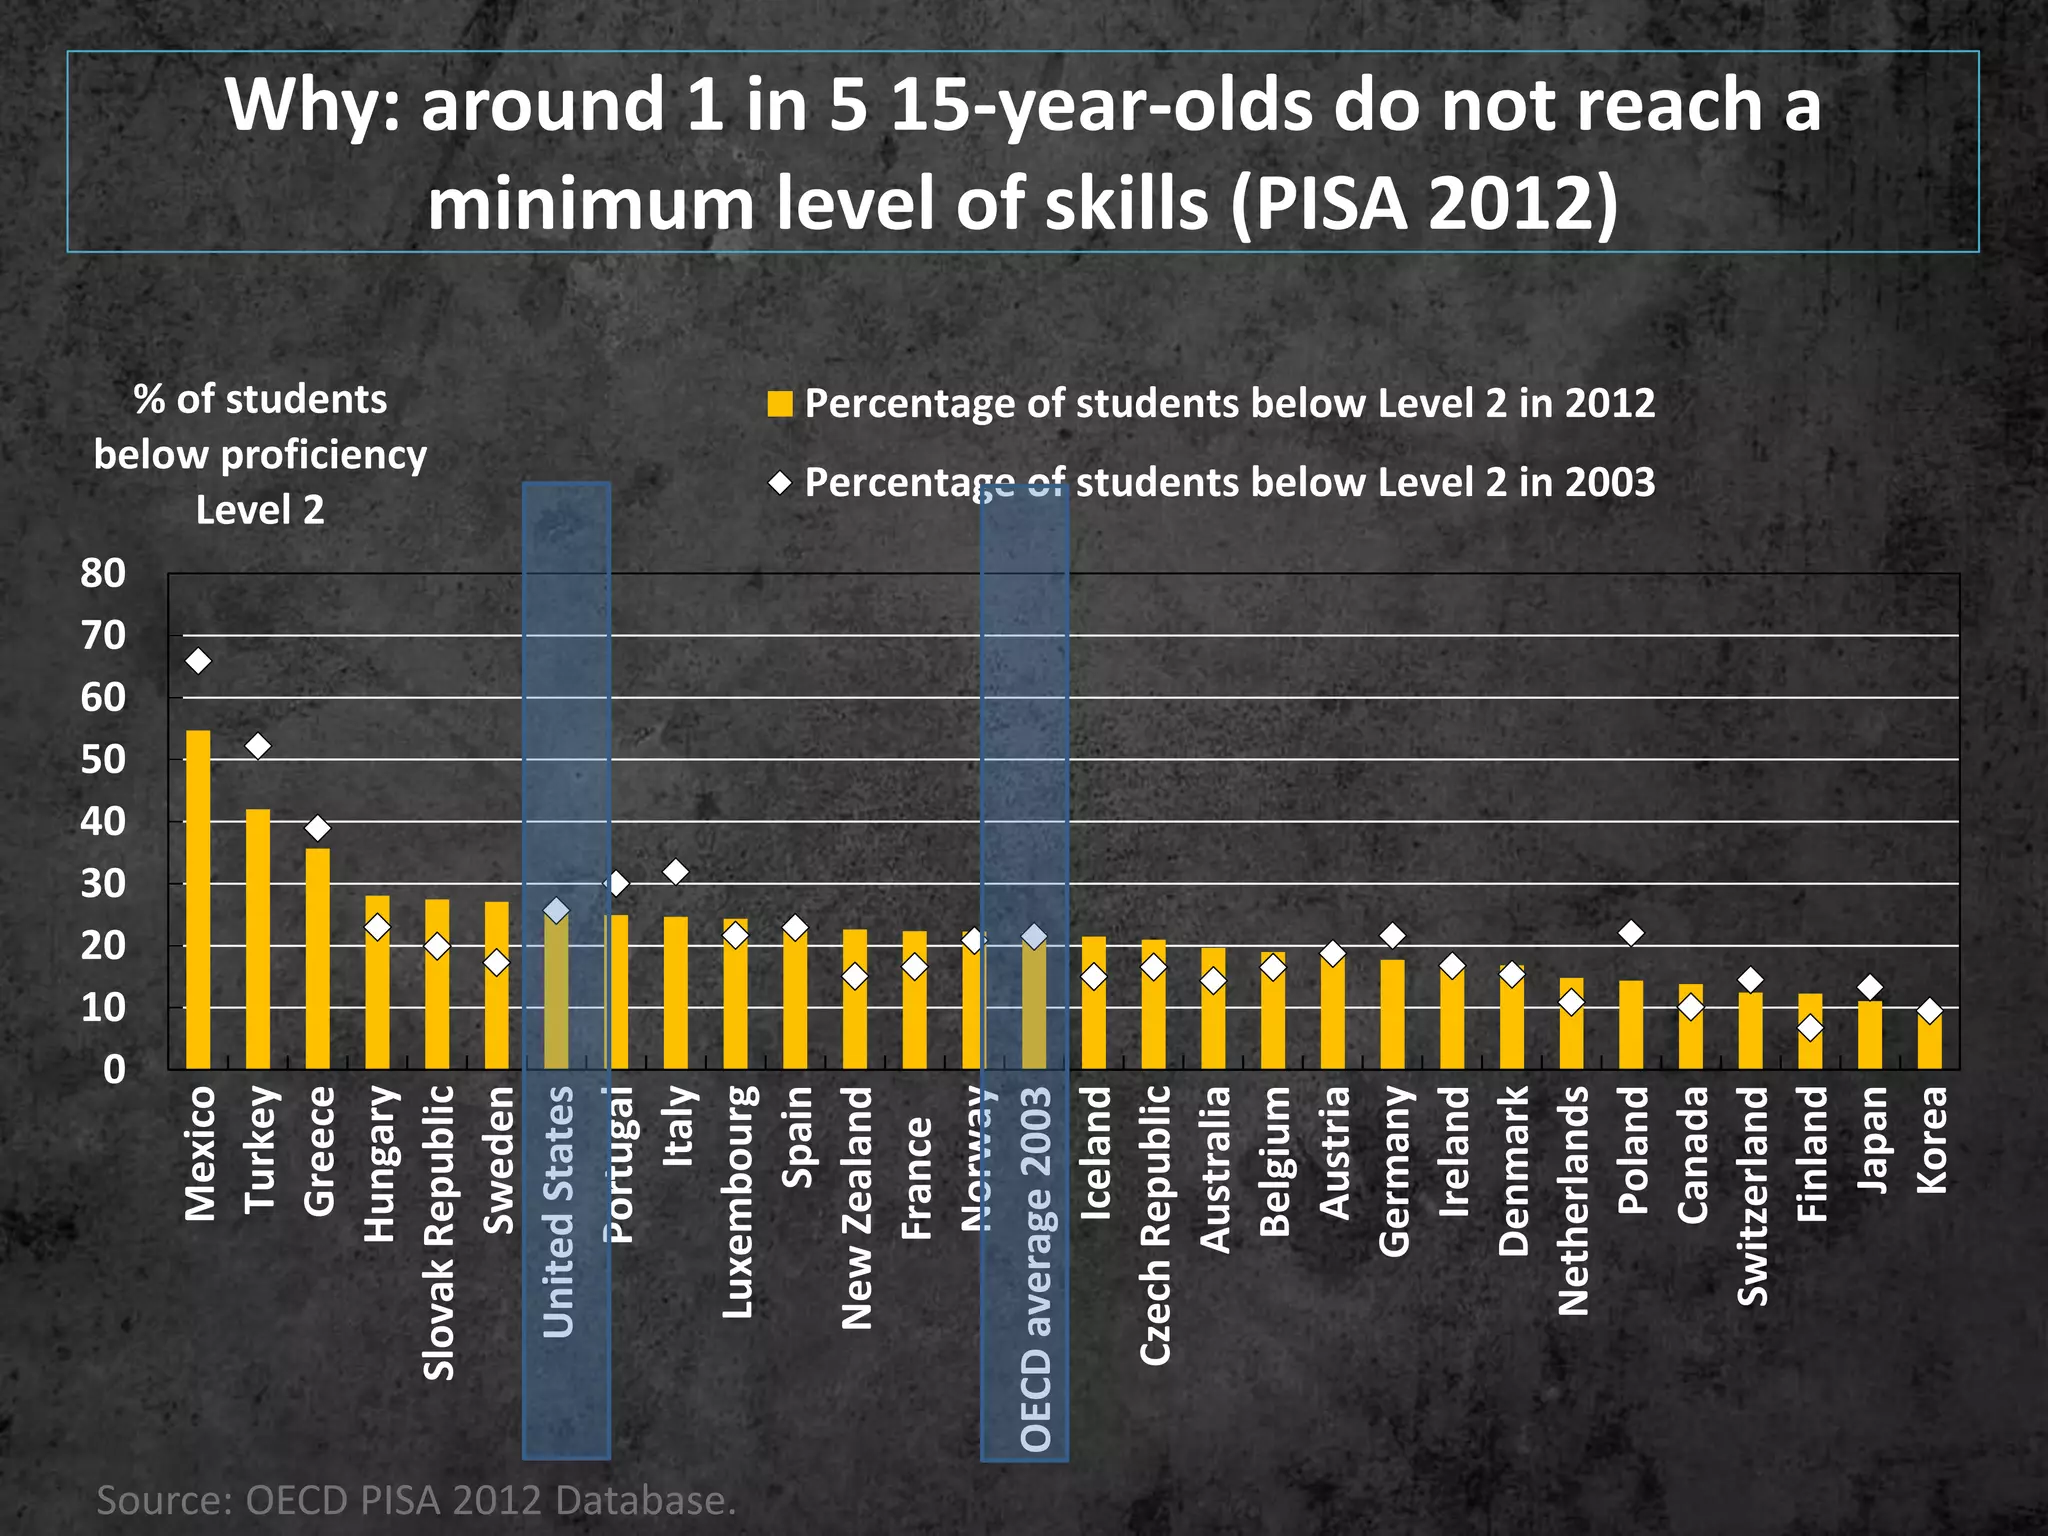
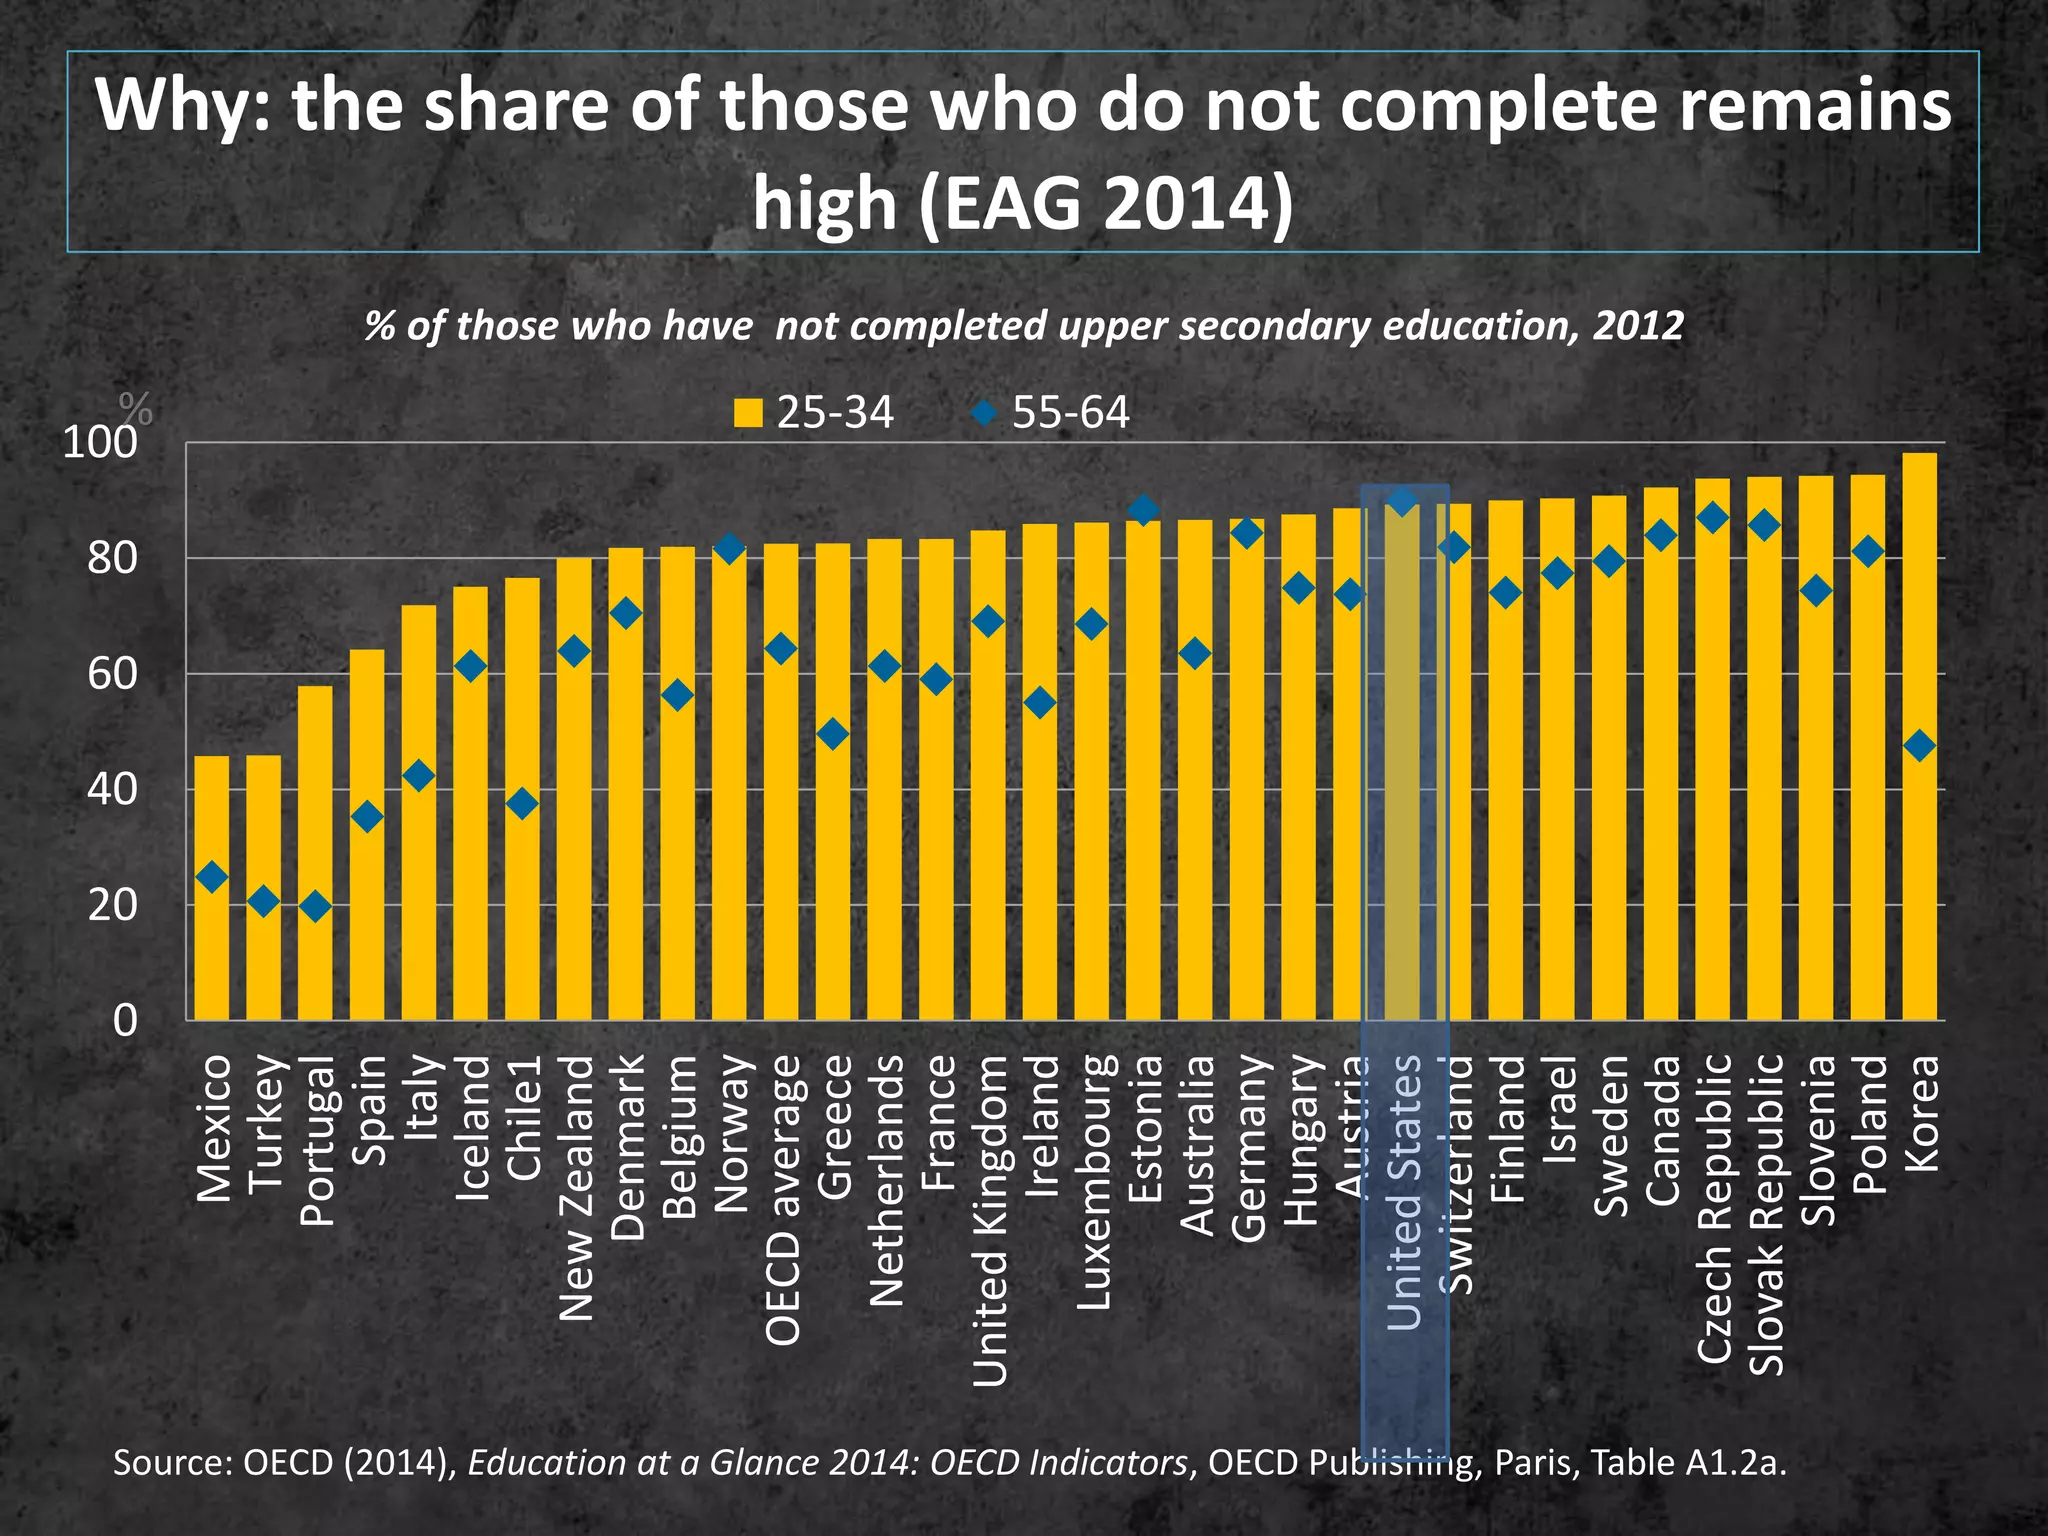
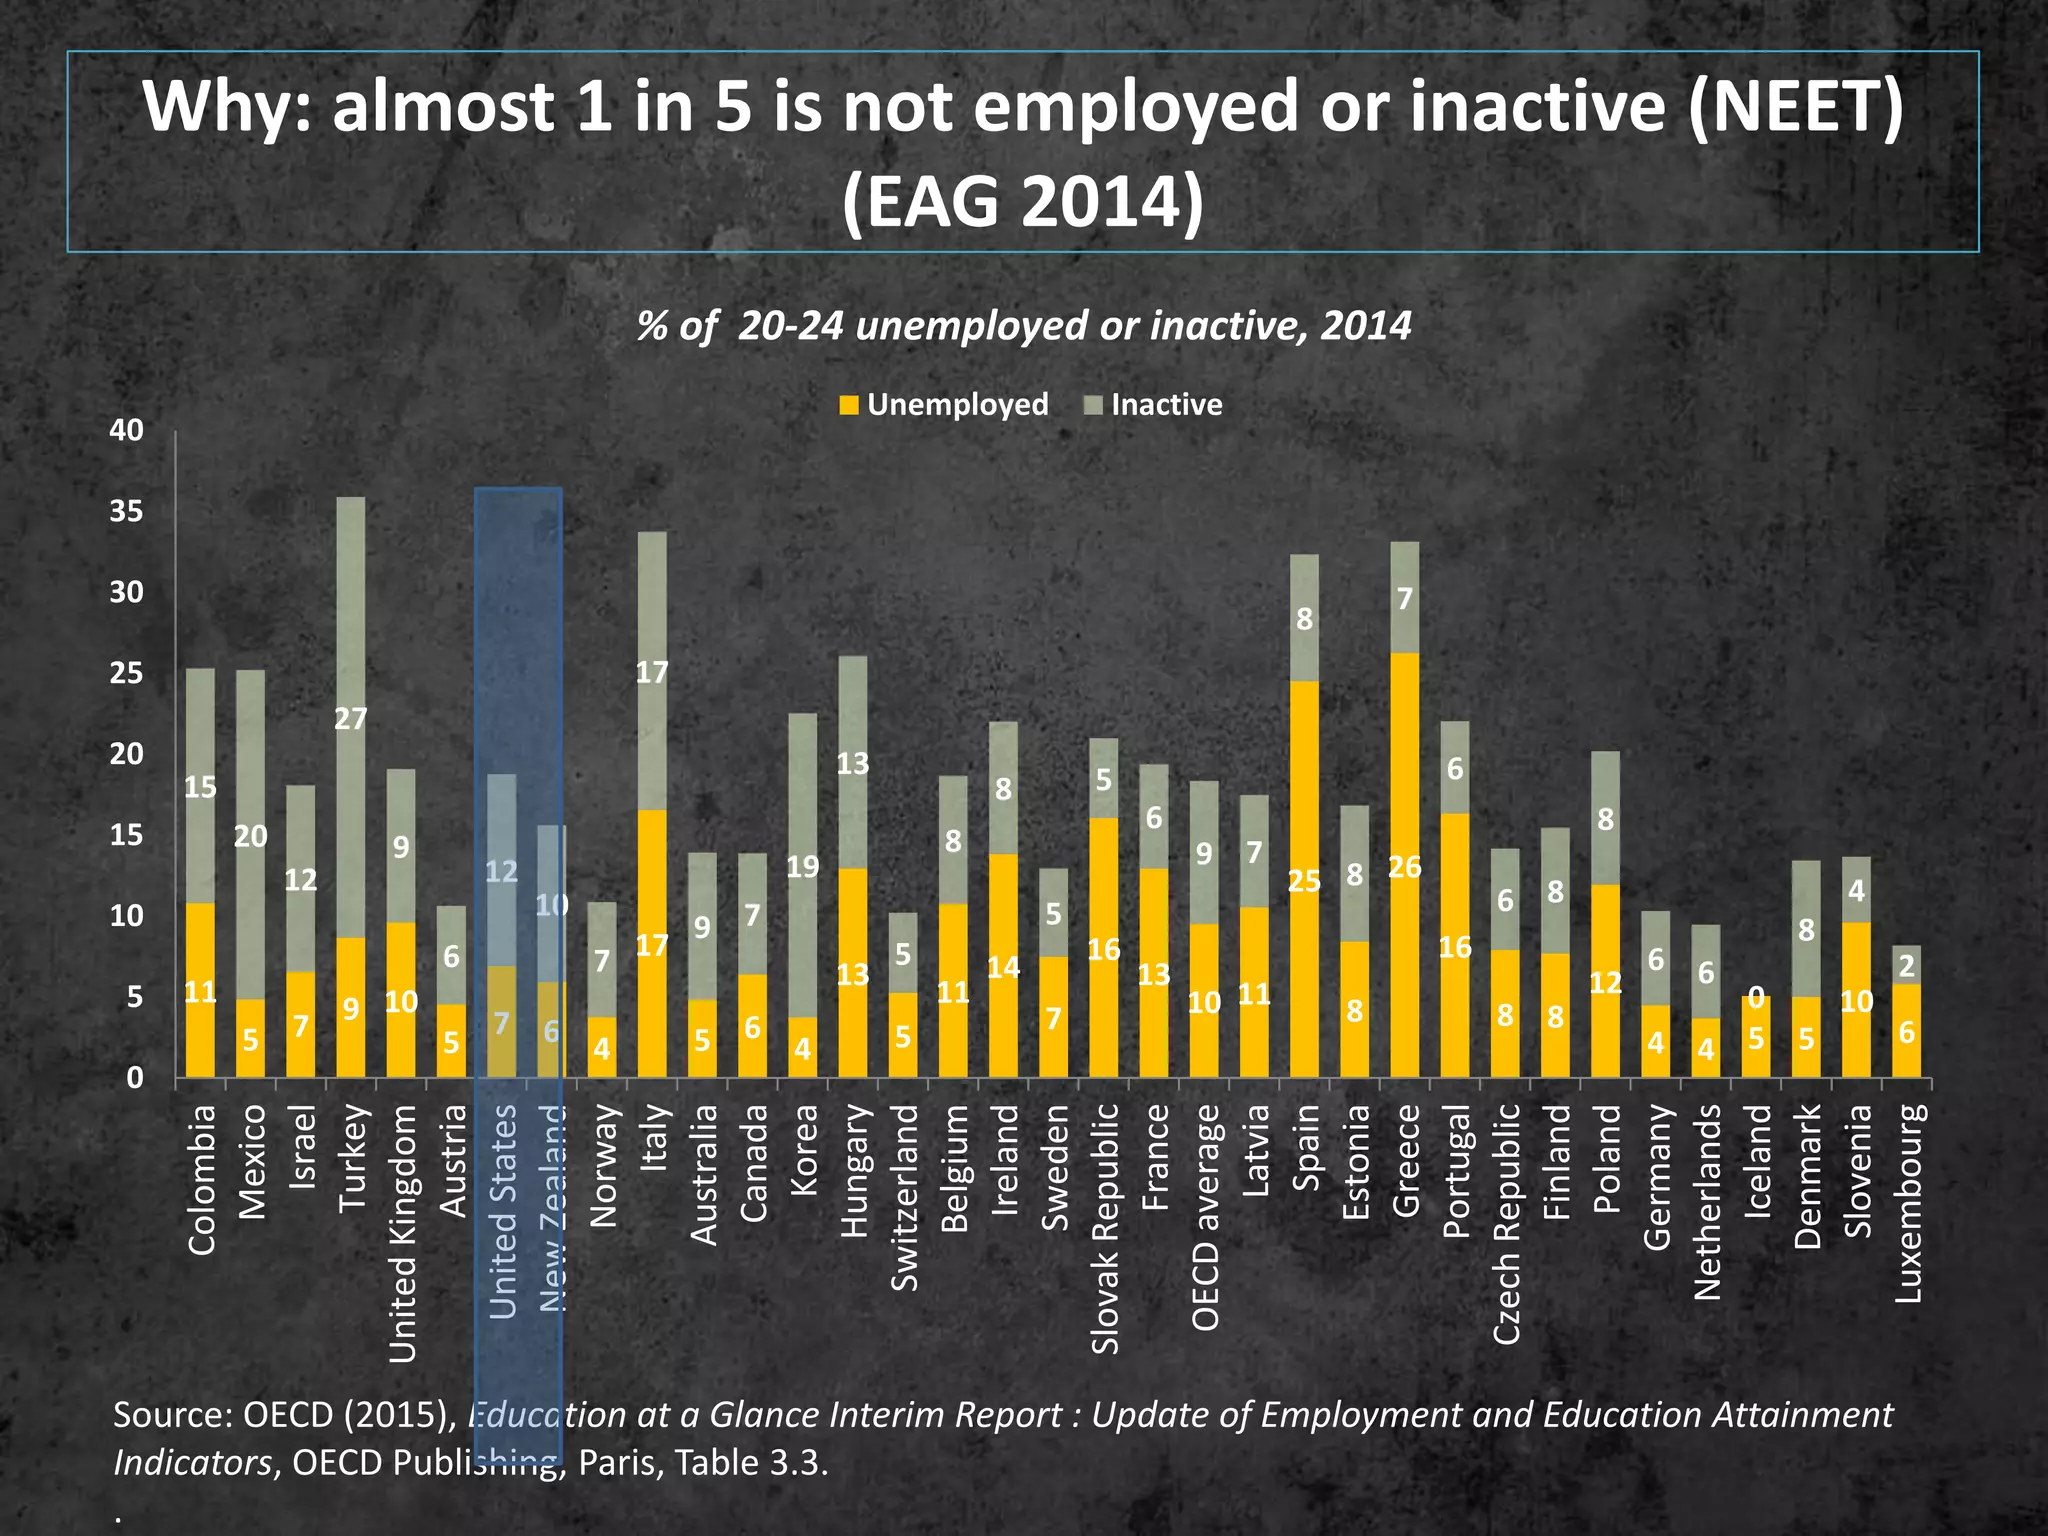
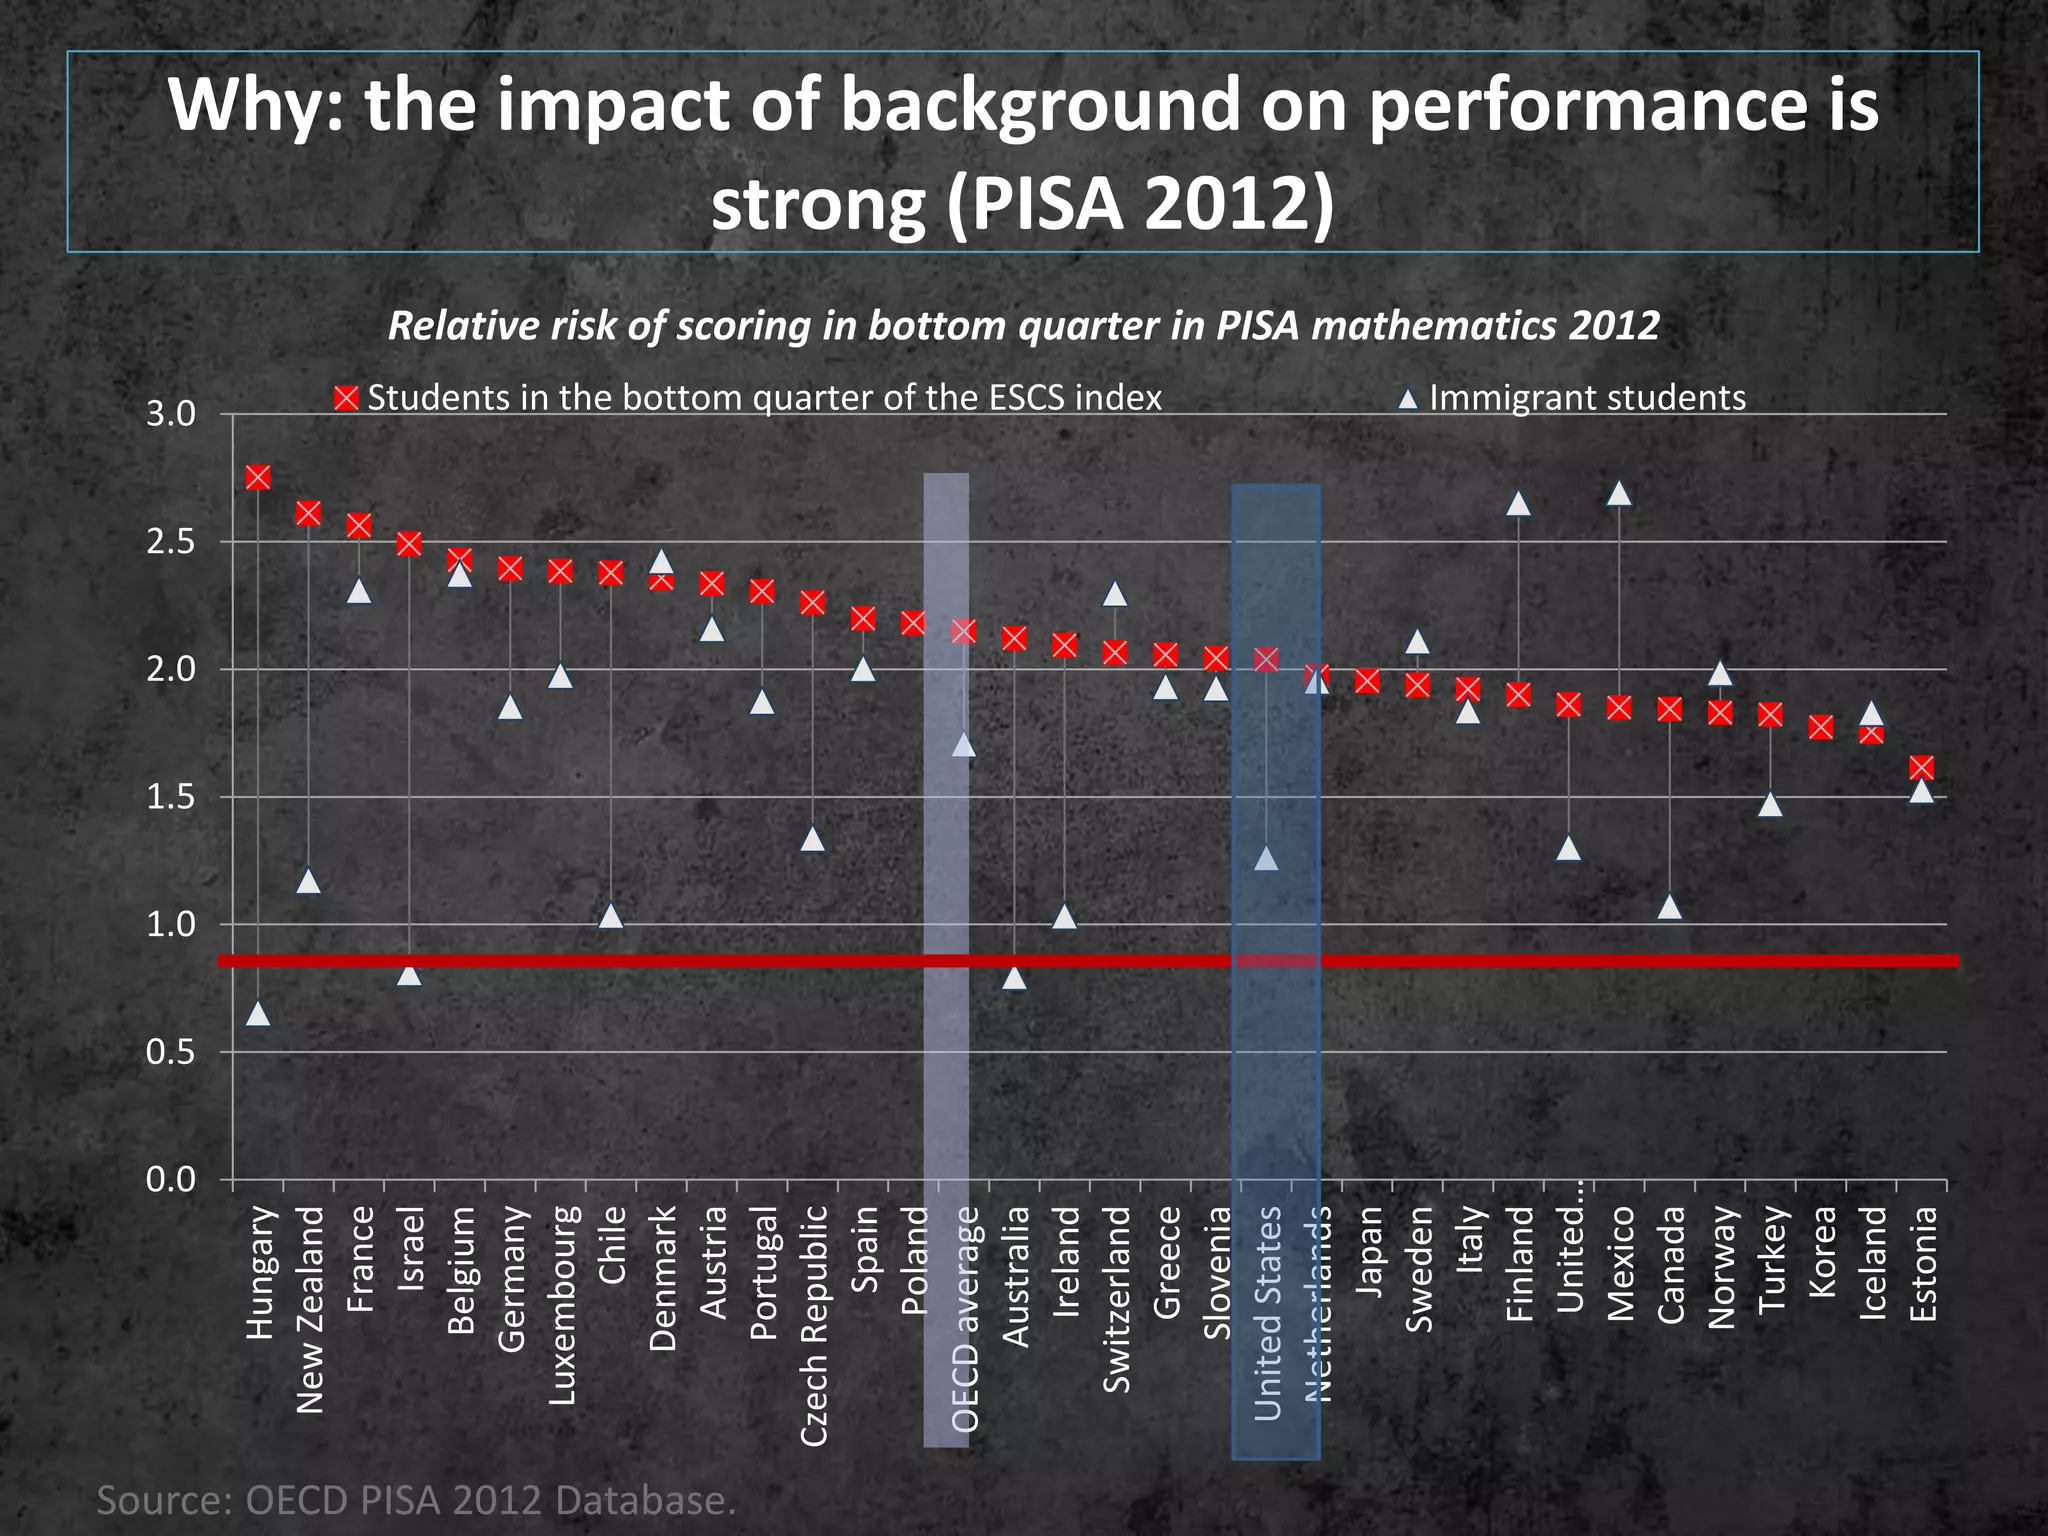
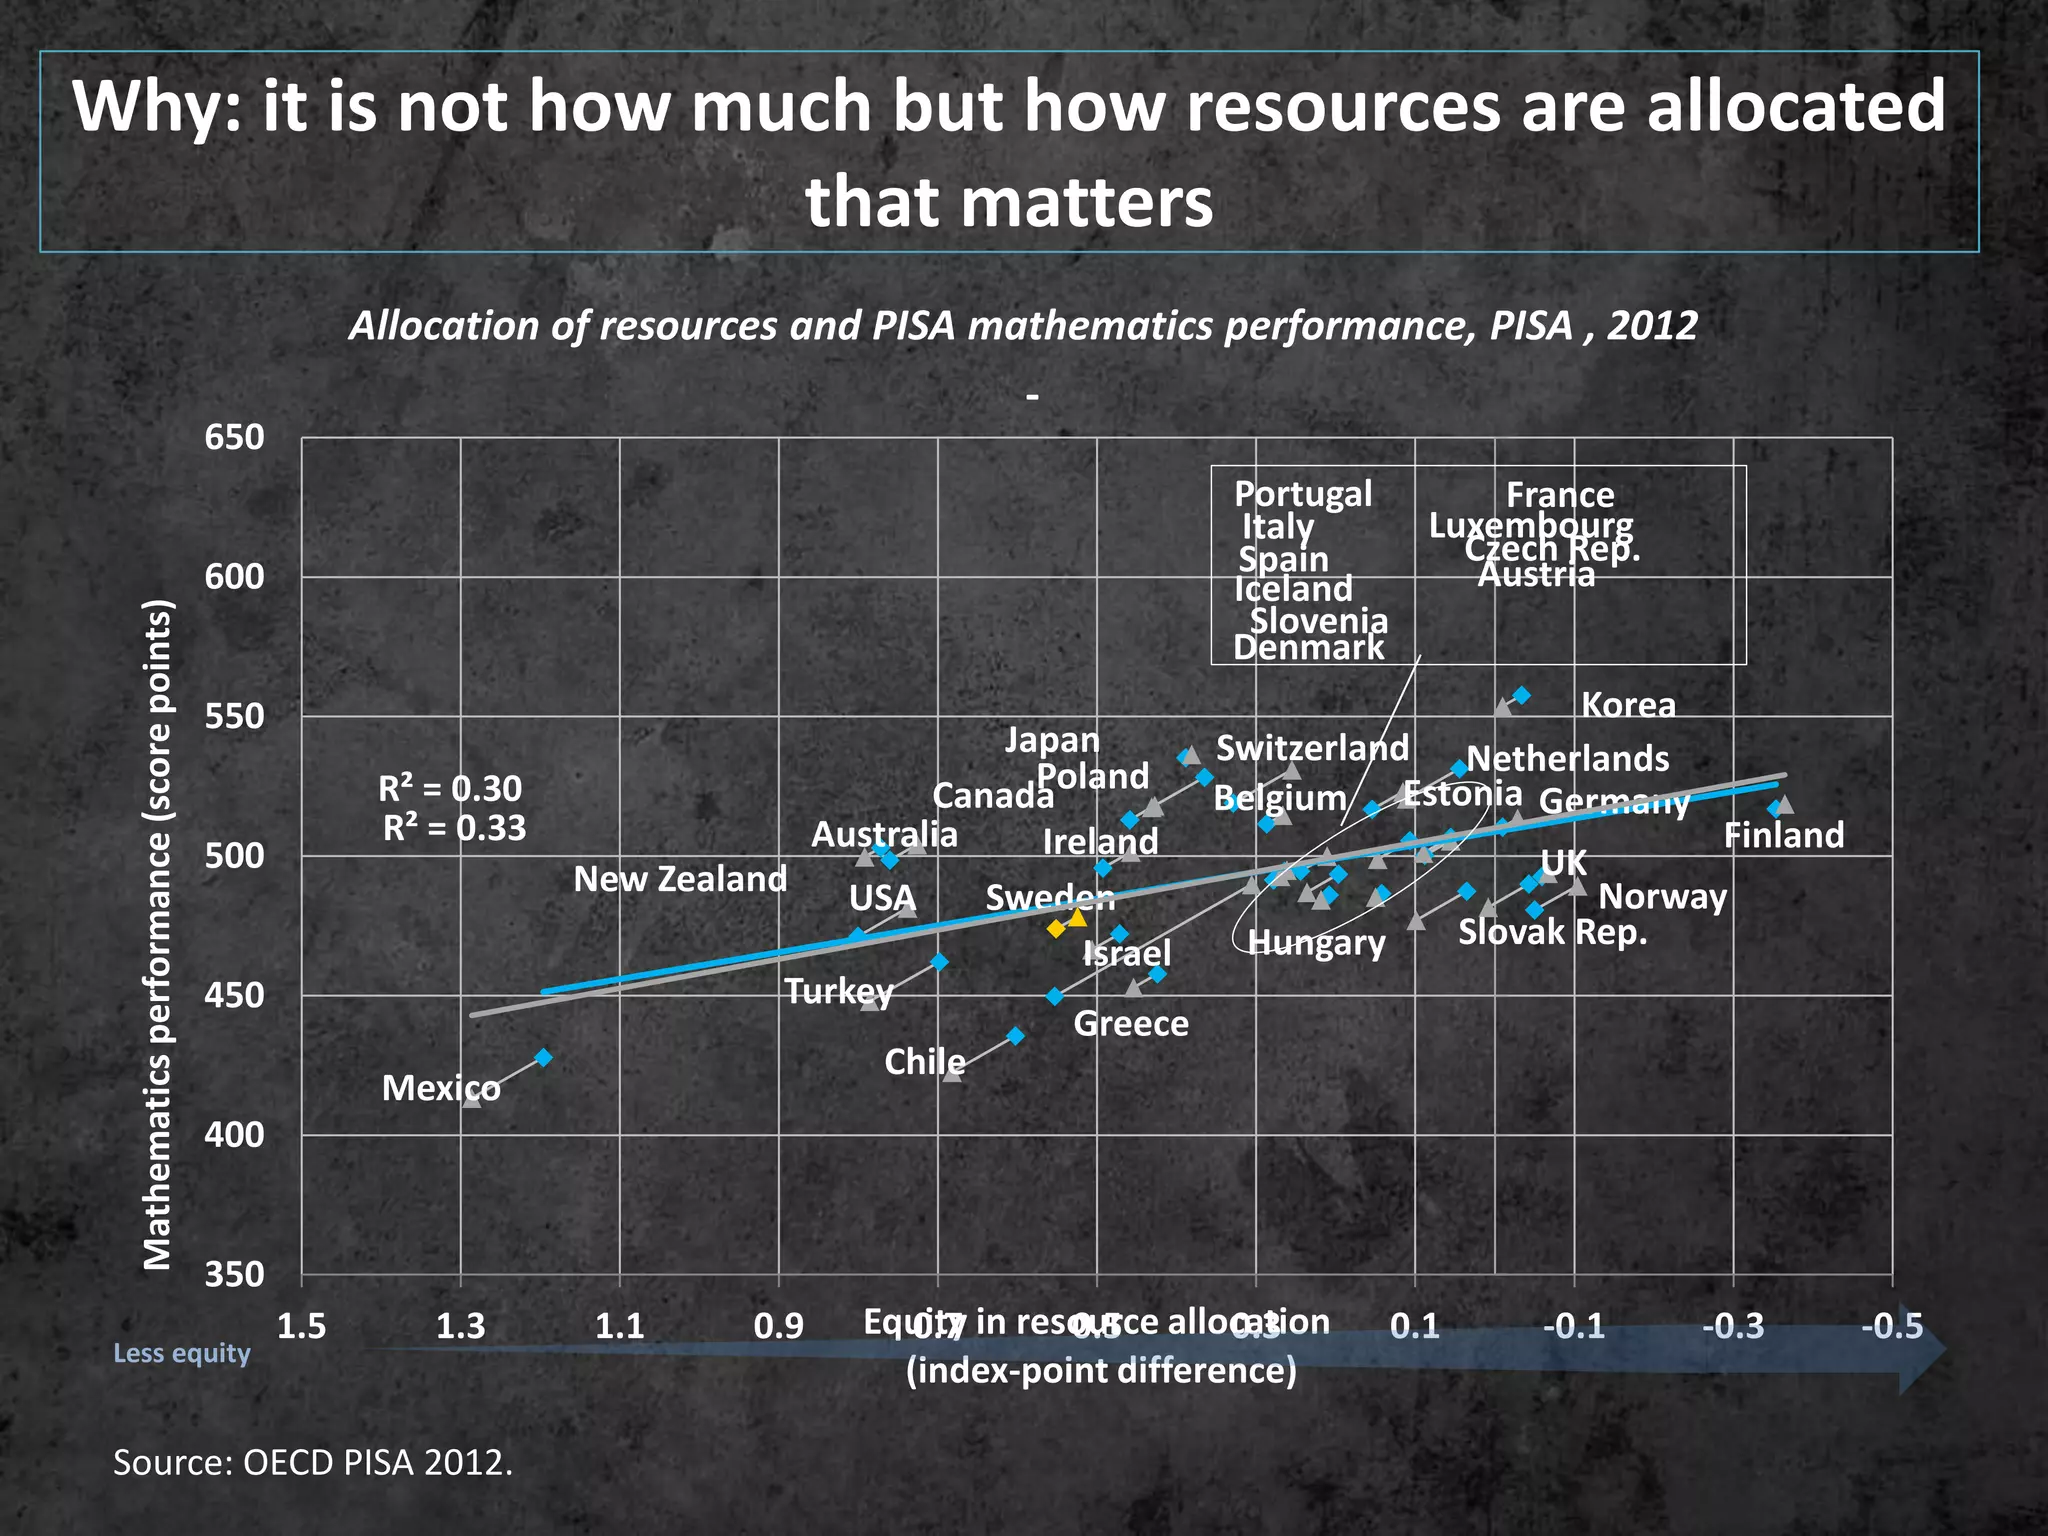
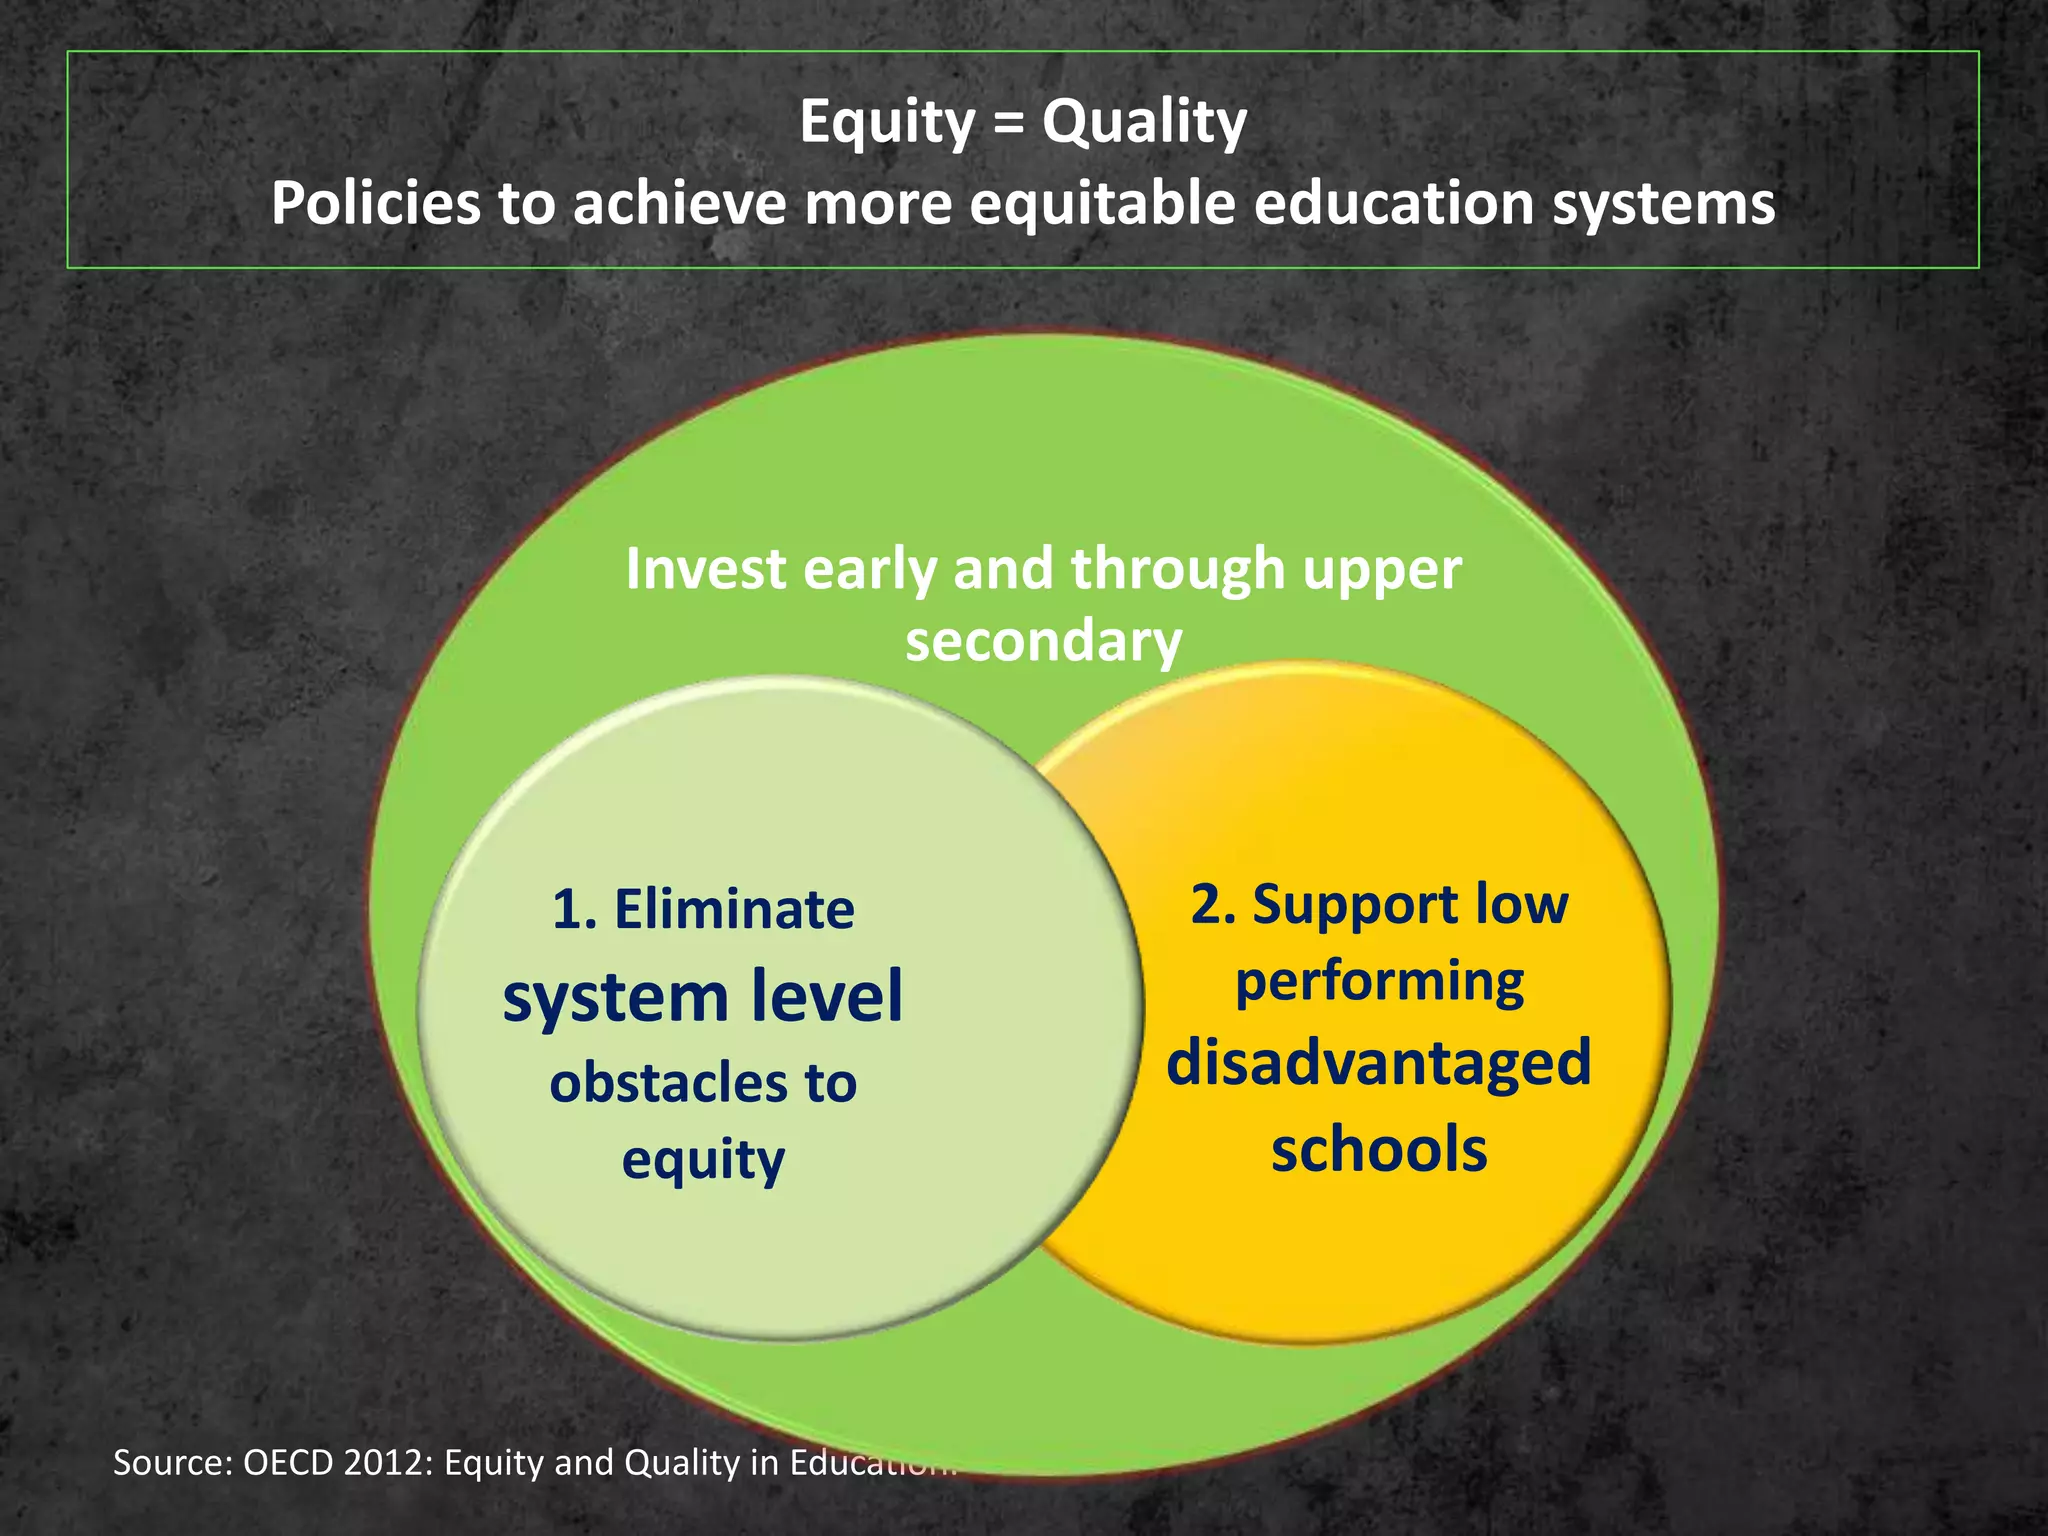
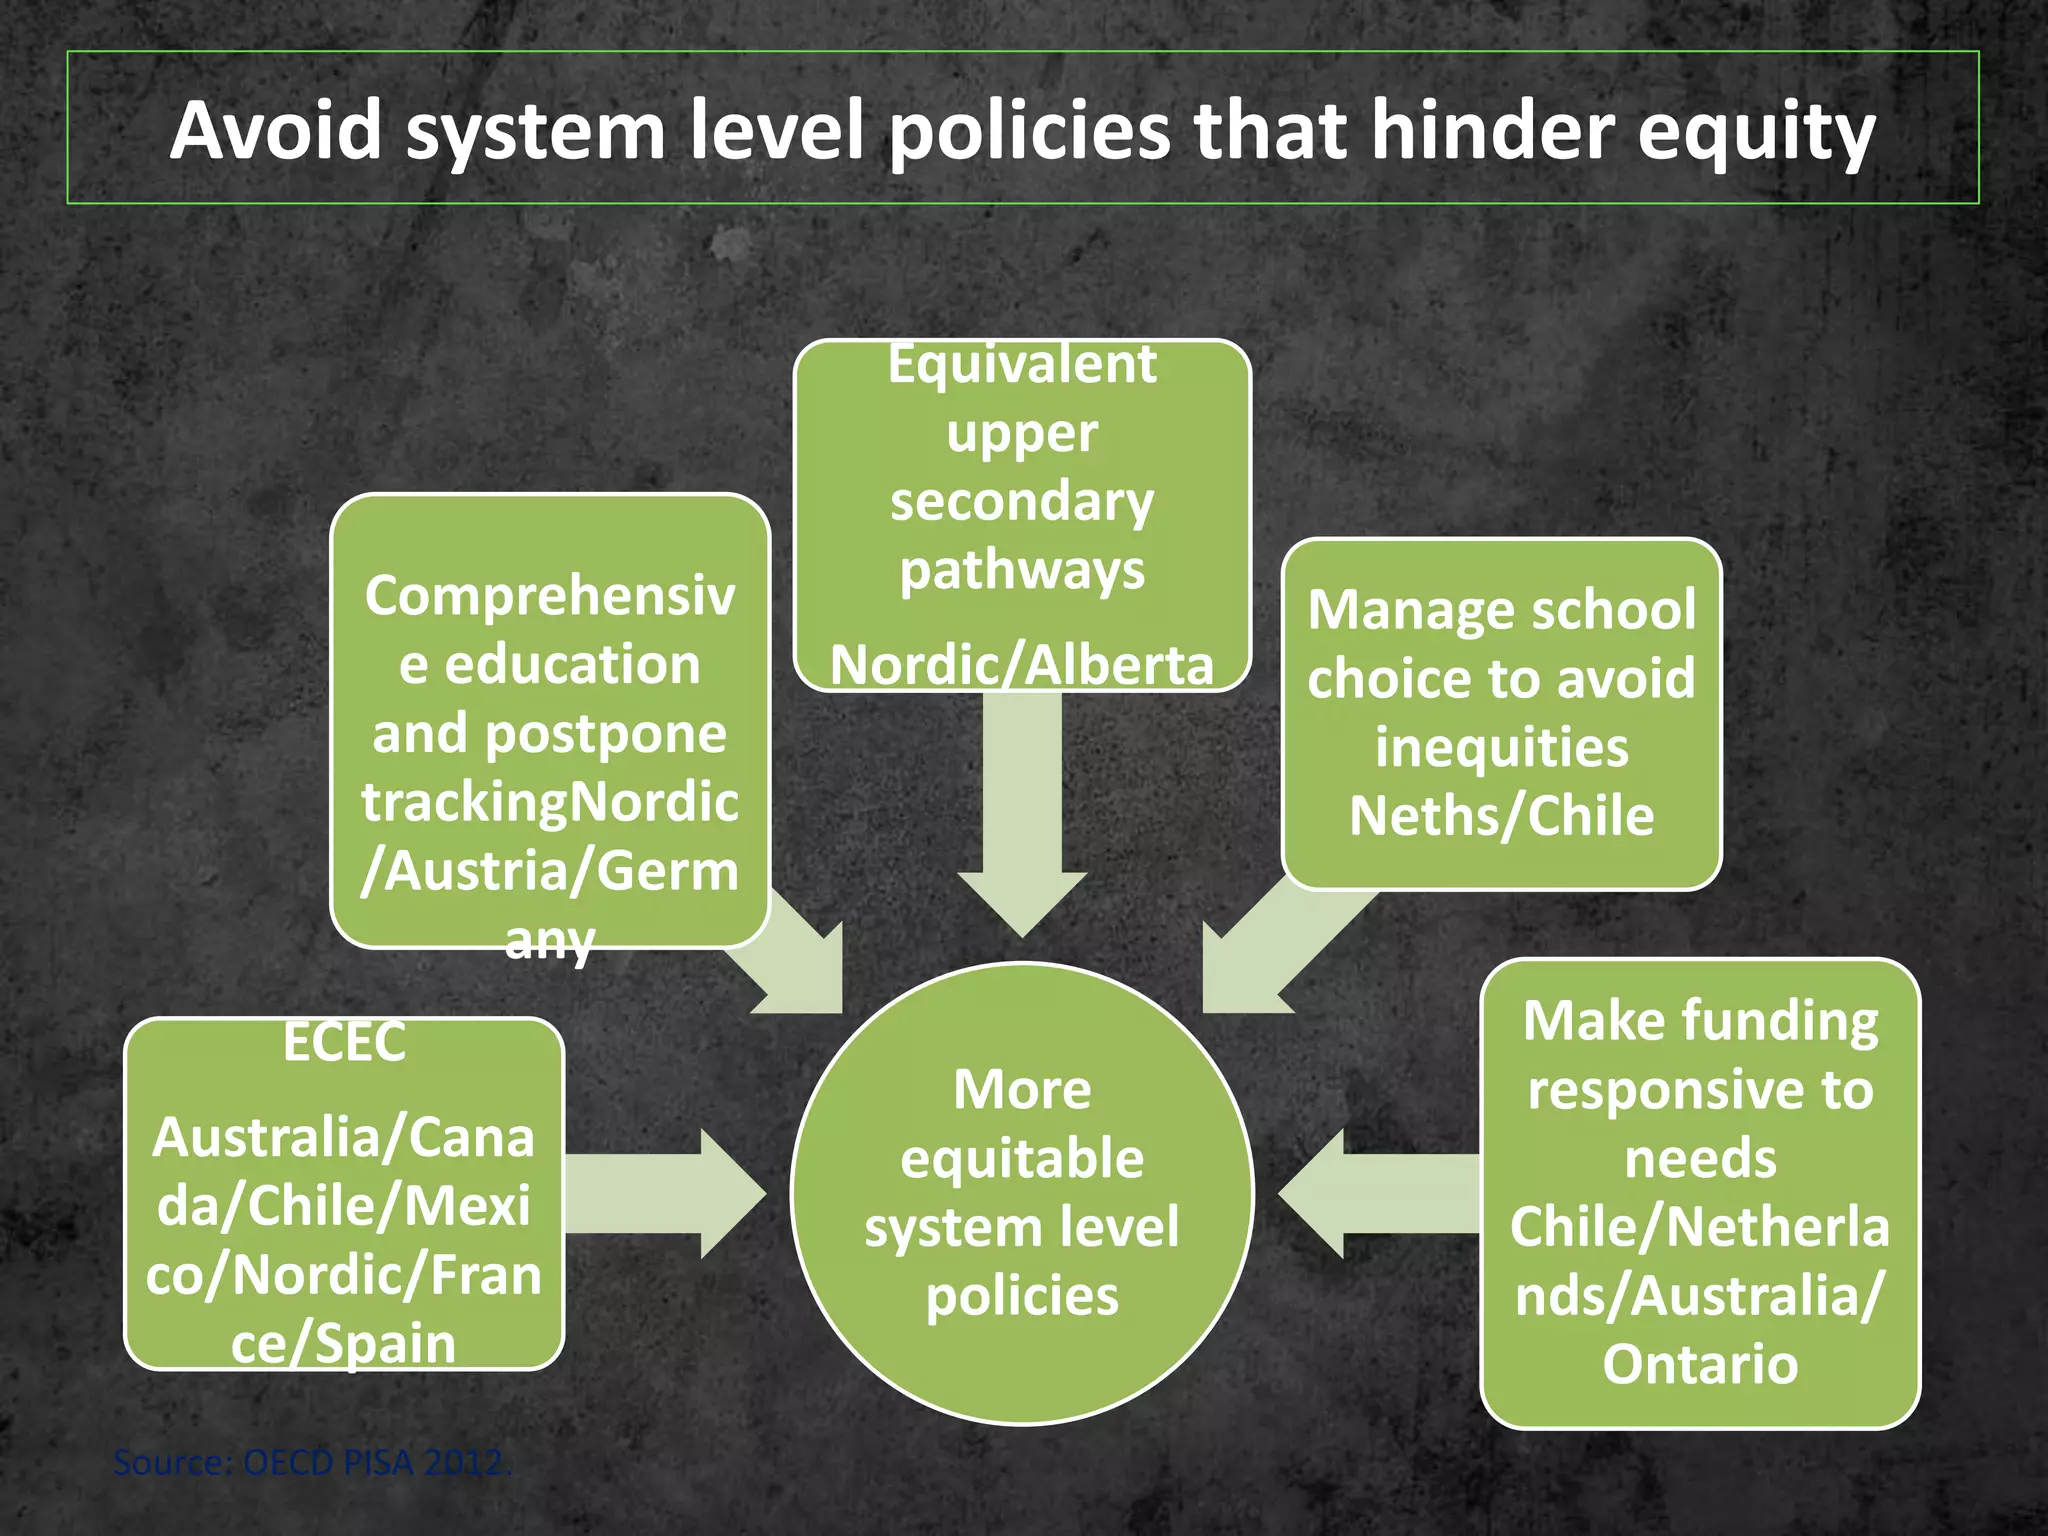
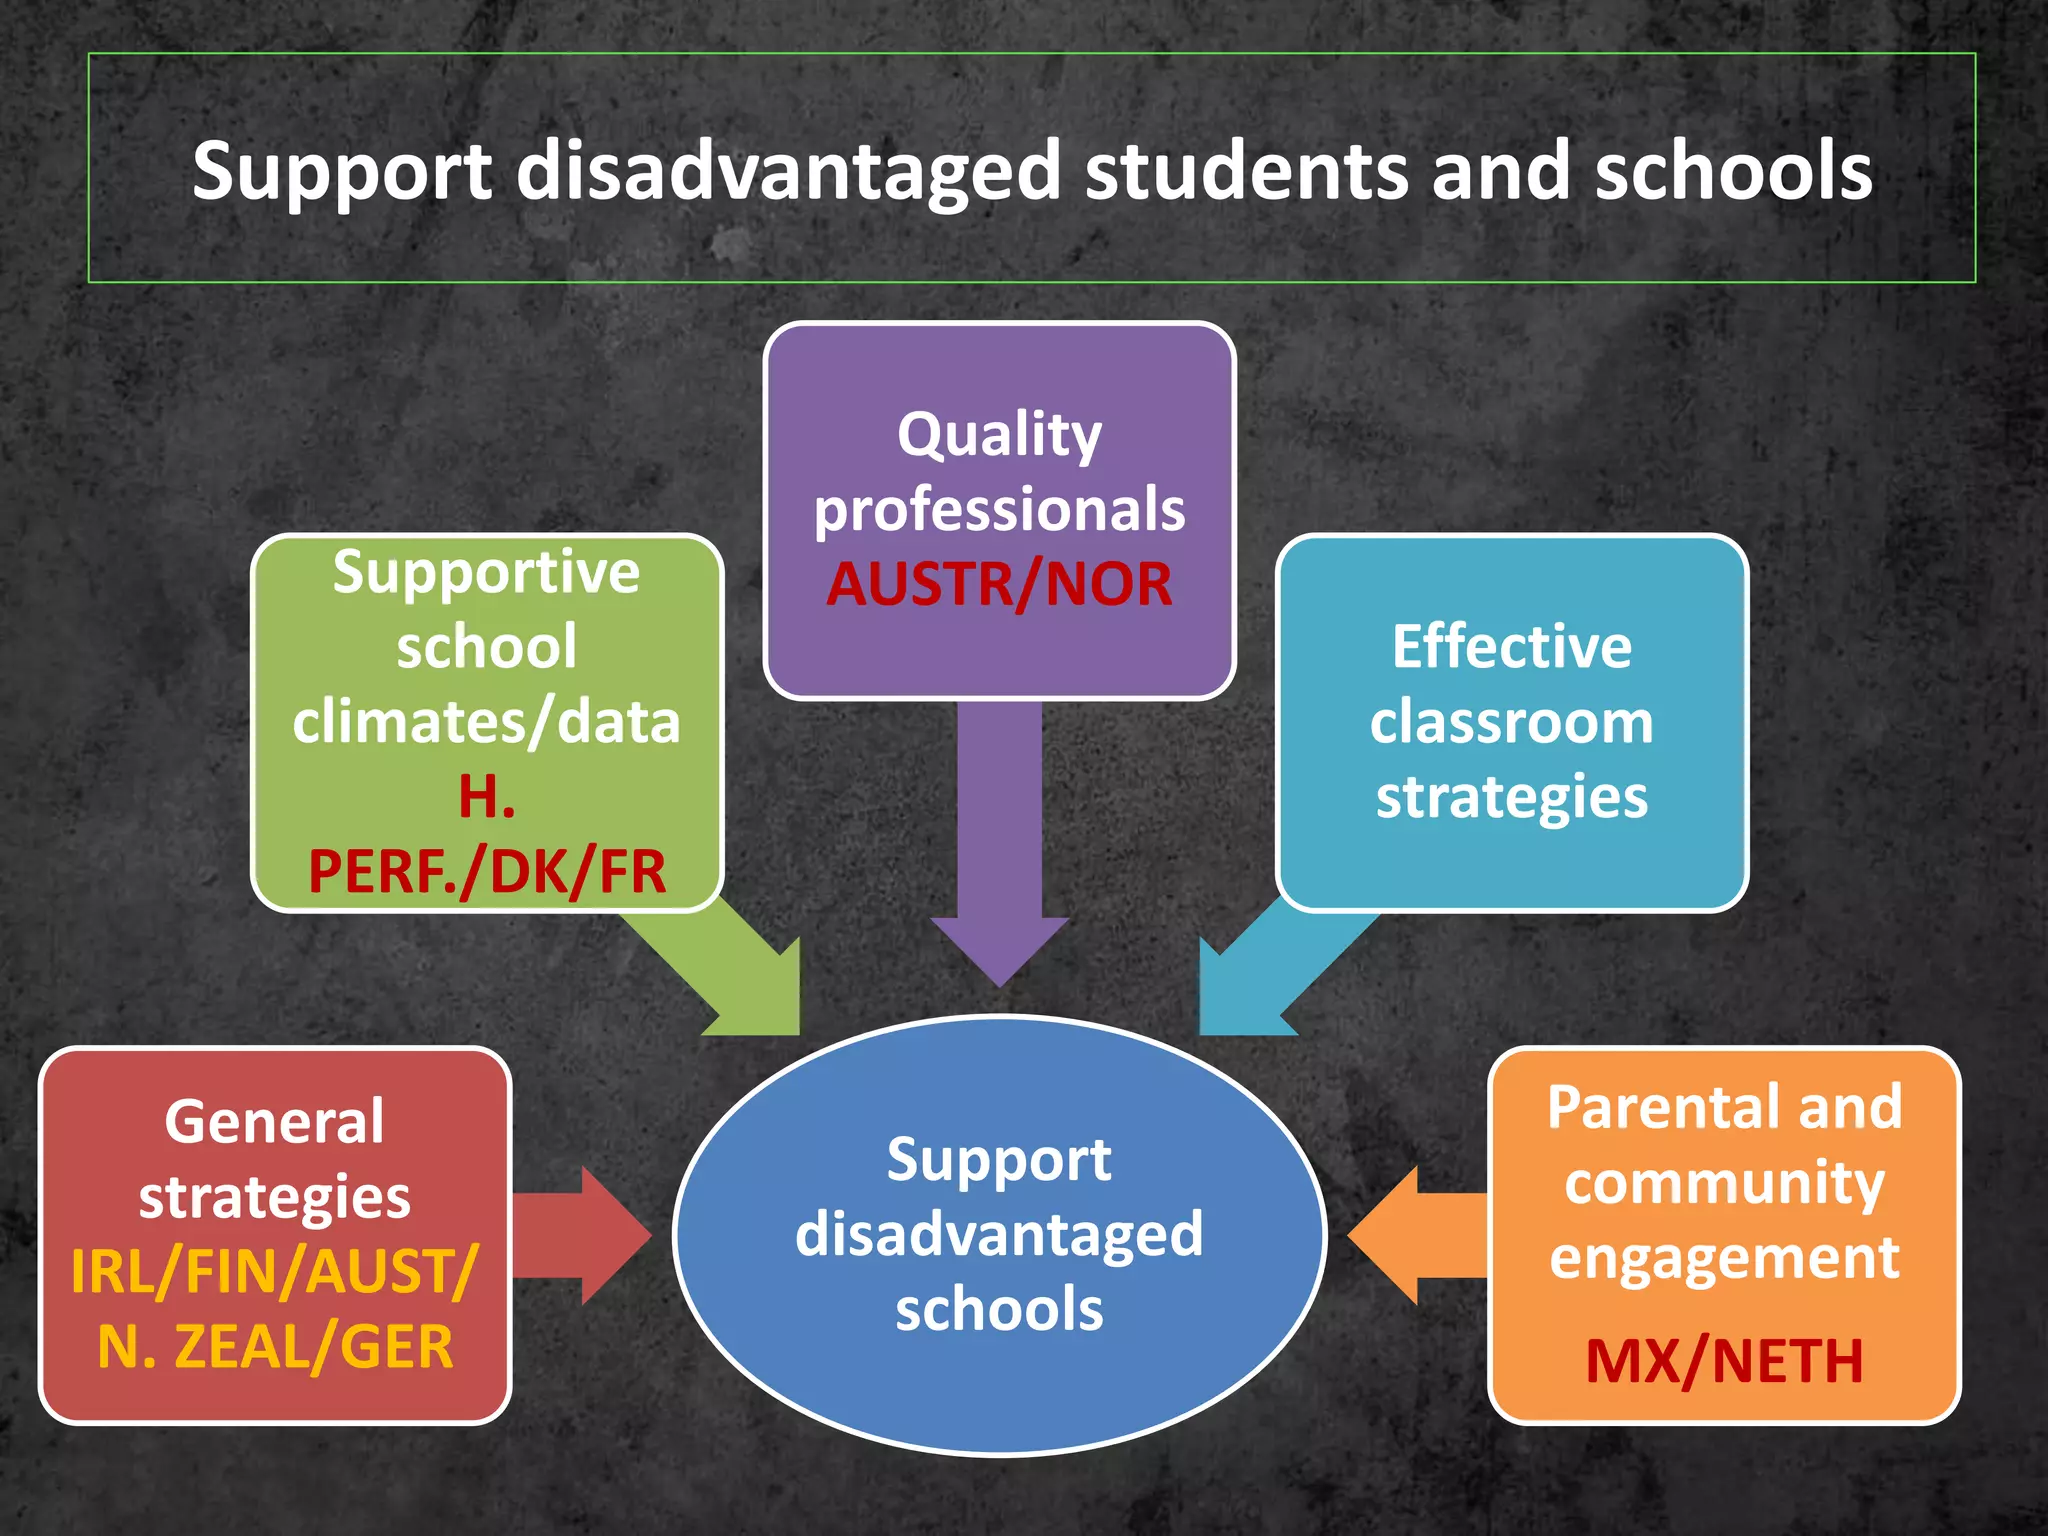
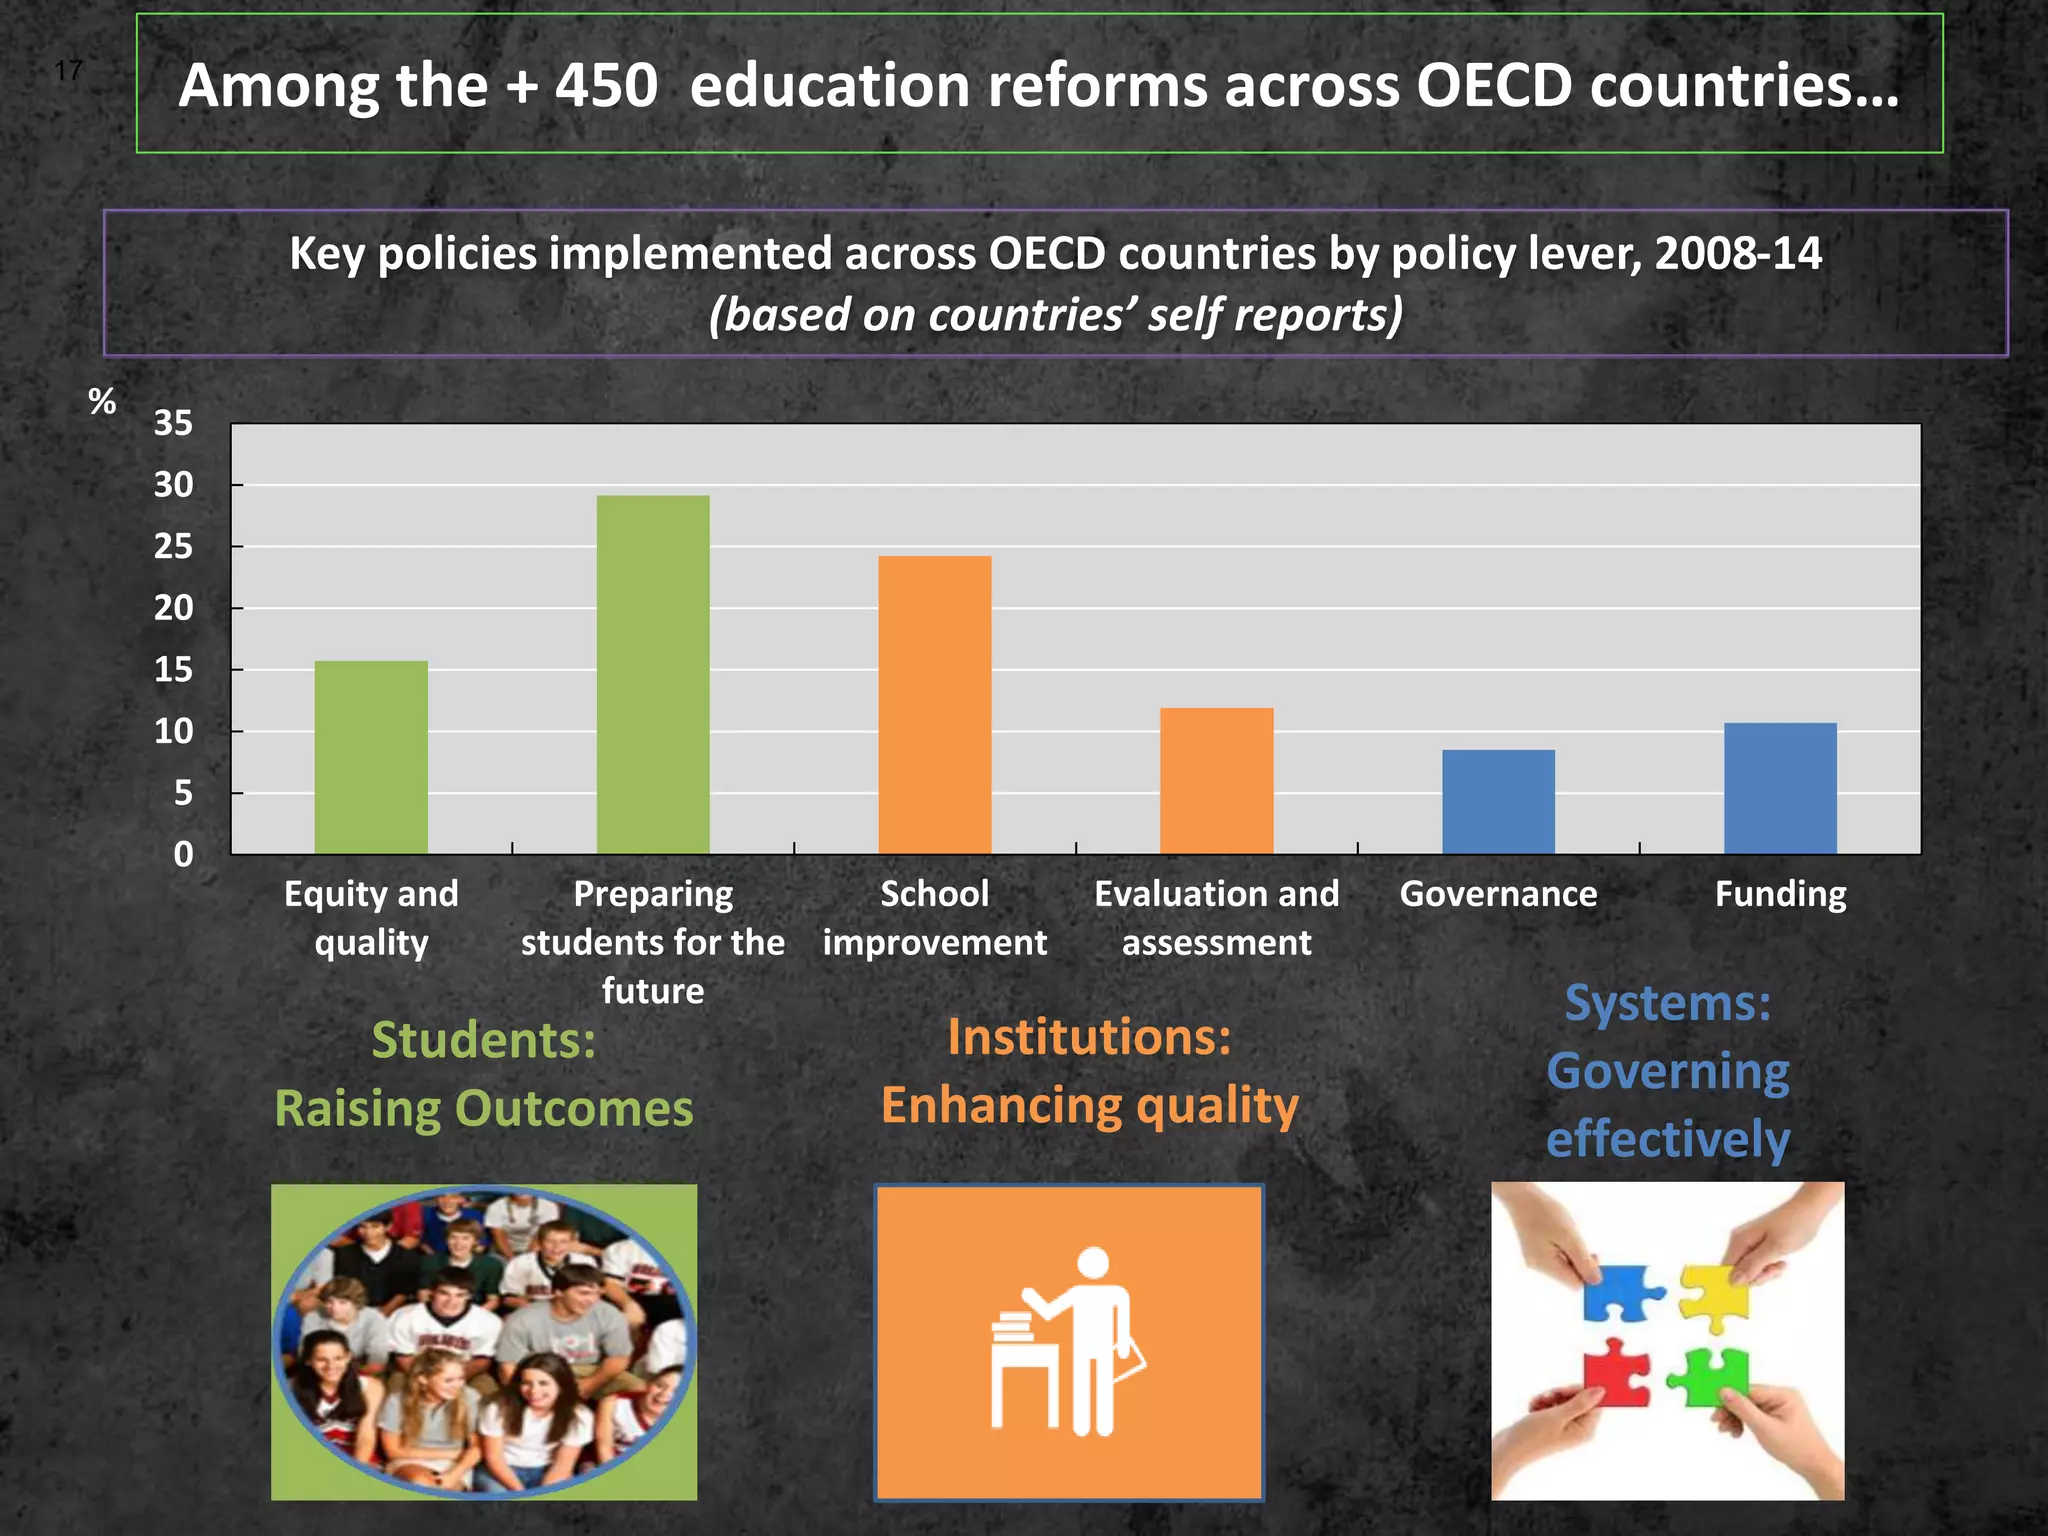
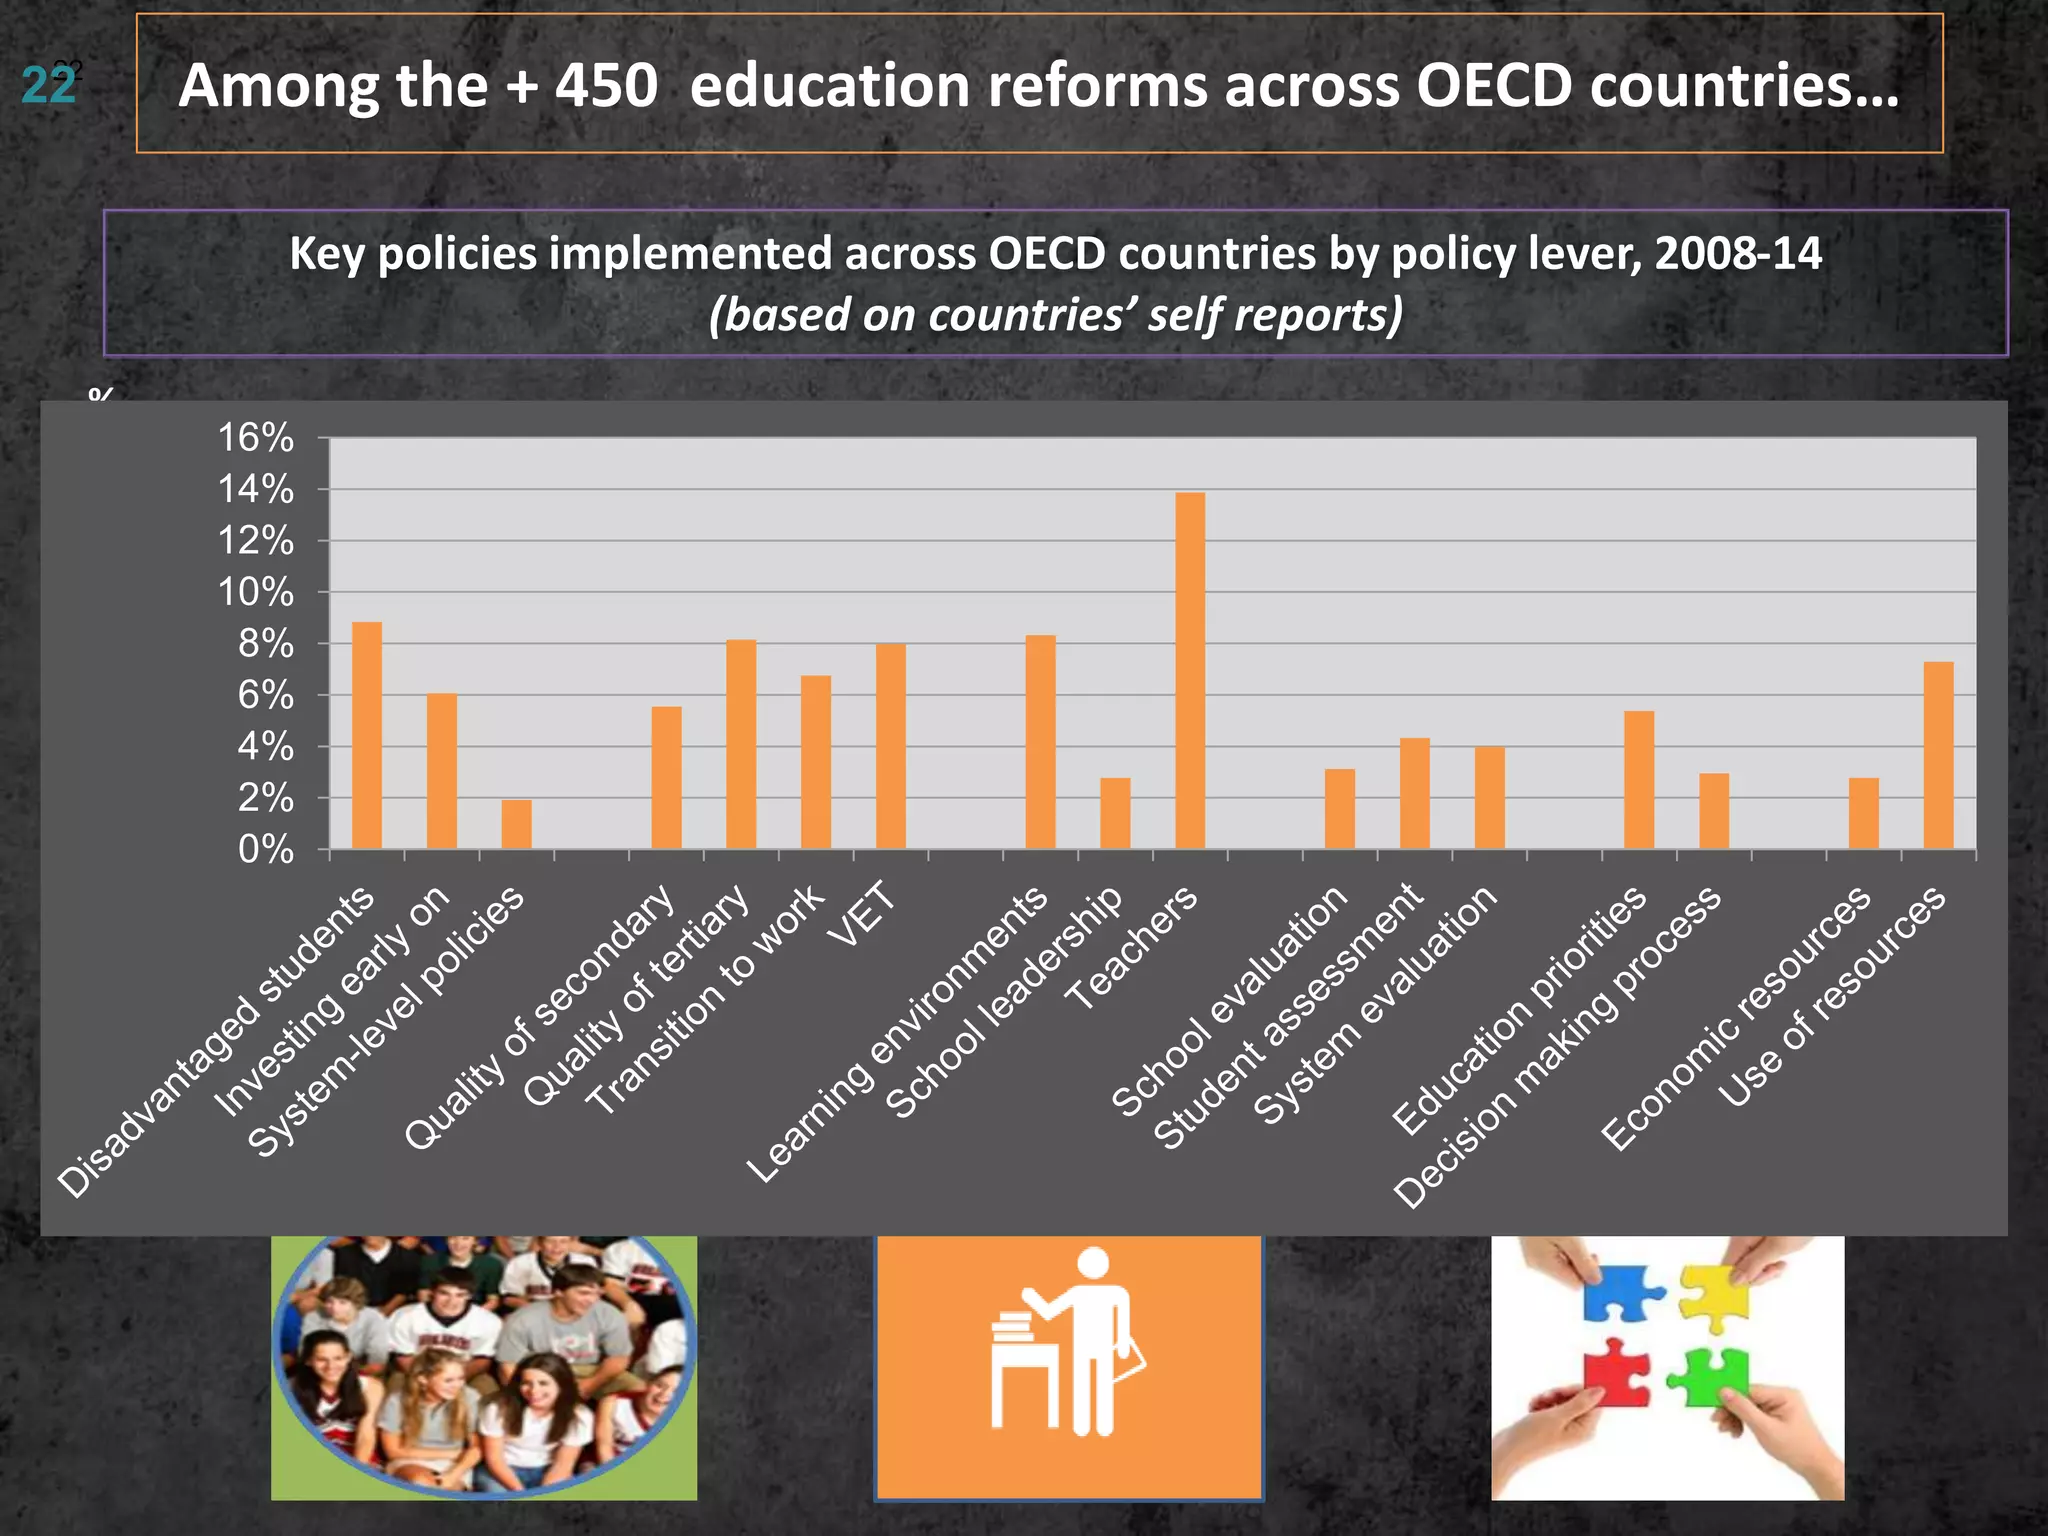
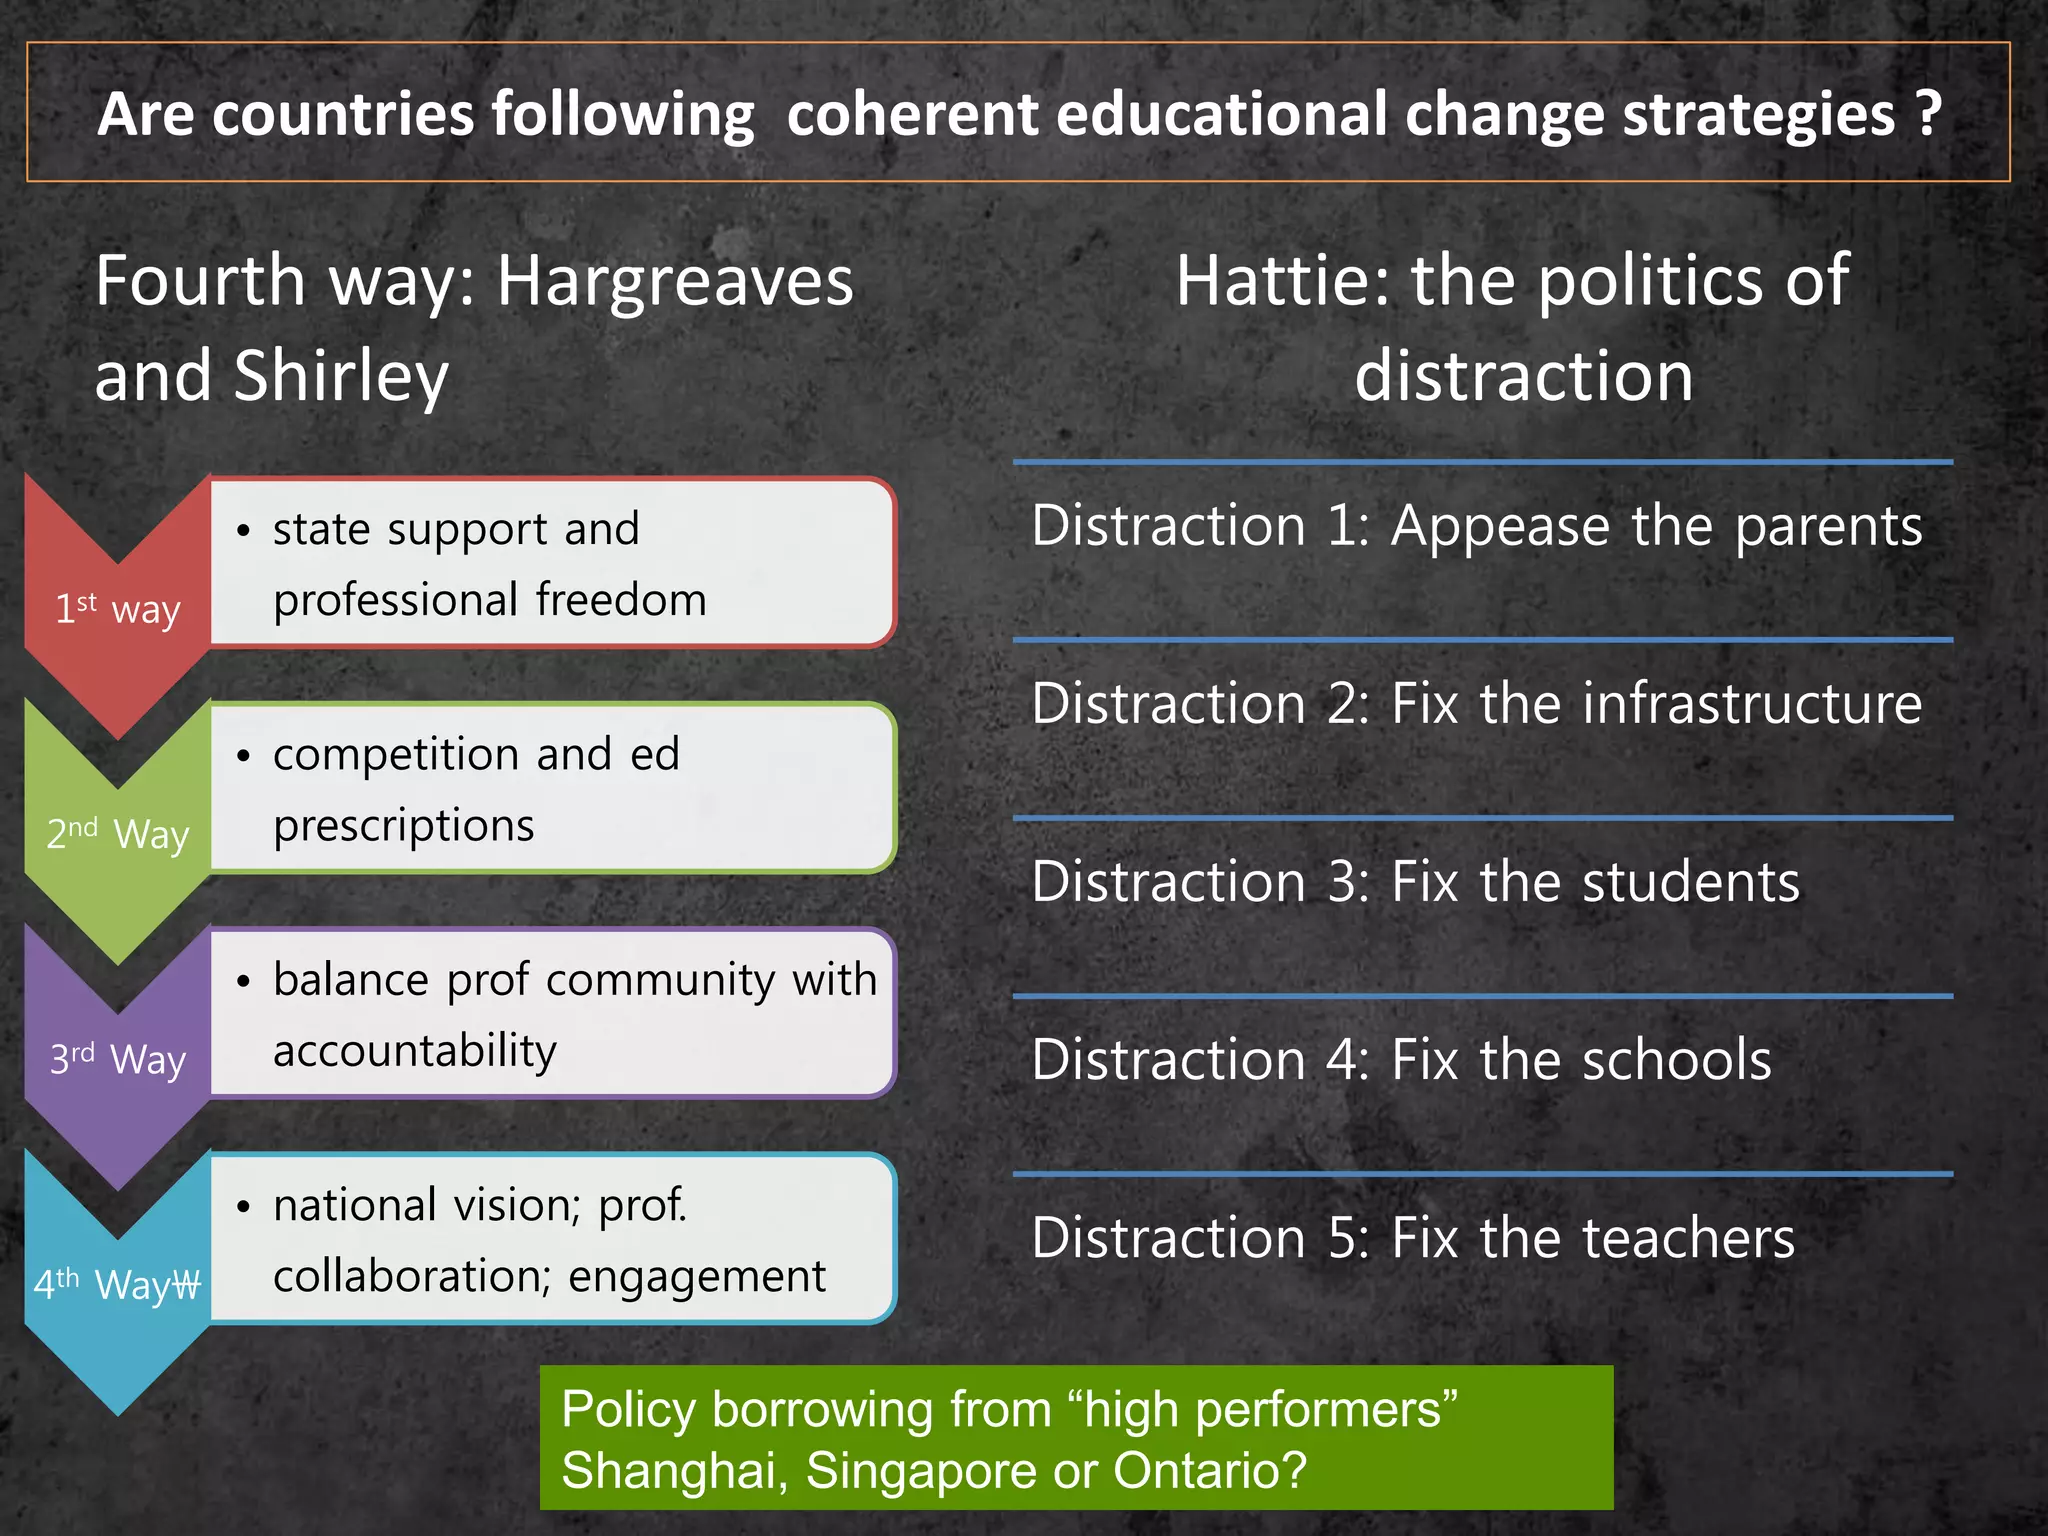
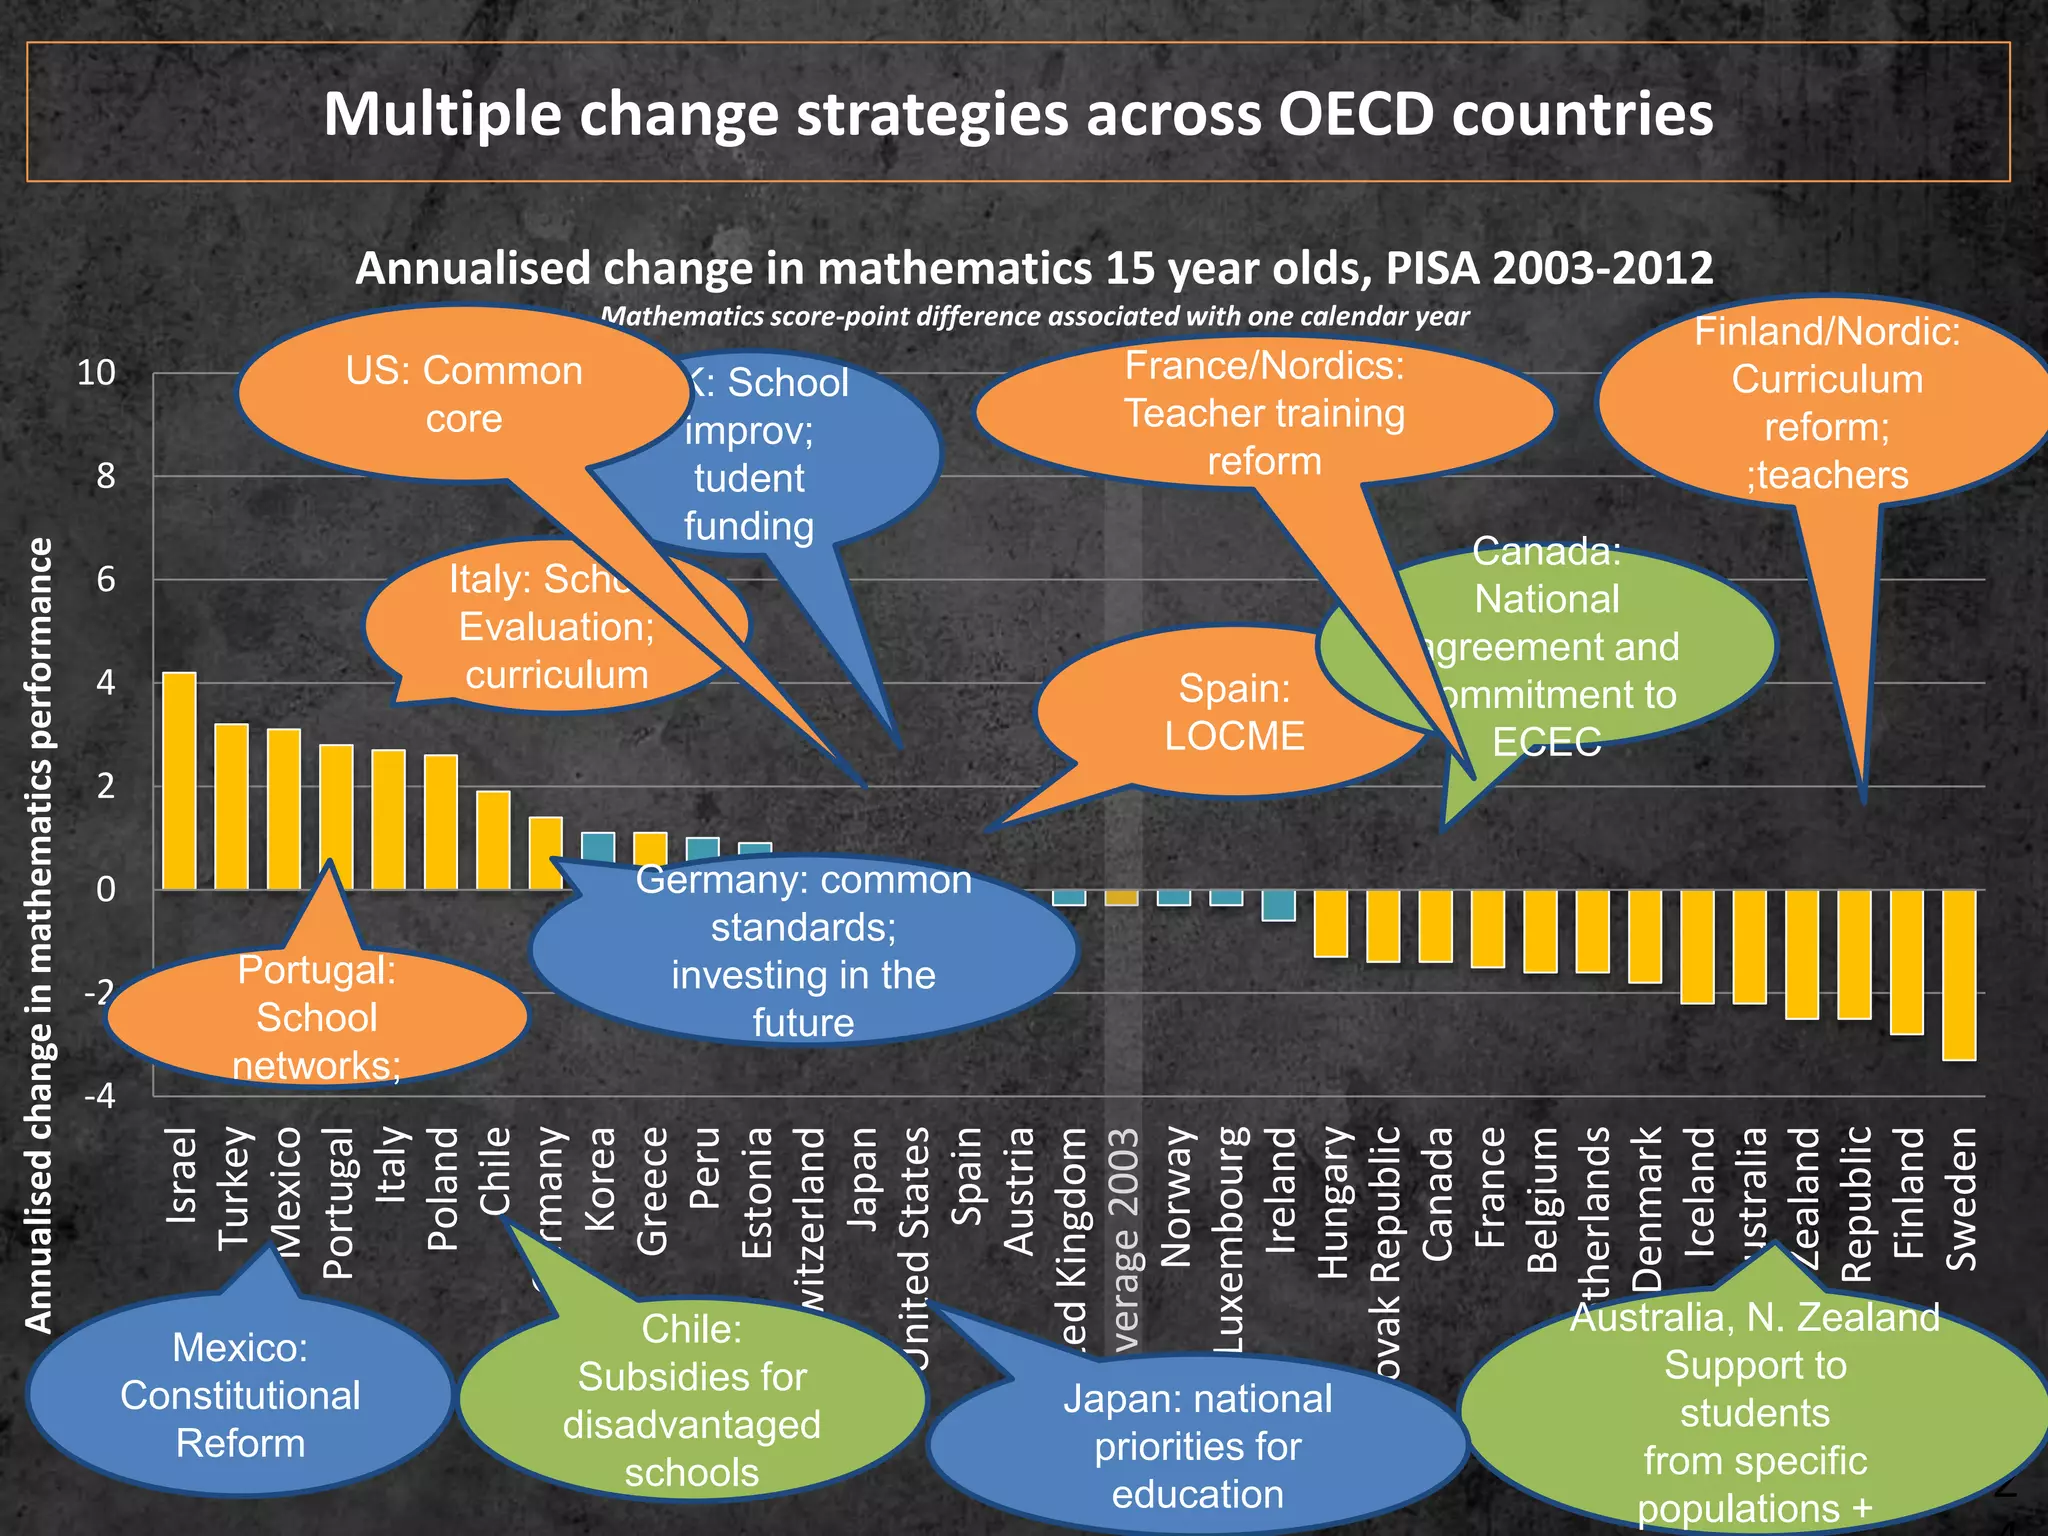
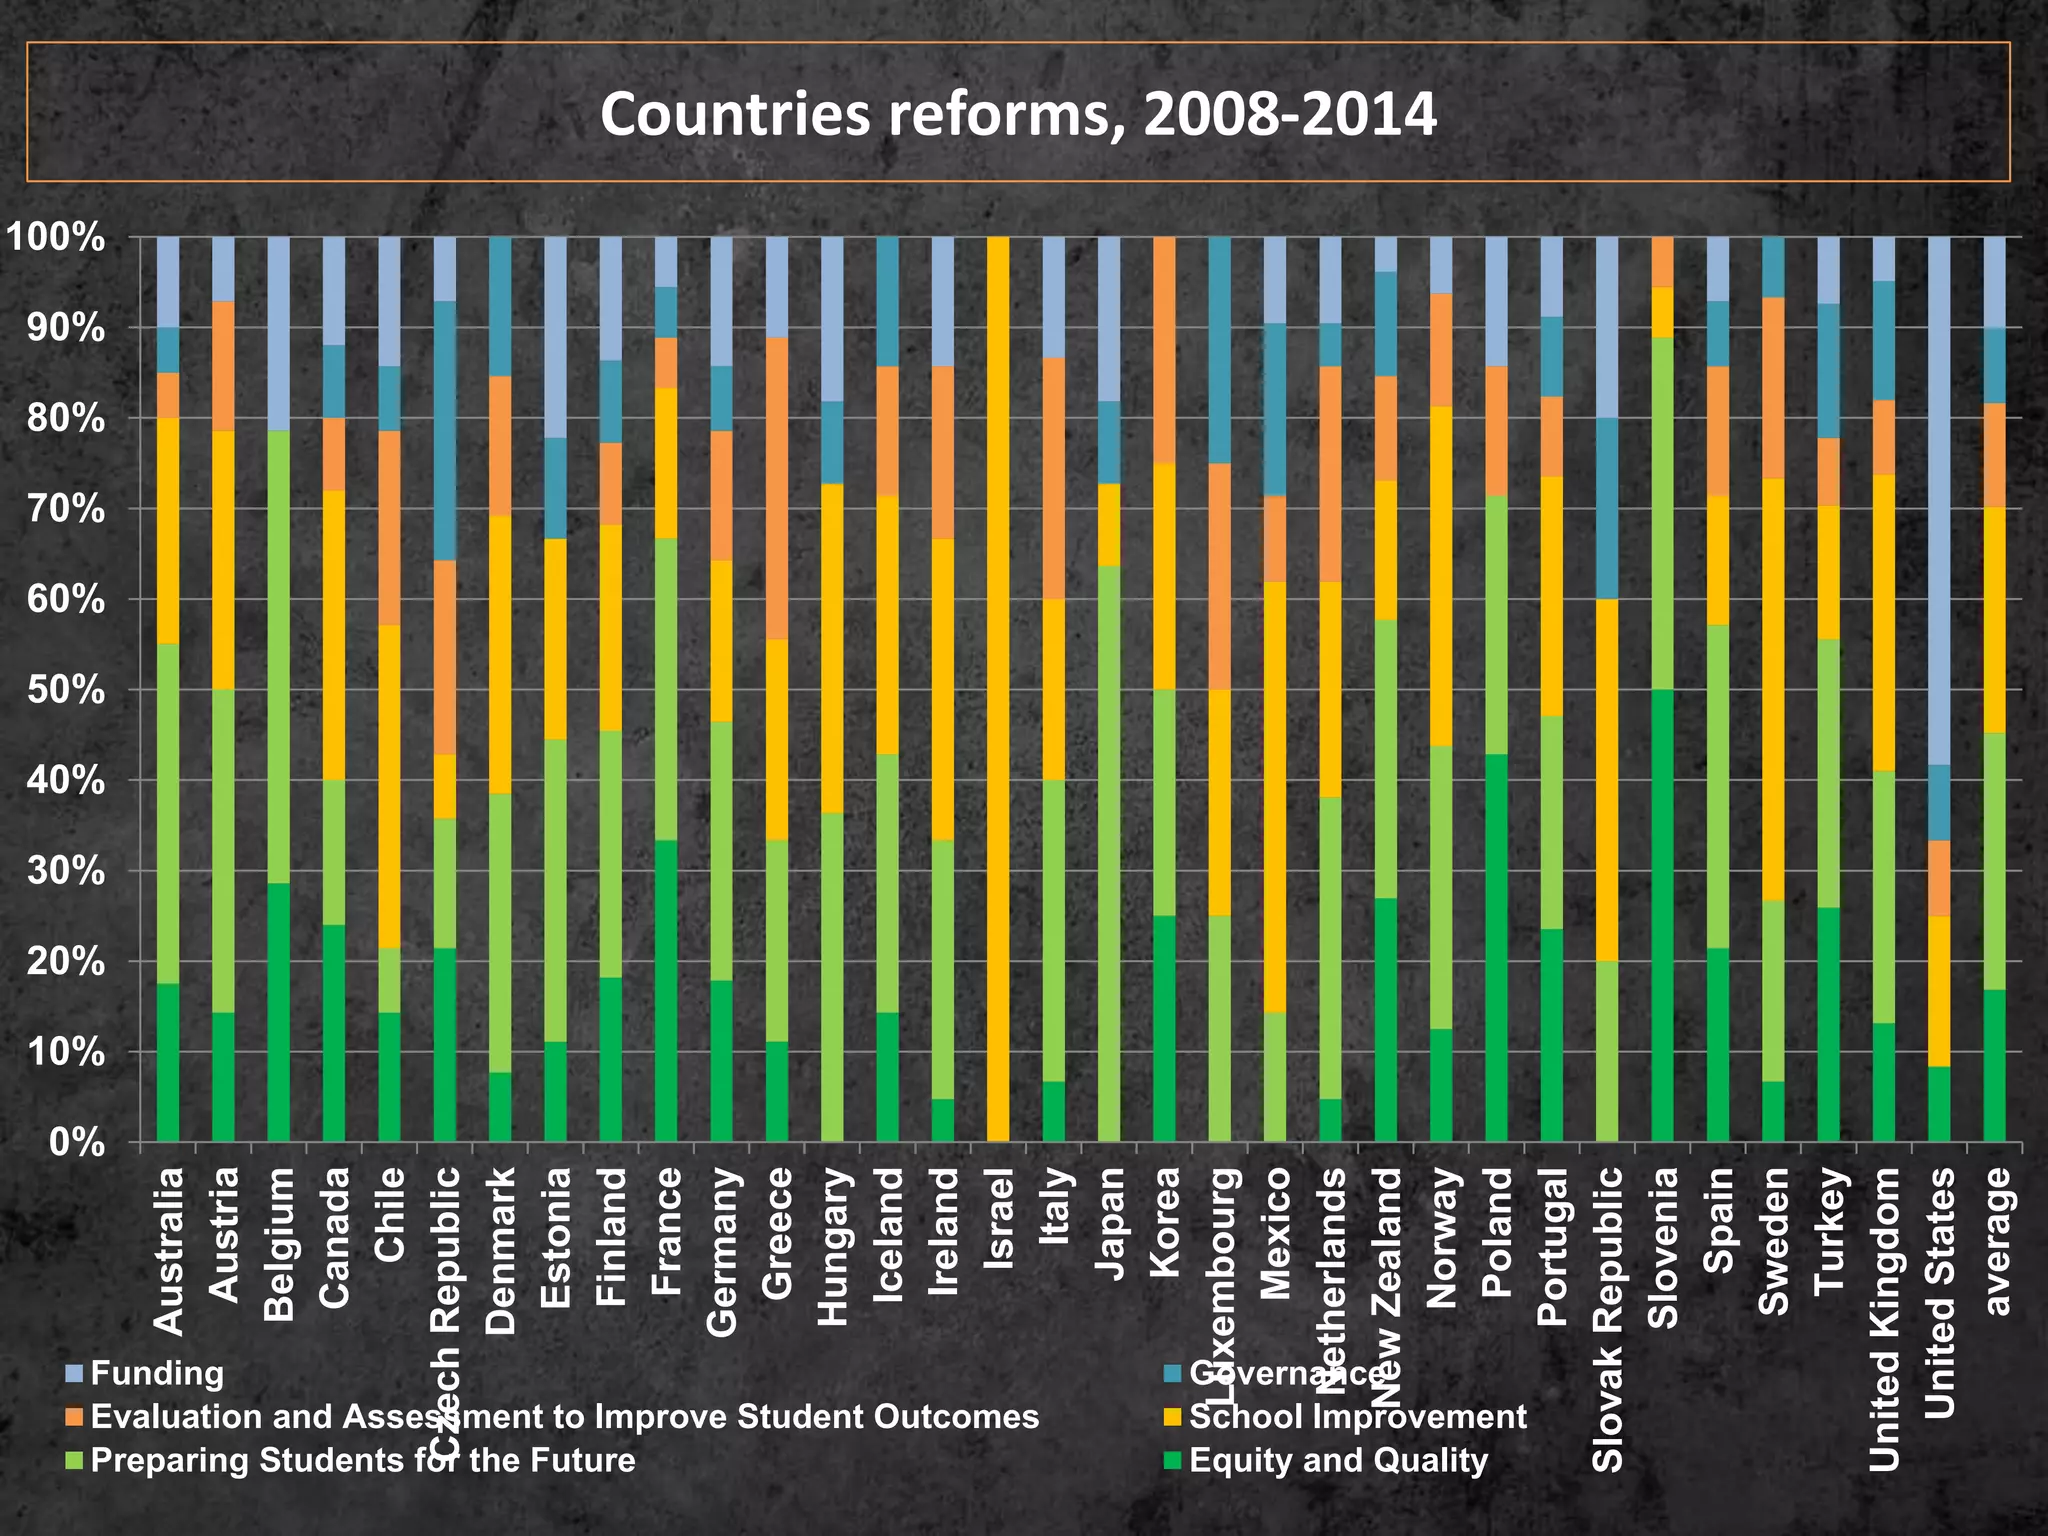
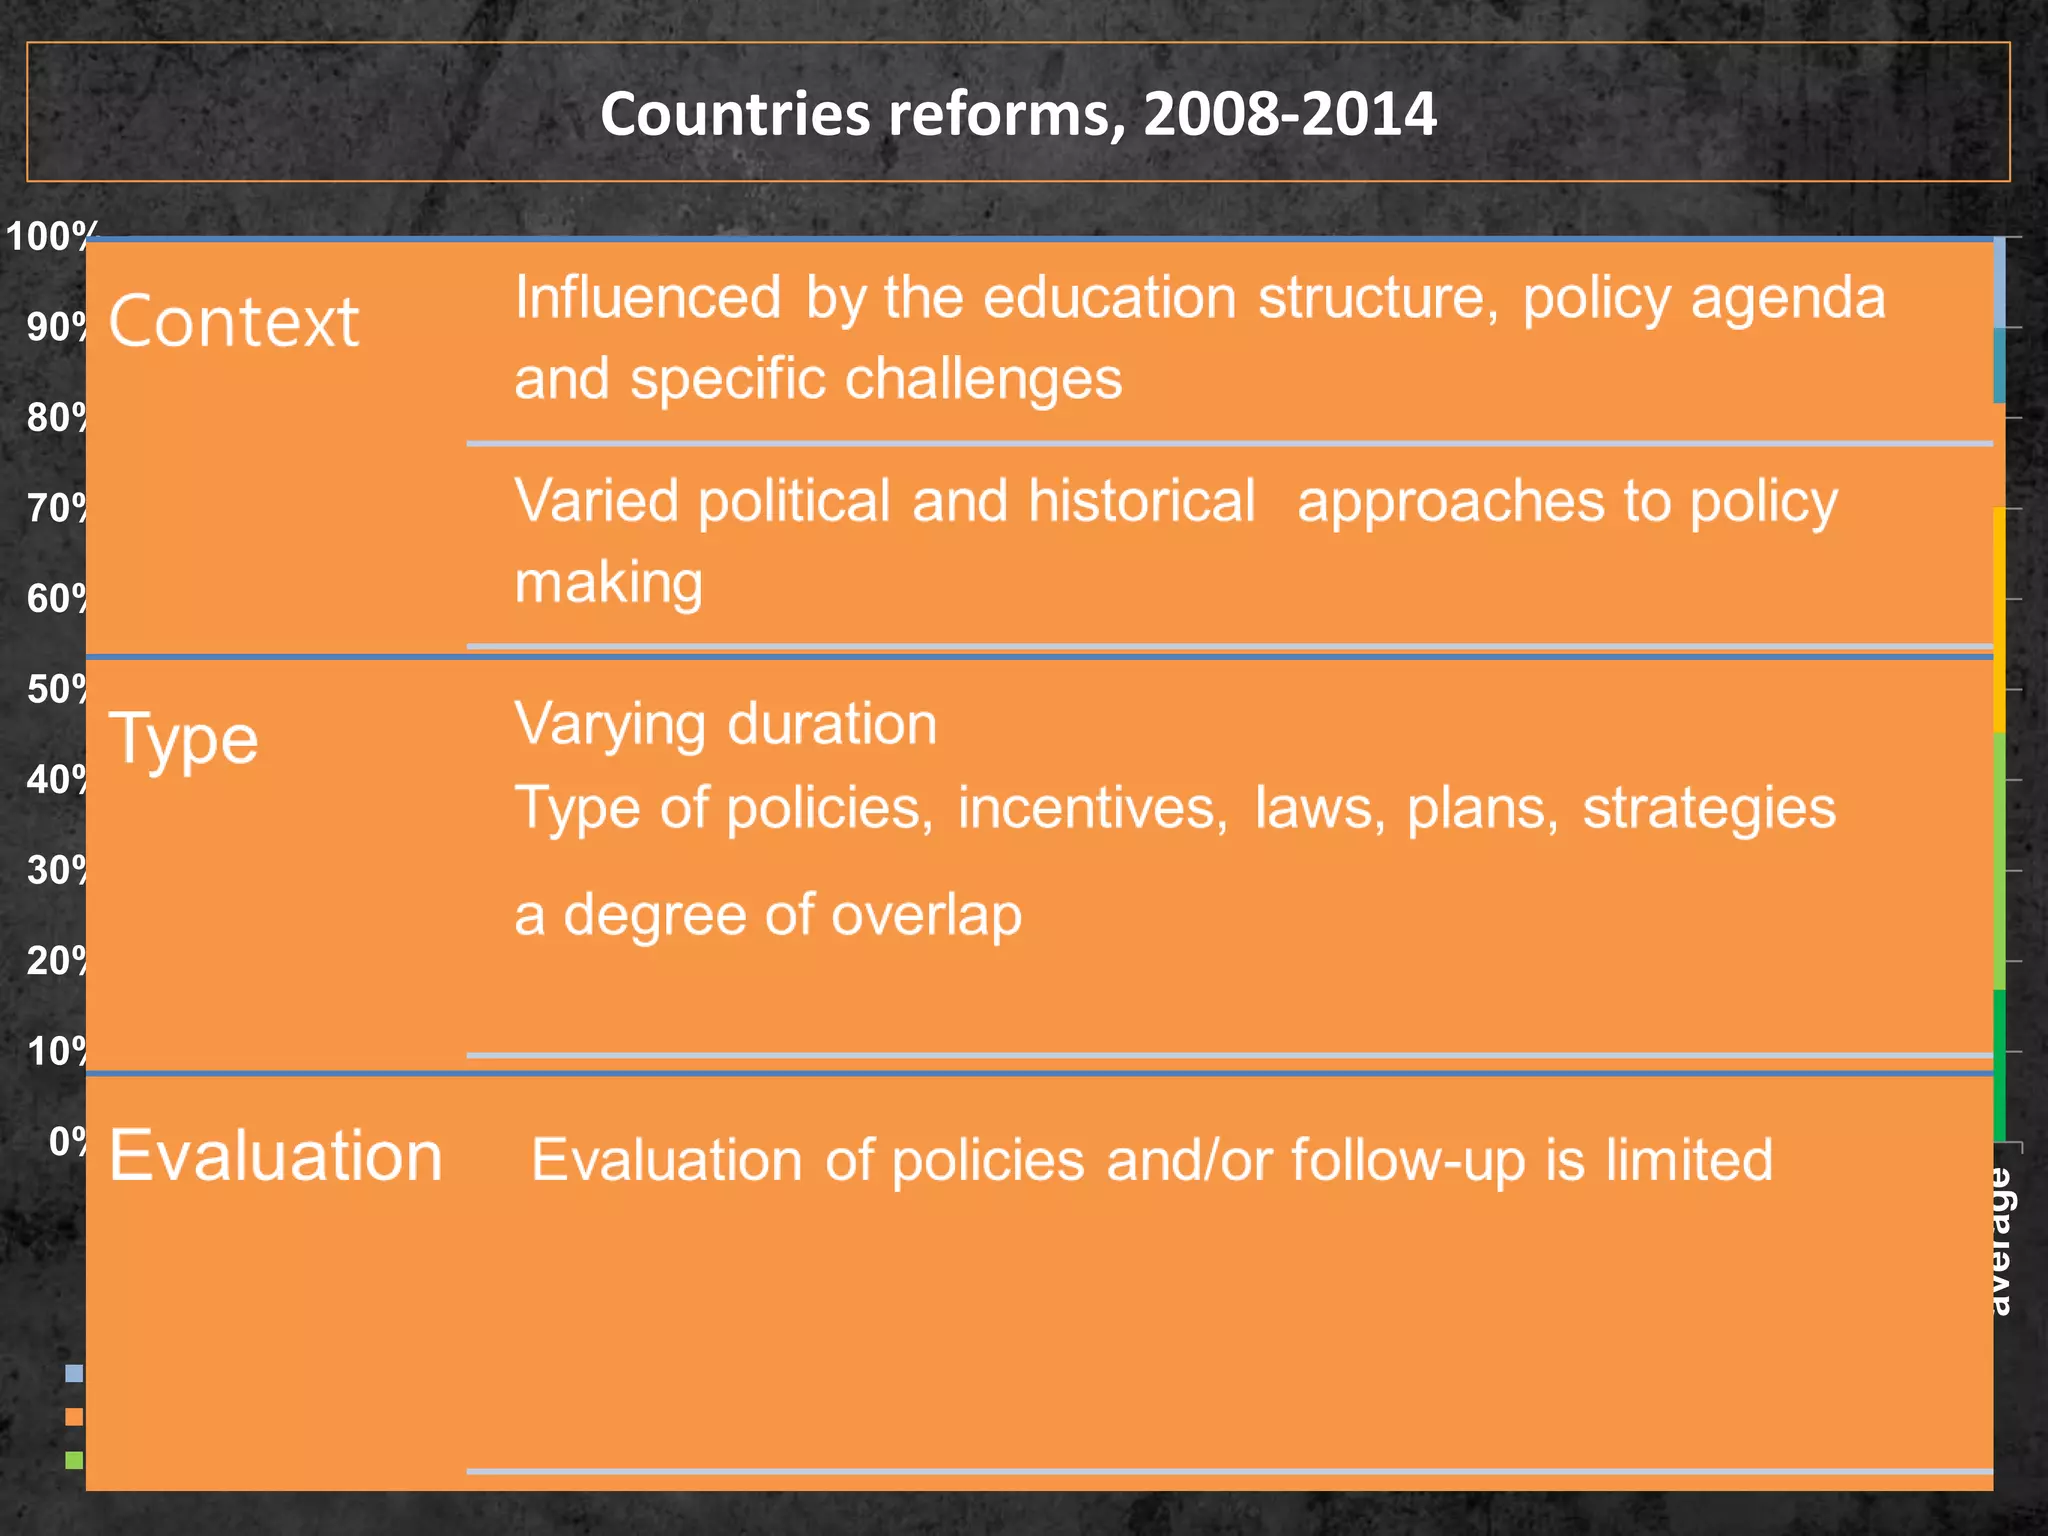
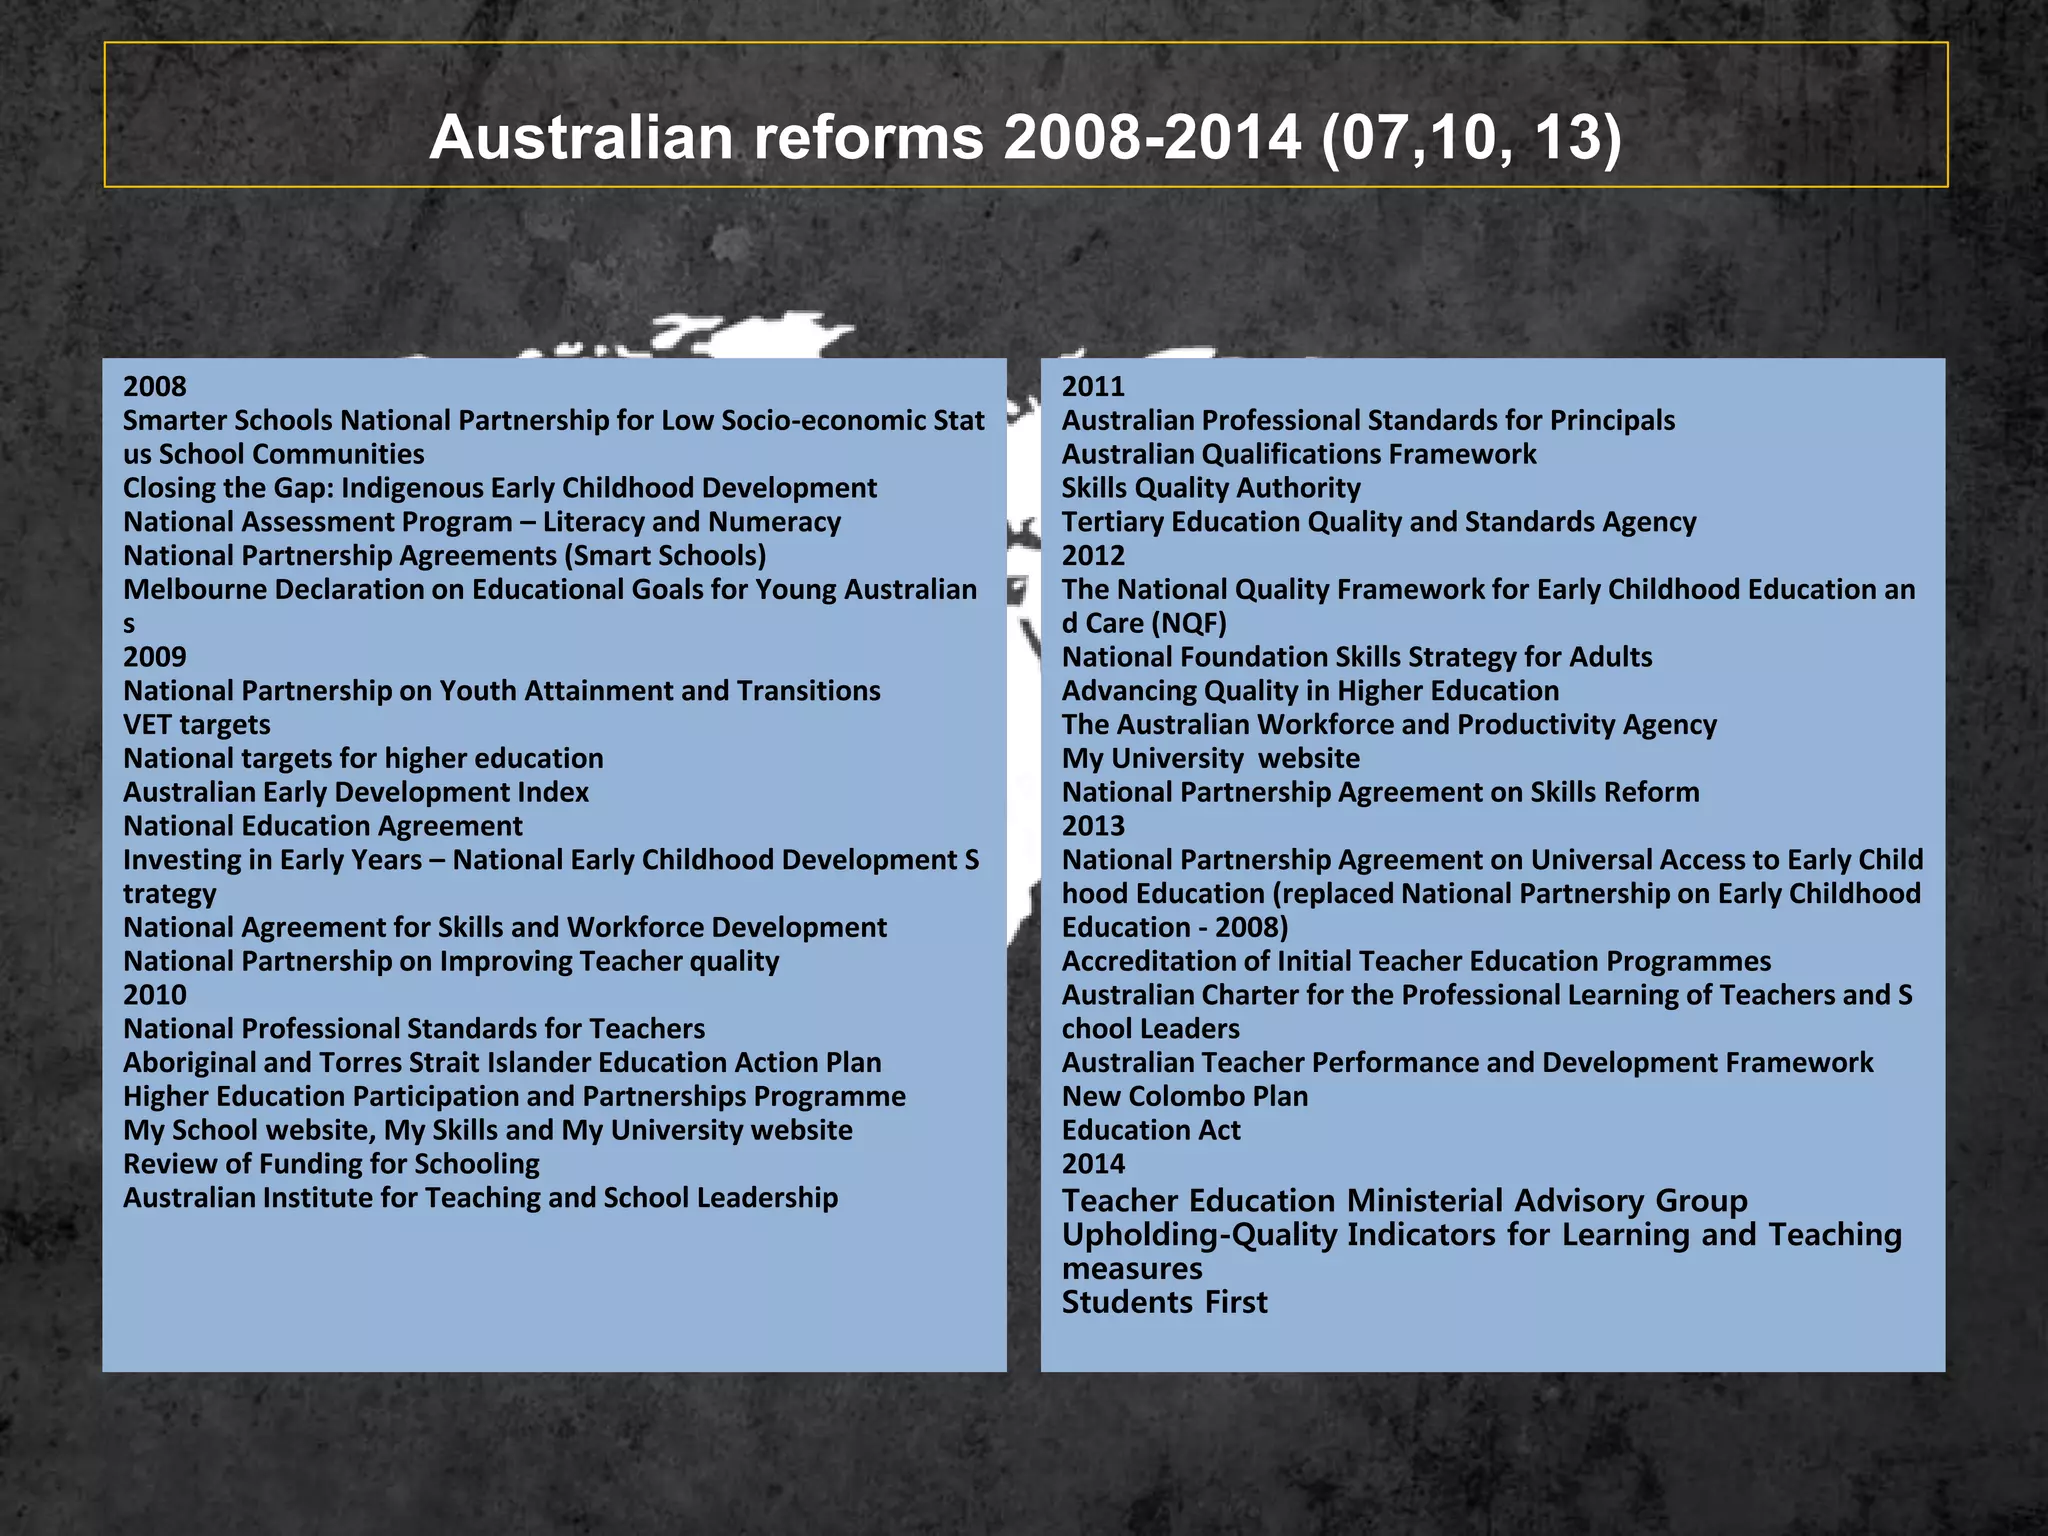
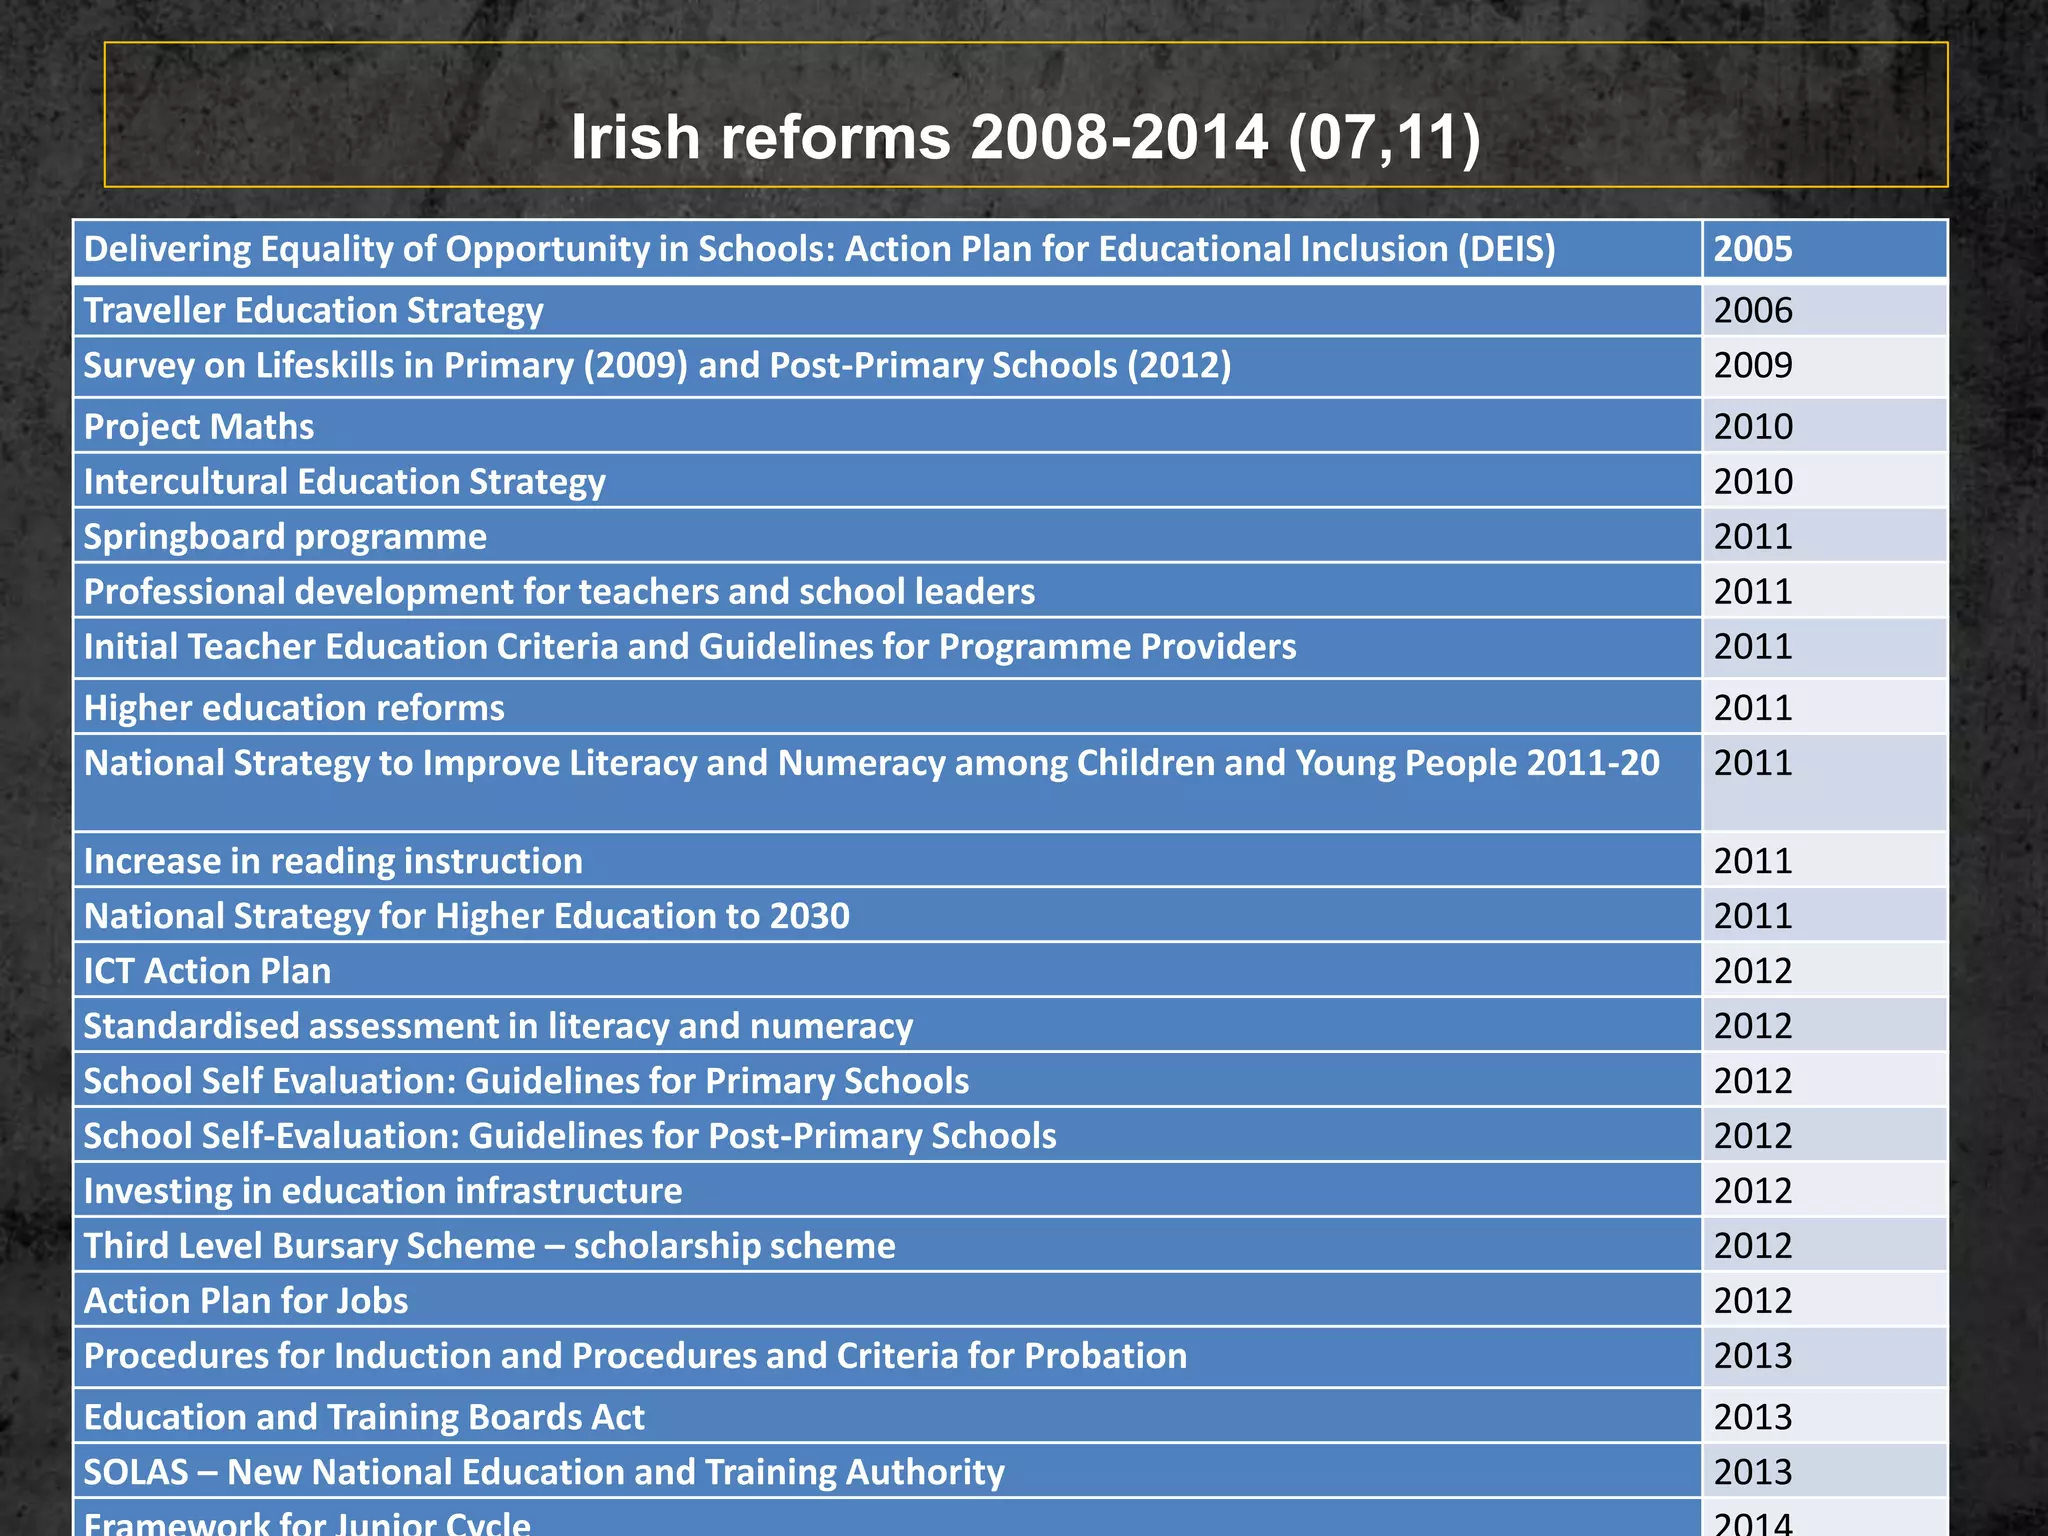
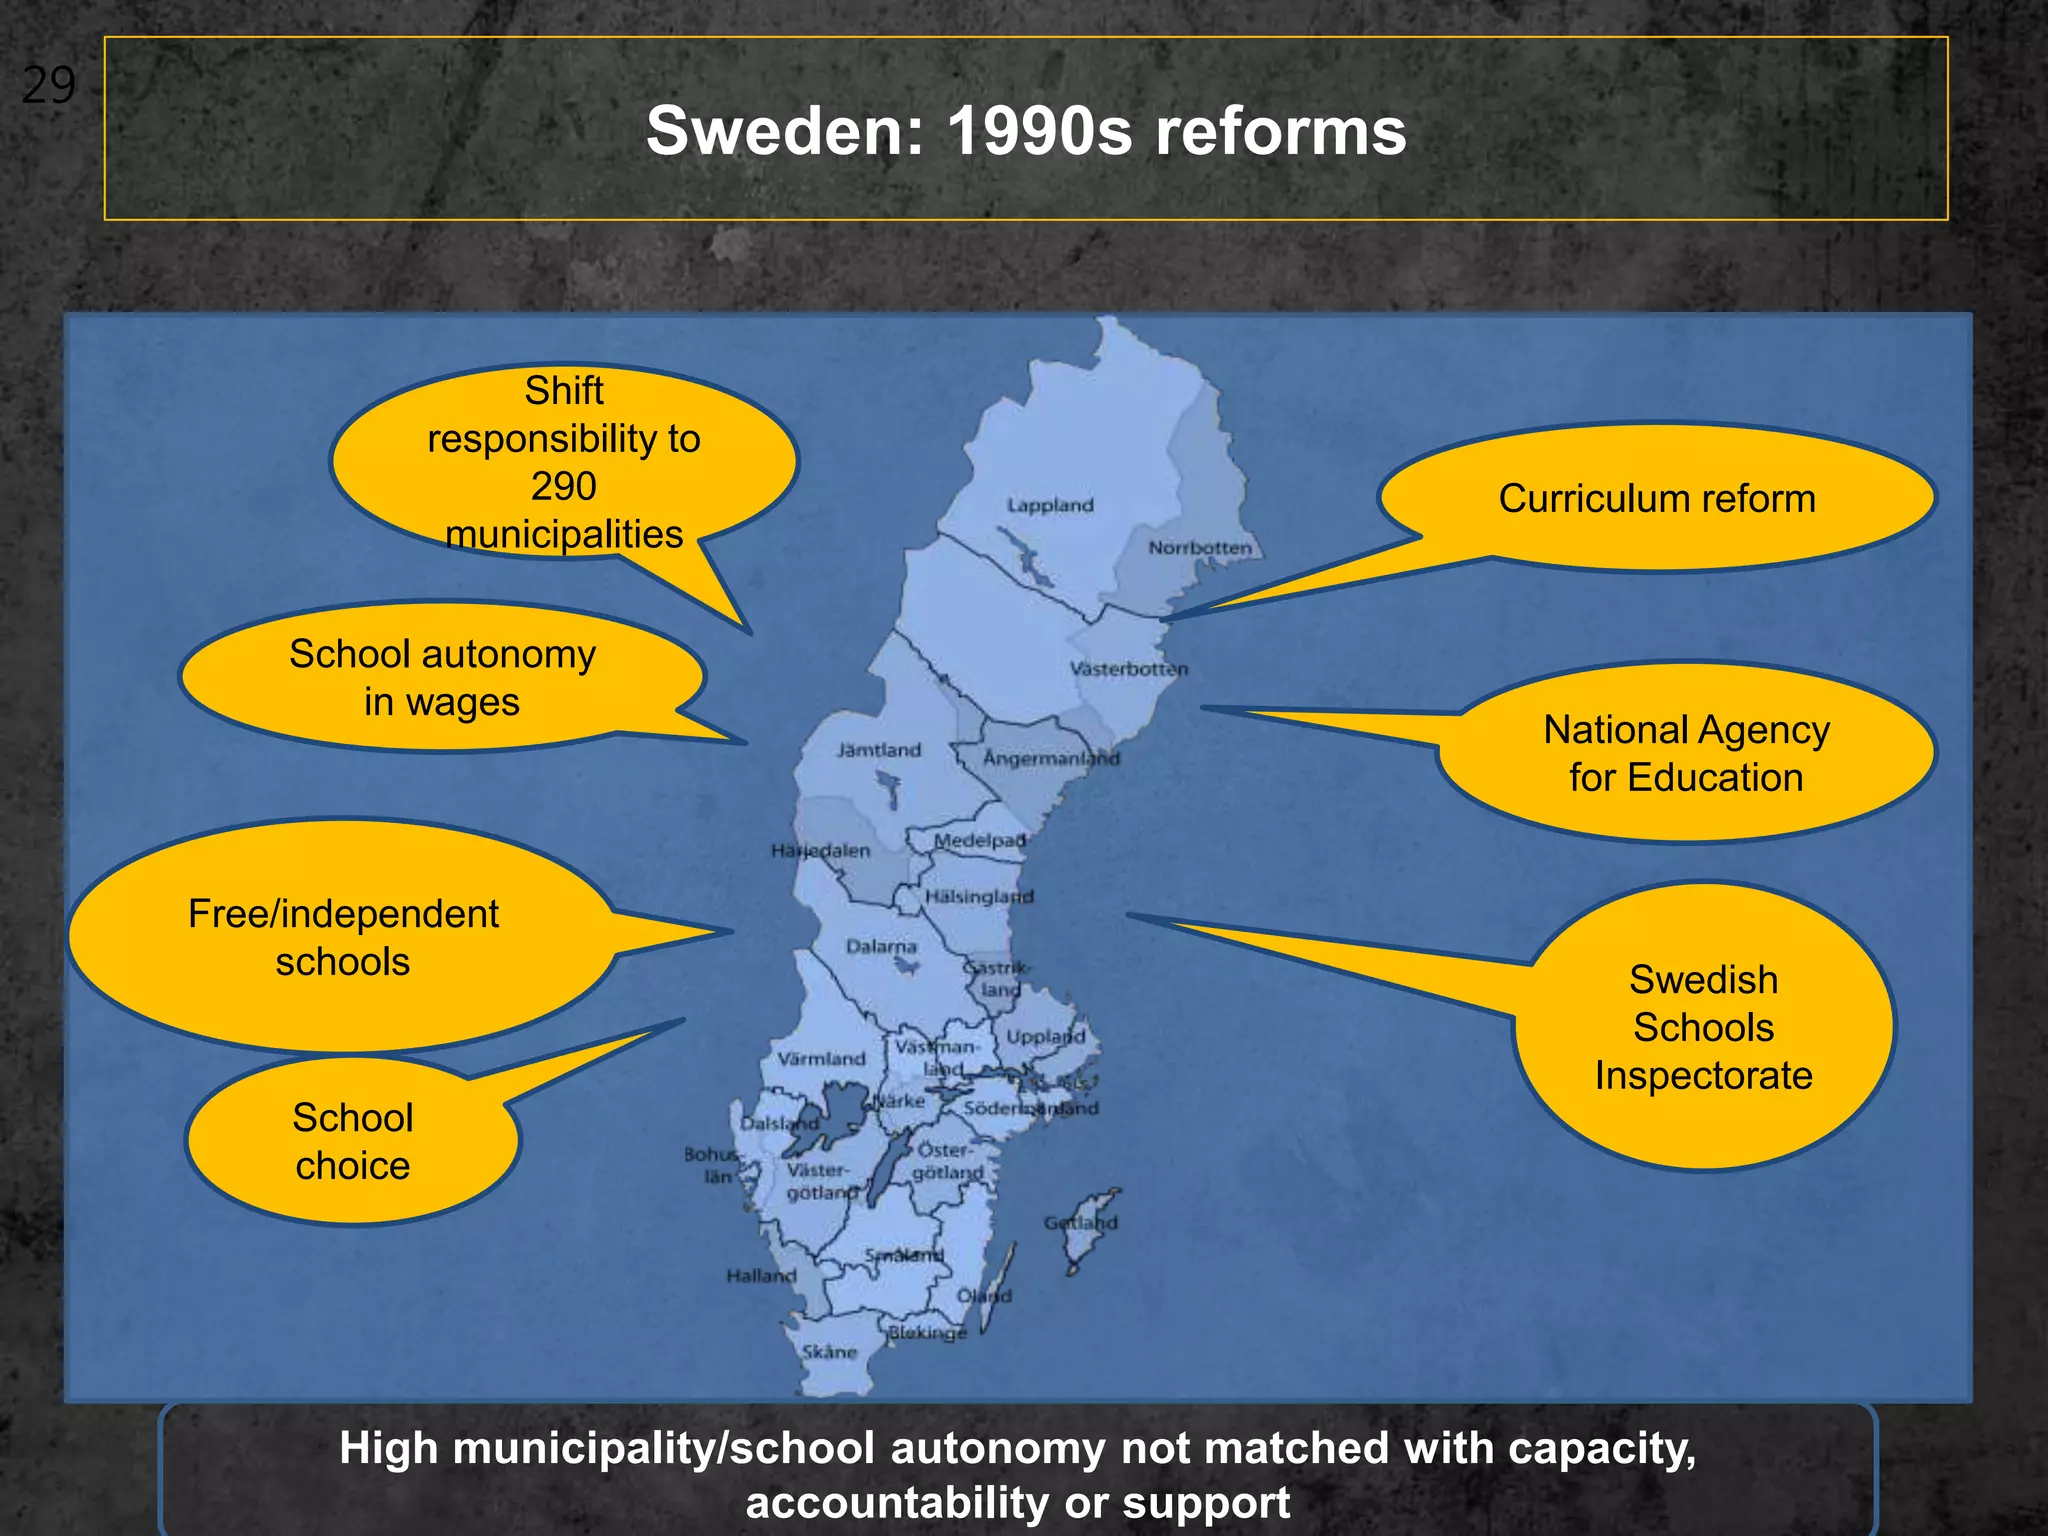
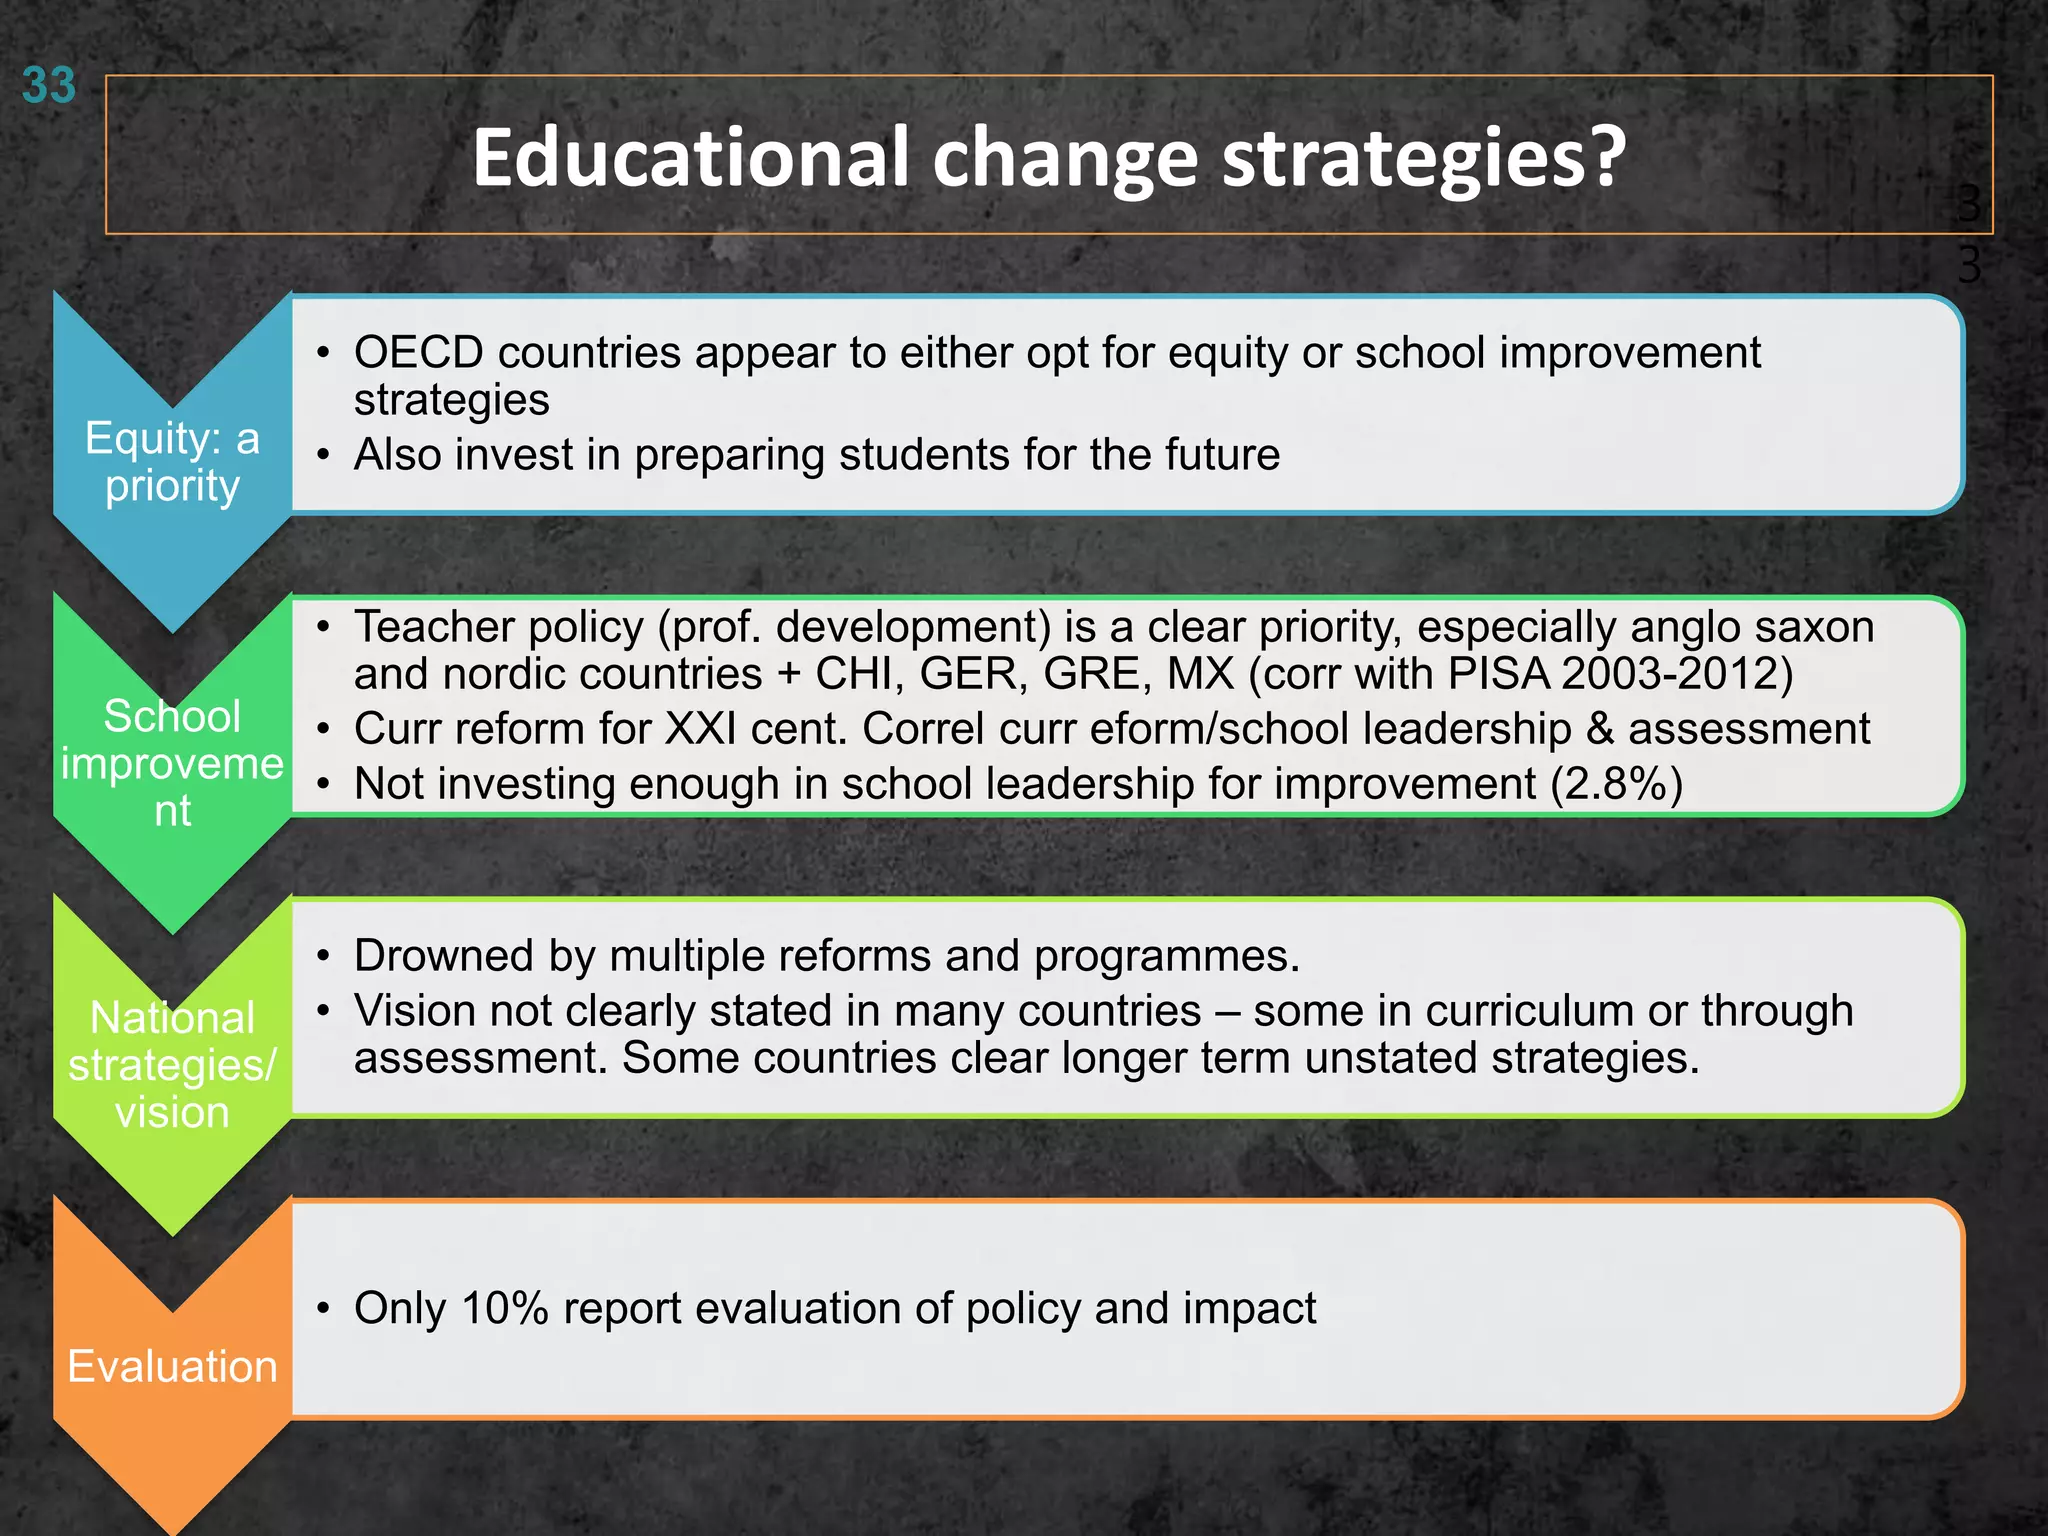
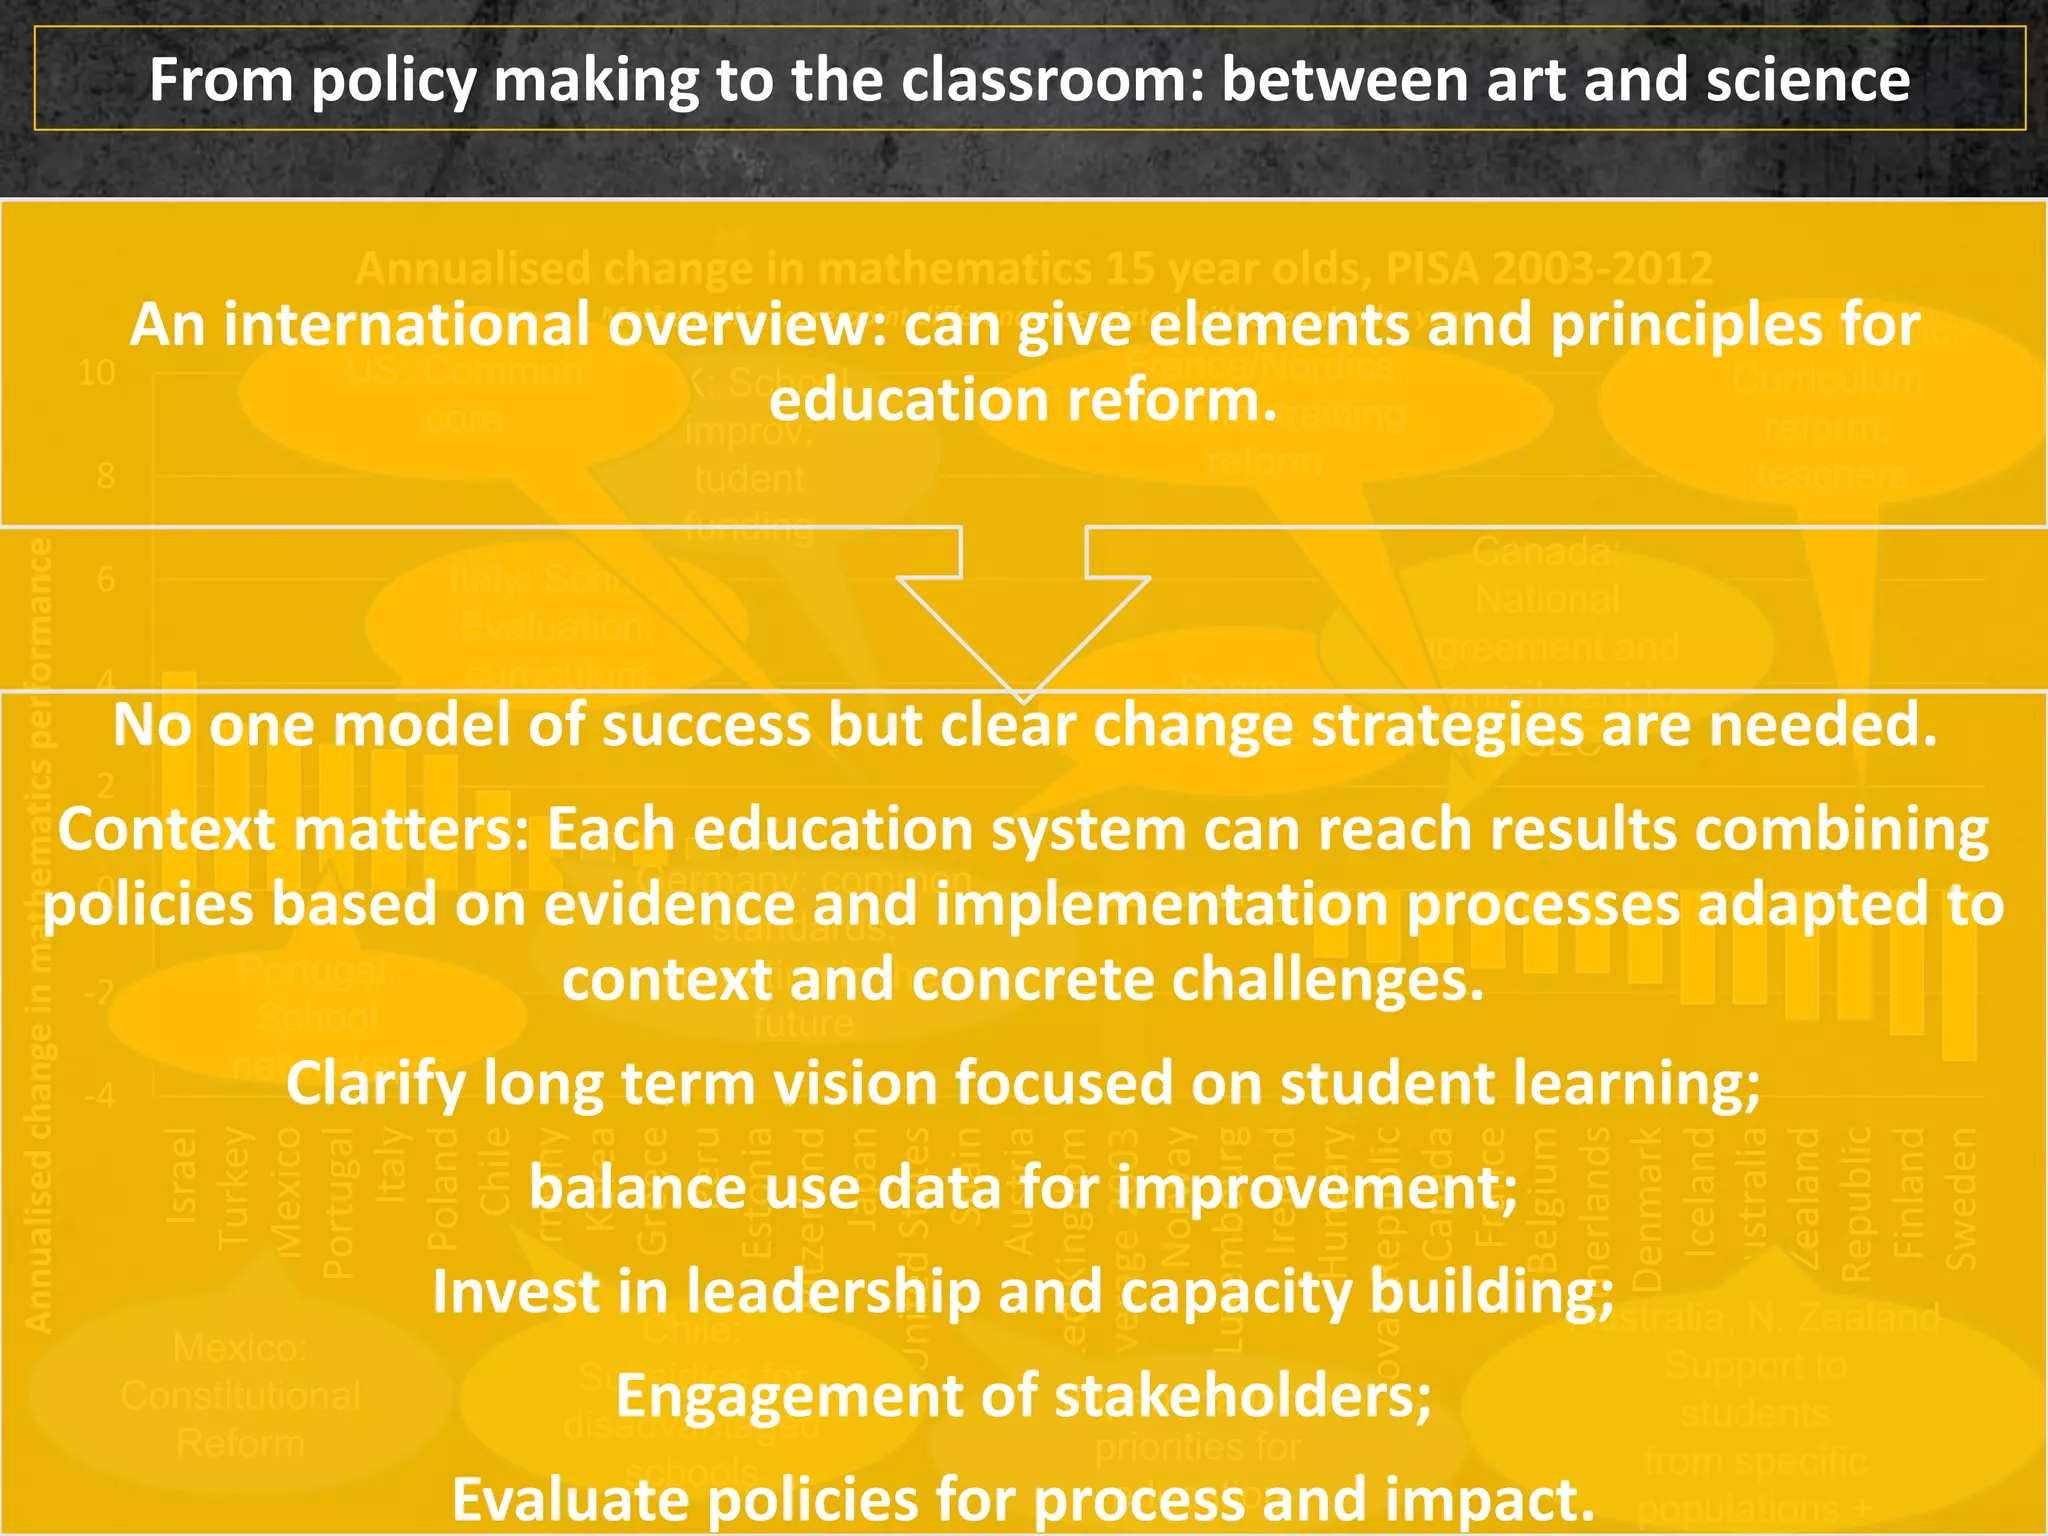


The document reviews OECD education reforms from 2008-2014, focusing on strategies for equity and quality in education. It highlights the gap between policy expectations and classroom implementation, noting over 450 reforms across 33 countries, while emphasizing the need for coherent educational change strategies. Key areas addressed include funding, support for disadvantaged schools, and the importance of resource allocation in improving educational outcomes.


