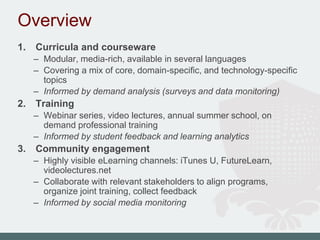
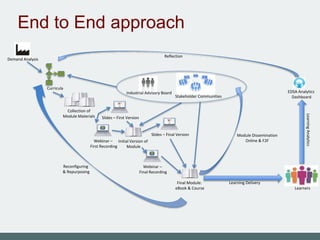
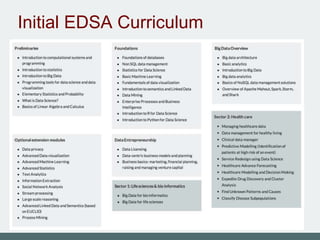
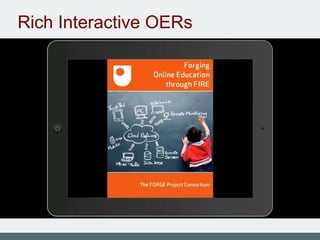
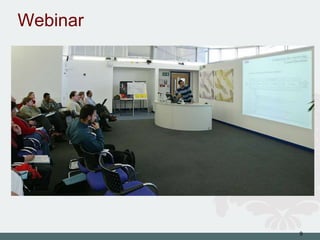
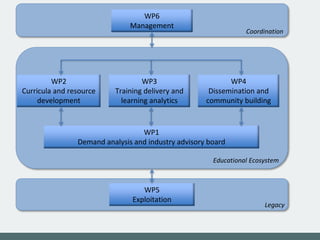
Overview and Vision
John Domingue & Elena Simperl
edsa-project.eu
Vision
• Become the #1 venue for professional training in
data science in Europe
• Establish a sustainable European Data Science
Institute
Overview
1. Curricula and courseware
– Modular, media-rich, available in several languages
– Covering a mix of core, domain-specific, and technology-specific
topics
– Informed by demand analysis (surveys and data monitoring)
2. Training
– Webinar series, video lectures, annual summer school, on
demand professional training
– Informed by student feedback and learning analytics
3. Community engagement
– Highly visible eLearning channels: iTunes U, FutureLearn,
videolectures.net
– Collaborate with relevant stakeholders to align programs,
organize joint training, collect feedback
– Informed by social media monitoring
CURRICULA AND
COURSEWARE
Initial Version of
Module
Final Module:
eBook & Course
Webinar –
Final Recording
Webinar –
First Recording
Collection of
Module Materials Slides – First Version
Slides – Final Version
Stakeholder Communities
Industrial Advisory Board
Demand Analysis
Reflection
Module Dissemination
Online & F2F
LearningAnalytics
Curricula
EDSA Analytics
Dashboard
Reconfiguring
& Repurposing
Learners
Learning Delivery
End to End approach
Initial EDSA Curriculum
Rich Interactive OERs
TRAINING
Webinar
9
Broadcasting booth
10
Video lectures
OU iTunes U Stats
• Open University on iTunes U was launched on
3rd June 2008
• Now 58 iTunes U Courses
• 68,138,000 downloads
• Over 9,015,700 visitors downloaded files
• Currently averaging 87,500 downloads a week
• 449 collections containing 3,485 tracks (1,638
audio, 1,847 video)
• 423 OpenLearn study units as eBooks (ePub),
representing over 5,000 hours of study
• Currently delivering an average of 0.3 TB of
data a week
COMMUNITY ENGAGEMENT
Channels
edsa-project.eu
ESWC Summer School
THE DATA-DRIVEN PROJECT
EDSA Dashboards
• Jobs and skills
• Interviews
• Advisory board
• Learning analytics
• Available courses
http://edsa-project.eu/dashboard/
Monitoring Engagement
04.03.2015
20
Monitoring Engagement (2)
04.03.2015
21
COLLABORATION
CSA EuDEco (Modeling the
European Data Economy
U-TAD Spain
IT as a Utility
Big Data Value cPPP
March 2015
PAGE ‹#›
Over
1,000,000
FutureLearn sign-ups
Over
2,200,000
course sign-ups
PROGRESS SINCE LAUNCH
In just over a year, FutureLearn has built a large userbase
PAGE ‹#›
EXCITING PARTNERSHIP NETWORK
We are partnering with professional bodies to support recognition of
courses
PAGE ‹#›
Co-Branding Courses
on FutureLearn
WP2
Curricula and resource
development
WP3
Training delivery and
learning analytics
WP4
Dissemination and
community building
WP1
Demand analysis and industry advisory board
WP5
Exploitation
Educational Ecosystem
Legacy
WP6
Management
Coordination
Summary
• Project Goals
– Become the #1 venue for professional training in data
science in Europe
– Establish a sustainable European Data Science
Institute
• Comprehensive life-cycle with all activities founded on
real data
• Rich interactive multimedia open educational resources
• Training via webinar series, video lectures, annual
summer school, on demand professional training
• Highly visible eLearning channels for community
engagement
– iTunes U, FutureLearn, videolectures.net
• Many possibilities for fruitful collaboration

EDSA overview and vision

Editor's Notes

  • #23 Module overview Page shows an overall view of one presentation of an OU module Top chart shows average VLE activity in each week compared to VLE activity in the previous years This chart also shows average score in each of the TMAs, again compared with the previous year The bar below the chart shows interesting summaries from the current module presentation with clearly visible trends (compared to the last year) The most important part of the module overview is the table with predictions The table shows predictions for the next TMA as well as for the whole module It is possible sort the table by any of the columns, for example by next TMA prediction Moreover, the user can narrow the view by applying various filter settings, i.e. only students of region XY etc. - After selecting one student, the user is redirected to the student overview page...
  • #24 Student overview Similarly to the module overview page, the top chart shows student’s activity in the VLE together with her TMA performance compared the the average of the whole module To understand, how the prediction models’ decisions were made, the “target” in the bottom left of the chart shows the most similar students to the currently selected student based on demographics and VLE activities It is possible to put different weights to either one of the parameters of the target (the VLE activities and the demographics) The table in the bottom right of the chart shows TMA submission predictions compared to real values and justifications of the predictions To improve the student’s performance based on his current activities, we provide personalized recommendations for each of the students These recommendations consist of various activities which the student is missing and are important for successfully finishing the module The recommendations contain links which point directly to the module website to the appropriate activities and resources
  • #34 Explain what WPs will do and main deliverables