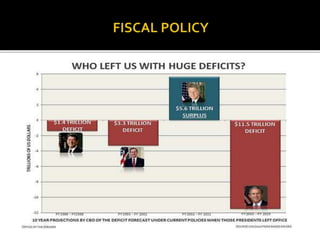
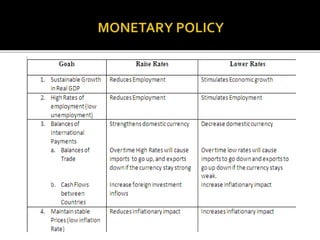
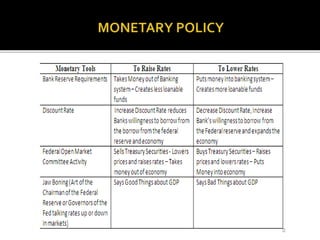
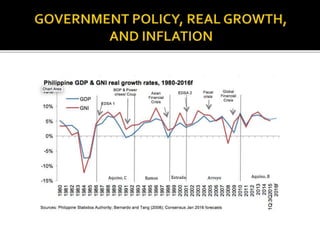
TOPICS:
•ECONOMIC ACTIVITY ANDTHE BUSINESS CYCLE
Federal Government Economic Policy; Fiscal Policy; Monetary Policy;
Government Policy; Real Growth, and Inflation
•BUSINESS CYCLES AND CYCLICAL GROWTH
Economic Indicators
•STOCK PRICES AND ECONOMIC VARIABLE
Money Supply; GDP; Industrial Production and Manufacturing
•BUSINESS CYCLES AND INDUSTRY RELATIONSHIPS
Prepared by:
Bance, Charlotte Ann Grace M.
Elacion, Evelyn B.
Panarigan, Angelica P.
 Employment Act of 1946
Goals:
1. Stable prices
2. Business stability at high levels of production
3. Sustained Real Growth in GDP
4. Balance in international payment
 Highlights
1950-1960
•Focused on Employment and Economic Growth
•Economy grew rapidly between 1961 and 1969
1970’s
•Vietnam War
•Two devaluations of U.S. dollar
 Vietnam War
•High demand for foods and competition
for funds
•High war expenditures
•Budget deficits
 Highlights
1977
•Jimmy Carter 39th President of U.S.
•Goals were thrown into the hands of
Federal Reserve Board (Tight money policy)
Primary Goals:
•Reduce unemployment
•Control Inflation
•Create moderate level of economic growth without
causing more inflation
 Highlights
1980
•Ronal Reagan (40th President of U.S.)
•He instituted a 3 year tax cut to increase
Disposable income and stimulate
consumption and thus economic growth.
•He negotiated reductions in government spending
… Policies were successful in reducing inflation and creating a
strong growth in the GDP, but they were accomplished with
government deficits.
 Highlights
• George H.W. Bush (41th President of U.S.)
•He followed most of Reagan’s policies, but
Focused more on international issues.
•The stock market began a major bull market
In 1982 in response to improved conditions,
But also sustained the biggest one day crash ever on Oct.19,1987
(Black Monday)
*video
•Recession started in July 1990
* video
 Highlights
1992
•Pres. Bill Clinton was elected and run from
1993-2001 as was elected two times in a row.
•He persuaded Congress to pass an increase
in personal and corporate income taxes.
•In 1996 he and the Congress went to work on a balanced budget
proposal. Spending was held in check and tax revenue rose to record
levels as a result of the long term healthy growth of economy.
•Then the stock market started to decline in April 2000 when George
W. Bush took office in January 2001. He imposed “tax cuts” couples
with large expenditures on Iraqi war.
*video
•Fiscal Policy: Government’s taxing and spending policies.
•When a government spend more than it receives, it runs a deficit that
must be financed byTreasury.
•Surpluses happen when revenues exceed expenditures. Surpluses
tend to decrease economic growth as the government slows its
demand for goods and services relative to its income.
•In analysis of fiscal policy, the important consideration for investor is
the determination of the flow of funds.
•When a country’s economy is healthy with high employment and
income, its citizen spends more in general and import more goods
from other countries.When there’s a recession, people spend less,
look for less expensive items, and import fewer goods.
*video
•One area of fiscal policy deals with government’s ability to levy import
taxes or tariffs on foreign goods.
○ Deficit occurred because U.S. consumers purchased more foreign goods
than U.S. companies sold to foreigners.
•Second factor is the exchange between two currencies.
○ If the dollar exchange rate stays high or continues to rise, eventually
British citizens change their buying habits and buy fewer U.S. goods, and
U.S. citizens buy more British goods.
○As world trade increases, exchange rates and economic trends around the
world become more important.While exchange rates and economic
activity are influenced by fiscal policy, they are also affected by monetary
policy.
•Monetary Policy
*video
○ Measures or action by Central Bank to regulate the supply of money in the
Economy. Monetary Policy can be defined as set of guidelines and plans of
action designed to achieve stability and reliability of the financial system
so that it automatically responds and adjusts to the changes and dynamics
of an economy.
○ The Central Bank of the Philippines is chiefly responsible for the
implementation odour monetary policy and is the sole authority on money
matters as embodied in the Section2, Articles of the Amended Republic
Act 265.It regulates the circulation of money in order to help trade and
industry meet their needs. It is the only agency which can issue money in
the Philippines and is responsible for maintaining the stability of peso so it
will always be accepted within and outside the country as a medium of
exchange.
• Monetary policy actions of the BSP are aimed at influencing
the timing , cost and availability of money and credit, as well as
other financial factors, for the purpose of influencing the price
level. In the Philippines, monetary policy instruments are
classified into:
 Open MarketOperations (OMO)
 Rediscounting
 Reserve Requirement
 Direct Controls
 Moral Suasion
•The Gross Domestic Product (GDP) in Philippines was worth
291.97 billion US dollars in 2015.The GDP value of
Philippines represents 0.47 percent of the world economy.
GDP in Philippines averaged 69.01 USD Billion from 1960
until 2015, reaching an all time high of 291.97 USD Billion in
2015 and a record low of 4.40 USD Billion in 1962. GDP in
Philippines is reported by the World Bank.
•The gross domestic product (GDP) measures of national
income and output for a given country's economy.The gross
domestic product (GDP) is equal to the total expenditures for
all final goods and services produced within the country in a
stipulated period of time.
•Trough- represents the end of a recession and beginning of an
expansion.
•Peak- Represents the end of an expansion and the beginning of an
recession
Economic Indicators:
 Leading Indicators- Leading indicator is a measurable economic
factor that changes before the economy starts to follow a particular
pattern or trend. Leading indicators are used to predict changes in
the economy, but they are not always accurate. Bond yields are a
good leading indicator of the market, because investors can use
them to anticipate and speculate on trends in the economy.
 Coincident Indicator- A coincident indicator is a metric which
shows the current state of economic activity within a particular area.
Coincident indicators are important because it shows economists
and policymakers the current state of the economy. Coincident
indicators include employment, real earnings, average weekly hour
worked in manufacturing and the unemployment rate.
 Lagging Indicator- A lagging indicator is a measurable economic
factor that changes after the economy has already begun to follow a
particular pattern or trend.
•Money Supply
○ Total amount of all monetary assets available in an economy at a specific time. It
usually include currencies in circulation and demand deposits depositor’s easily
accessed assets on the books of financial institutions.
○ Money is used as a medium of exchange, a unit of account, and as ready store of
value.
○ The quantity theory model holds that as the supply of money increases relative to
the demand of money, people will make adjustments in their portfolio of assets.
Too much money: Bond,T-bills, Stocks, and Real Assets (Liquidity effect)
*A short-run negative response of interest rates to an increase in the money supply,
often dubbed the "liquidity effect," is central to popular, political, and academic
discussions of monetary policy. The liquidity effect is the first step of the
transmission mechanism of monetary policy in many analyses.
•GDP:The gross domestic product (GDP) measures of national income
and output for a given country's economy.The gross domestic
product (GDP) is equal to the total expenditures for all final goods
and services produced within the country in a stipulated period of
time.
Economic activity

Economic activity

  • 1.
    TOPICS: •ECONOMIC ACTIVITY ANDTHEBUSINESS CYCLE Federal Government Economic Policy; Fiscal Policy; Monetary Policy; Government Policy; Real Growth, and Inflation •BUSINESS CYCLES AND CYCLICAL GROWTH Economic Indicators •STOCK PRICES AND ECONOMIC VARIABLE Money Supply; GDP; Industrial Production and Manufacturing •BUSINESS CYCLES AND INDUSTRY RELATIONSHIPS Prepared by: Bance, Charlotte Ann Grace M. Elacion, Evelyn B. Panarigan, Angelica P.
  • 2.
     Employment Actof 1946 Goals: 1. Stable prices 2. Business stability at high levels of production 3. Sustained Real Growth in GDP 4. Balance in international payment
  • 3.
     Highlights 1950-1960 •Focused onEmployment and Economic Growth •Economy grew rapidly between 1961 and 1969 1970’s •Vietnam War •Two devaluations of U.S. dollar
  • 4.
     Vietnam War •Highdemand for foods and competition for funds •High war expenditures •Budget deficits
  • 5.
     Highlights 1977 •Jimmy Carter39th President of U.S. •Goals were thrown into the hands of Federal Reserve Board (Tight money policy) Primary Goals: •Reduce unemployment •Control Inflation •Create moderate level of economic growth without causing more inflation
  • 8.
     Highlights 1980 •Ronal Reagan(40th President of U.S.) •He instituted a 3 year tax cut to increase Disposable income and stimulate consumption and thus economic growth. •He negotiated reductions in government spending … Policies were successful in reducing inflation and creating a strong growth in the GDP, but they were accomplished with government deficits.
  • 9.
     Highlights • GeorgeH.W. Bush (41th President of U.S.) •He followed most of Reagan’s policies, but Focused more on international issues. •The stock market began a major bull market In 1982 in response to improved conditions, But also sustained the biggest one day crash ever on Oct.19,1987 (Black Monday) *video •Recession started in July 1990 * video
  • 10.
     Highlights 1992 •Pres. BillClinton was elected and run from 1993-2001 as was elected two times in a row. •He persuaded Congress to pass an increase in personal and corporate income taxes. •In 1996 he and the Congress went to work on a balanced budget proposal. Spending was held in check and tax revenue rose to record levels as a result of the long term healthy growth of economy. •Then the stock market started to decline in April 2000 when George W. Bush took office in January 2001. He imposed “tax cuts” couples with large expenditures on Iraqi war. *video
  • 11.
    •Fiscal Policy: Government’staxing and spending policies. •When a government spend more than it receives, it runs a deficit that must be financed byTreasury. •Surpluses happen when revenues exceed expenditures. Surpluses tend to decrease economic growth as the government slows its demand for goods and services relative to its income. •In analysis of fiscal policy, the important consideration for investor is the determination of the flow of funds. •When a country’s economy is healthy with high employment and income, its citizen spends more in general and import more goods from other countries.When there’s a recession, people spend less, look for less expensive items, and import fewer goods. *video
  • 15.
    •One area offiscal policy deals with government’s ability to levy import taxes or tariffs on foreign goods. ○ Deficit occurred because U.S. consumers purchased more foreign goods than U.S. companies sold to foreigners. •Second factor is the exchange between two currencies. ○ If the dollar exchange rate stays high or continues to rise, eventually British citizens change their buying habits and buy fewer U.S. goods, and U.S. citizens buy more British goods. ○As world trade increases, exchange rates and economic trends around the world become more important.While exchange rates and economic activity are influenced by fiscal policy, they are also affected by monetary policy.
  • 16.
    •Monetary Policy *video ○ Measuresor action by Central Bank to regulate the supply of money in the Economy. Monetary Policy can be defined as set of guidelines and plans of action designed to achieve stability and reliability of the financial system so that it automatically responds and adjusts to the changes and dynamics of an economy. ○ The Central Bank of the Philippines is chiefly responsible for the implementation odour monetary policy and is the sole authority on money matters as embodied in the Section2, Articles of the Amended Republic Act 265.It regulates the circulation of money in order to help trade and industry meet their needs. It is the only agency which can issue money in the Philippines and is responsible for maintaining the stability of peso so it will always be accepted within and outside the country as a medium of exchange.
  • 17.
    • Monetary policyactions of the BSP are aimed at influencing the timing , cost and availability of money and credit, as well as other financial factors, for the purpose of influencing the price level. In the Philippines, monetary policy instruments are classified into:  Open MarketOperations (OMO)  Rediscounting  Reserve Requirement  Direct Controls  Moral Suasion
  • 20.
    •The Gross DomesticProduct (GDP) in Philippines was worth 291.97 billion US dollars in 2015.The GDP value of Philippines represents 0.47 percent of the world economy. GDP in Philippines averaged 69.01 USD Billion from 1960 until 2015, reaching an all time high of 291.97 USD Billion in 2015 and a record low of 4.40 USD Billion in 1962. GDP in Philippines is reported by the World Bank. •The gross domestic product (GDP) measures of national income and output for a given country's economy.The gross domestic product (GDP) is equal to the total expenditures for all final goods and services produced within the country in a stipulated period of time.
  • 24.
    •Trough- represents theend of a recession and beginning of an expansion. •Peak- Represents the end of an expansion and the beginning of an recession Economic Indicators:  Leading Indicators- Leading indicator is a measurable economic factor that changes before the economy starts to follow a particular pattern or trend. Leading indicators are used to predict changes in the economy, but they are not always accurate. Bond yields are a good leading indicator of the market, because investors can use them to anticipate and speculate on trends in the economy.
  • 25.
     Coincident Indicator-A coincident indicator is a metric which shows the current state of economic activity within a particular area. Coincident indicators are important because it shows economists and policymakers the current state of the economy. Coincident indicators include employment, real earnings, average weekly hour worked in manufacturing and the unemployment rate.  Lagging Indicator- A lagging indicator is a measurable economic factor that changes after the economy has already begun to follow a particular pattern or trend.
  • 26.
    •Money Supply ○ Totalamount of all monetary assets available in an economy at a specific time. It usually include currencies in circulation and demand deposits depositor’s easily accessed assets on the books of financial institutions. ○ Money is used as a medium of exchange, a unit of account, and as ready store of value. ○ The quantity theory model holds that as the supply of money increases relative to the demand of money, people will make adjustments in their portfolio of assets. Too much money: Bond,T-bills, Stocks, and Real Assets (Liquidity effect) *A short-run negative response of interest rates to an increase in the money supply, often dubbed the "liquidity effect," is central to popular, political, and academic discussions of monetary policy. The liquidity effect is the first step of the transmission mechanism of monetary policy in many analyses.
  • 29.
    •GDP:The gross domesticproduct (GDP) measures of national income and output for a given country's economy.The gross domestic product (GDP) is equal to the total expenditures for all final goods and services produced within the country in a stipulated period of time.