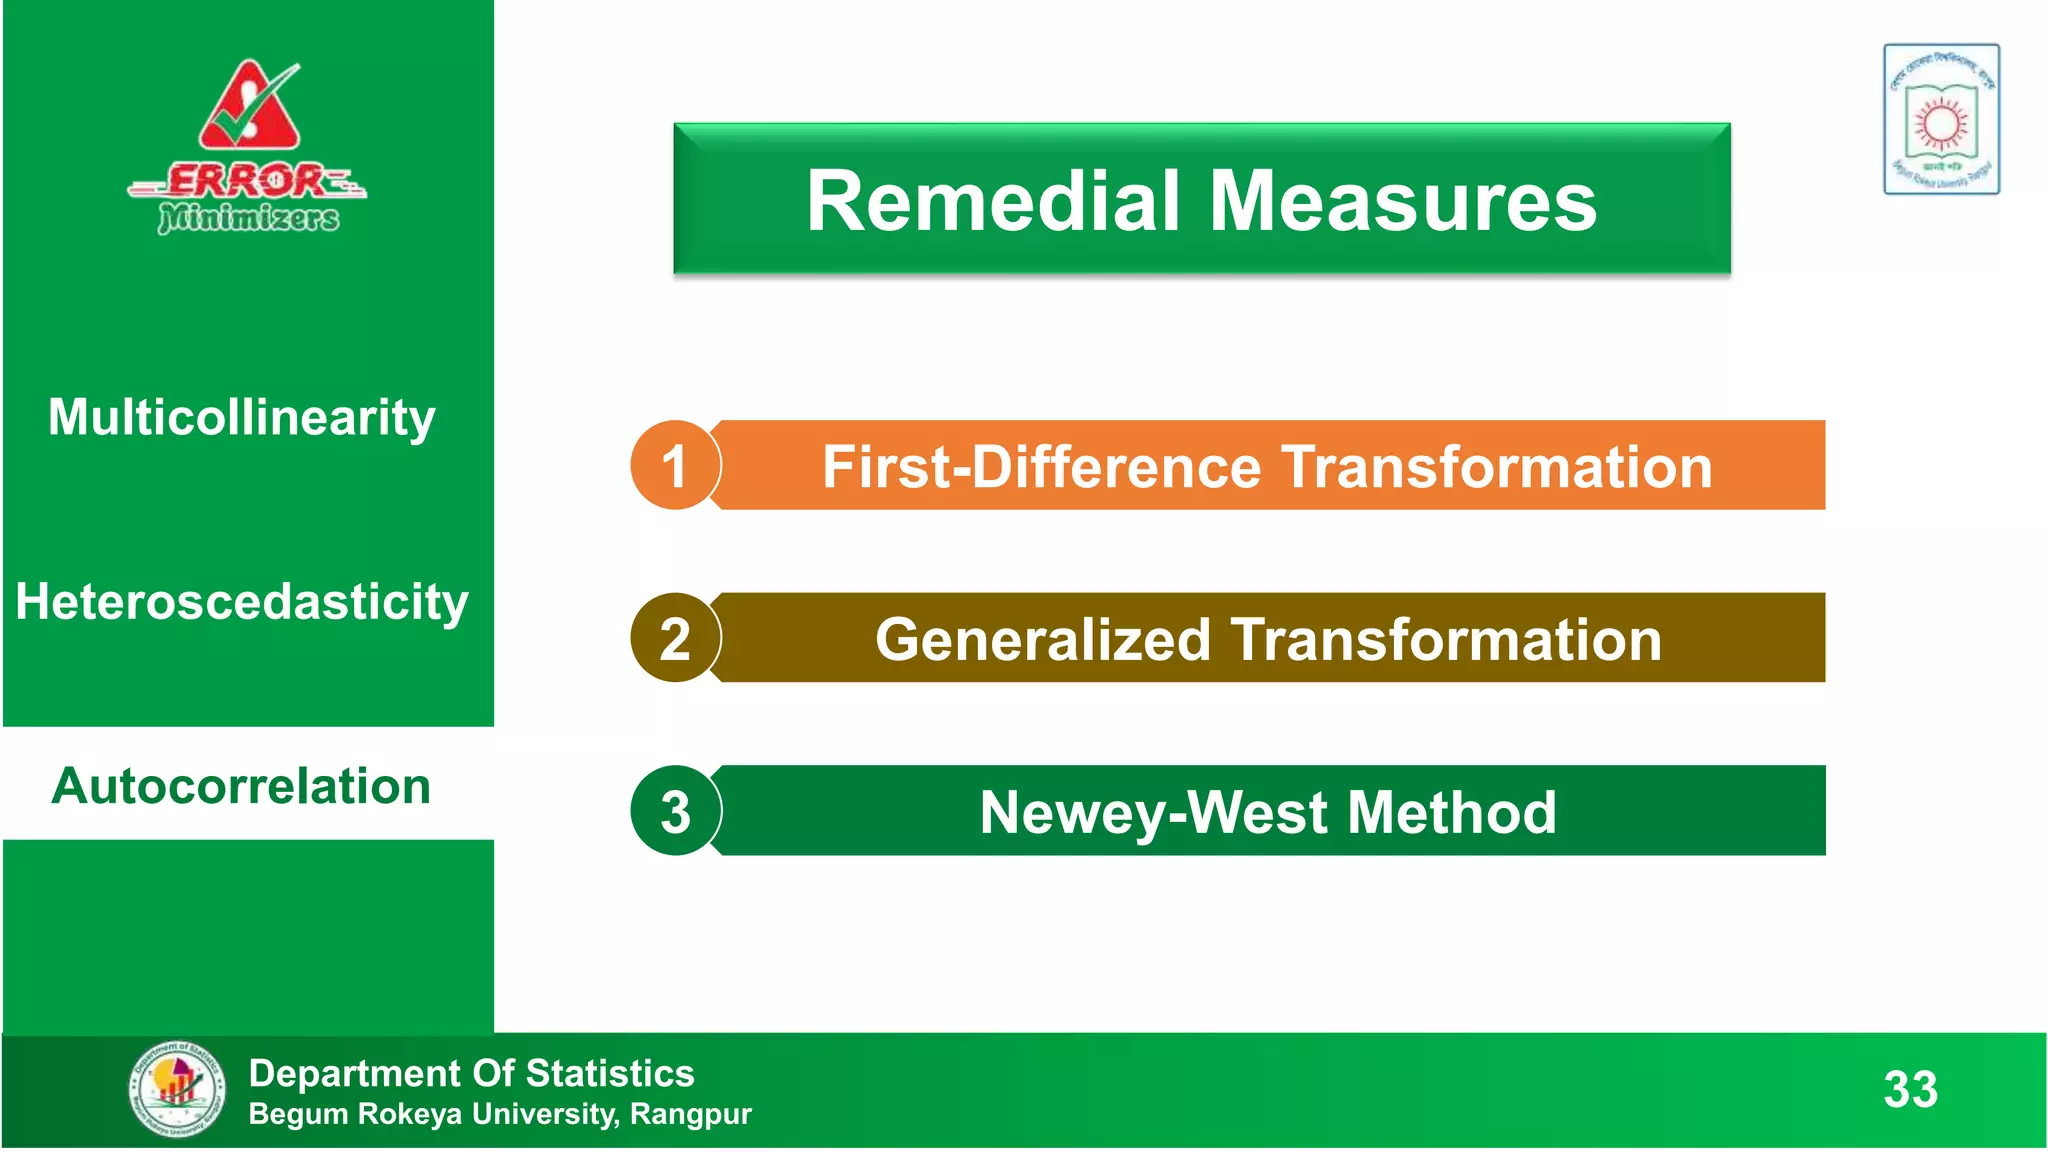
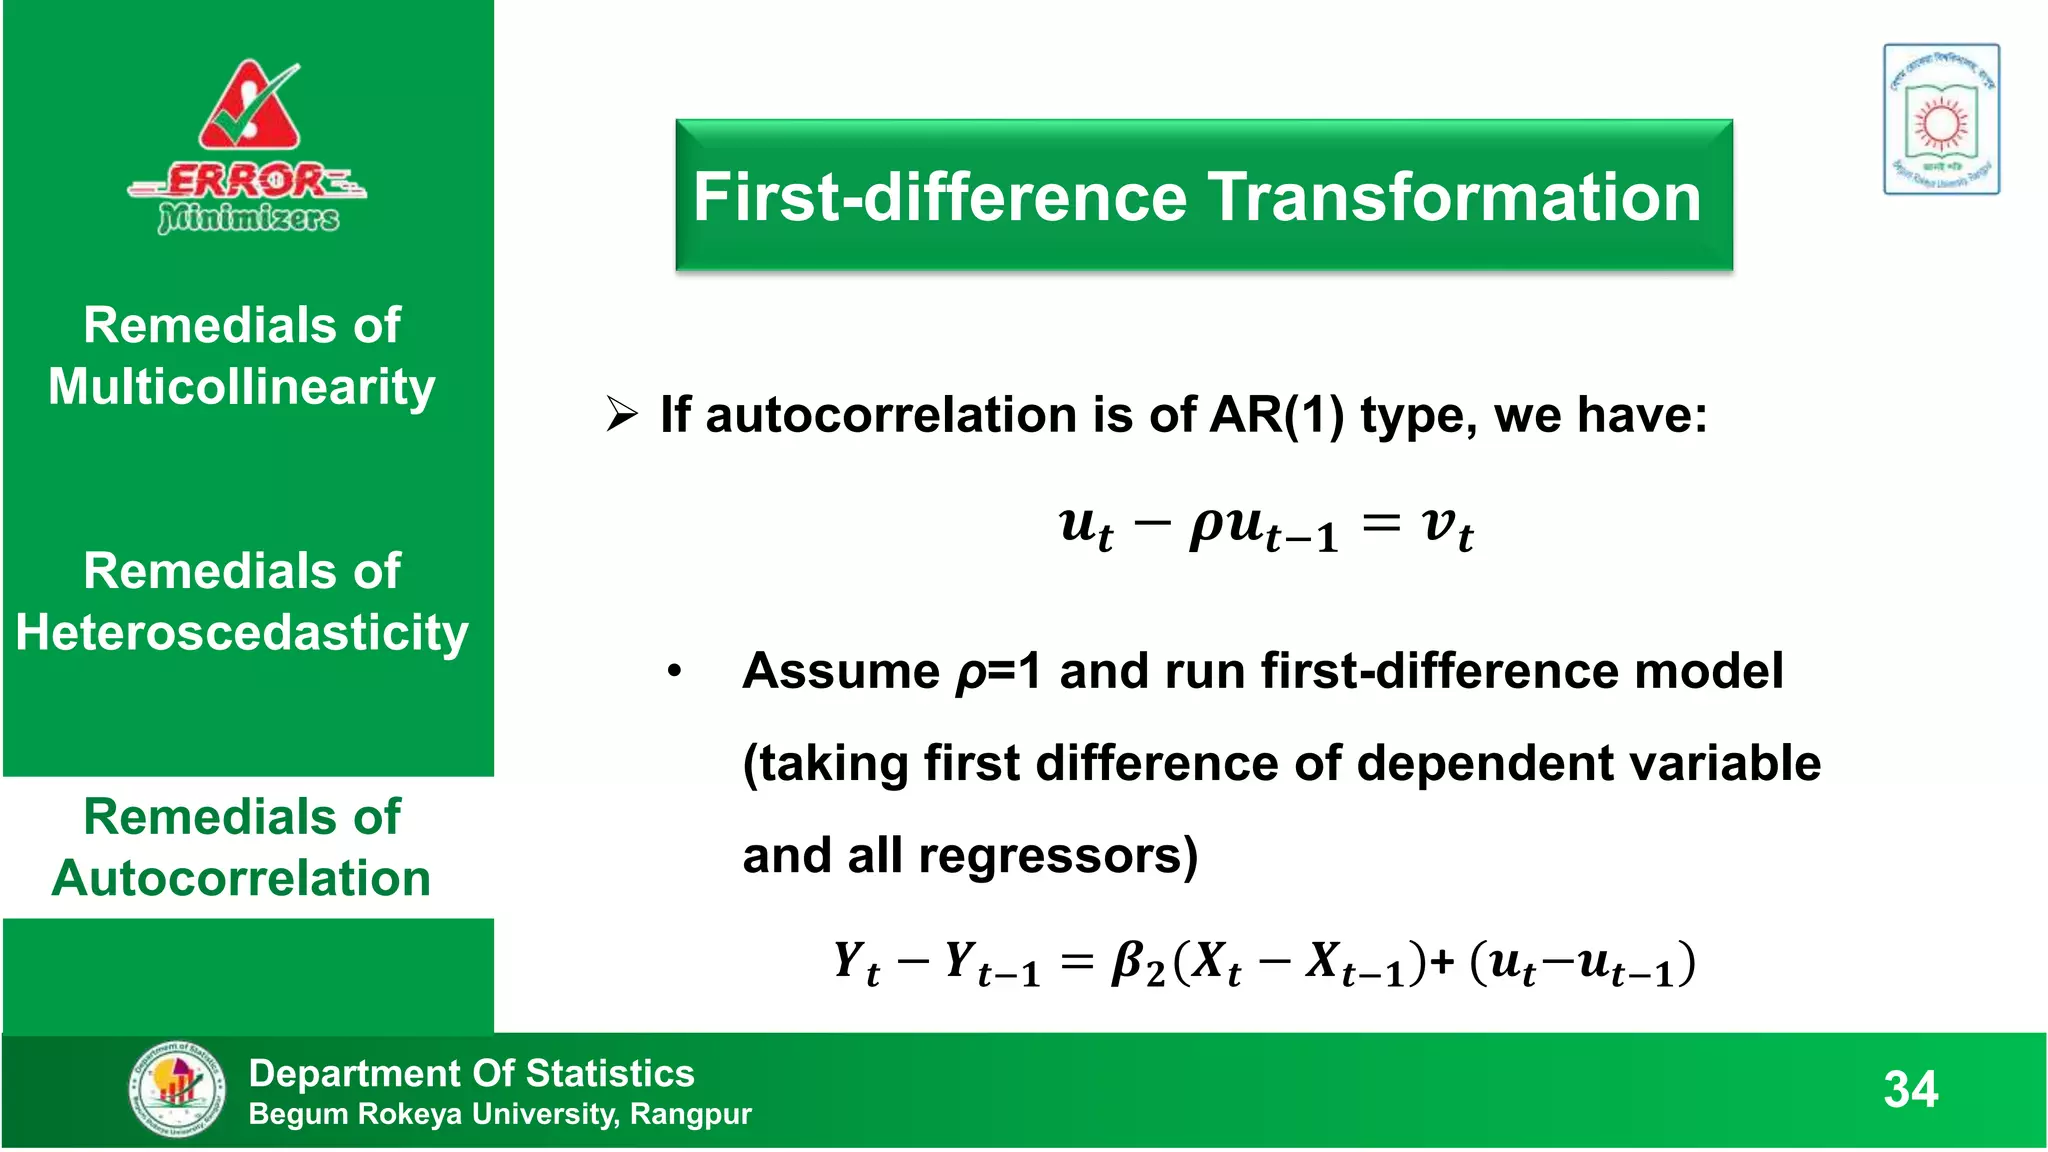
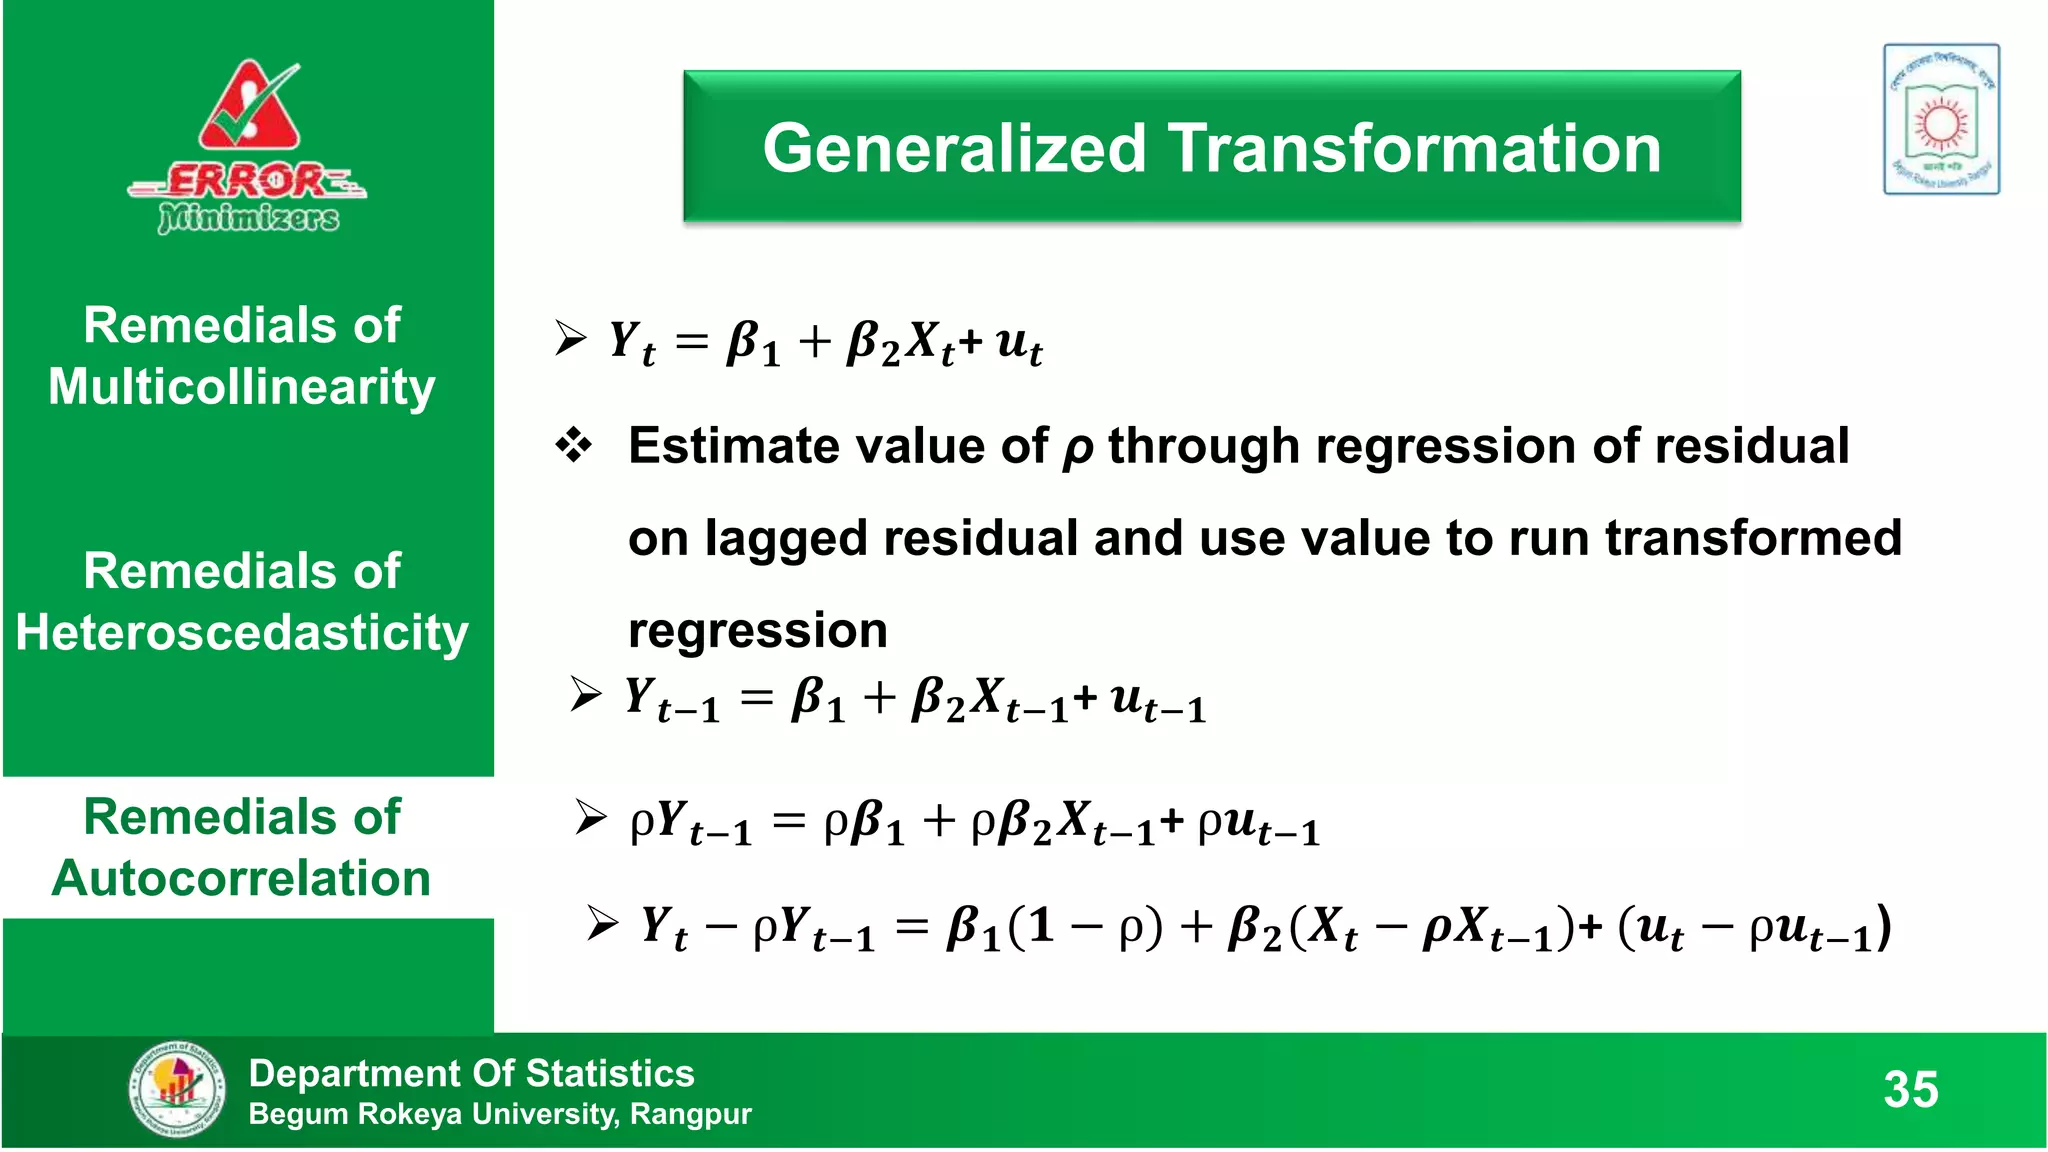
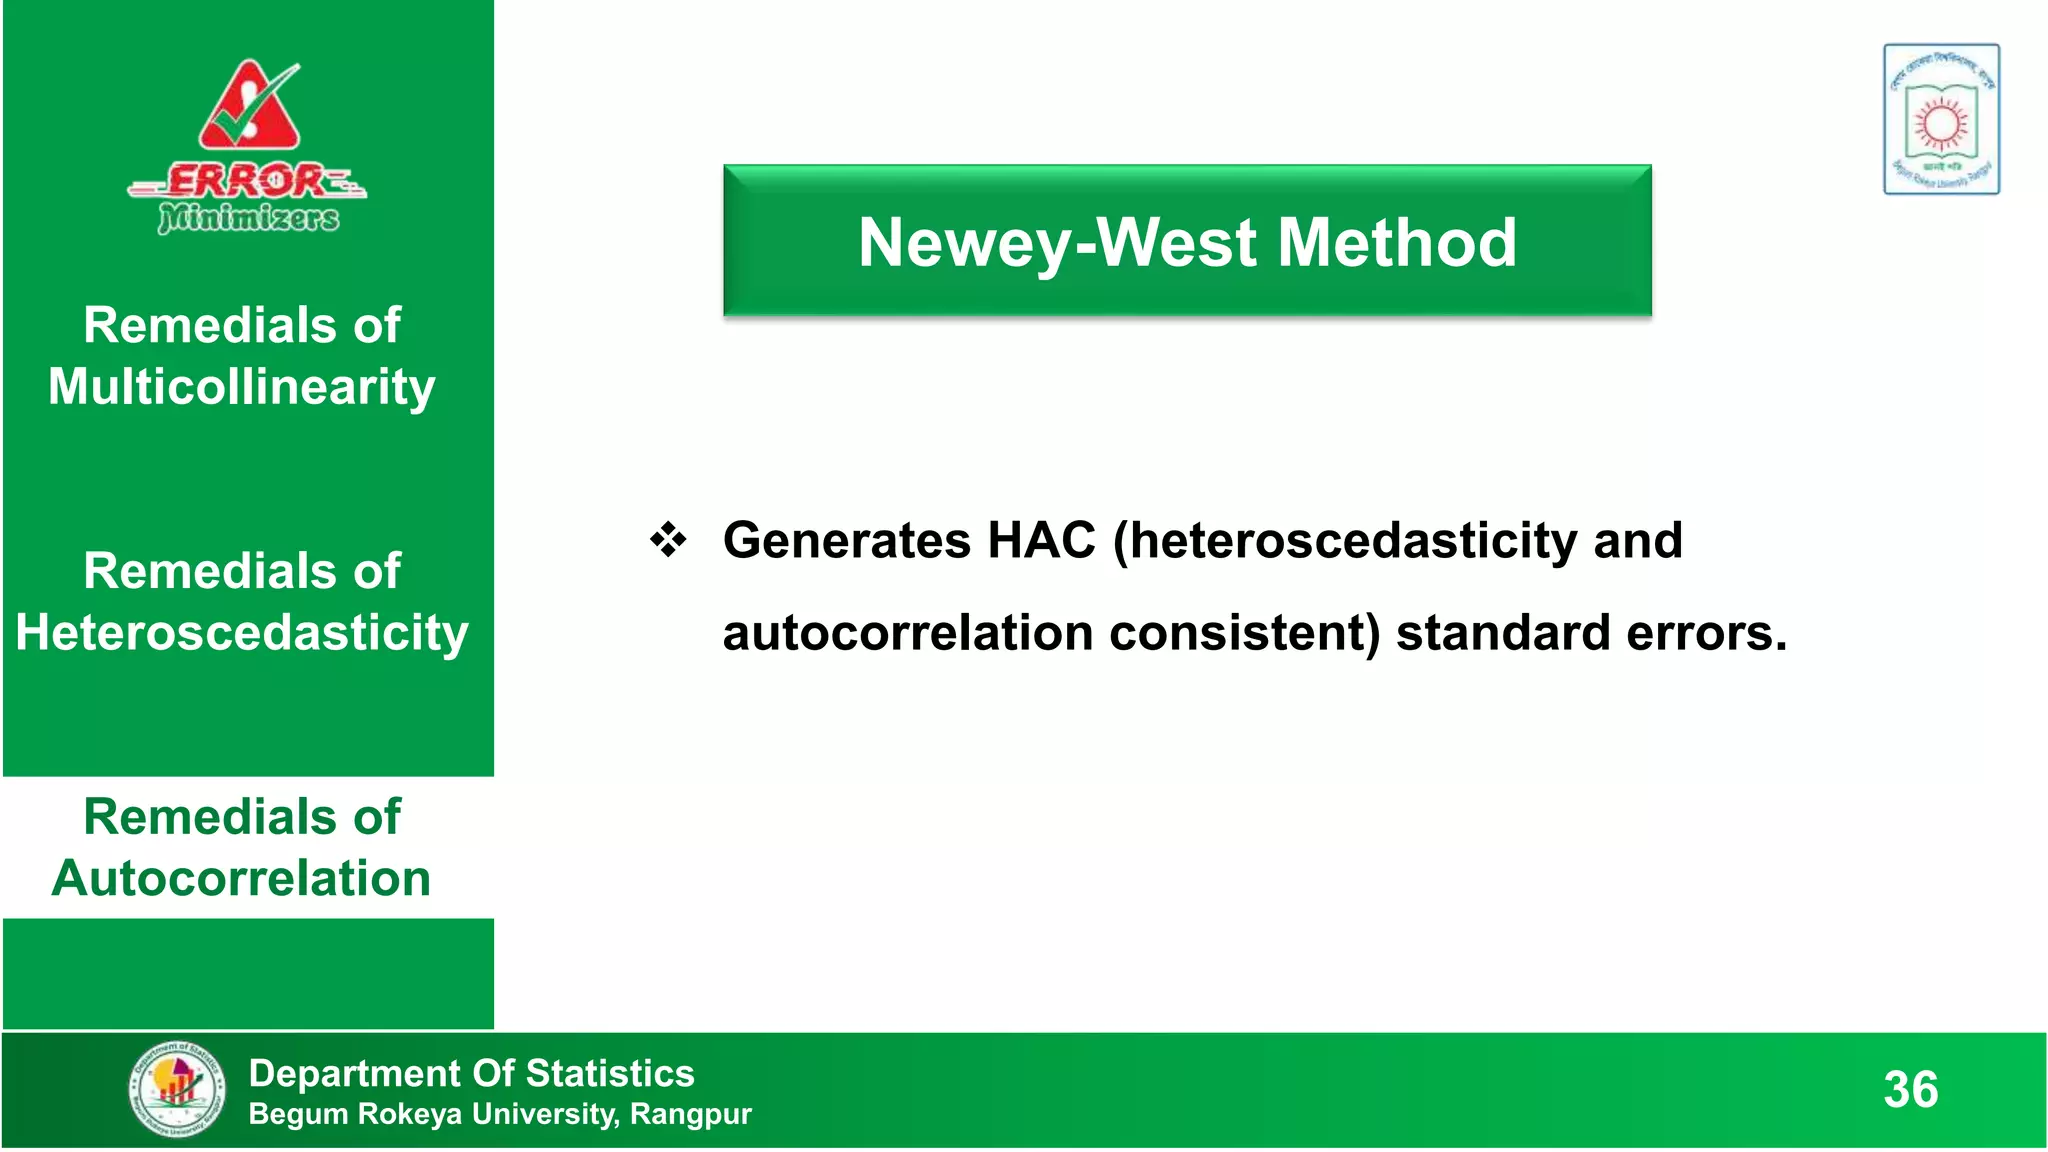
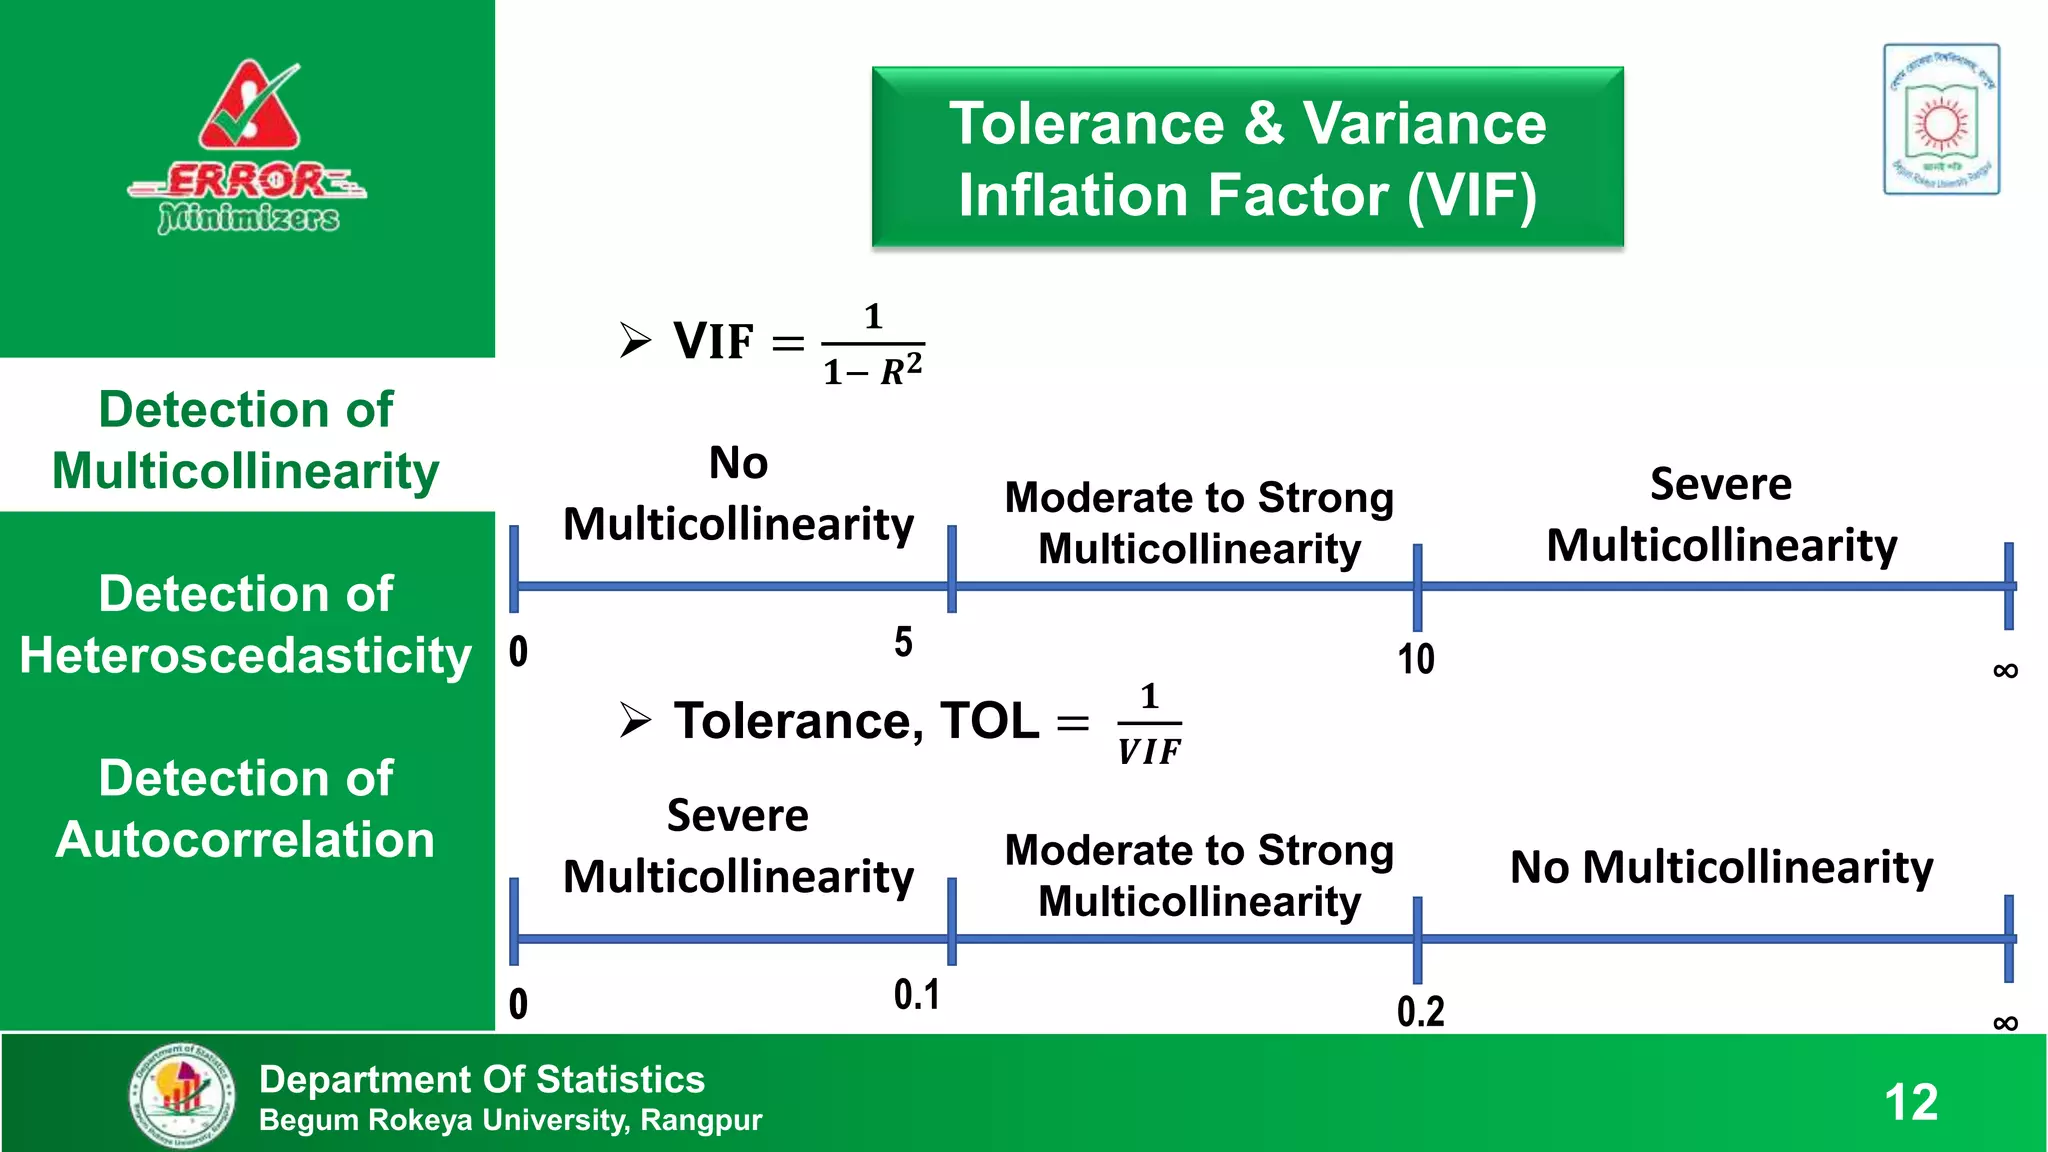
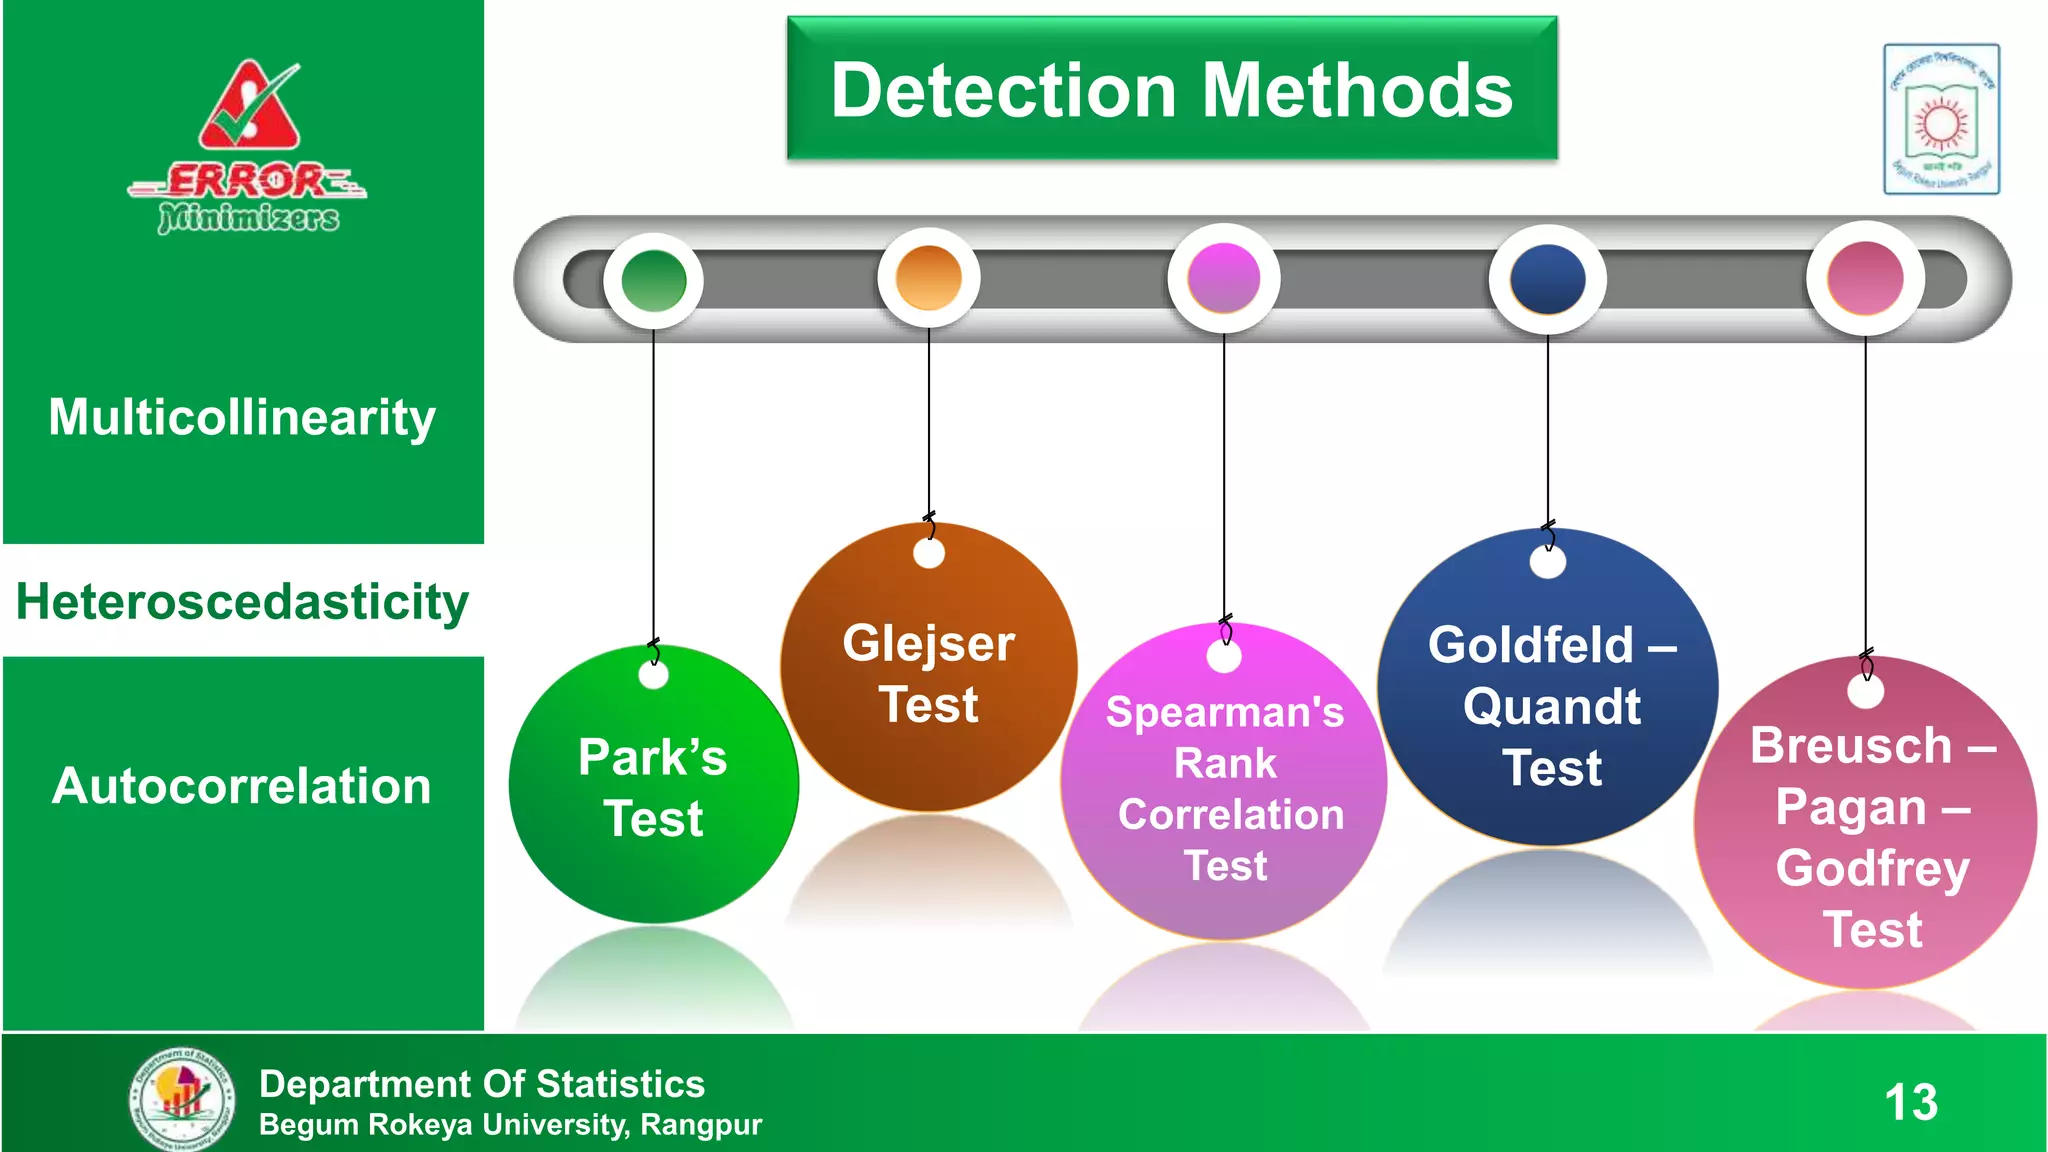
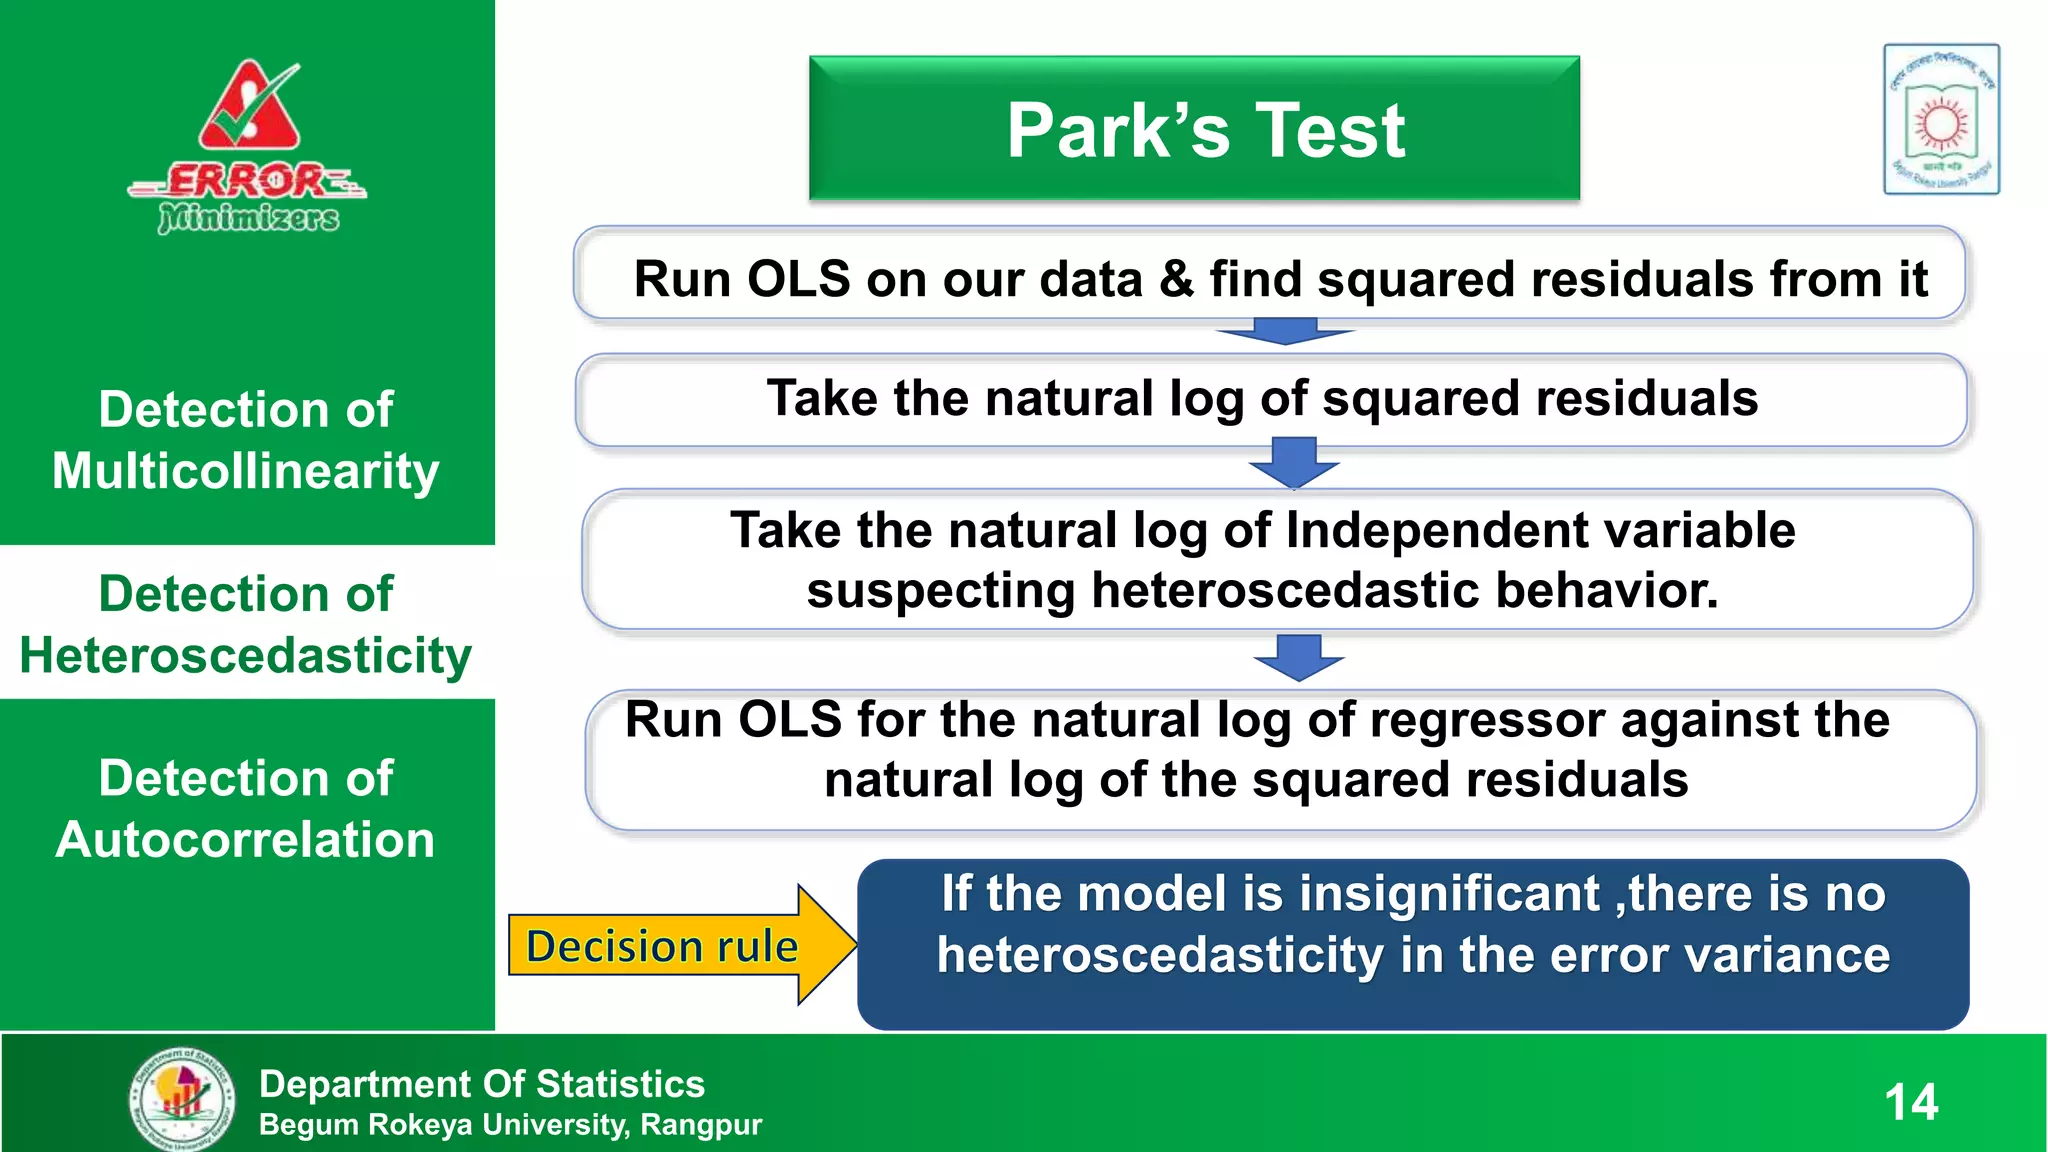
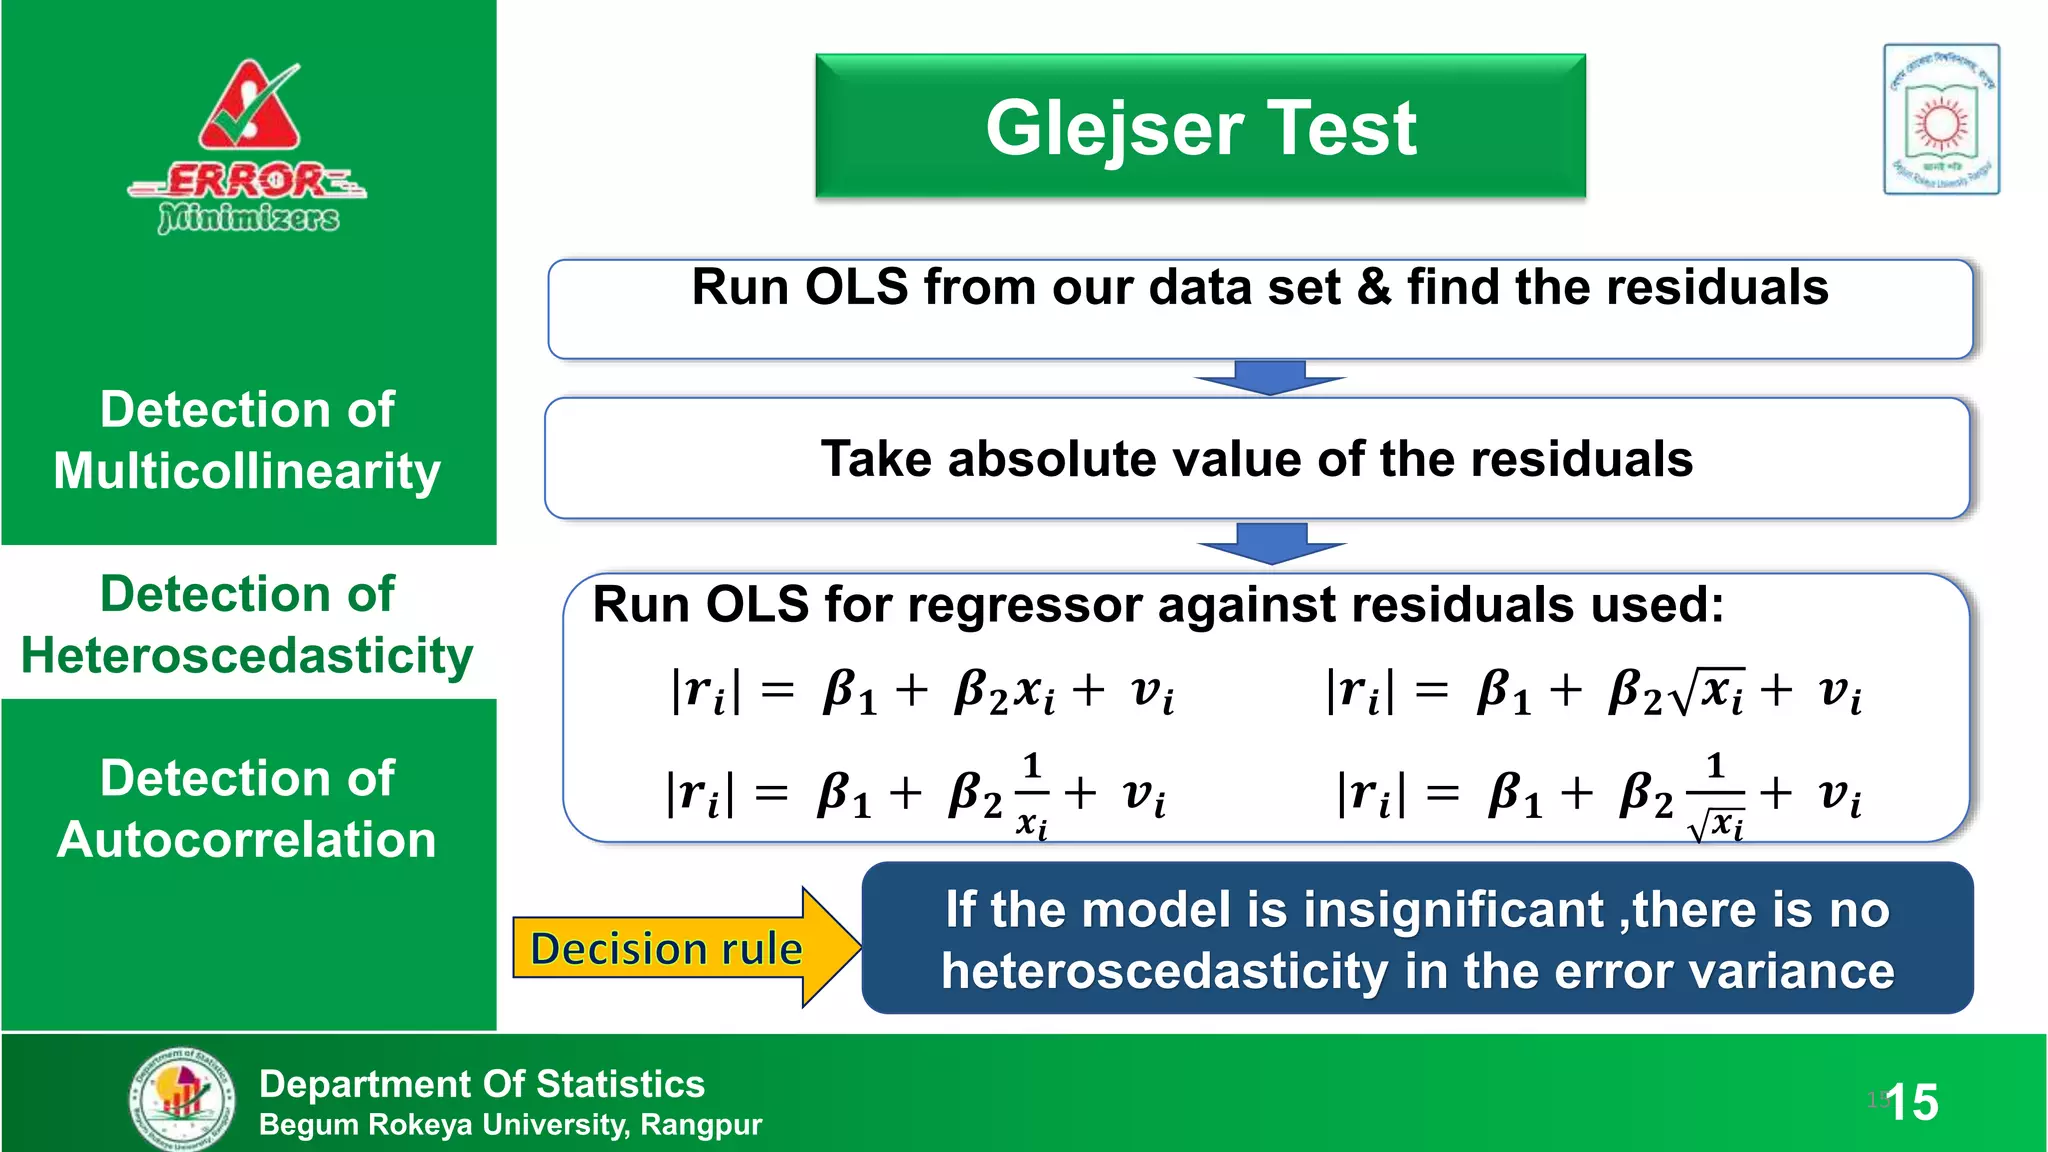
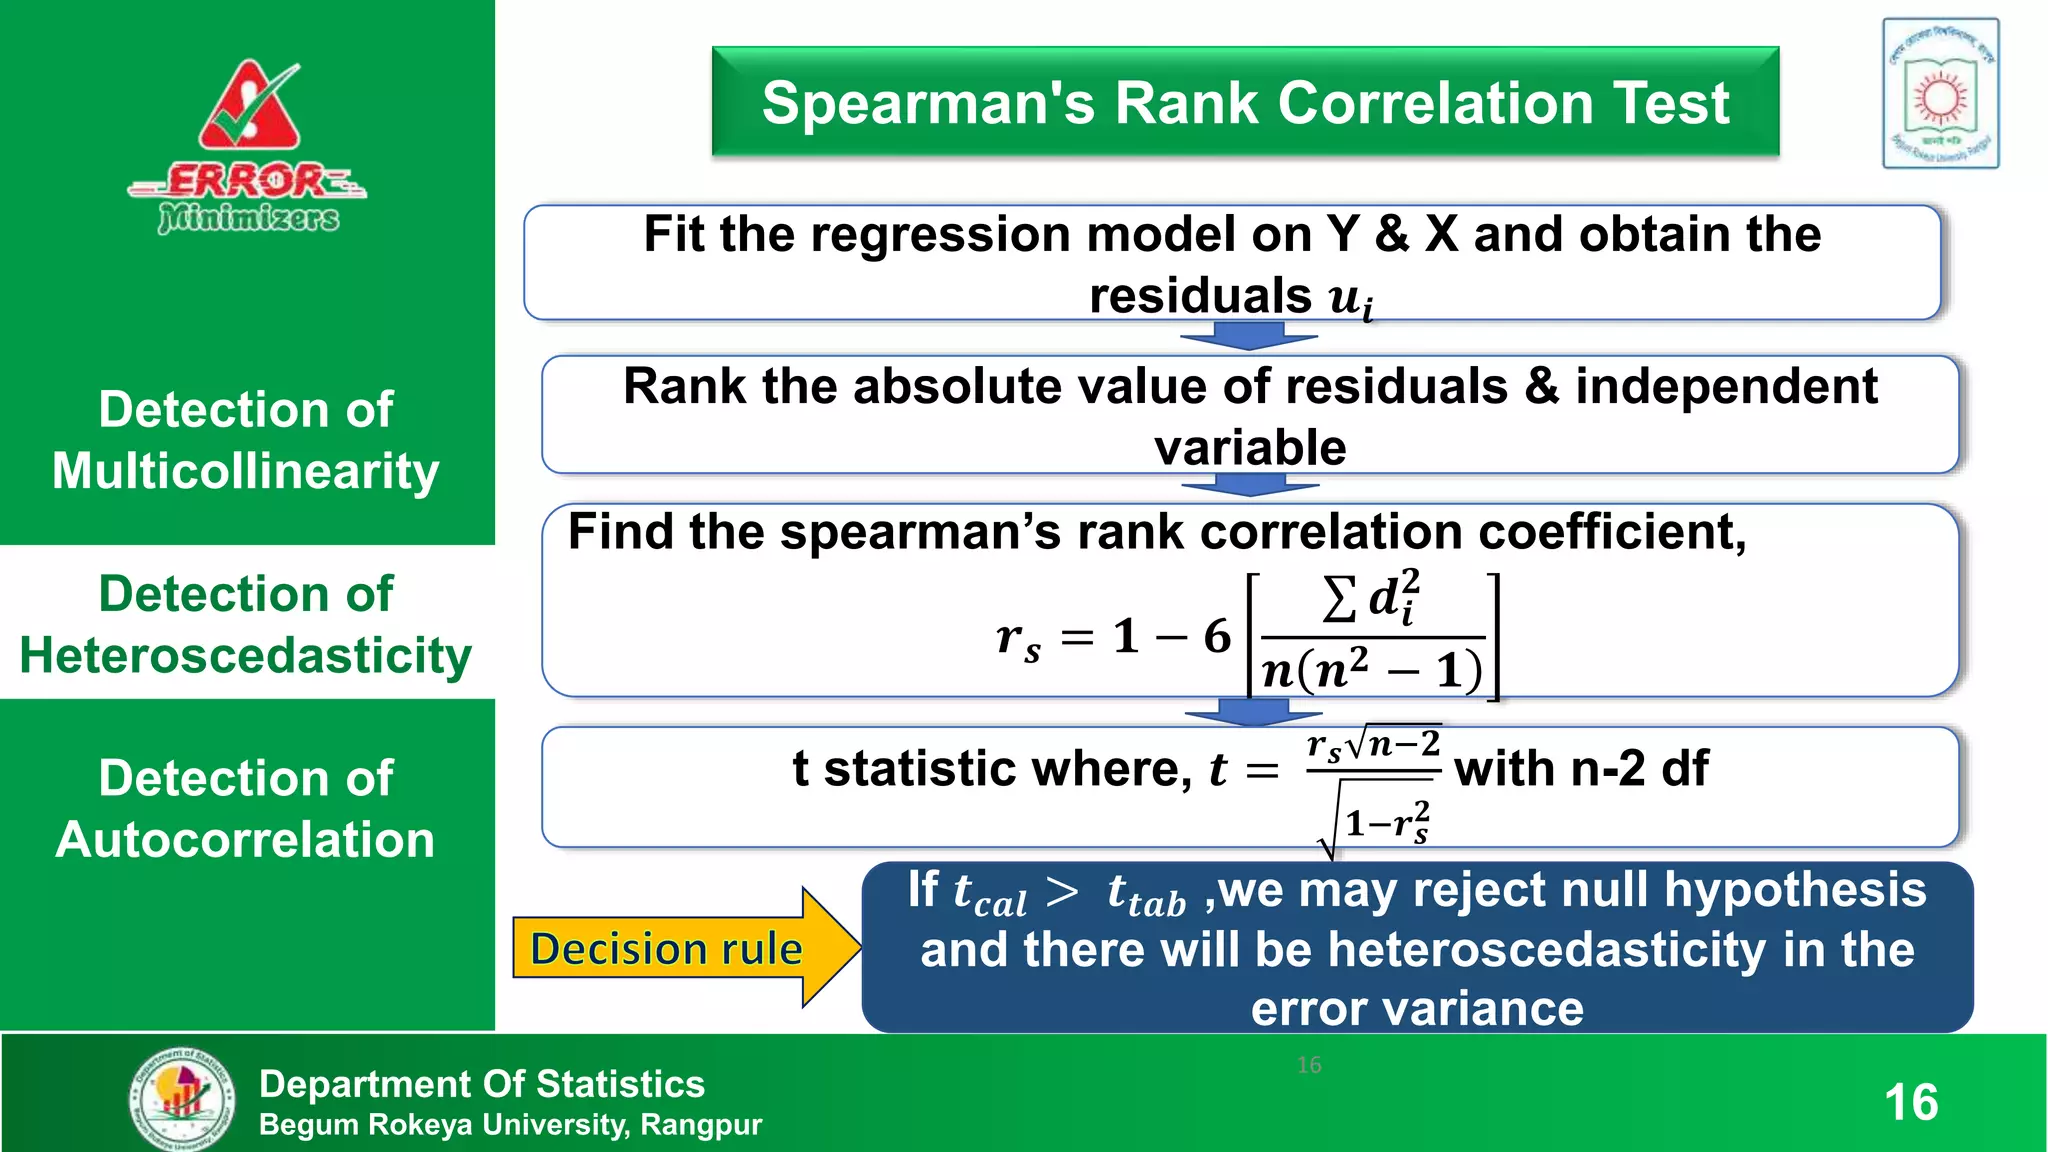
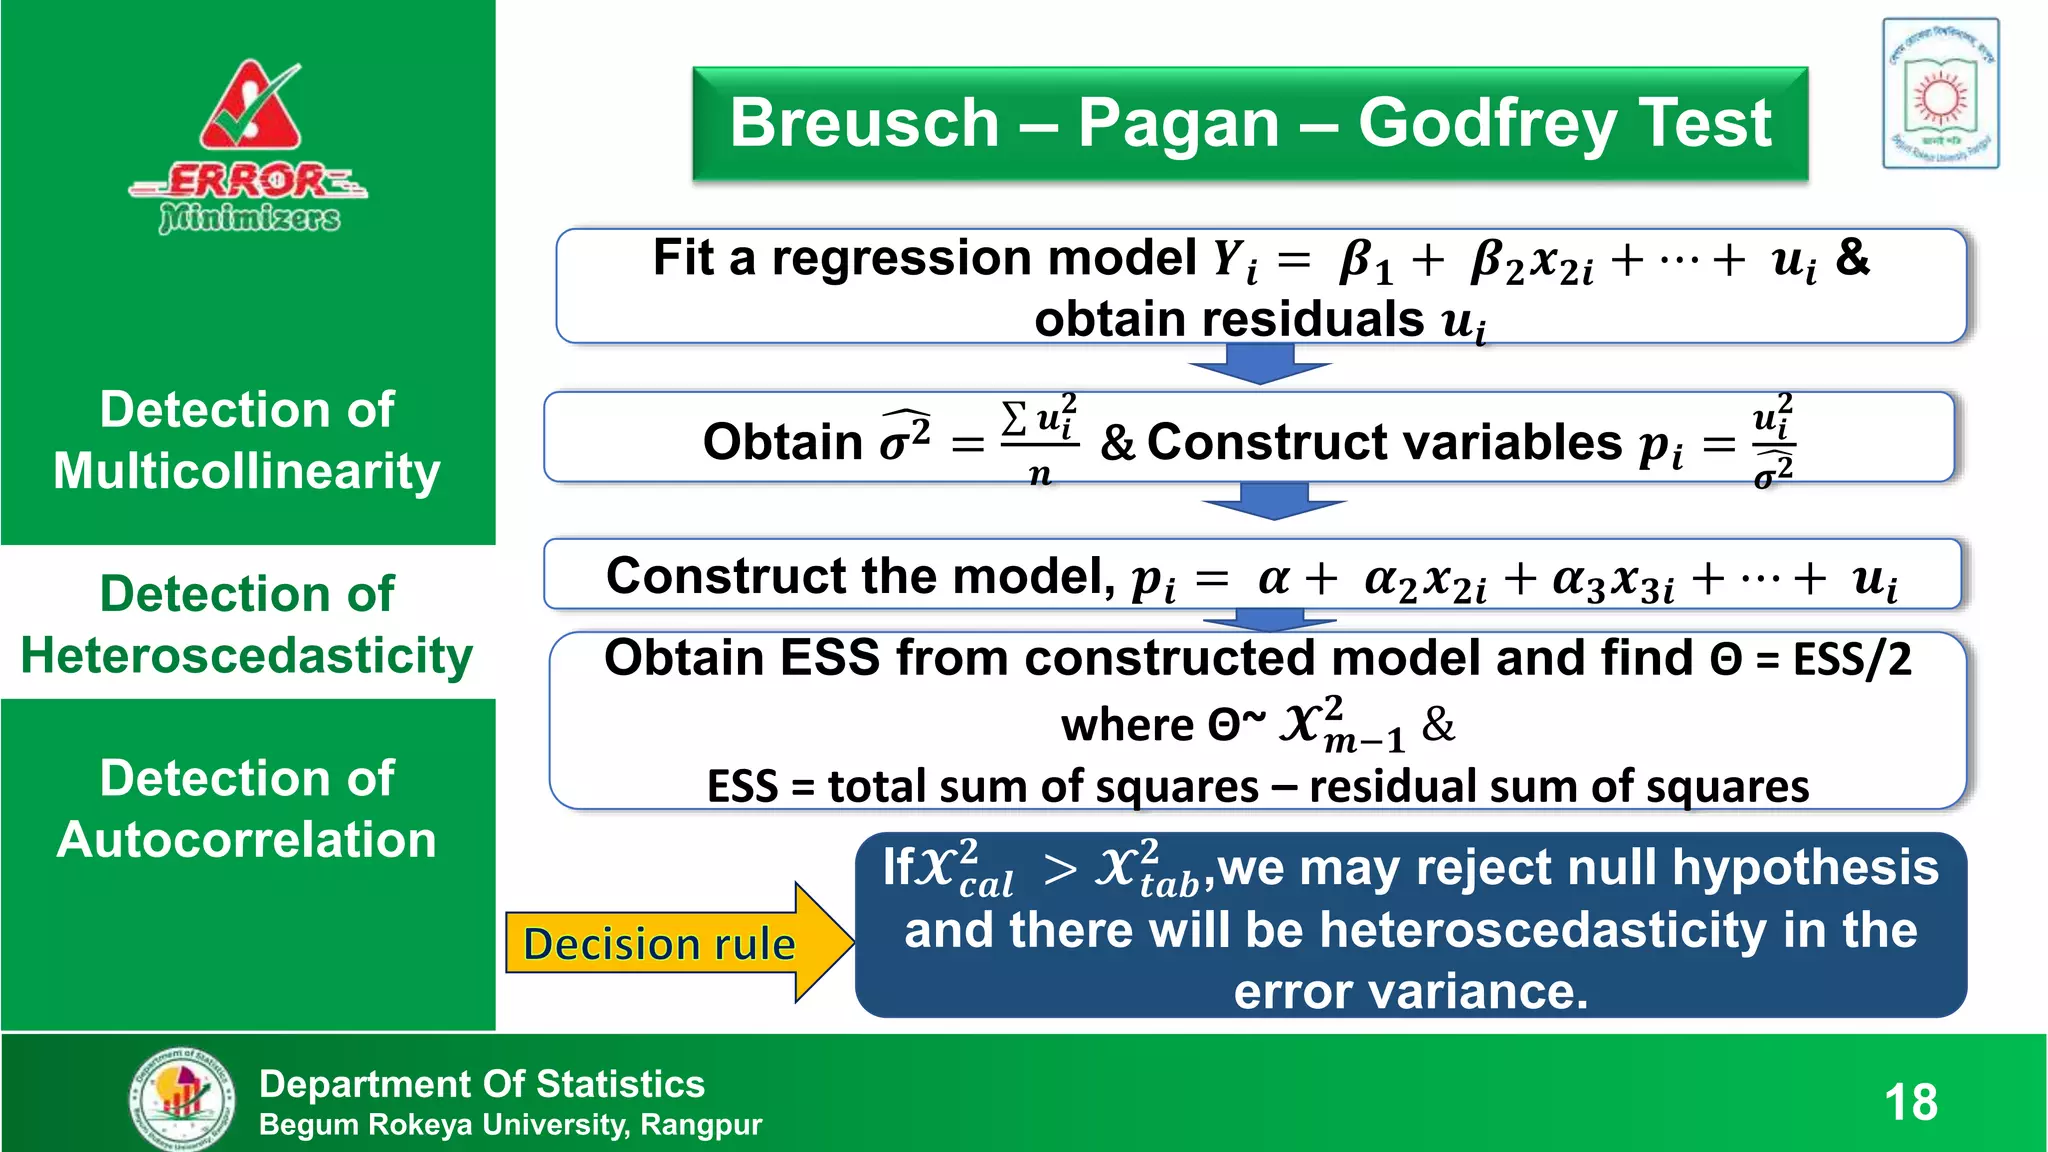
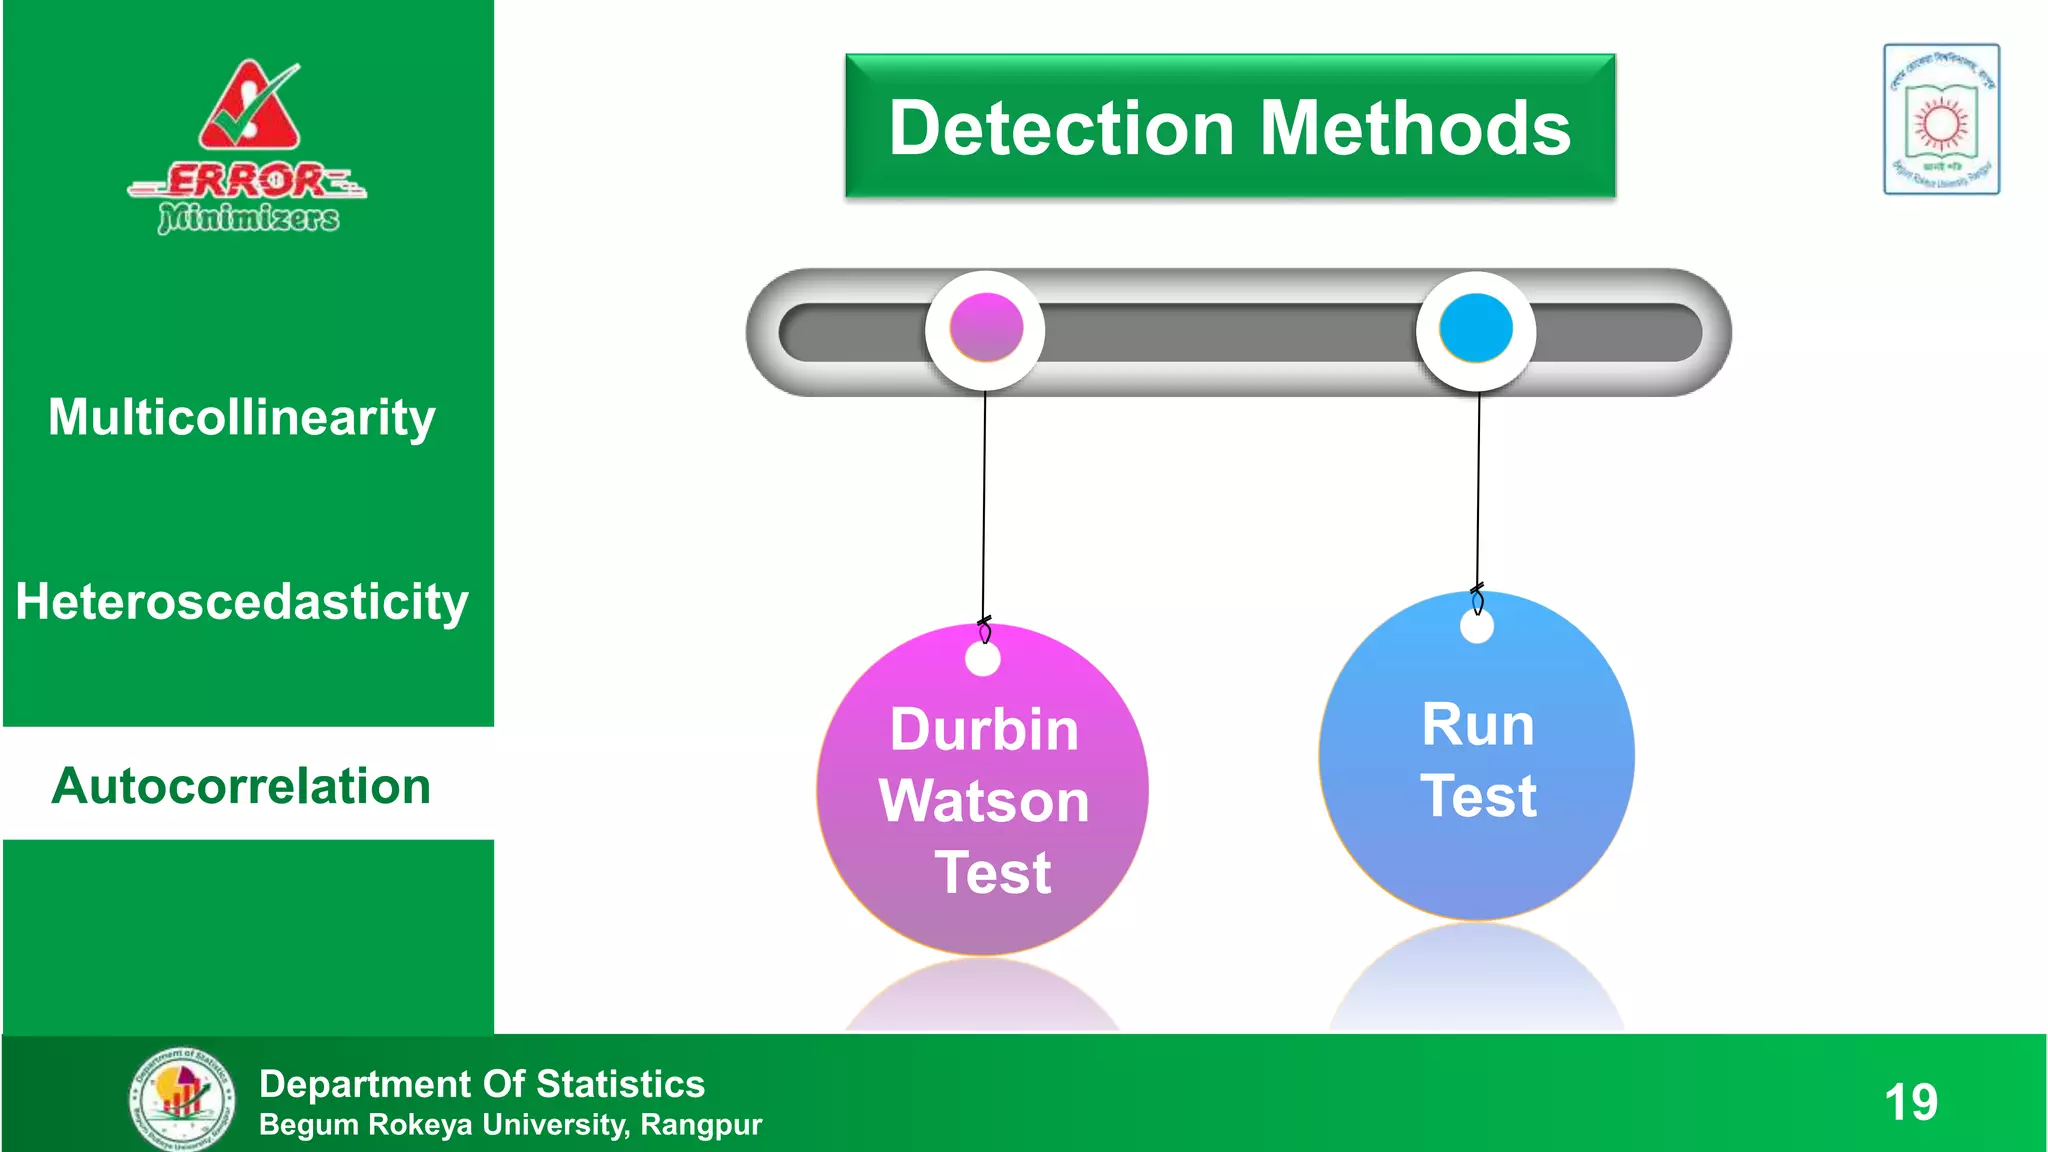
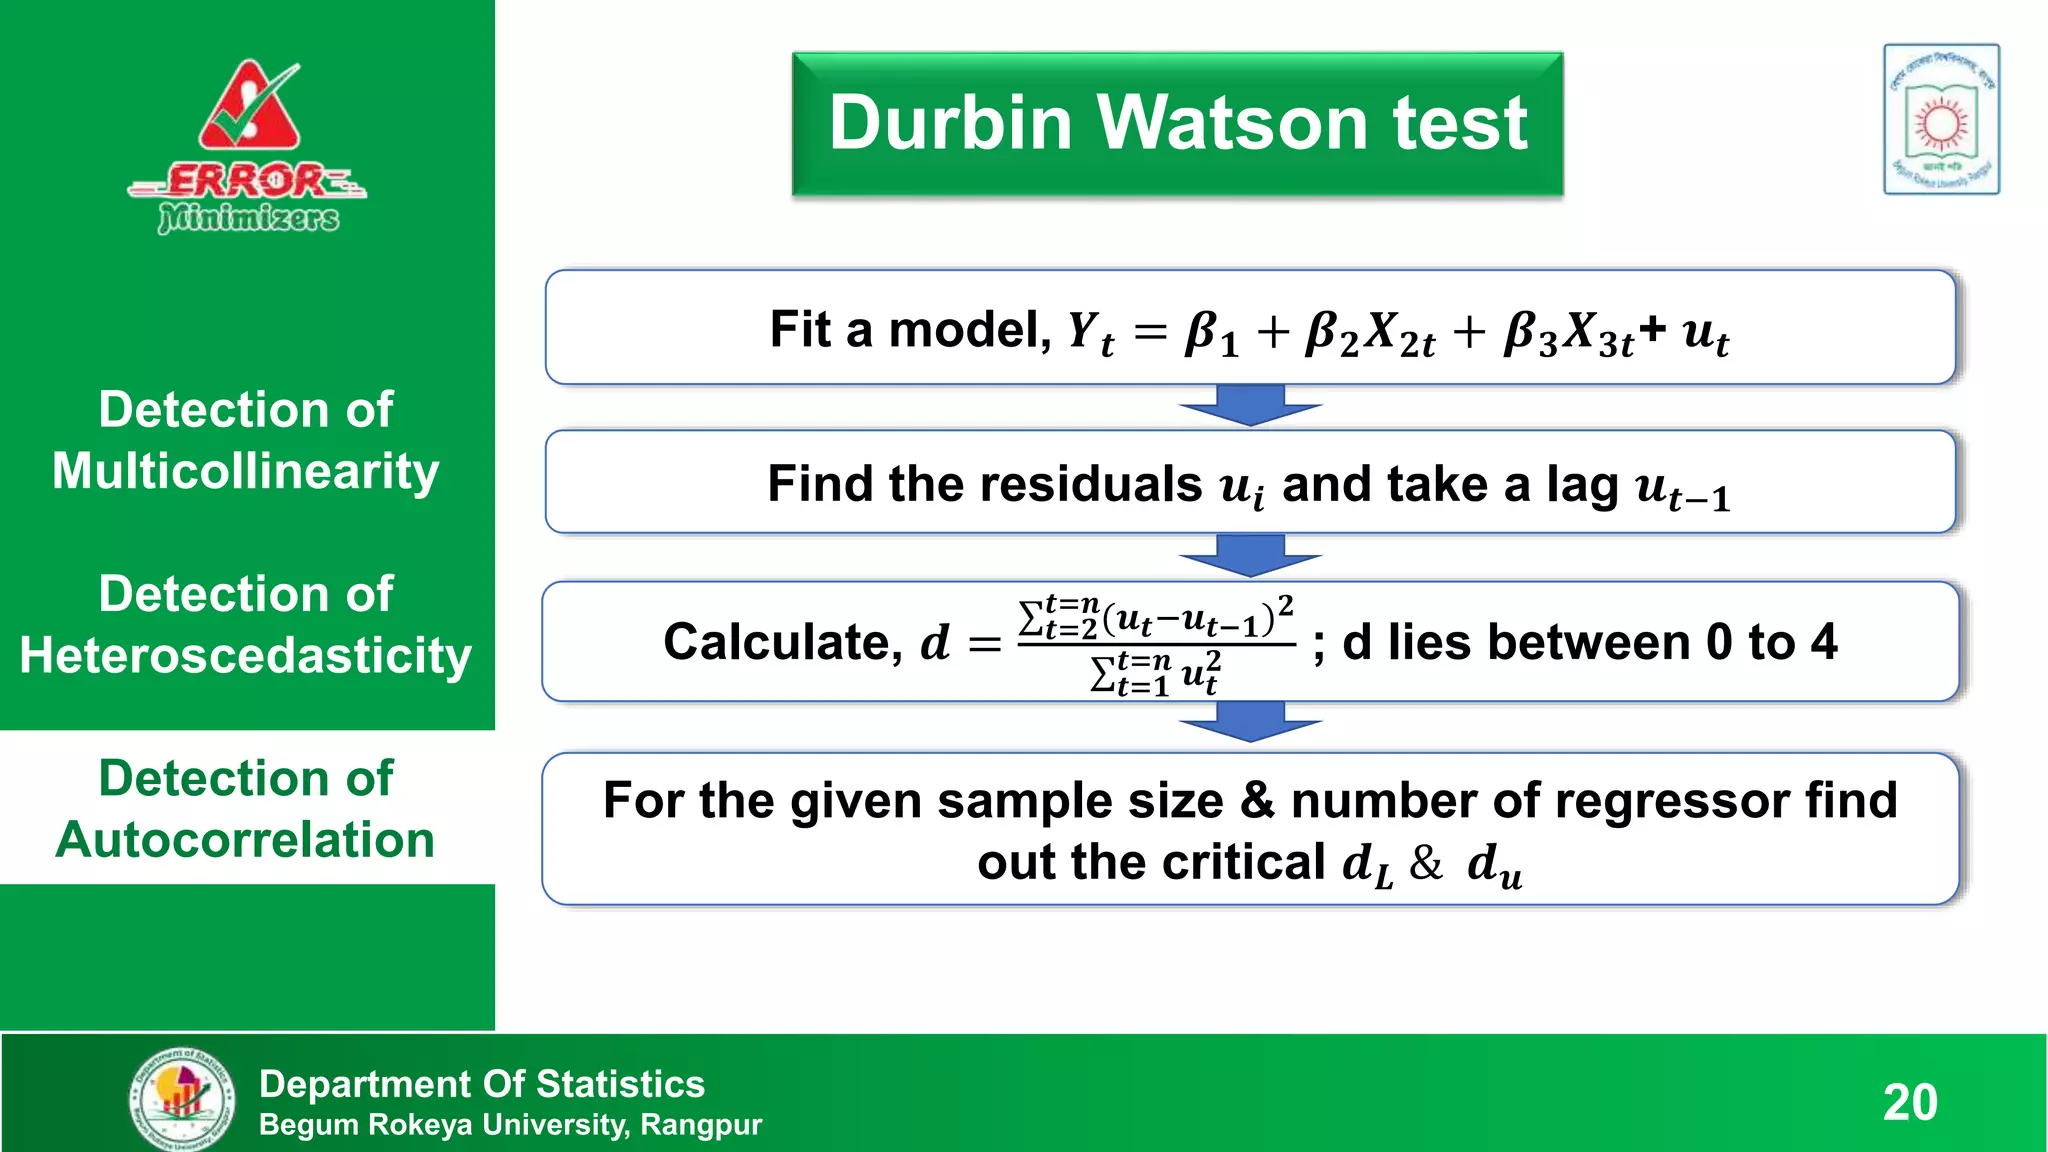
This document discusses various methods to detect errors in regression models such as multicollinearity, heteroscedasticity, and autocorrelation. It defines each error and provides practical examples. Detection methods are then presented, including variance inflation factor, Breusch-Pagan test, Durbin-Watson test, and others. Specific steps are outlined for applying each test to determine if errors are present based on the test statistics.


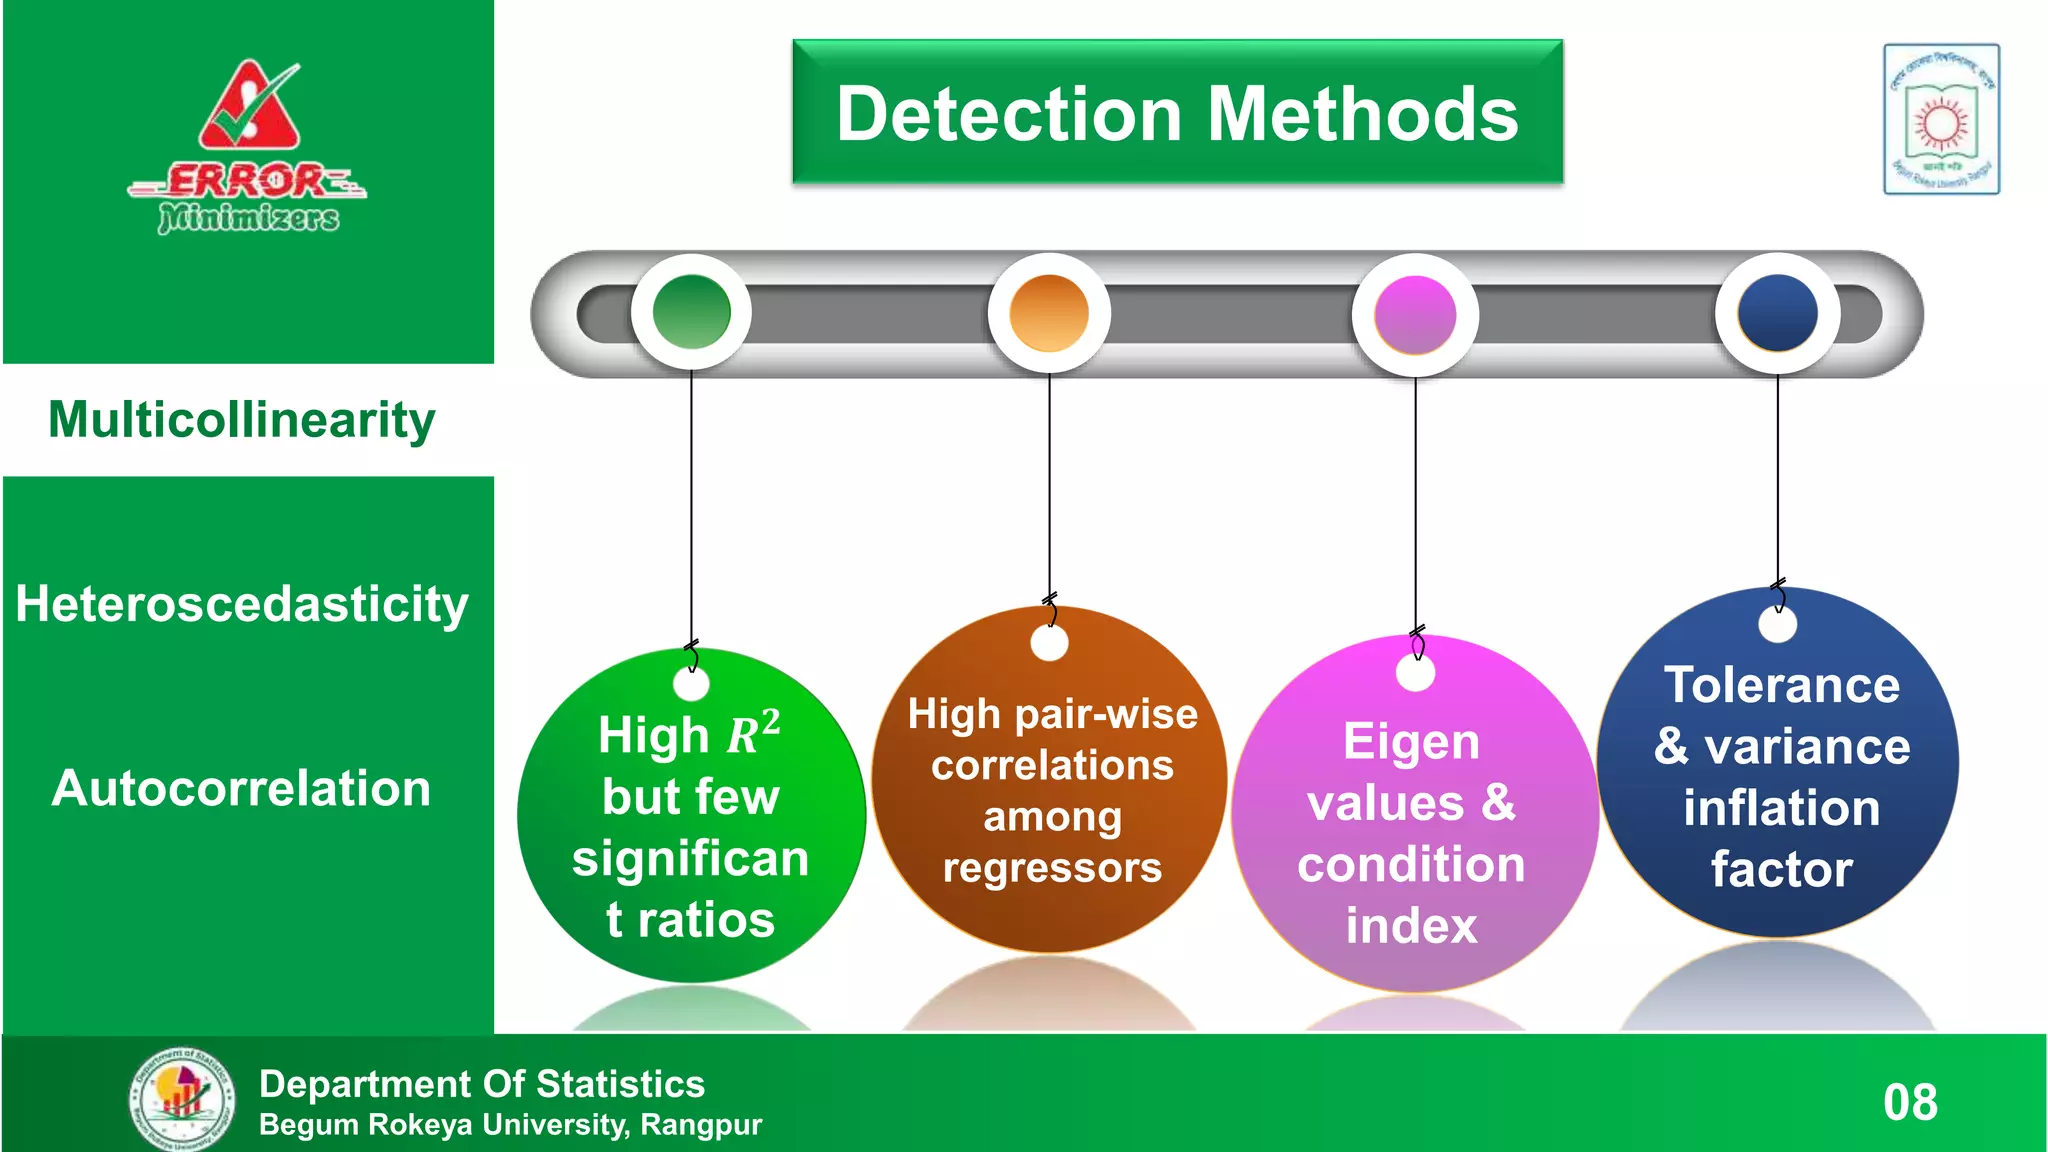
![Detection of
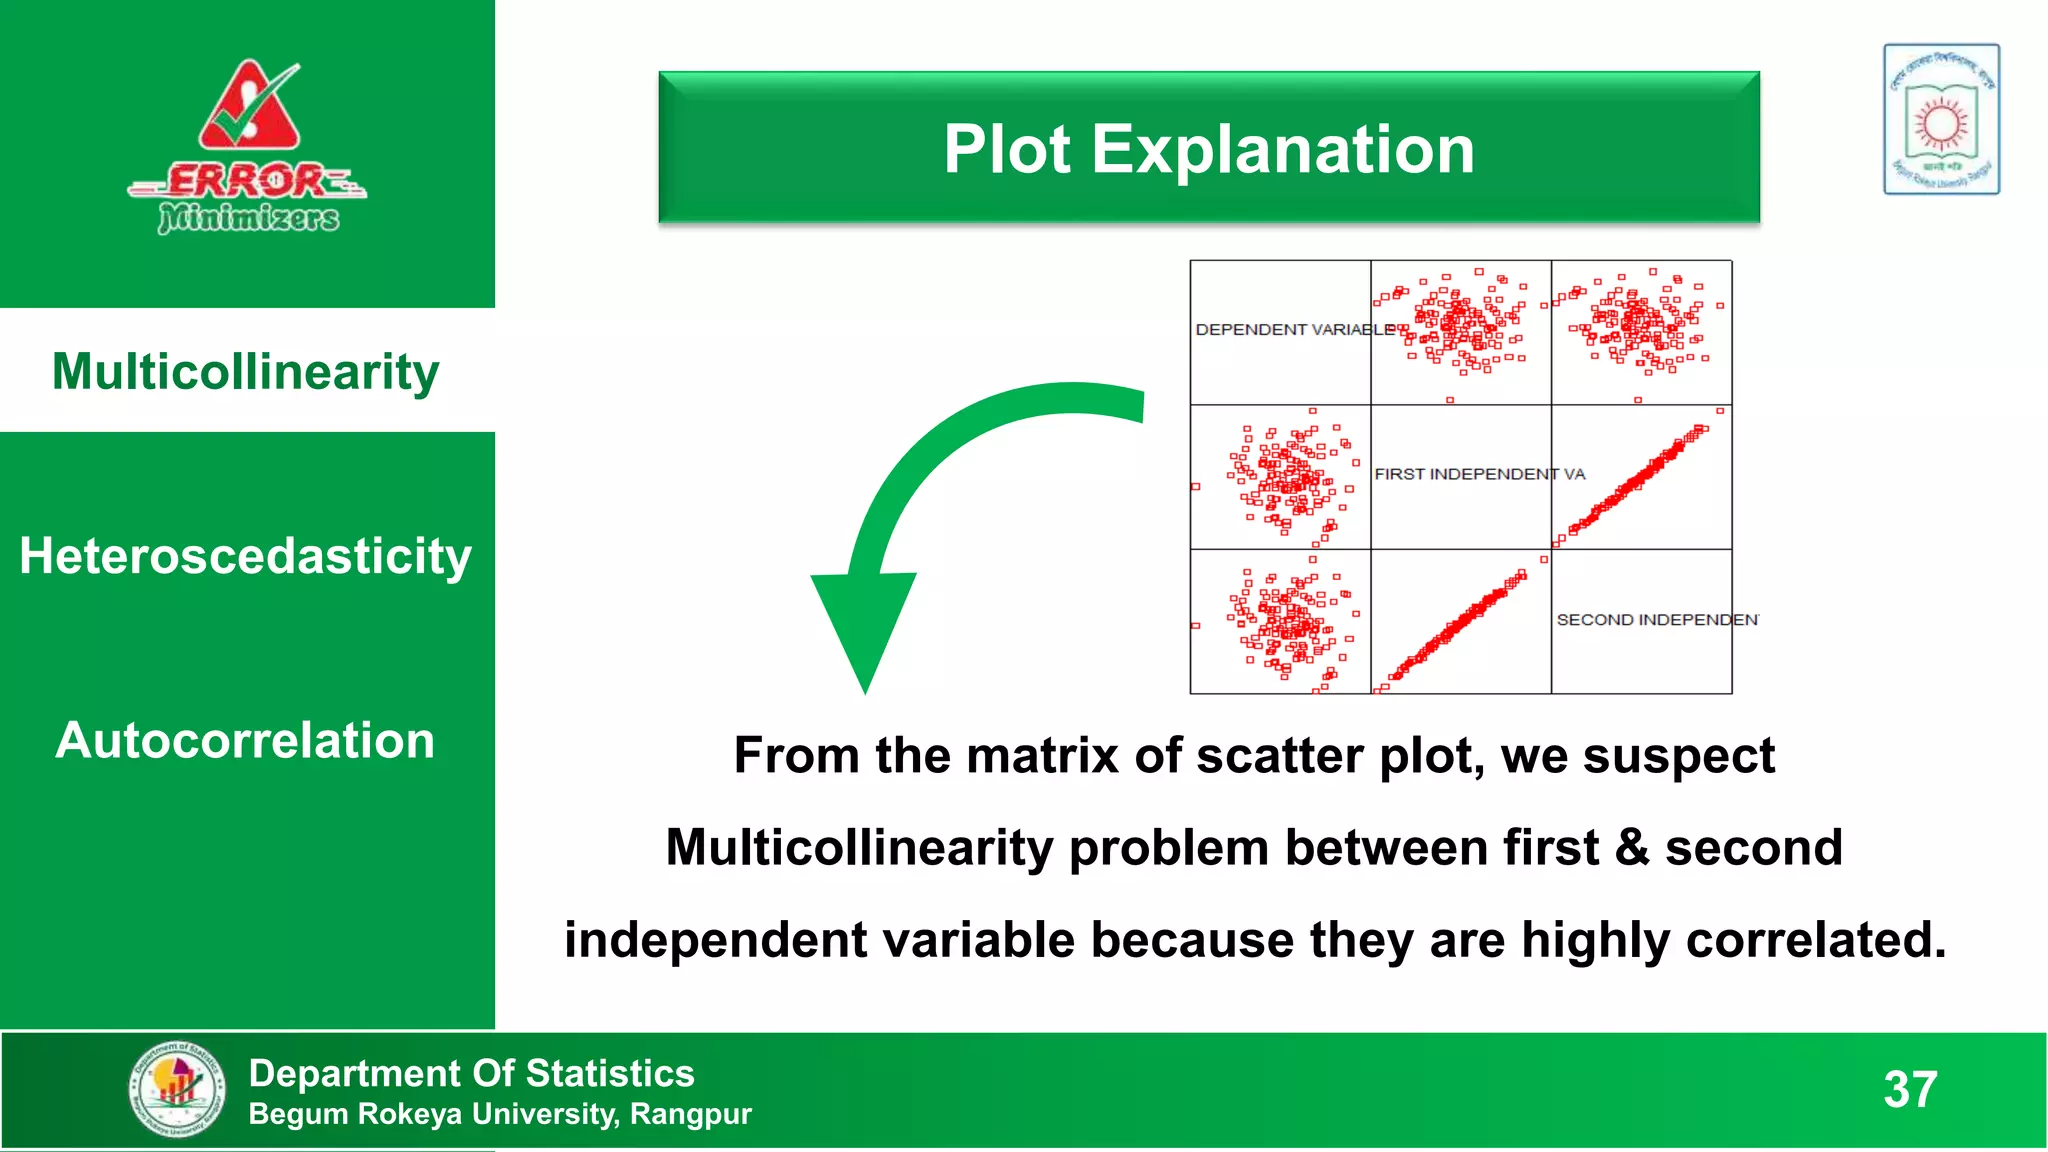
Multicollinearity
Detection of
Heteroscedasticity
Detection of
Autocorrelation
Department Of Statistics
Begum Rokeya University, Rangpur 17
Goldfeld – Quandt Test
𝑭 =
𝑹𝑺𝑺𝟐/𝒅𝒇
𝑹𝑺𝑺𝟏/𝒅𝒇
[ df 𝑹𝑺𝑺𝟏 =(n-c)/2 – k & df 𝑹𝑺𝑺𝟐 =(n-c-2k)/2
Rank the observations ascending order according to 𝑿𝒊
Omit c central observations and devide the remaining
(n-c) observations into two groups.
[If n ≈ 30 then c=4, n ≈ 60 then c=8 ]
Fit OLS for the two group in step-2 & find residuals sum
of square 𝑹𝑺𝑺𝟏 & 𝑹𝑺𝑺𝟐
Fit OLS for the two group in step-2 & find residuals sum
of square 𝑹𝑺𝑺𝟏 & 𝑹𝑺𝑺𝟐
If 𝑭𝒄𝒂𝒍 > 𝑭𝒕𝒂𝒃 ,we may reject null
hypothesis and there will be
heteroscedasticity in the error variance.](https://image.slidesharecdn.com/econometrics-221209043736-b60ac086/75/Econometrics-pptx-17-2048.jpg)
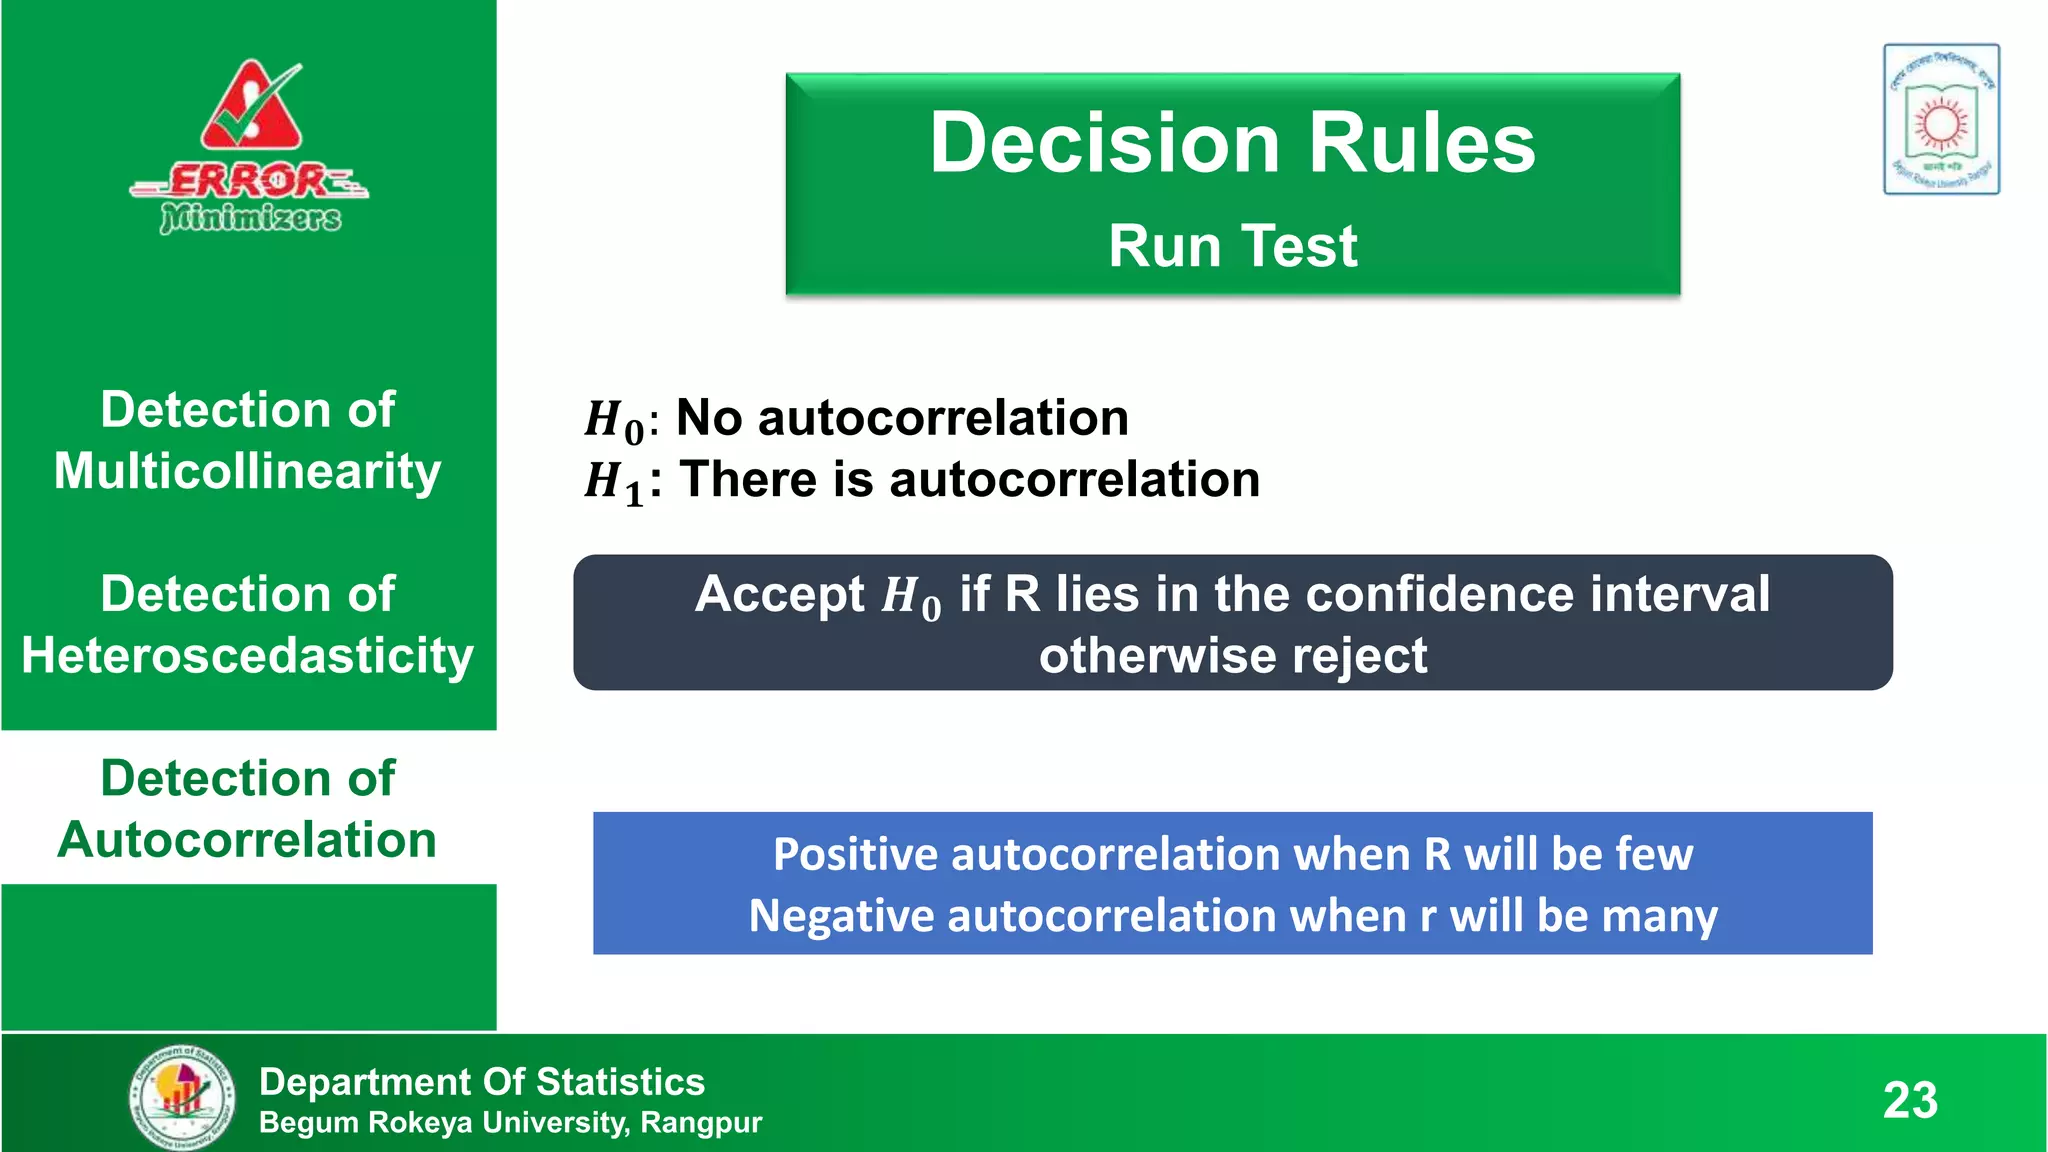
![Find Prob [E (R) – 1.96𝝈𝑹 ≤ 𝑹 ≤ E (R) + 1.96𝝈𝑹] = 0.95
Detection of
Multicollinearity
Detection of
Heteroscedasticity
Detection of
Autocorrelation
Run test
Department Of Statistics
Begum Rokeya University, Rangpur 22
Mean: 𝑬 𝑹 =
𝟐𝑵𝟏𝑵𝟐
𝑵
+ 𝟏
Variance: 𝝈𝑹
𝟐
=
𝟐𝑵𝟏𝑵𝟐(𝟐𝑵𝟏𝑵𝟐 − 𝑵)
𝑵𝟐(𝑵 −𝟏)
Here, 𝑁1 = 𝑁𝑢𝑚𝑏𝑒𝑟 𝑜𝑓 " + “, and 𝑁2 = 𝑁𝑢𝑚𝑏𝑒𝑟 𝑜𝑓 " − “
𝑁 = 𝑁1 + 𝑁2 and R = Numbers of Runs
Note the signs (+ or -) of the residuals
Count the number of runs & define the length of a run
Fit a regression model and find the residuals](https://image.slidesharecdn.com/econometrics-221209043736-b60ac086/75/Econometrics-pptx-22-2048.jpg)
![Remedials of
Multicollinearity
Remedials of
Heteroscedasticity
Remedials of
Autocorrelation
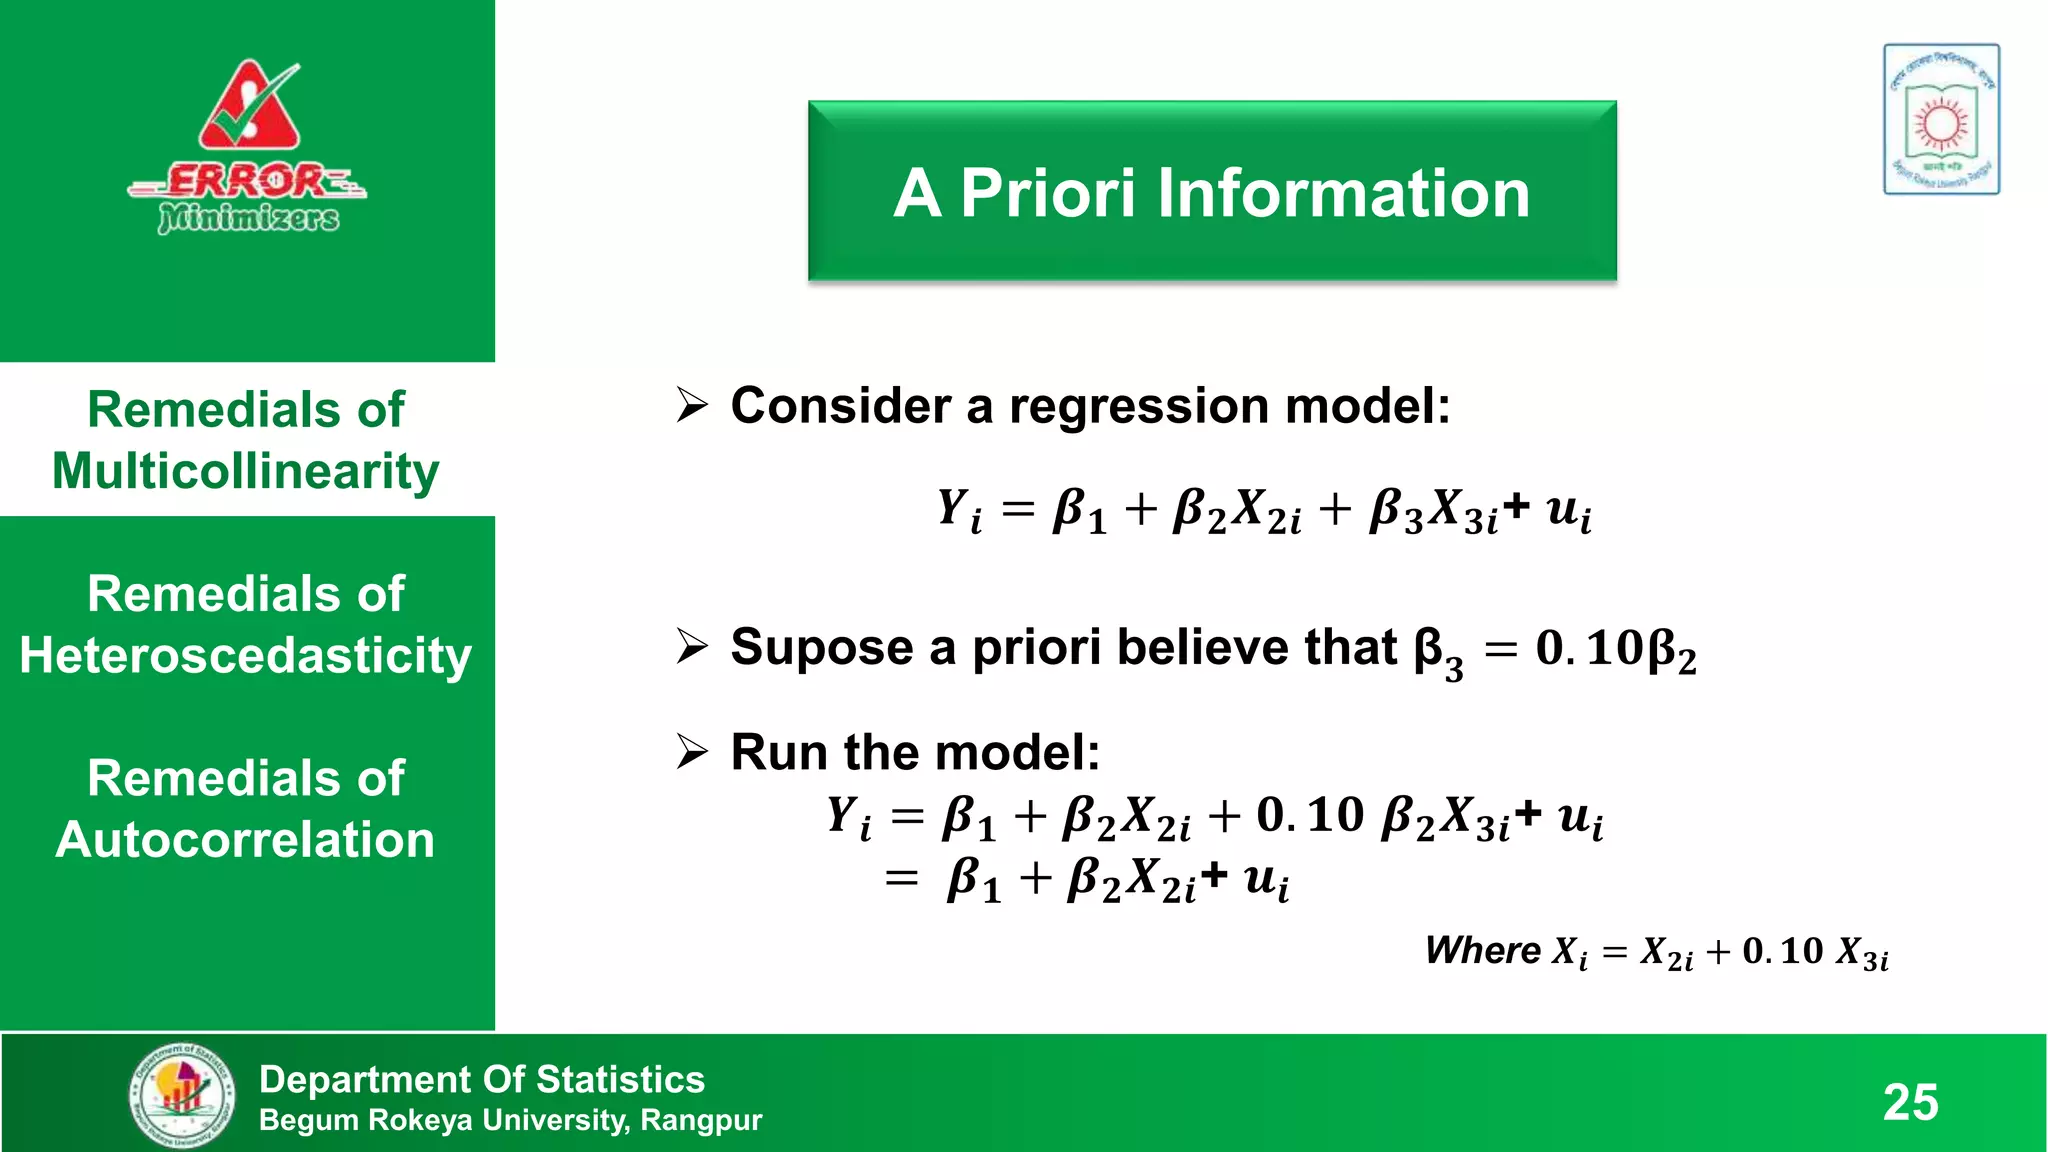
When 𝝈𝟐 is Unknown
Department Of Statistics
Begum Rokeya University, Rangpur
32
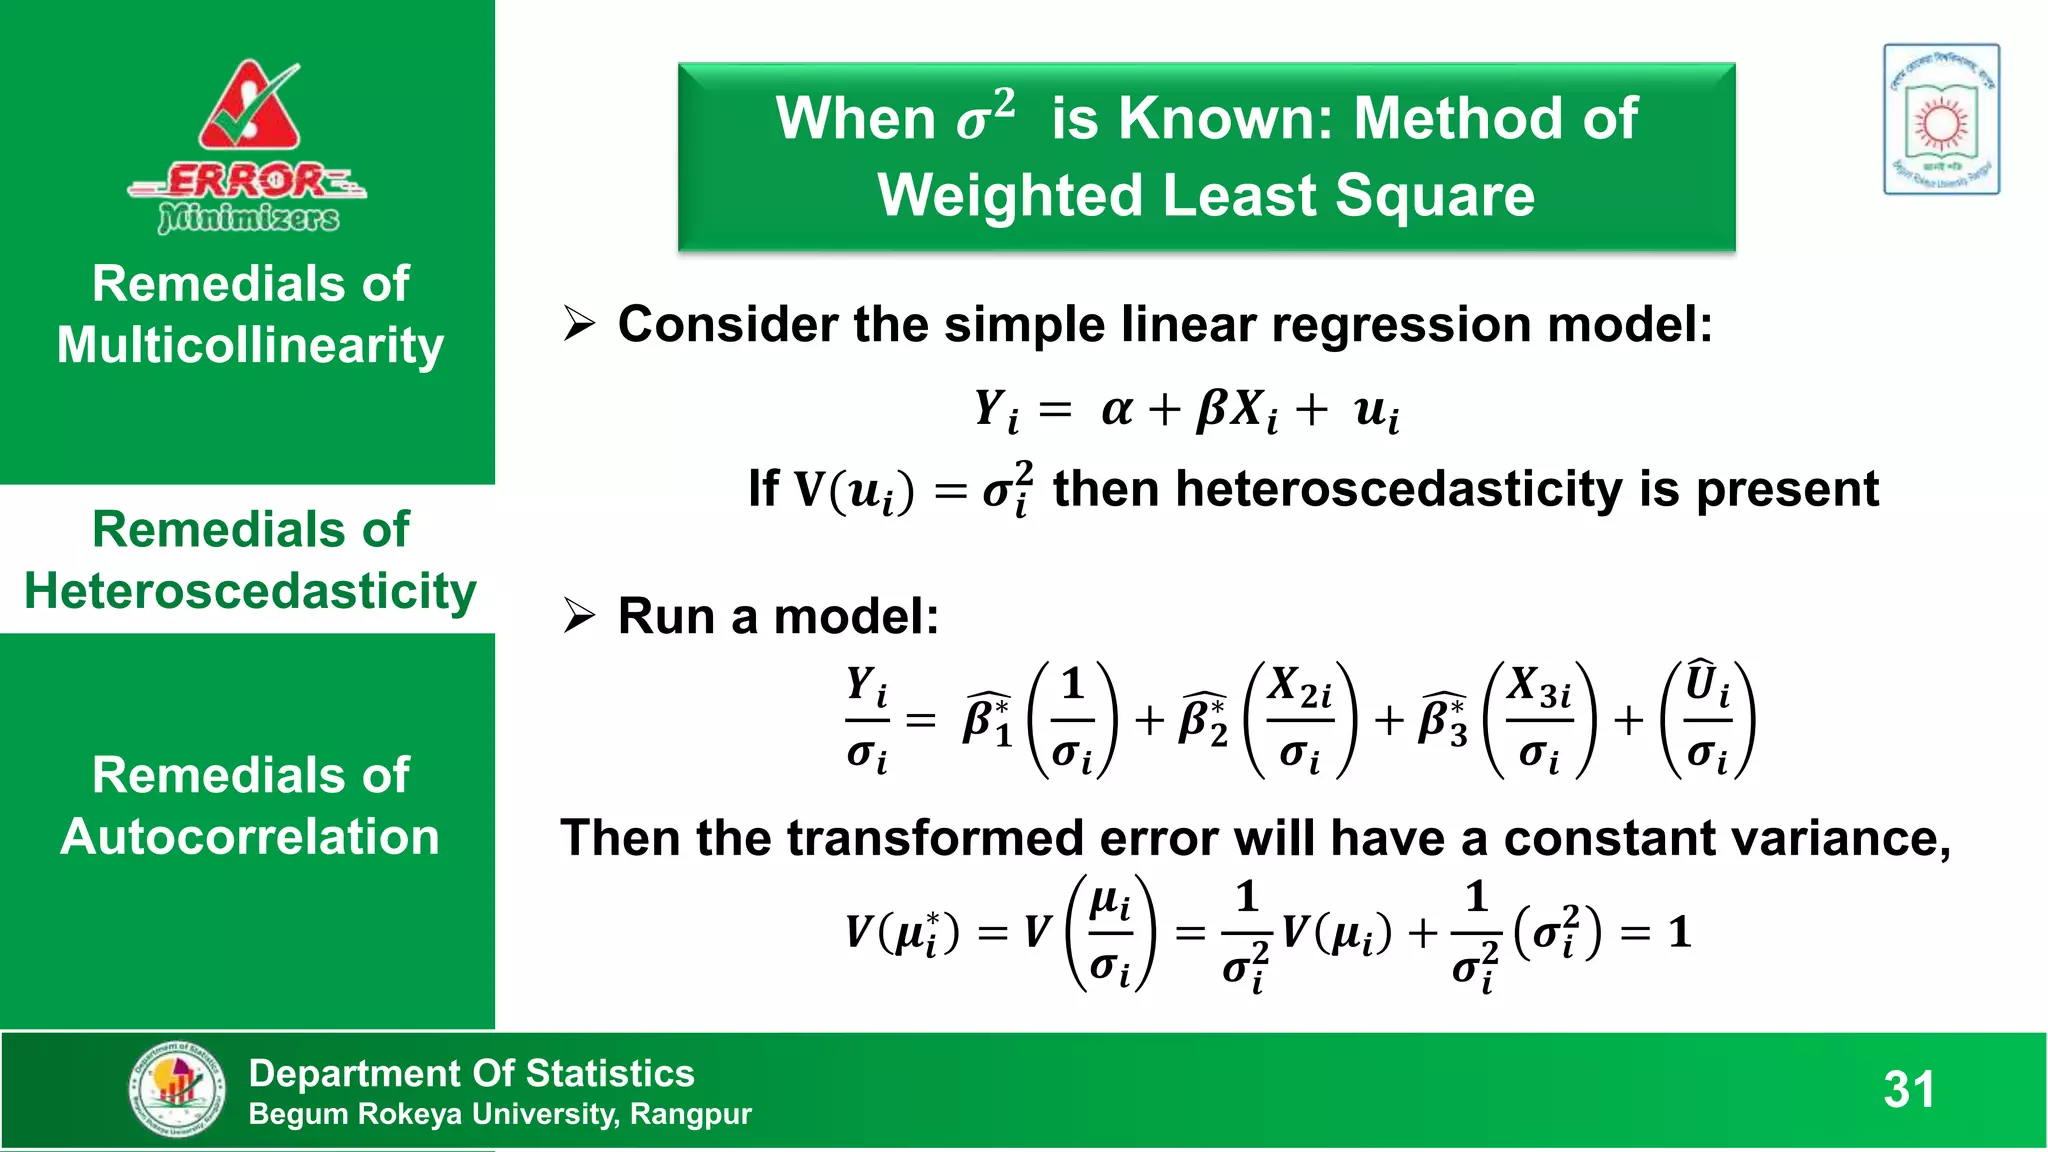
The error variance is proportional to 𝑿𝒊
𝟐
:
𝑬(𝑼𝒊
𝟐
) = 𝝈𝟐 𝑿𝒊
𝟐
The error variance is proportional to 𝑿𝒊:
𝑬(𝑼𝒊
𝟐
) = 𝝈𝟐𝑿𝒊
The error variance is proportional to the square of the
mean value of Y :
𝑬(𝑼𝒊
𝟐
) = 𝝈𝟐
[𝑬(𝒀𝒊)]𝟐
A log transformation such as:
𝒍𝒏𝒀𝒊 = 𝜷𝟏 + 𝜷𝟐 𝒍𝒏𝑿𝒊 + 𝑼𝒊](https://image.slidesharecdn.com/econometrics-221209043736-b60ac086/75/Econometrics-pptx-32-2048.jpg)