Canada has the comparative advantage in producing planes.
A terms of trade that benefits both is:
Canada produces x planes and trades for y ships from France.
Where x/y < 0.1 for Canada and x/y > 6 for France.
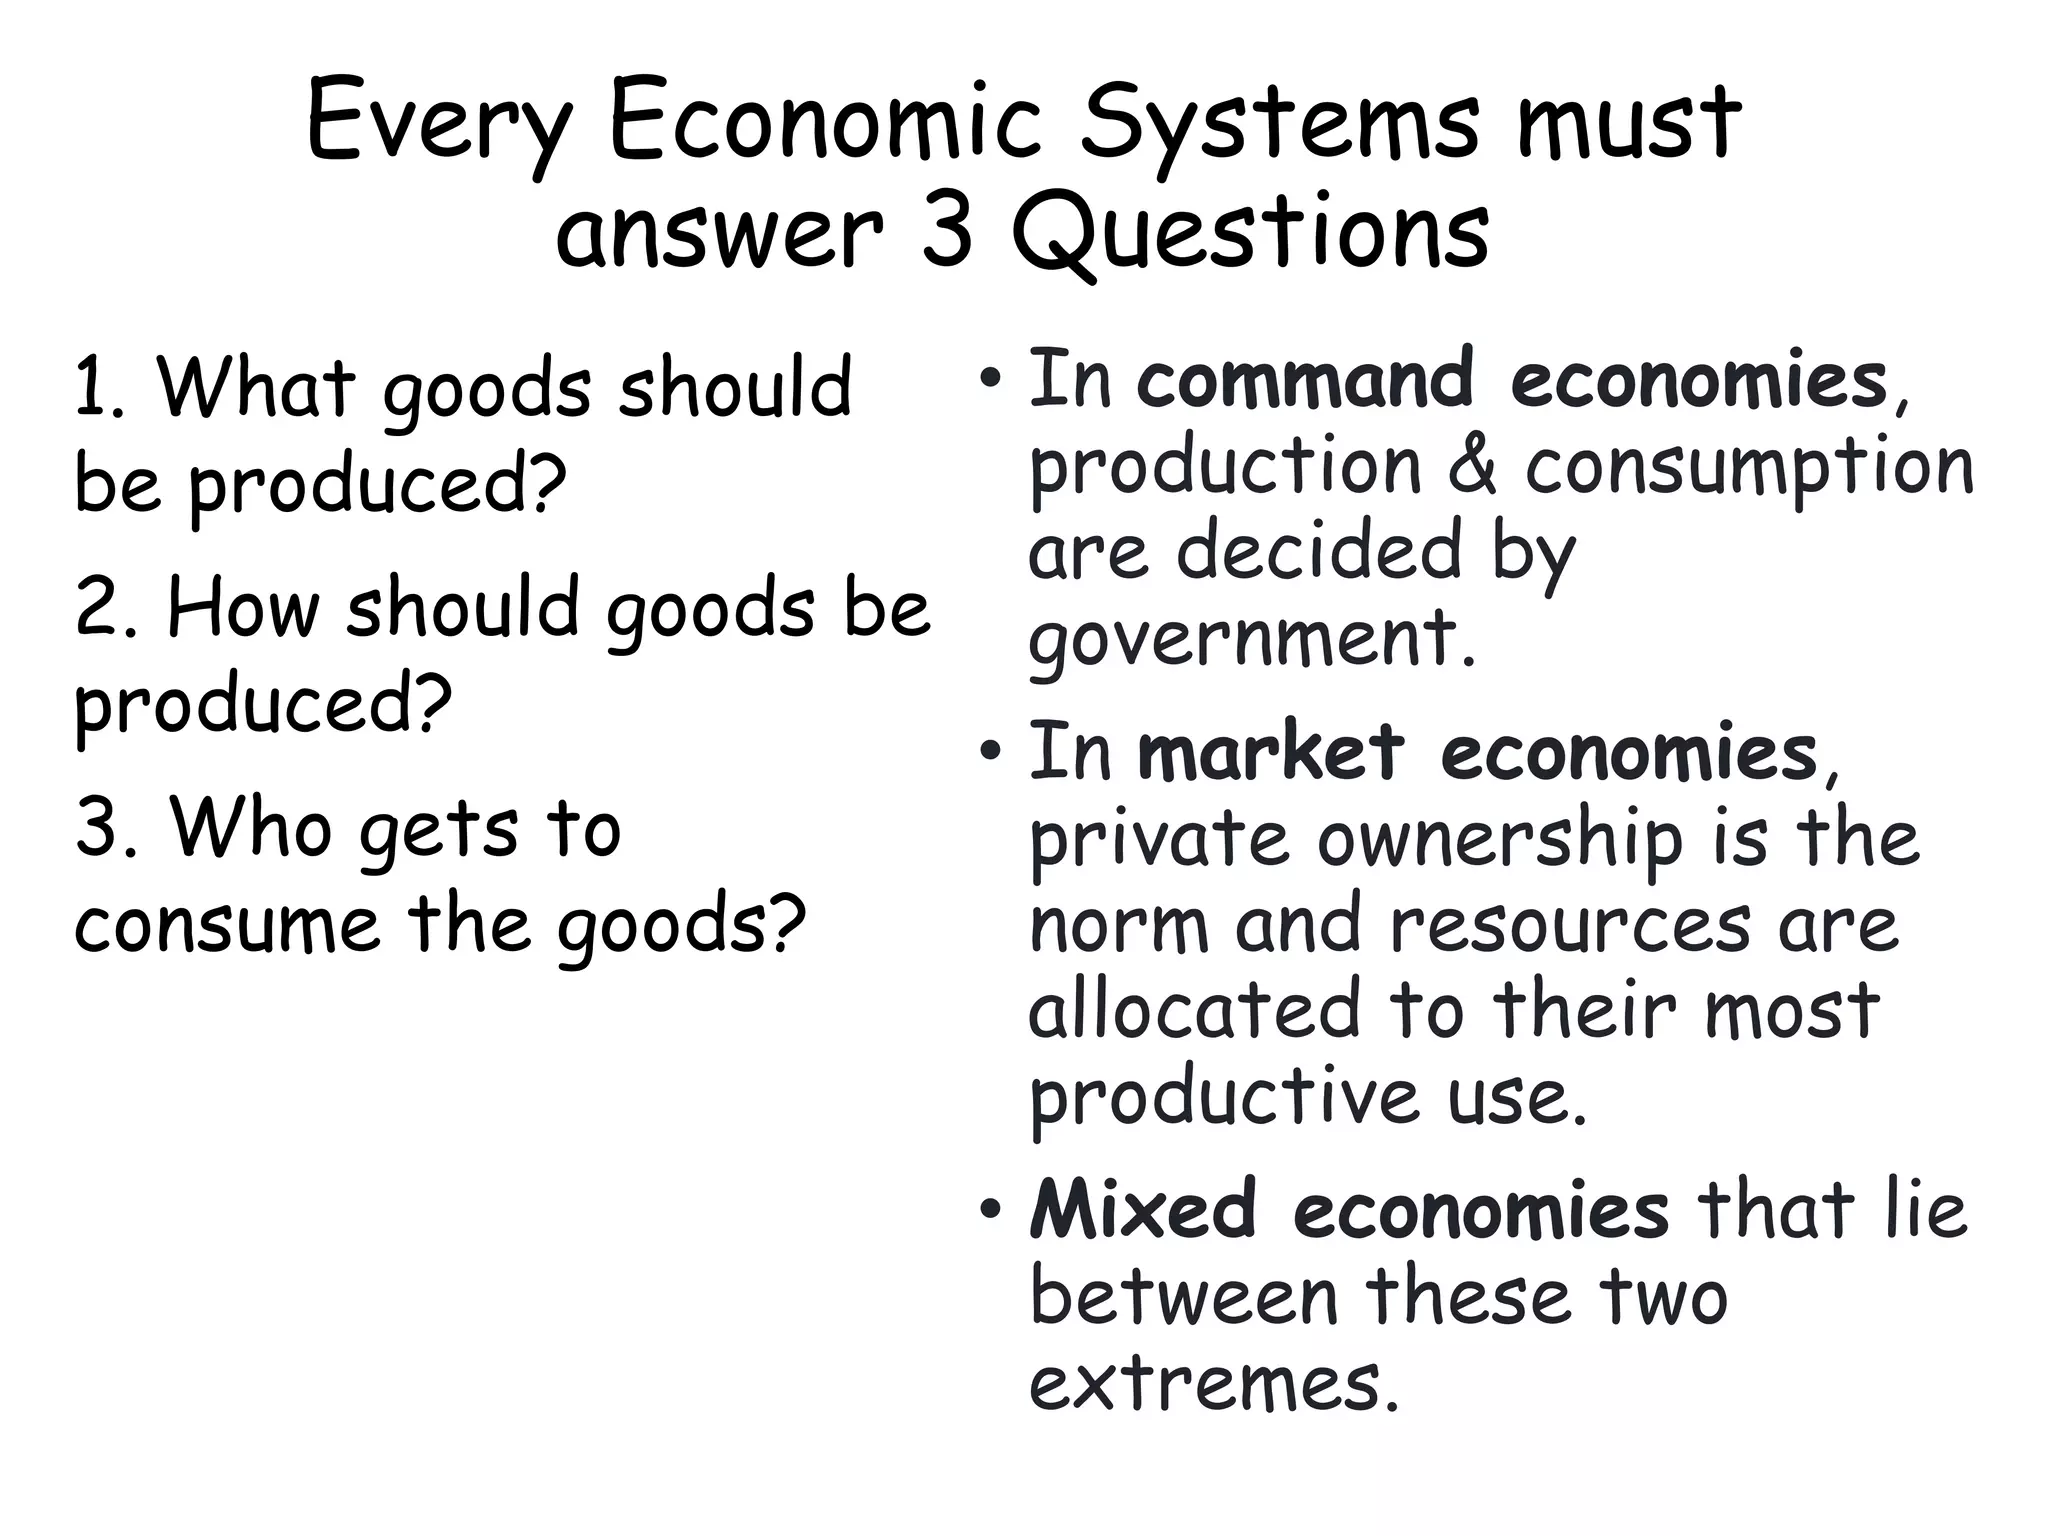
Every Economic Systemsmust
answer 3 Questions
1. What goods should
be produced?
2. How should goods be
produced?
3. Who gets to
consume the goods?
• In command economies,
production & consumption
are decided by
government.
• In market economies,
private ownership is the
norm and resources are
allocated to their most
productive use.
• Mixed economies that lie
between these two
extremes.
4.
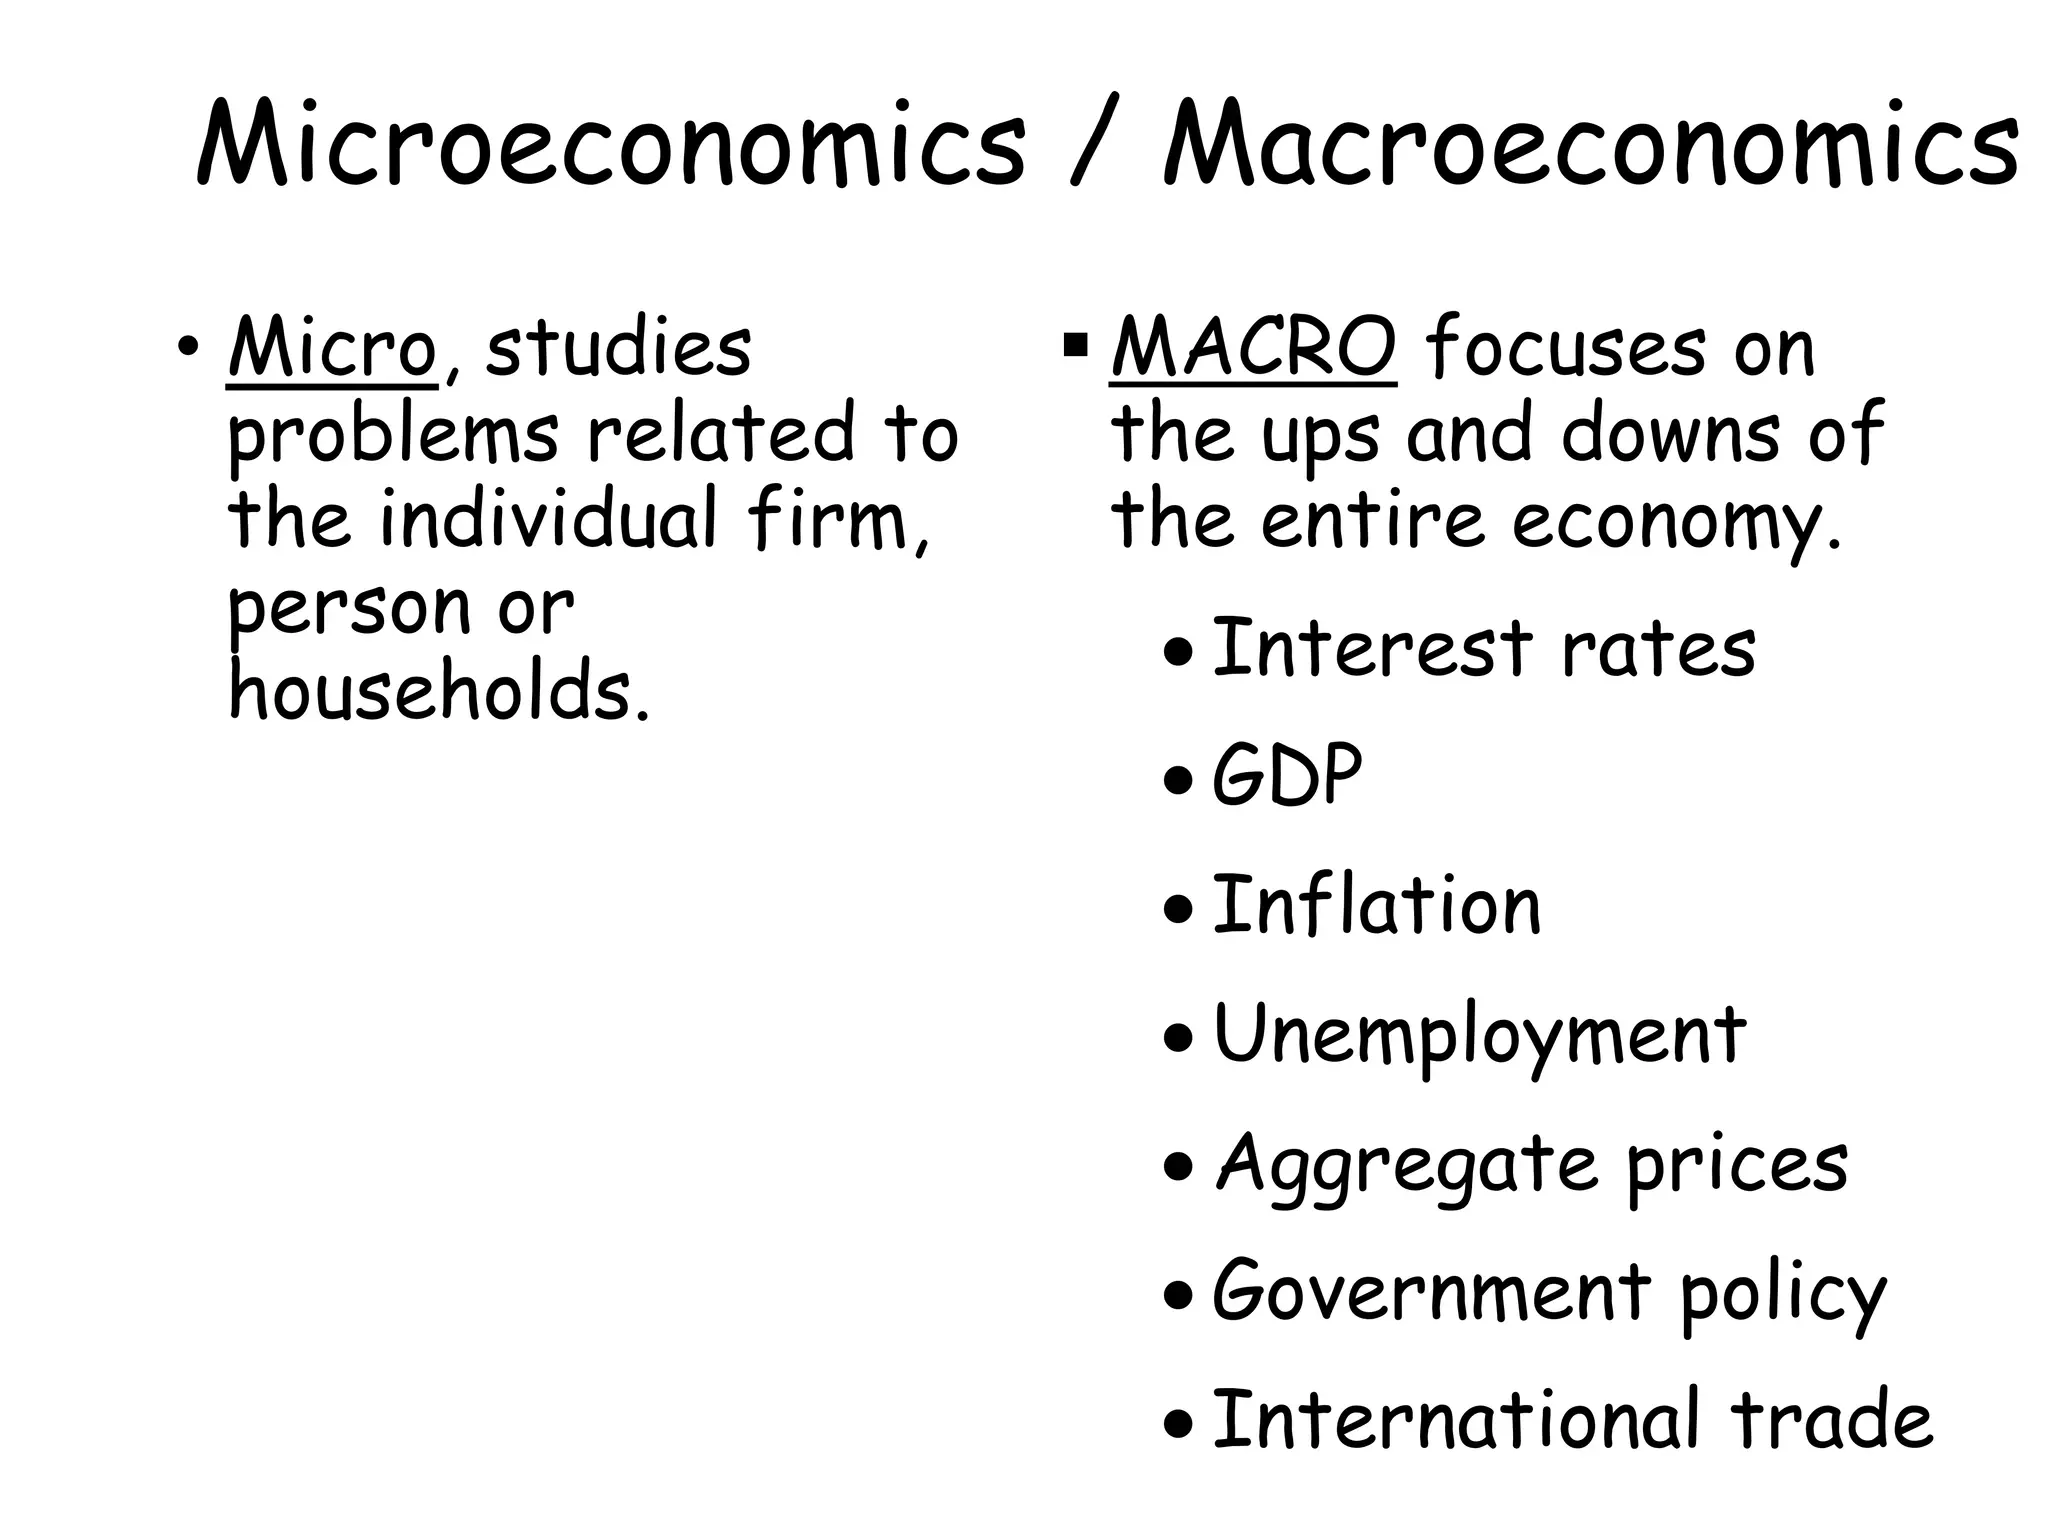
Microeconomics / Macroeconomics
•Micro, studies
problems related to
the individual firm,
person or
households.
MACRO focuses on
the ups and downs of
the entire economy.
Interest rates
GDP
Inflation
Unemployment
Aggregate prices
Government policy
International trade
Invisible Hand
• Metaphorfor how trade,
produces benefits for the
individual and for society.
• “Man intends only his own
gain, and is in this led by an
invisible hand to promote
an end which was no part of
his intention. By pursuing
his own interests, he
promotes that of society
more effectually than when
he intends.” “The Wealth of Nations,”
Adam Smith
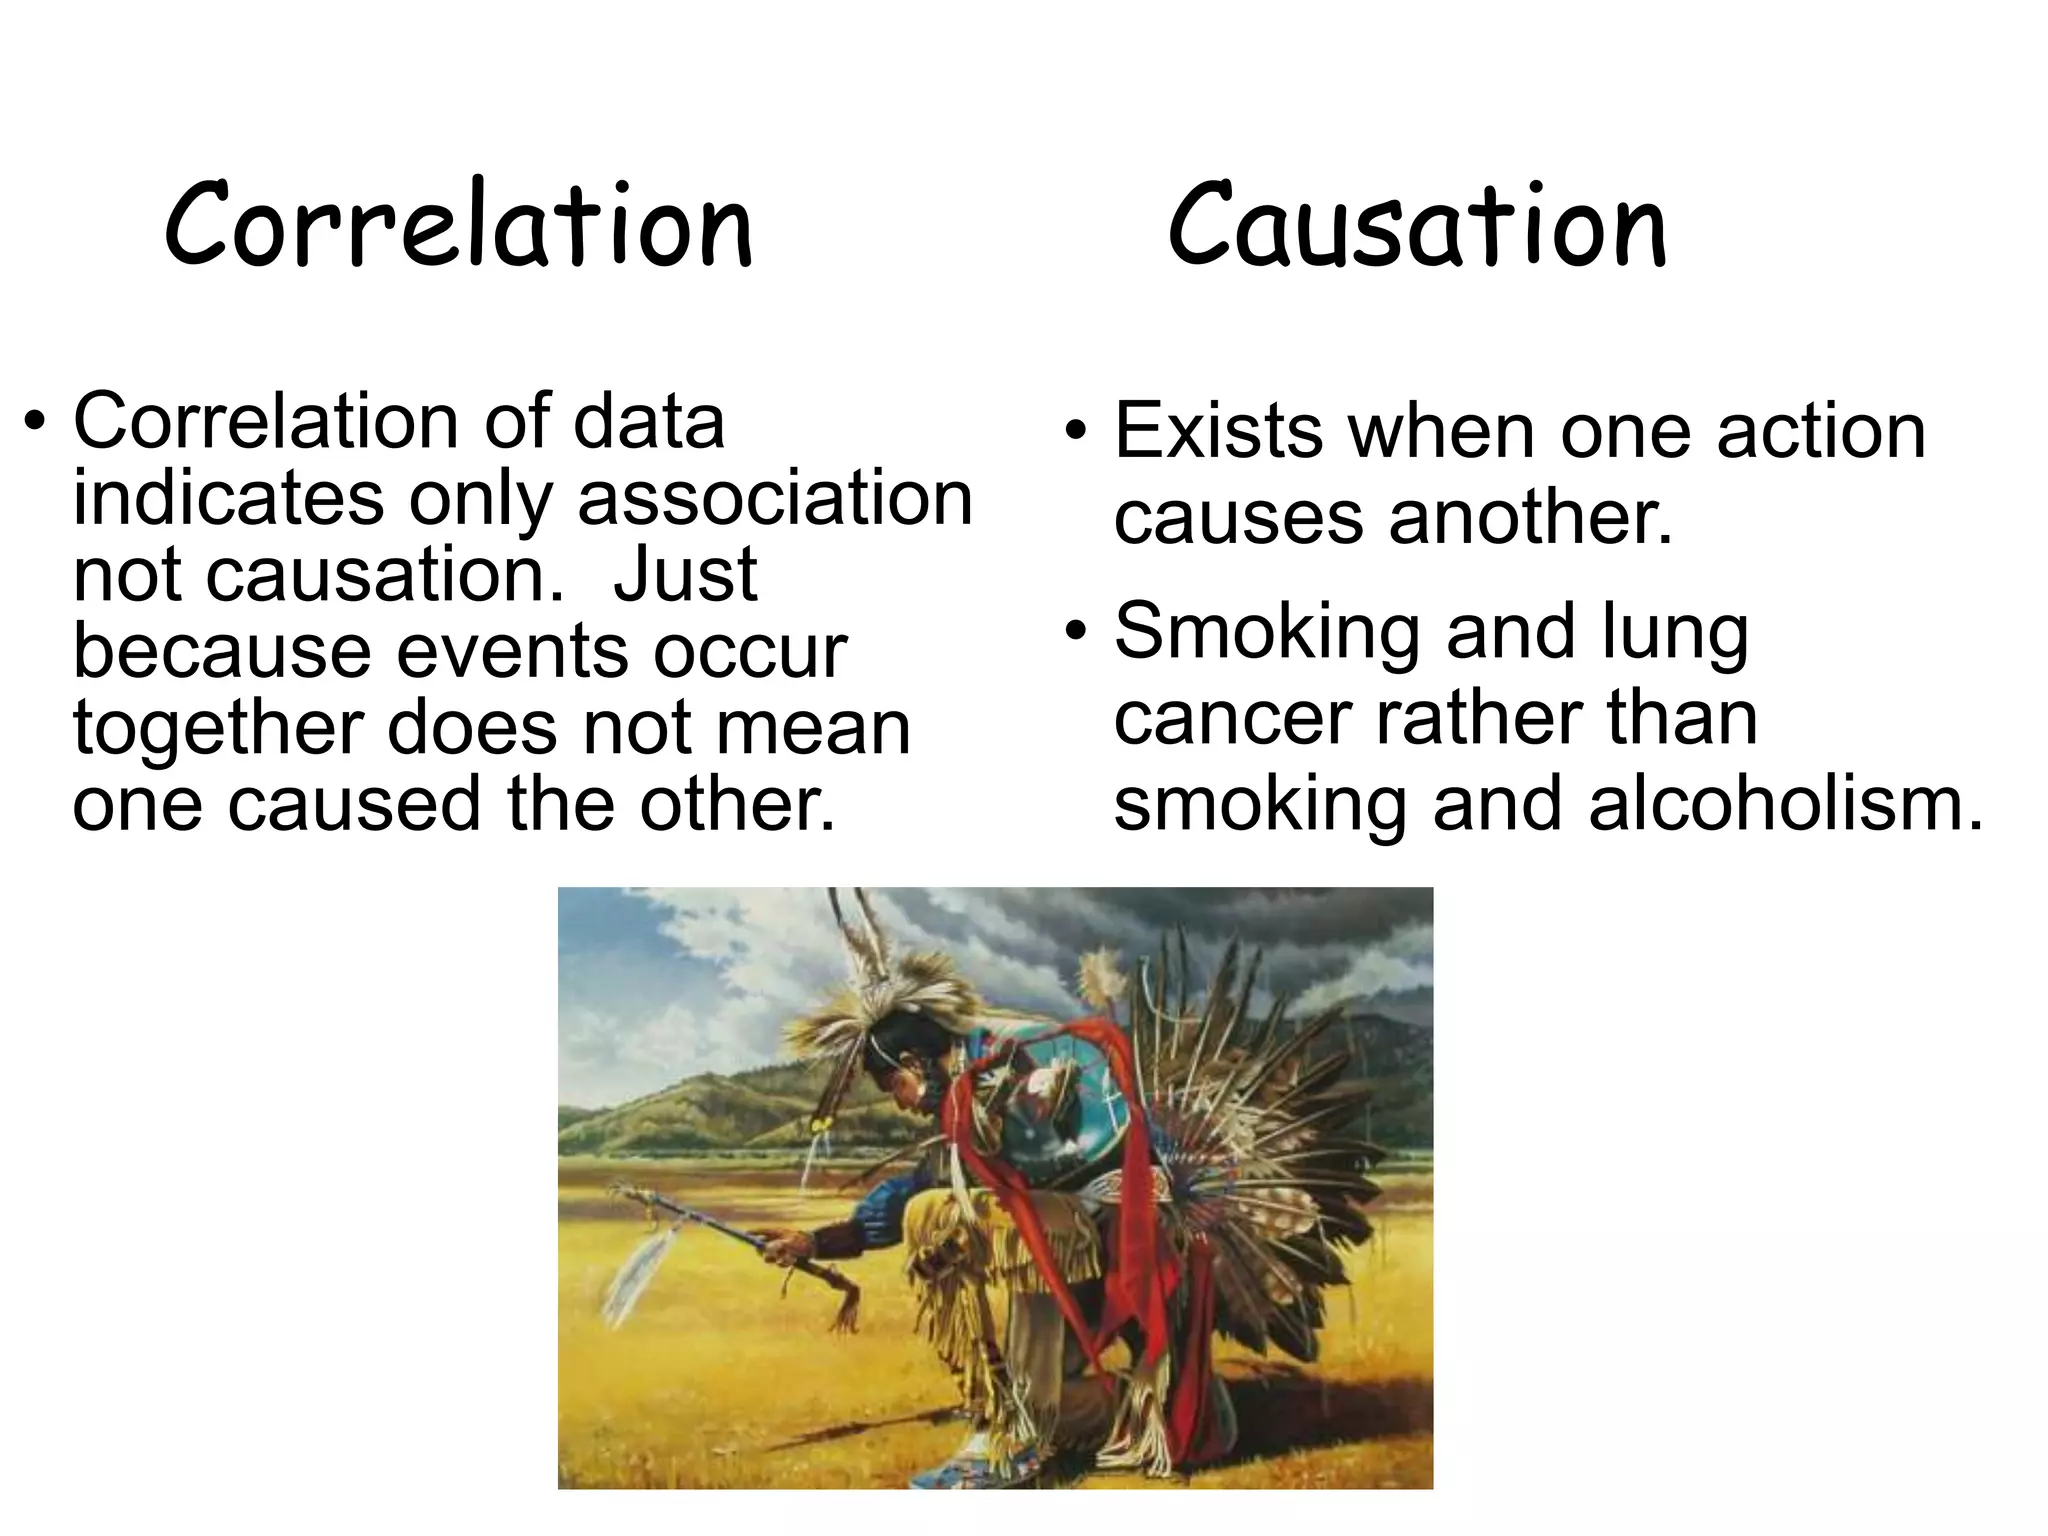
Correlation Causation
• Correlationof data
indicates only association
not causation. Just
because events occur
together does not mean
one caused the other.
• Exists when one action
causes another.
• Smoking and lung
cancer rather than
smoking and alcoholism.
13.
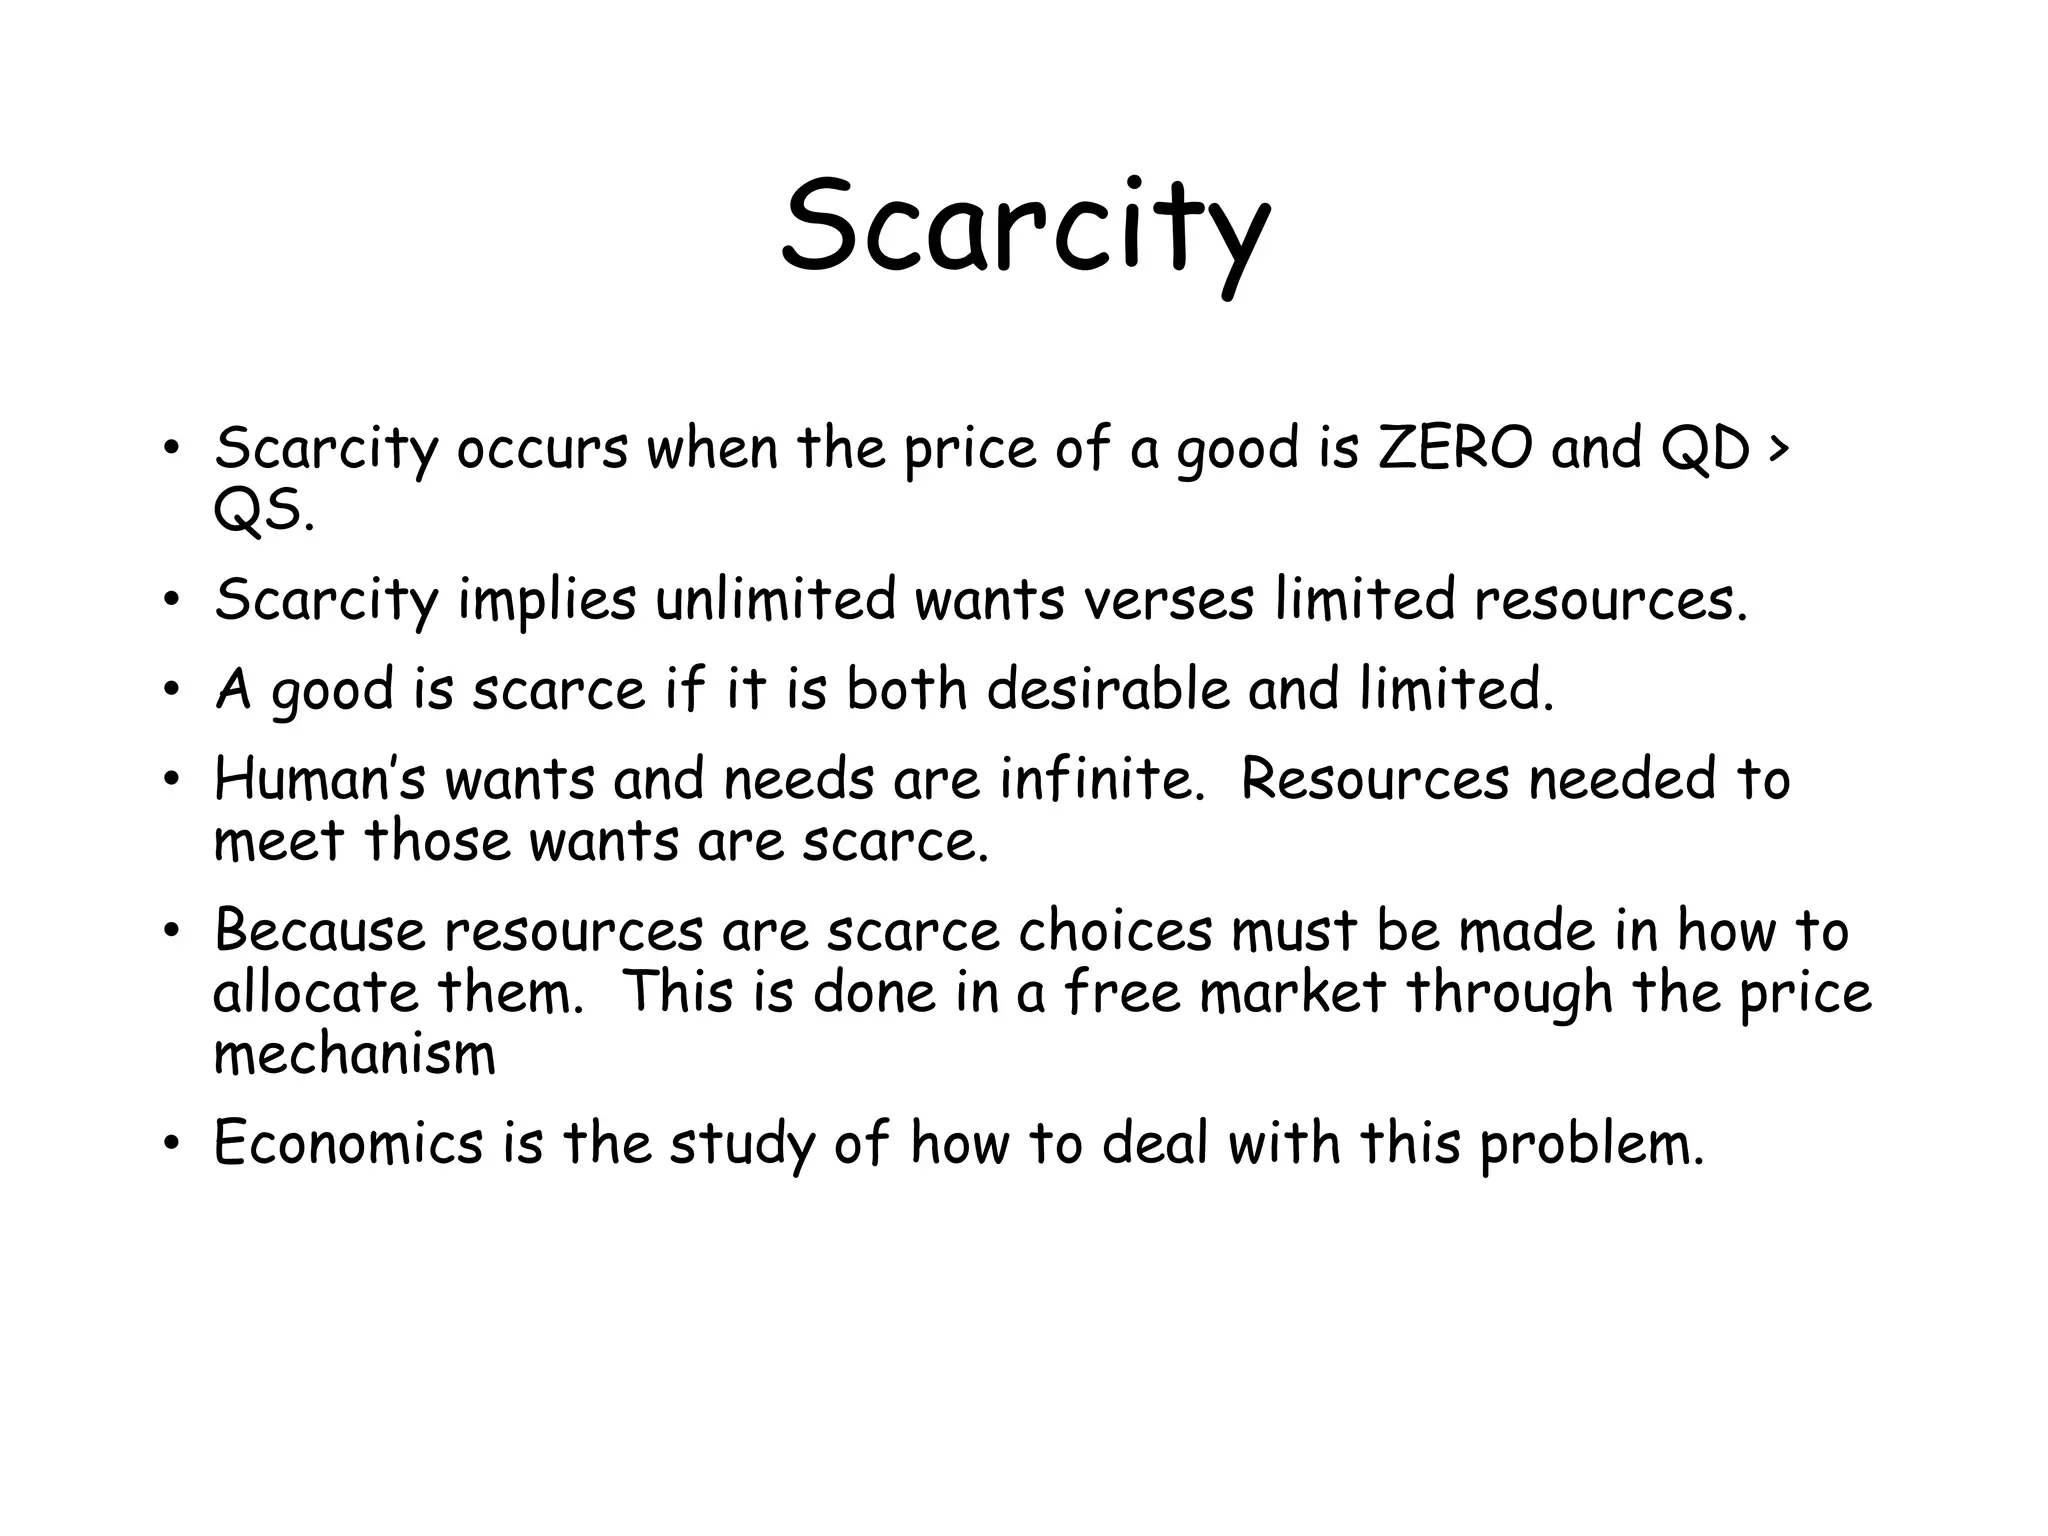
Scarcity
• Scarcity occurswhen the price of a good is ZERO and QD >
QS.
• Scarcity implies unlimited wants verses limited resources.
• A good is scarce if it is both desirable and limited.
• Human’s wants and needs are infinite. Resources needed to
meet those wants are scarce.
• Because resources are scarce choices must be made in how to
allocate them. This is done in a free market through the price
mechanism
• Economics is the study of how to deal with this problem.
14.
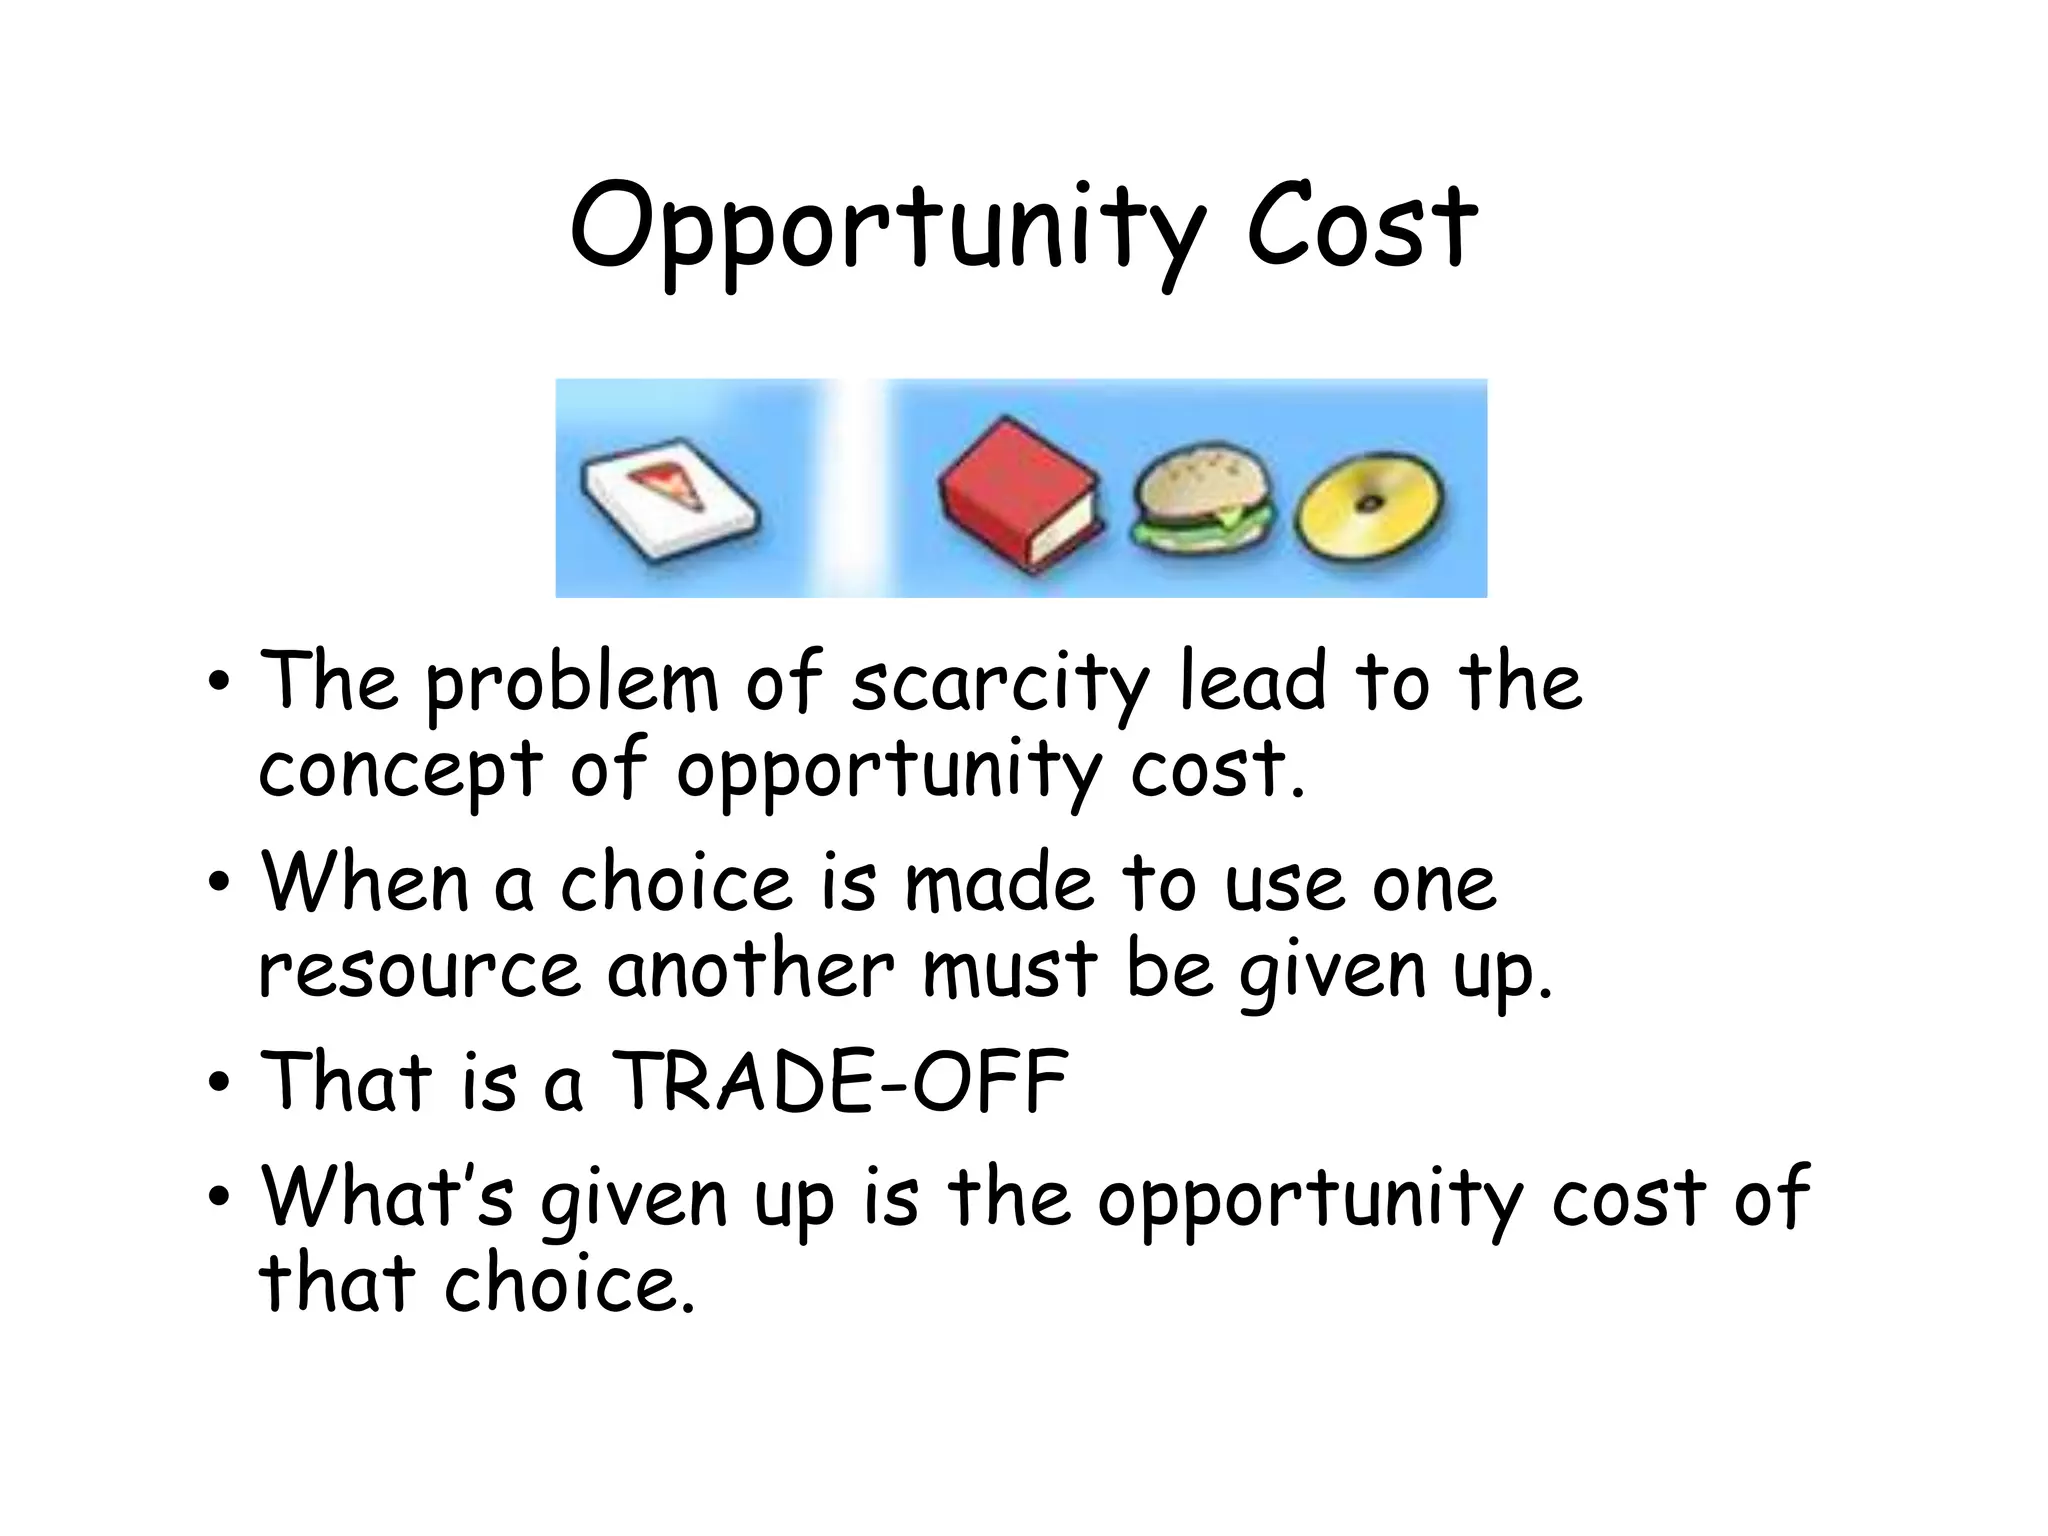
Opportunity Cost
• Theproblem of scarcity lead to the
concept of opportunity cost.
• When a choice is made to use one
resource another must be given up.
• That is a TRADE-OFF
• What’s given up is the opportunity cost of
that choice.
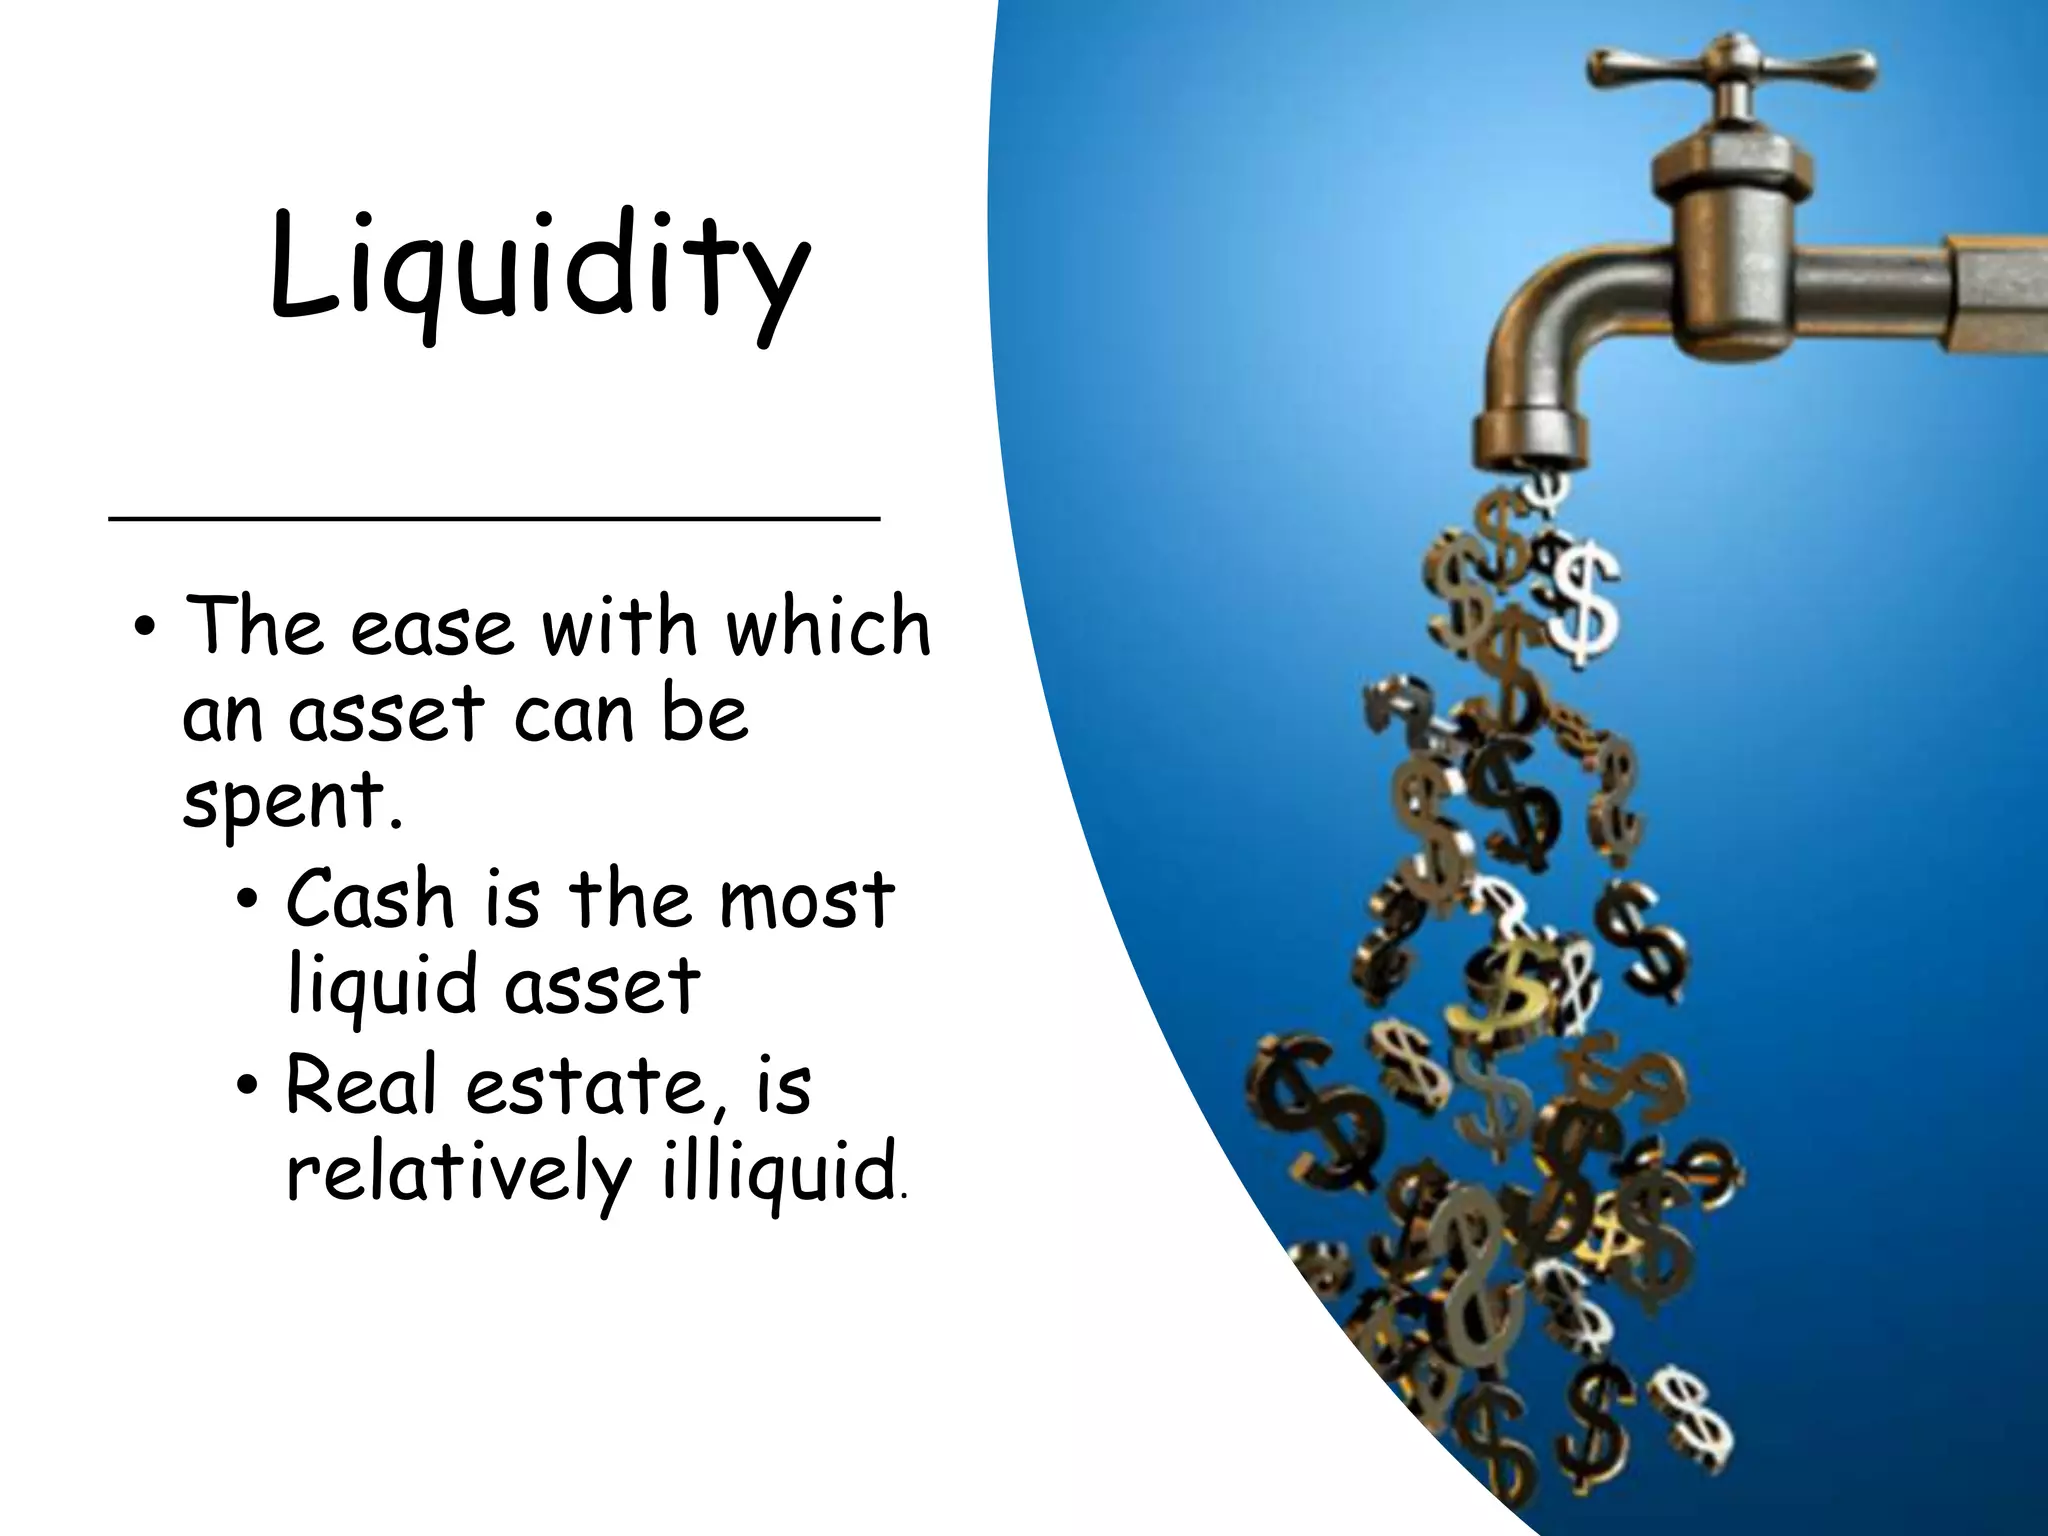
Liquidity
• The easewith which
an asset can be
spent.
• Cash is the most
liquid asset
• Real estate, is
relatively illiquid.
17.
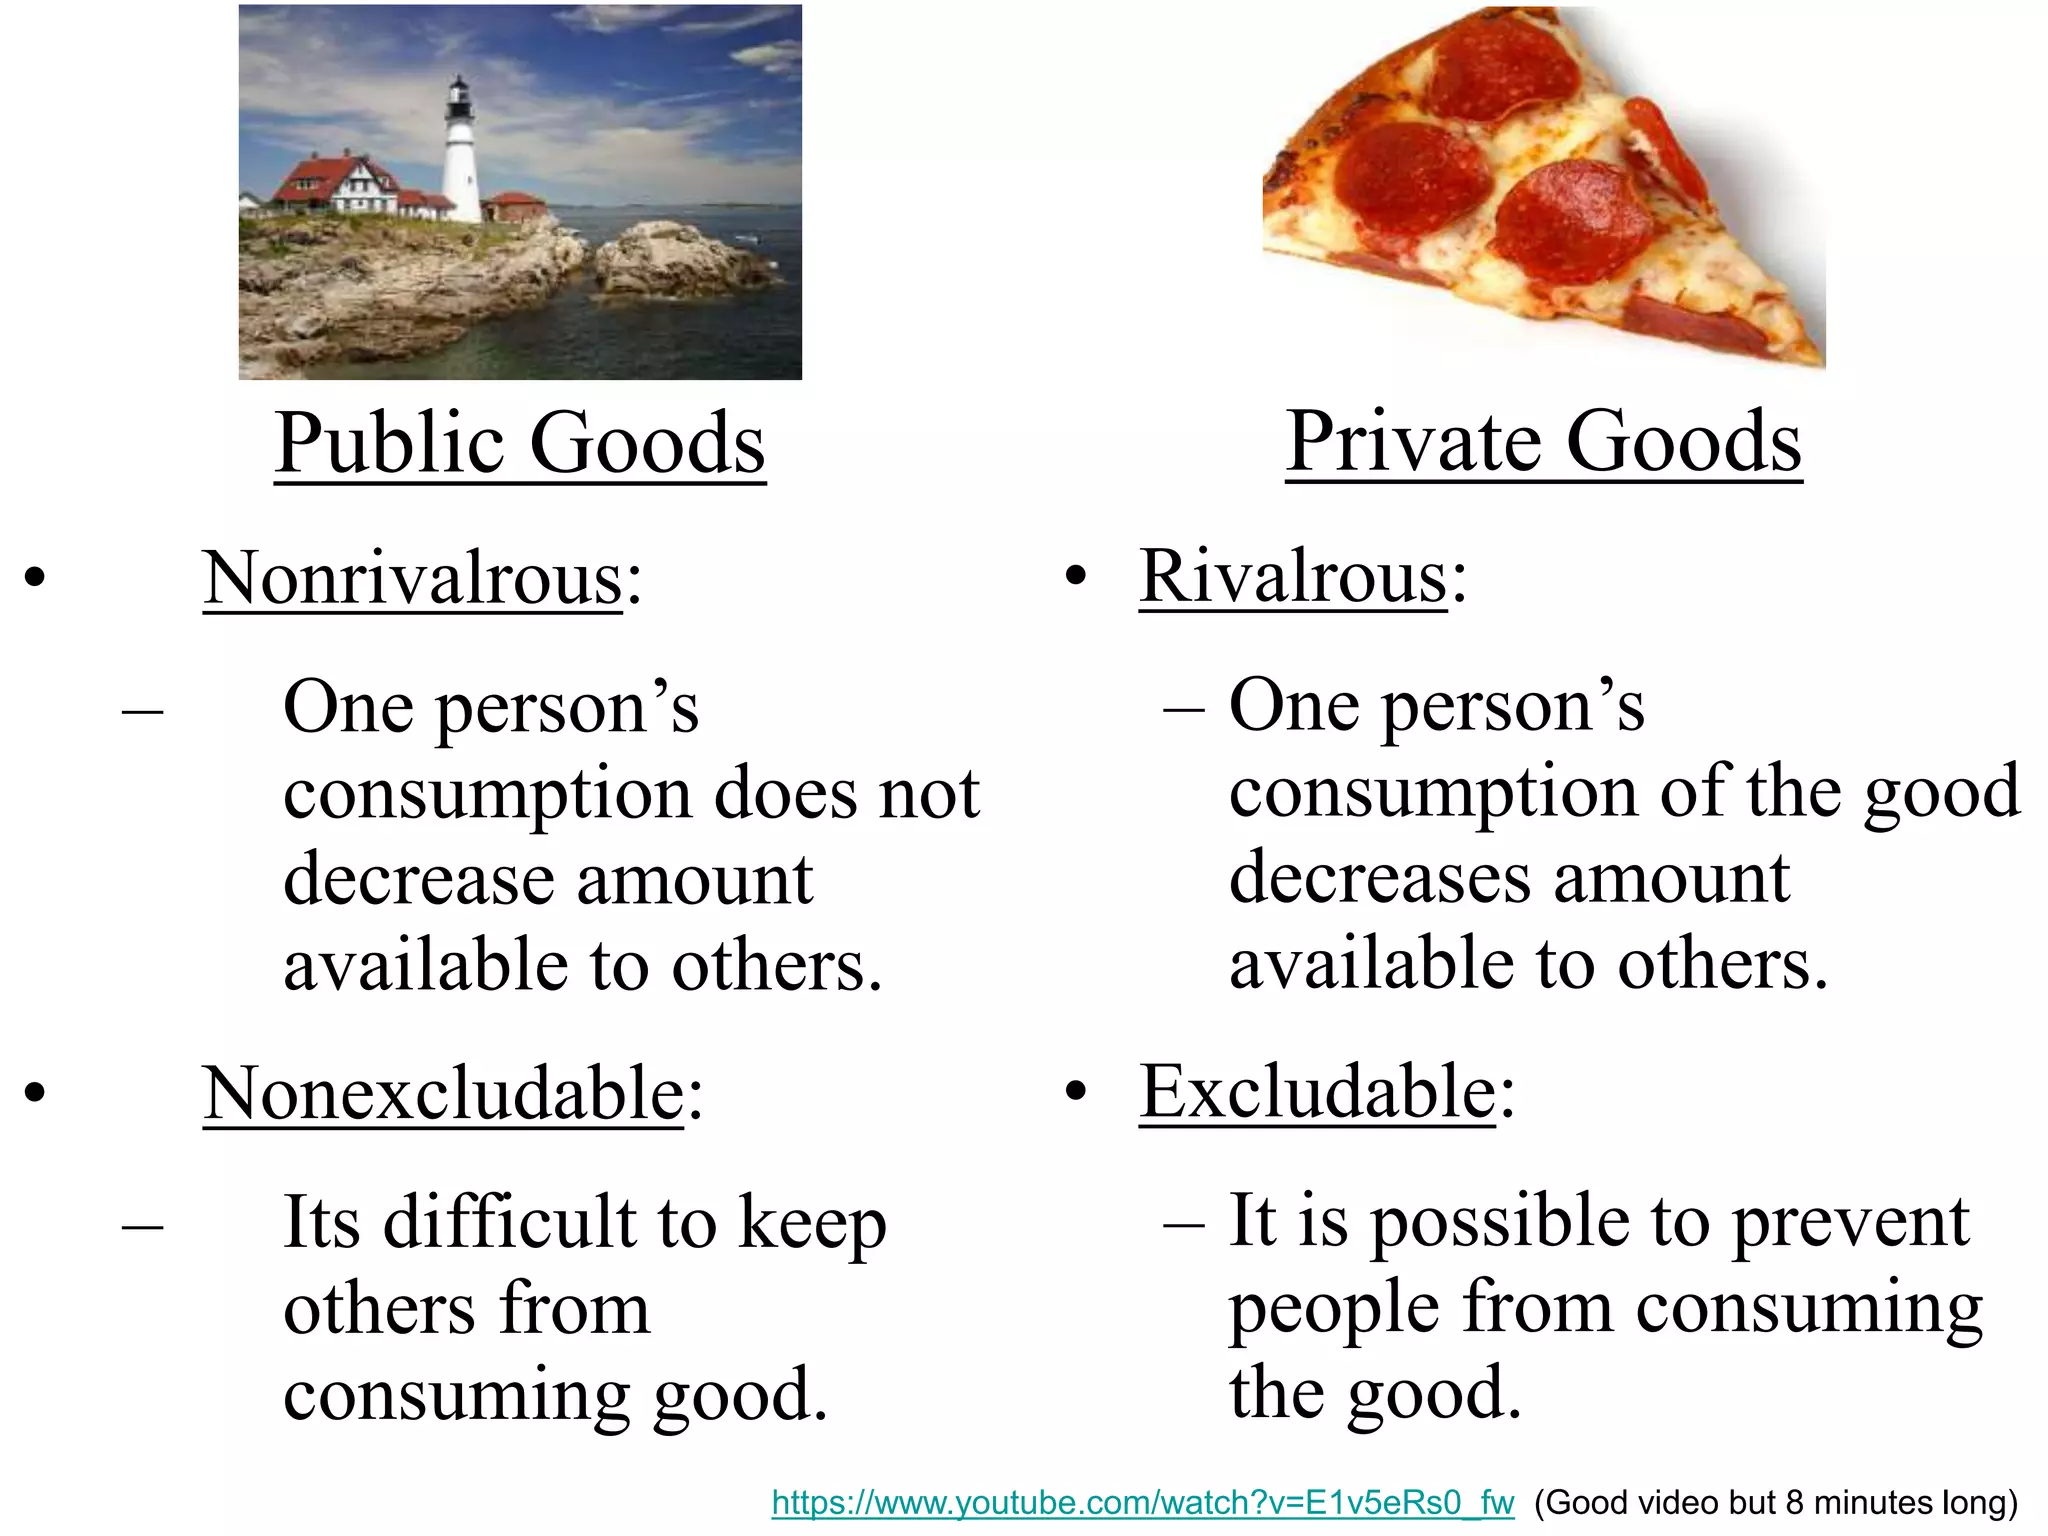
Public Goods
• Nonrivalrous:
–One person’s
consumption does not
decrease amount
available to others.
• Nonexcludable:
– Its difficult to keep
others from
consuming good.
Private Goods
• Rivalrous:
– One person’s
consumption of the good
decreases amount
available to others.
• Excludable:
– It is possible to prevent
people from consuming
the good.
https://www.youtube.com/watch?v=E1v5eRs0_fw (Good video but 8 minutes long)
18.
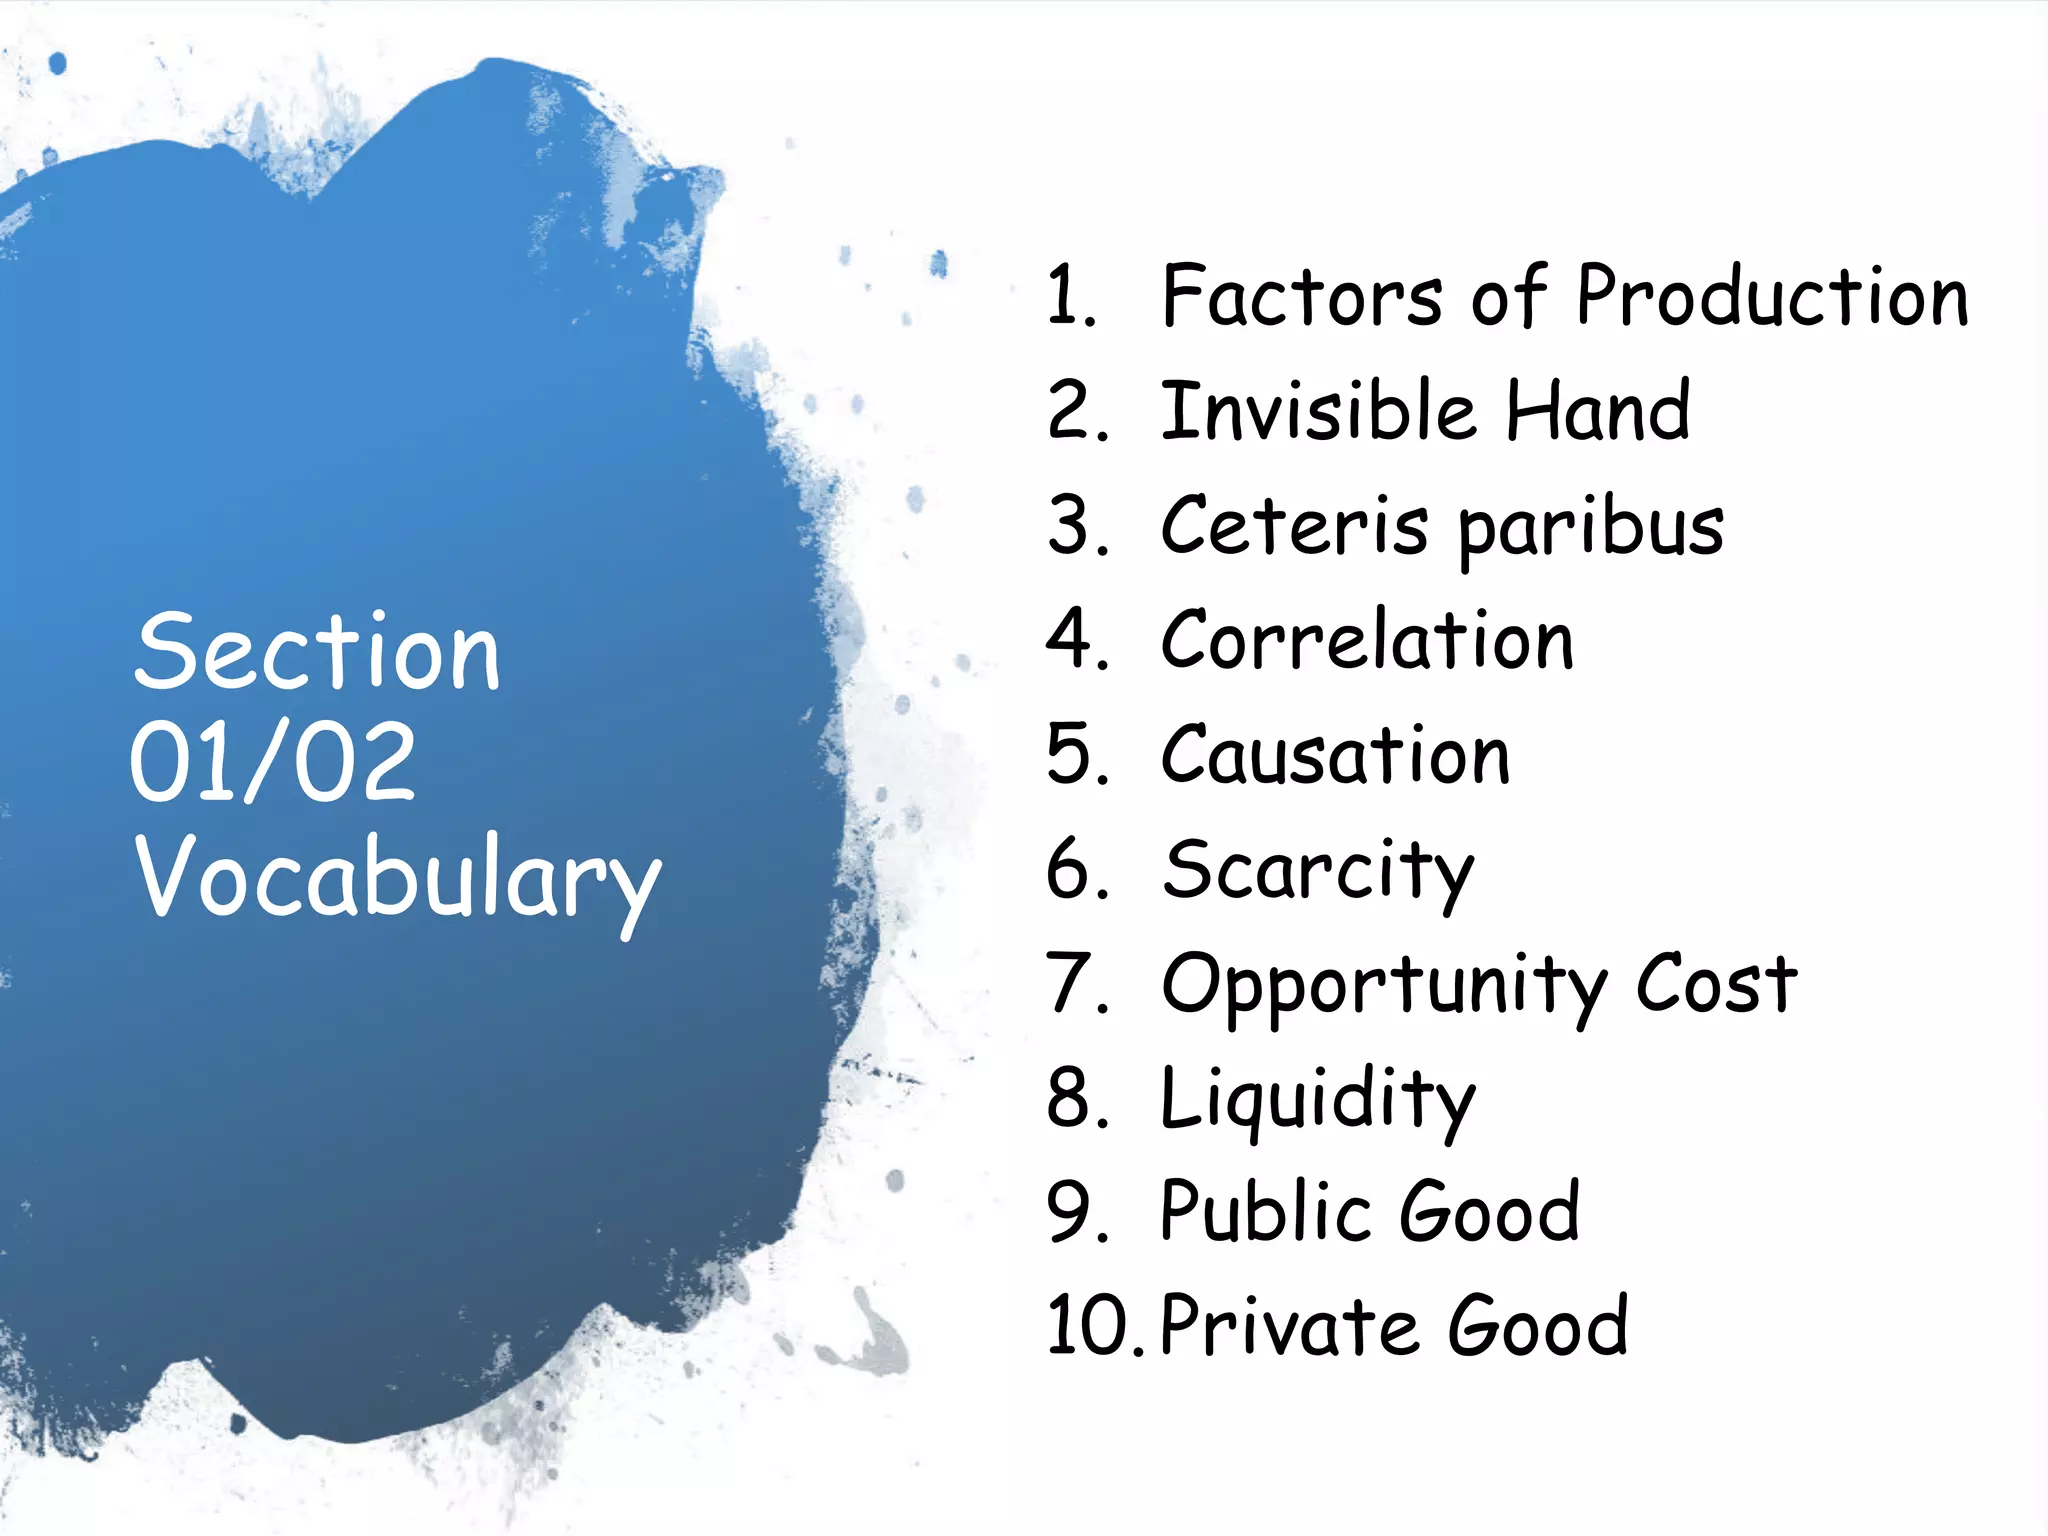
Section
01/02
Vocabulary
1. Factors ofProduction
2. Invisible Hand
3. Ceteris paribus
4. Correlation
5. Causation
6. Scarcity
7. Opportunity Cost
8. Liquidity
9. Public Good
10.Private Good
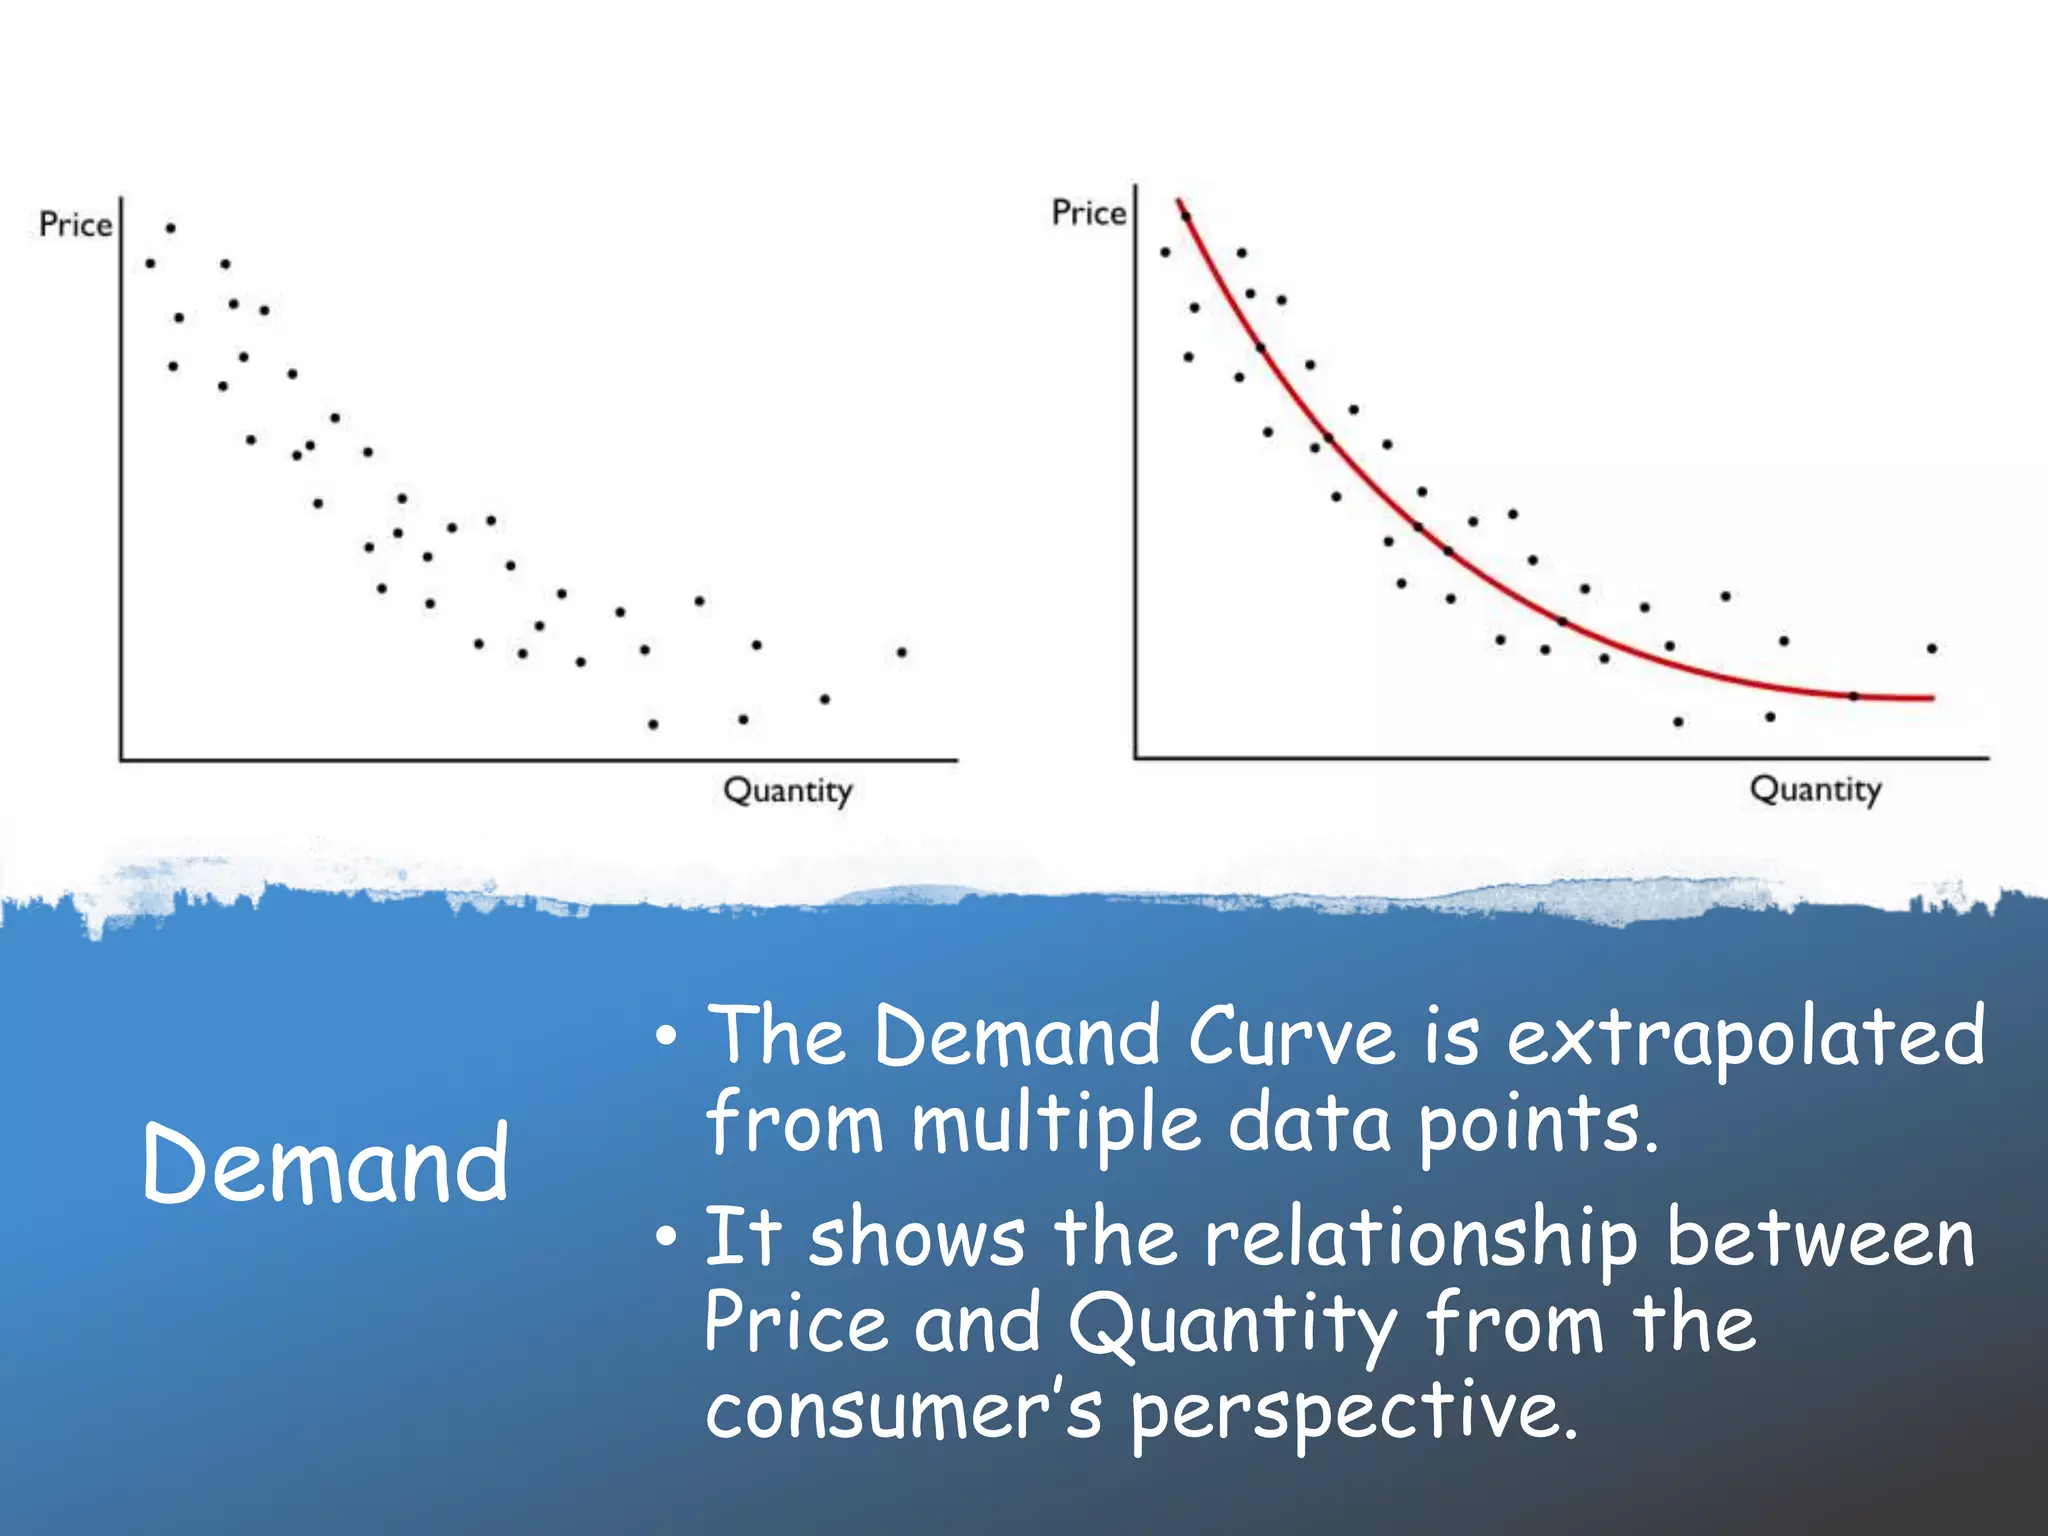
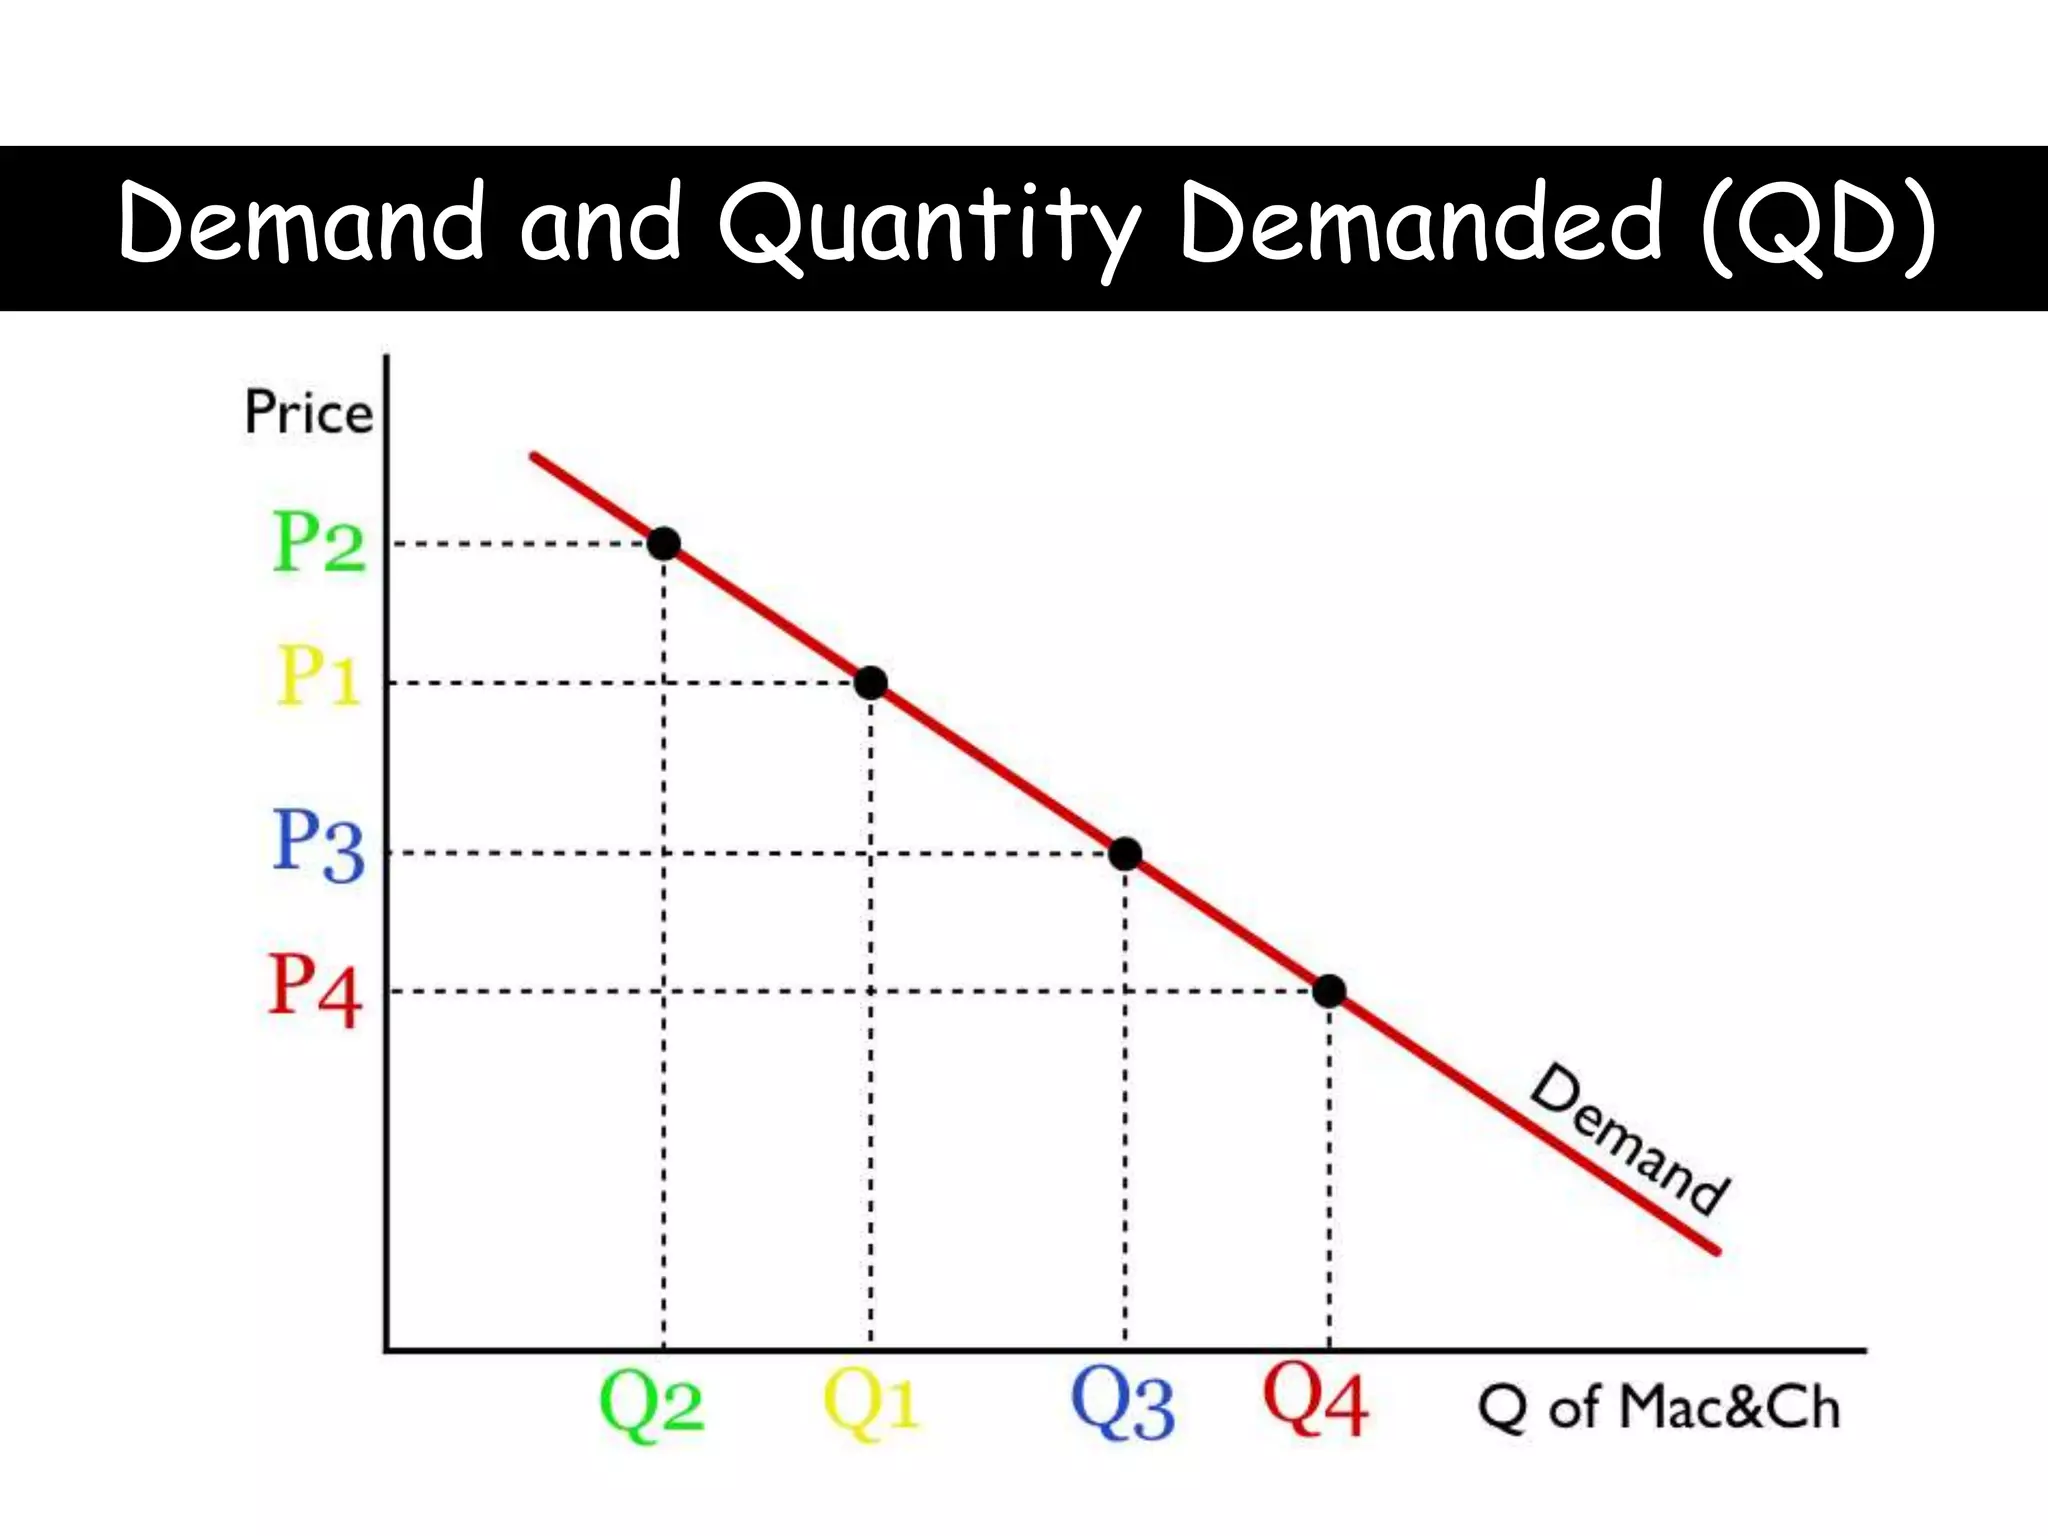
Demand
• The DemandCurve is extrapolated
from multiple data points.
• It shows the relationship between
Price and Quantity from the
consumer’s perspective.
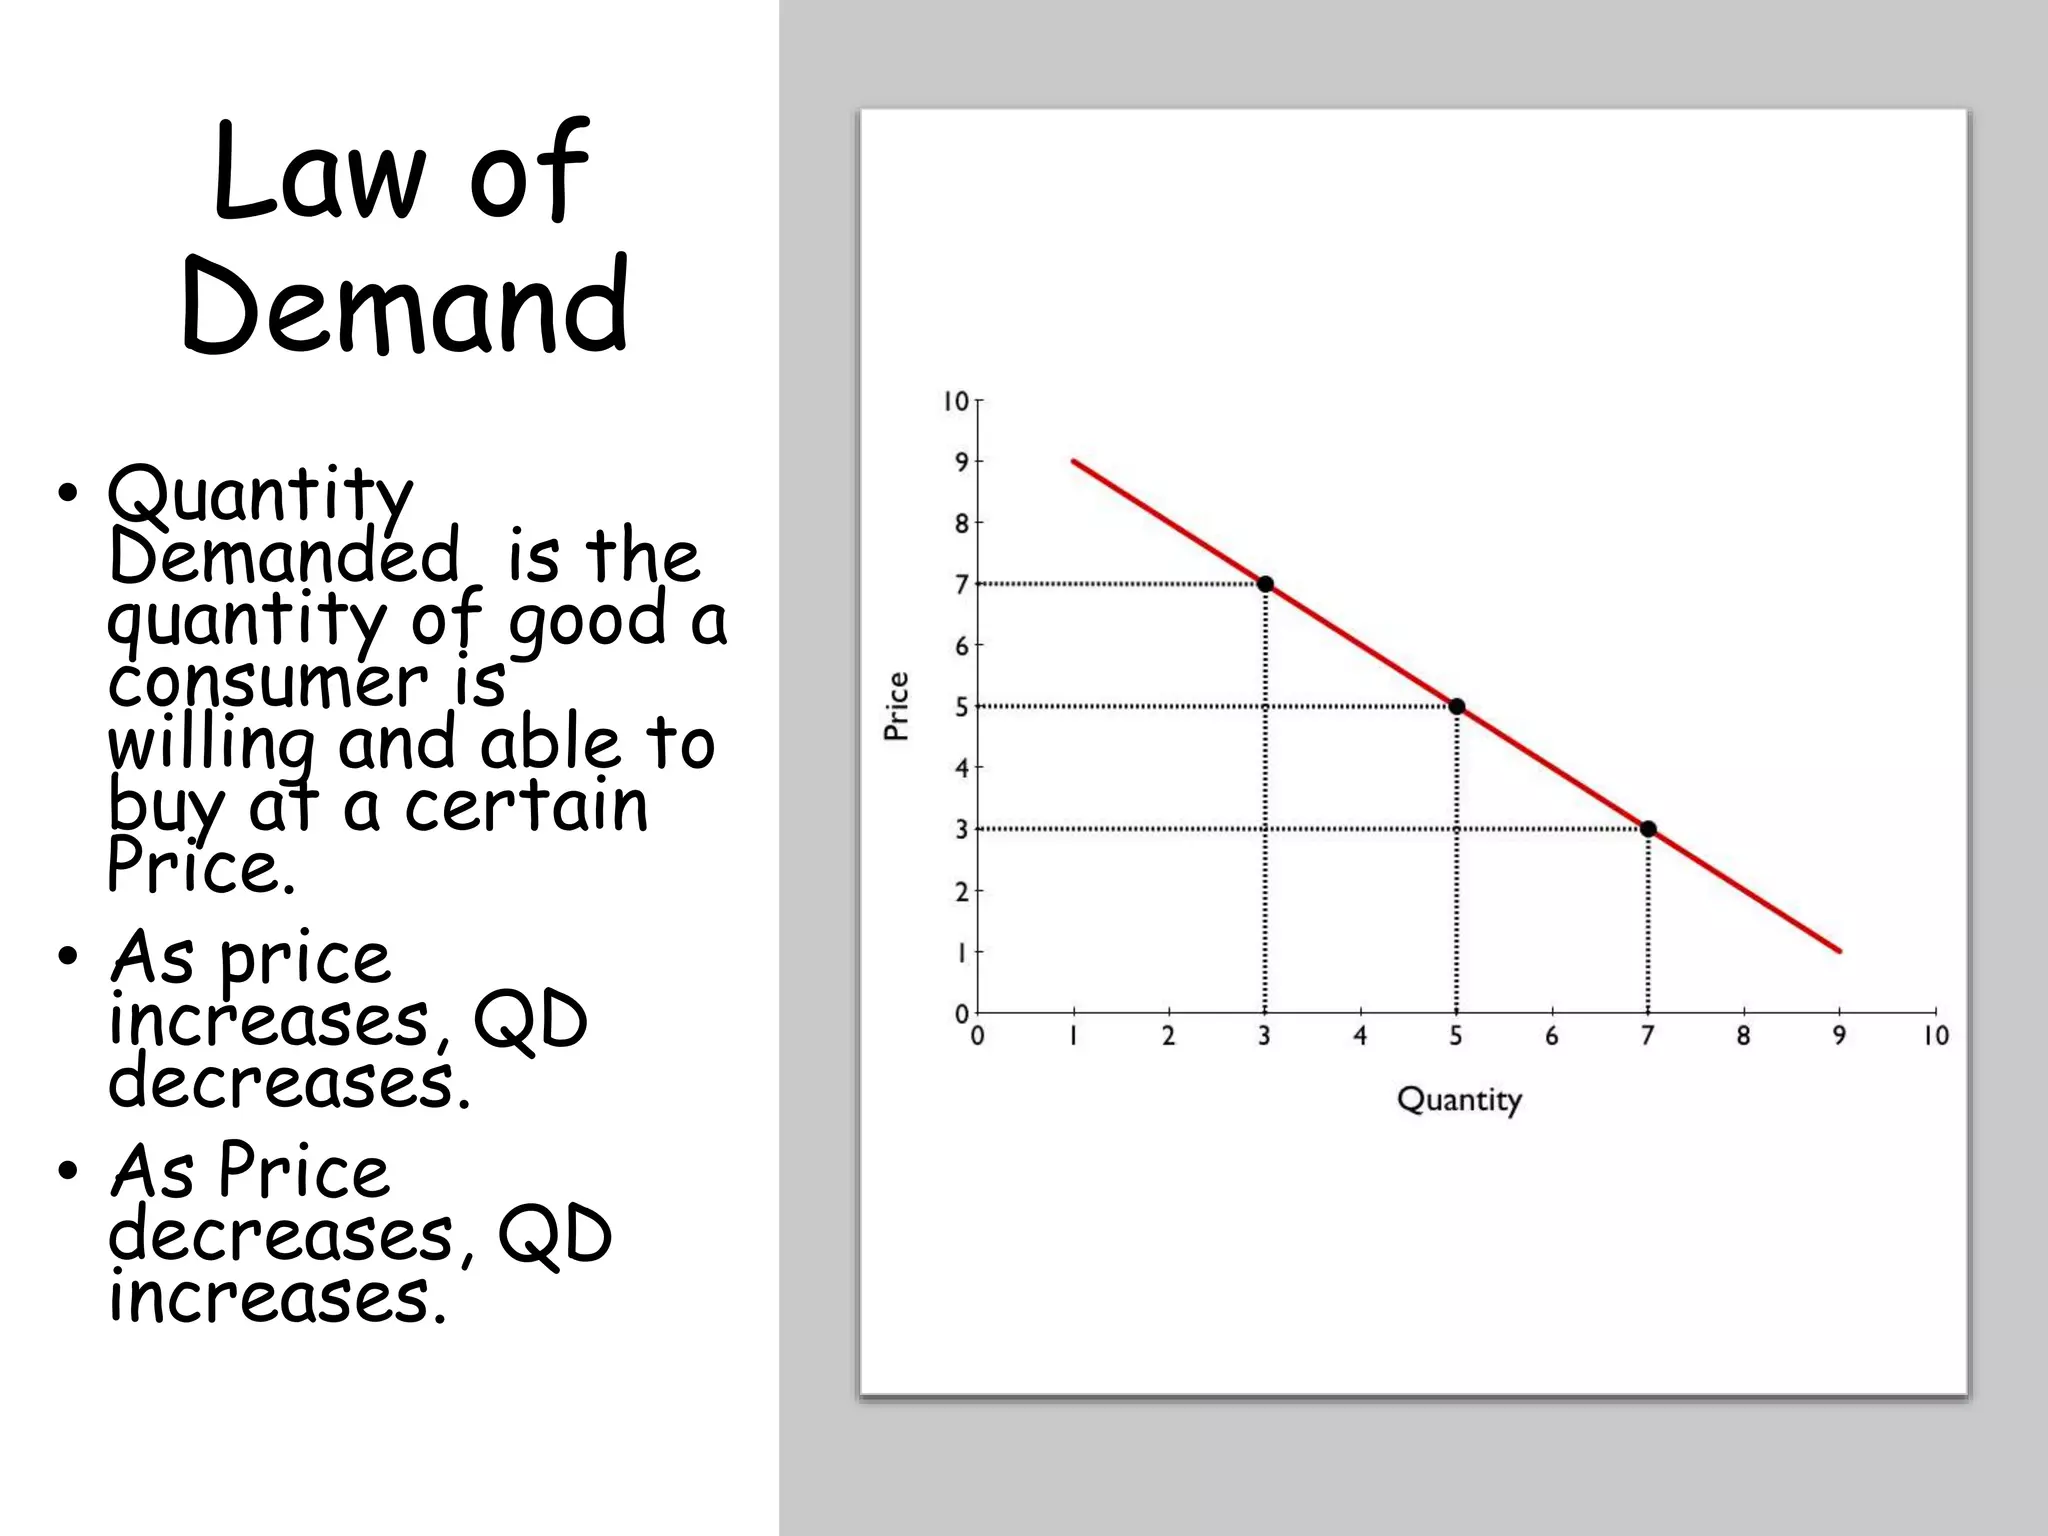
Law of
Demand
• Quantity
Demandedis the
quantity of good a
consumer is
willing and able to
buy at a certain
Price.
• As price
increases, QD
decreases.
• As Price
decreases, QD
increases.
23.
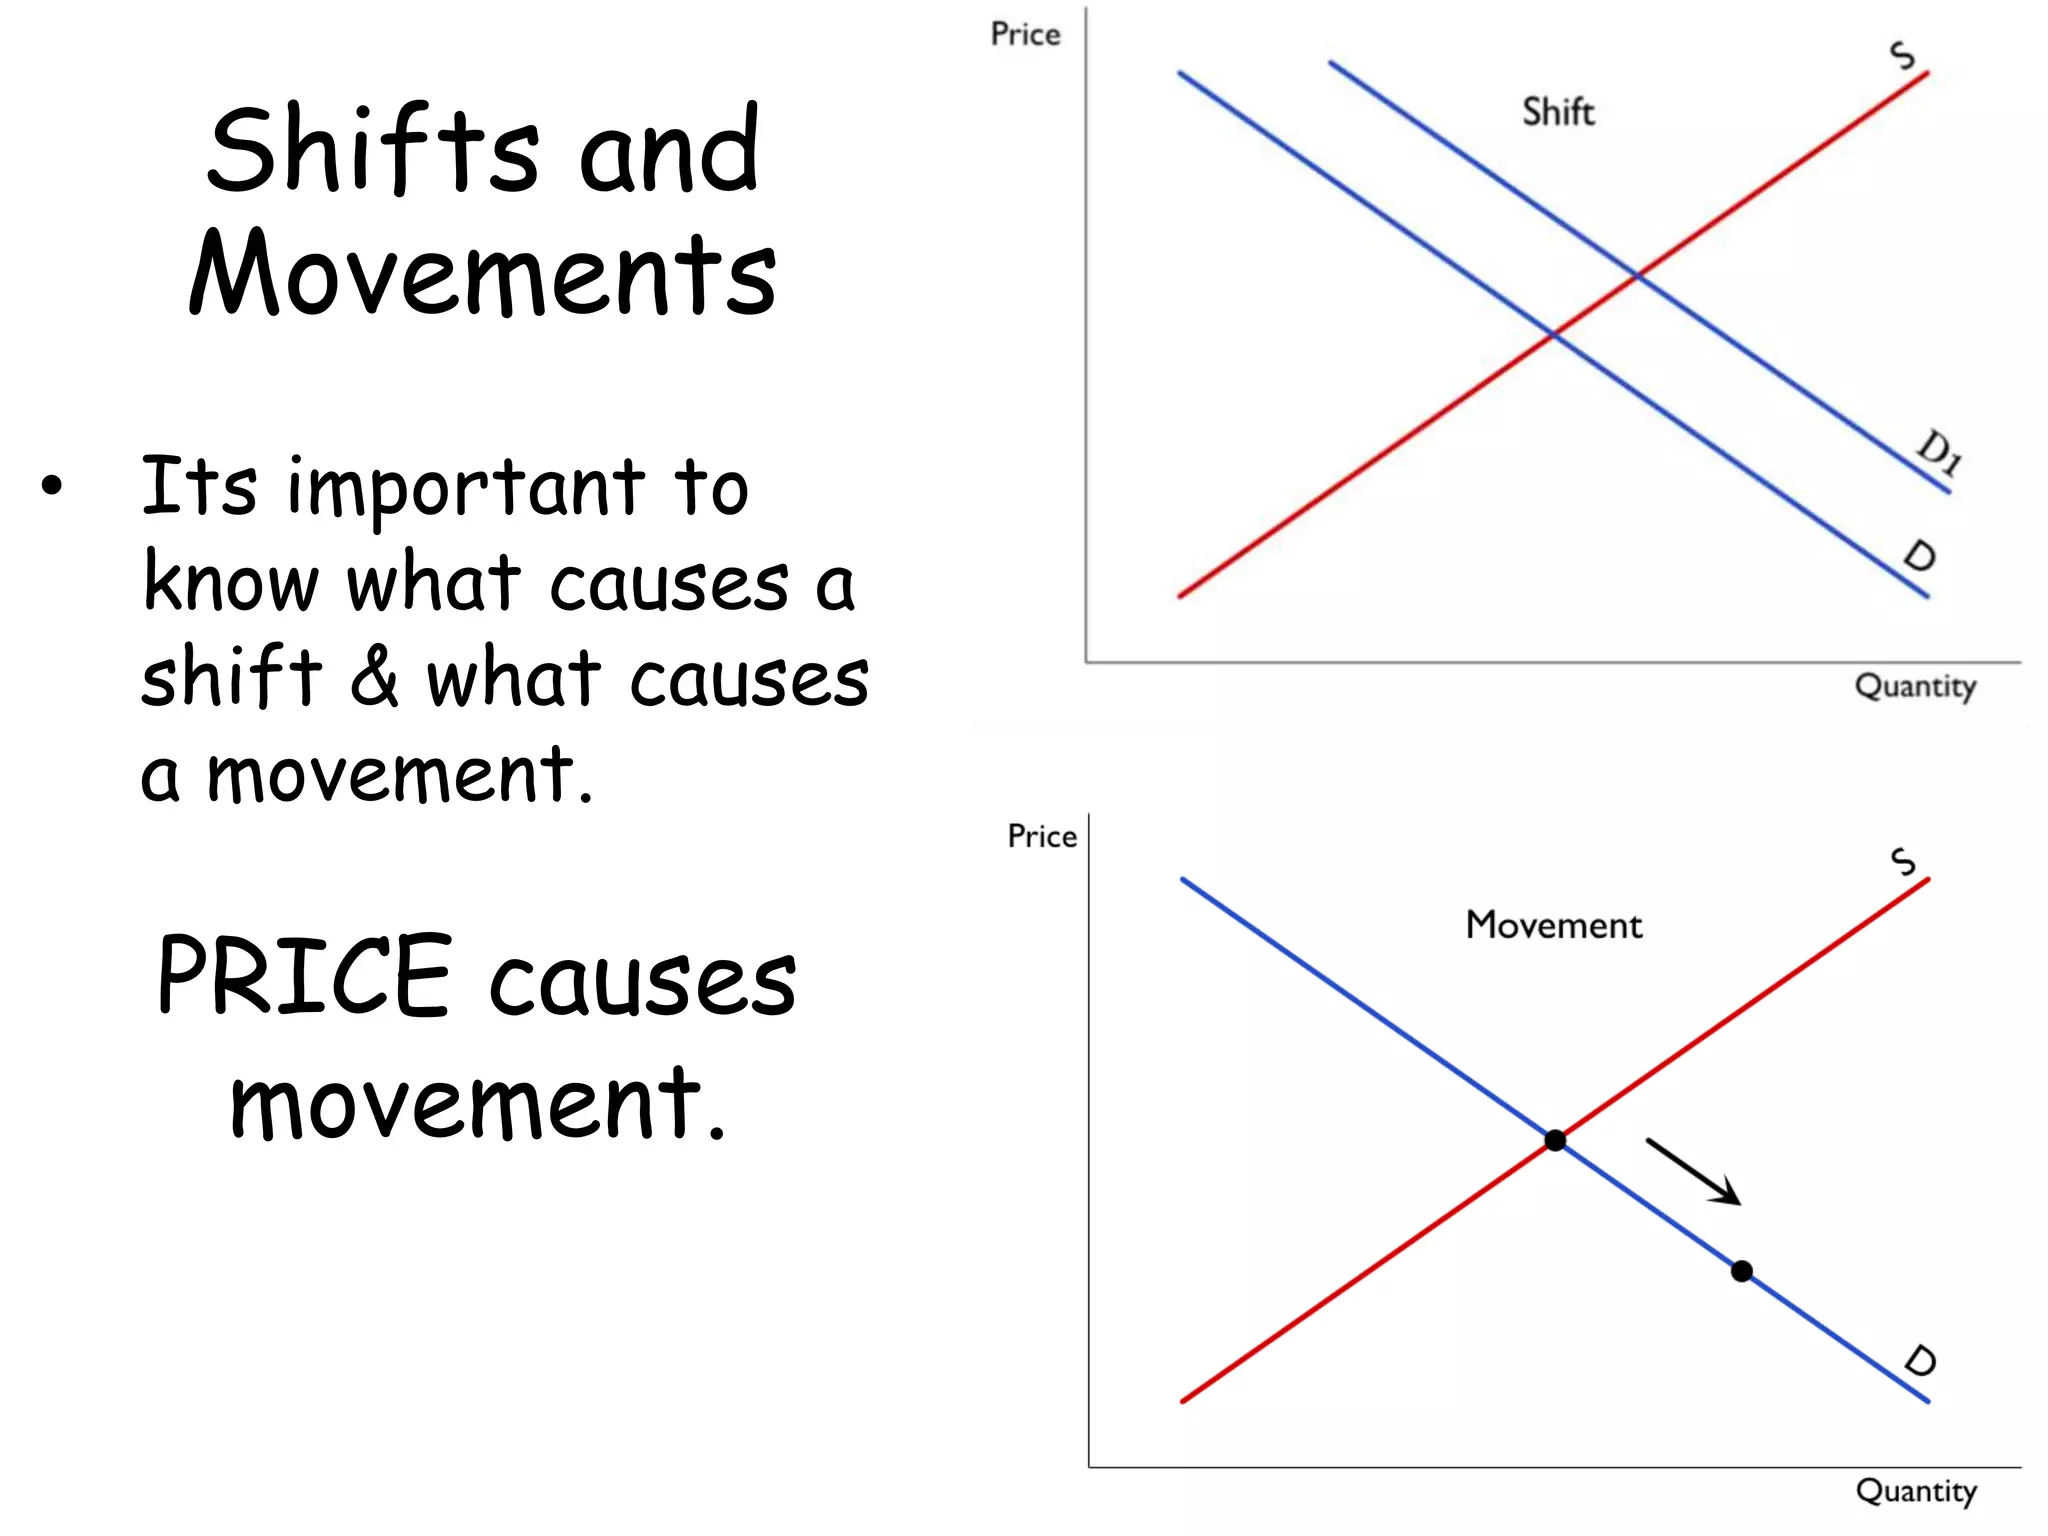
Shifts and
Movements
• Itsimportant to
know what causes a
shift & what causes
a movement.
PRICE causes
movement.
24.
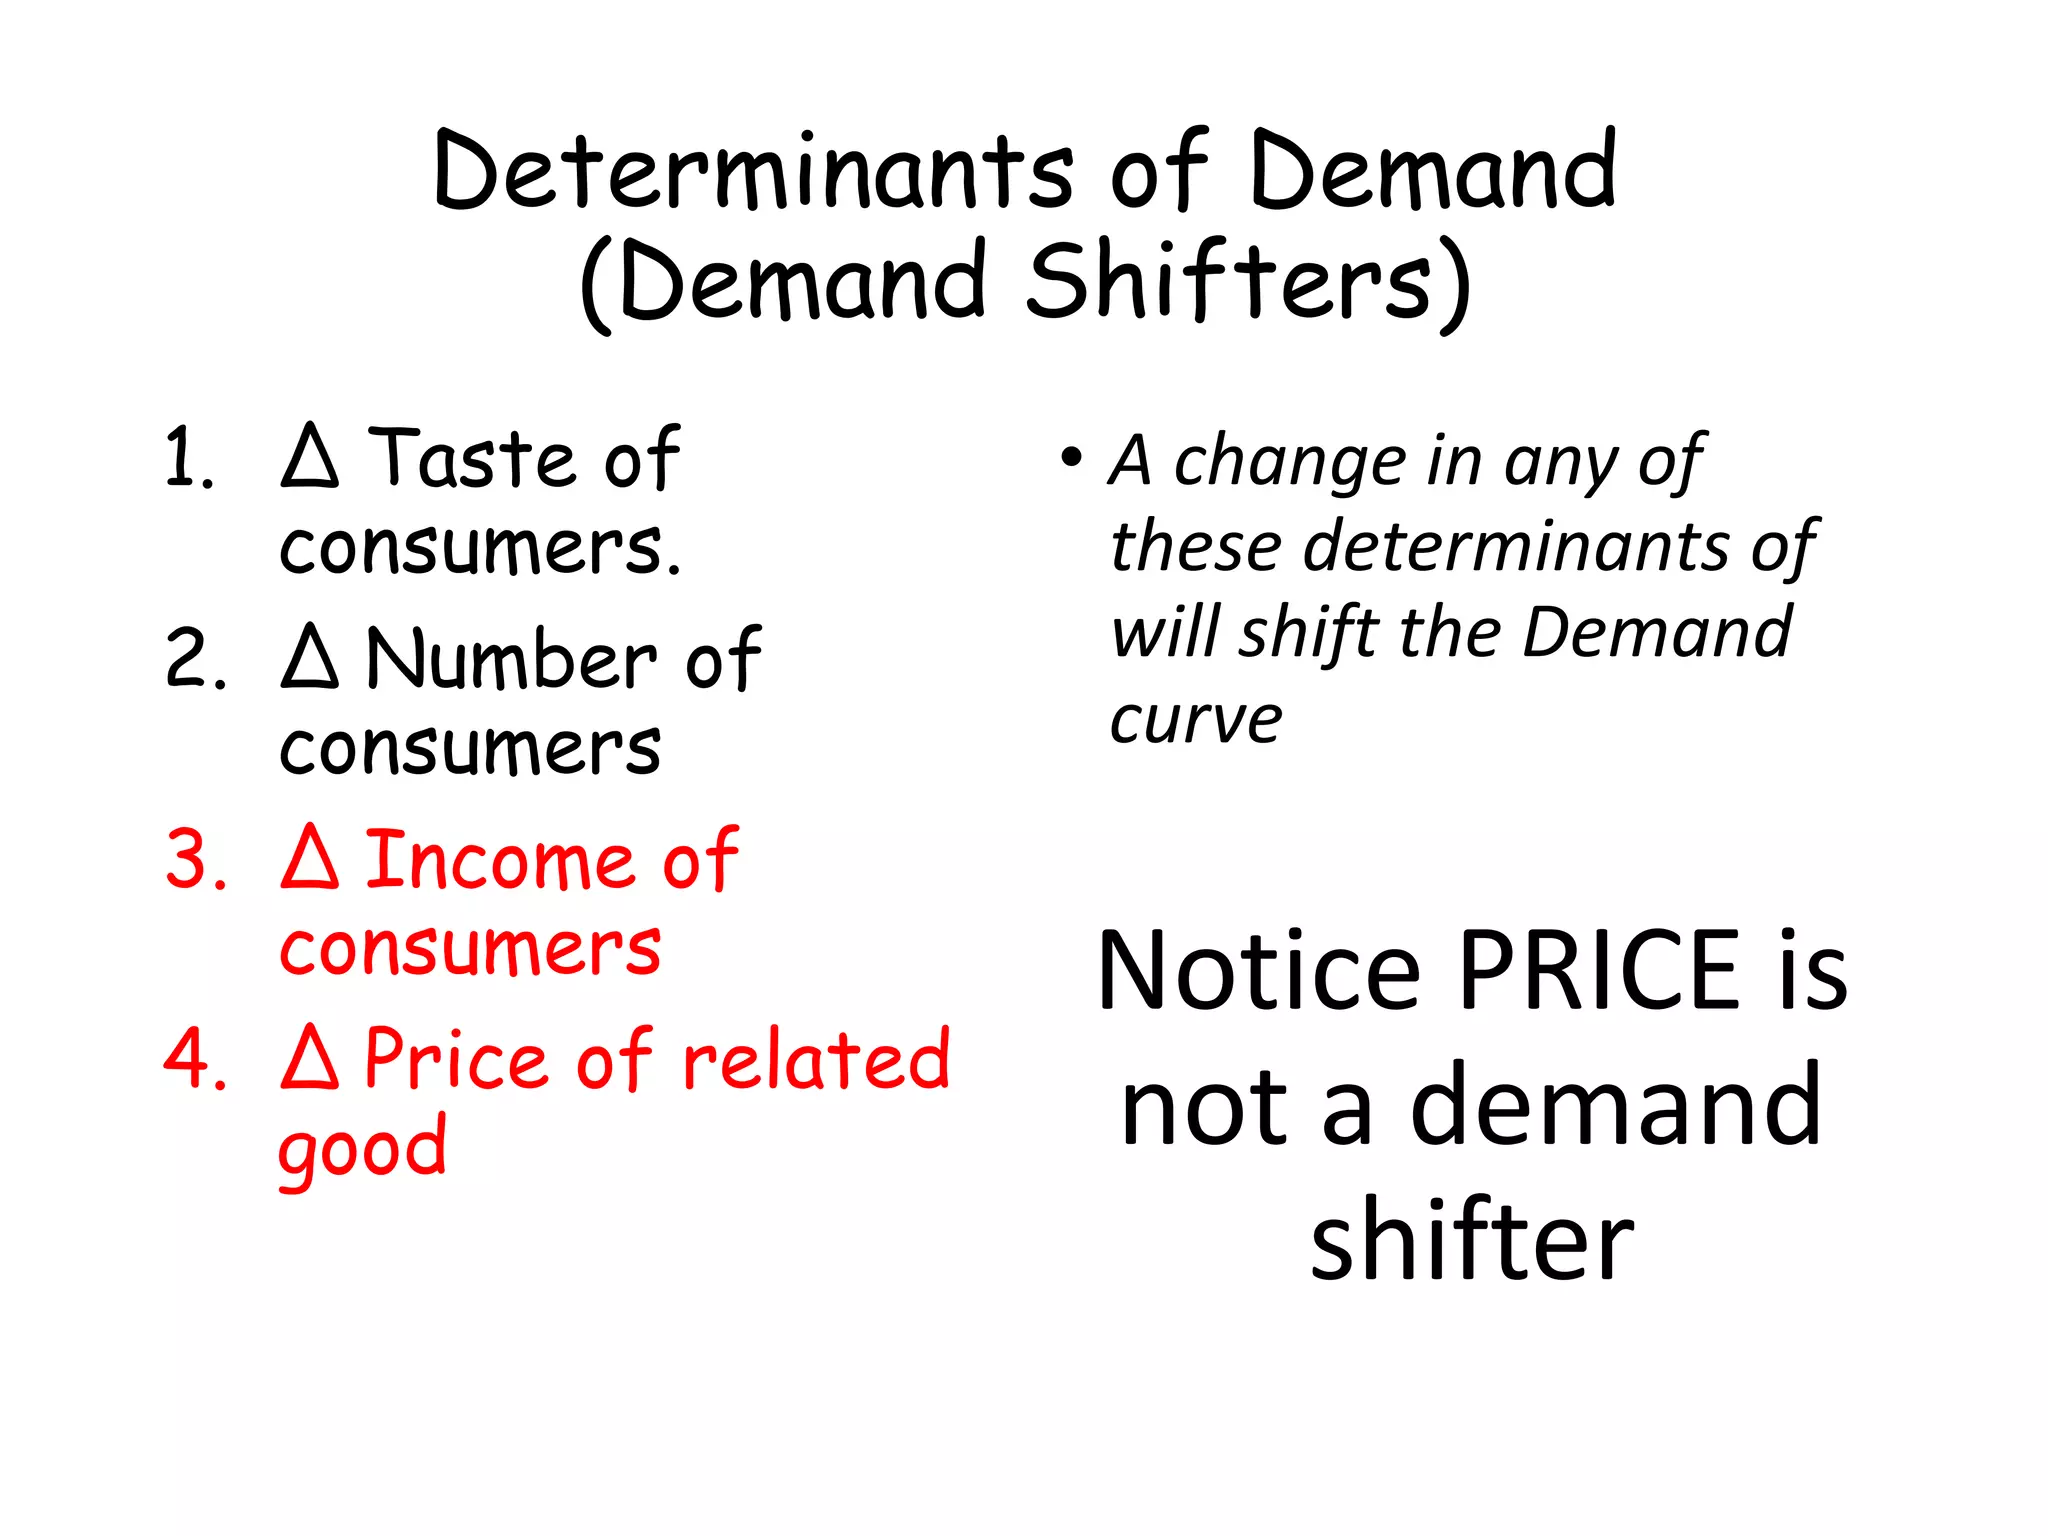
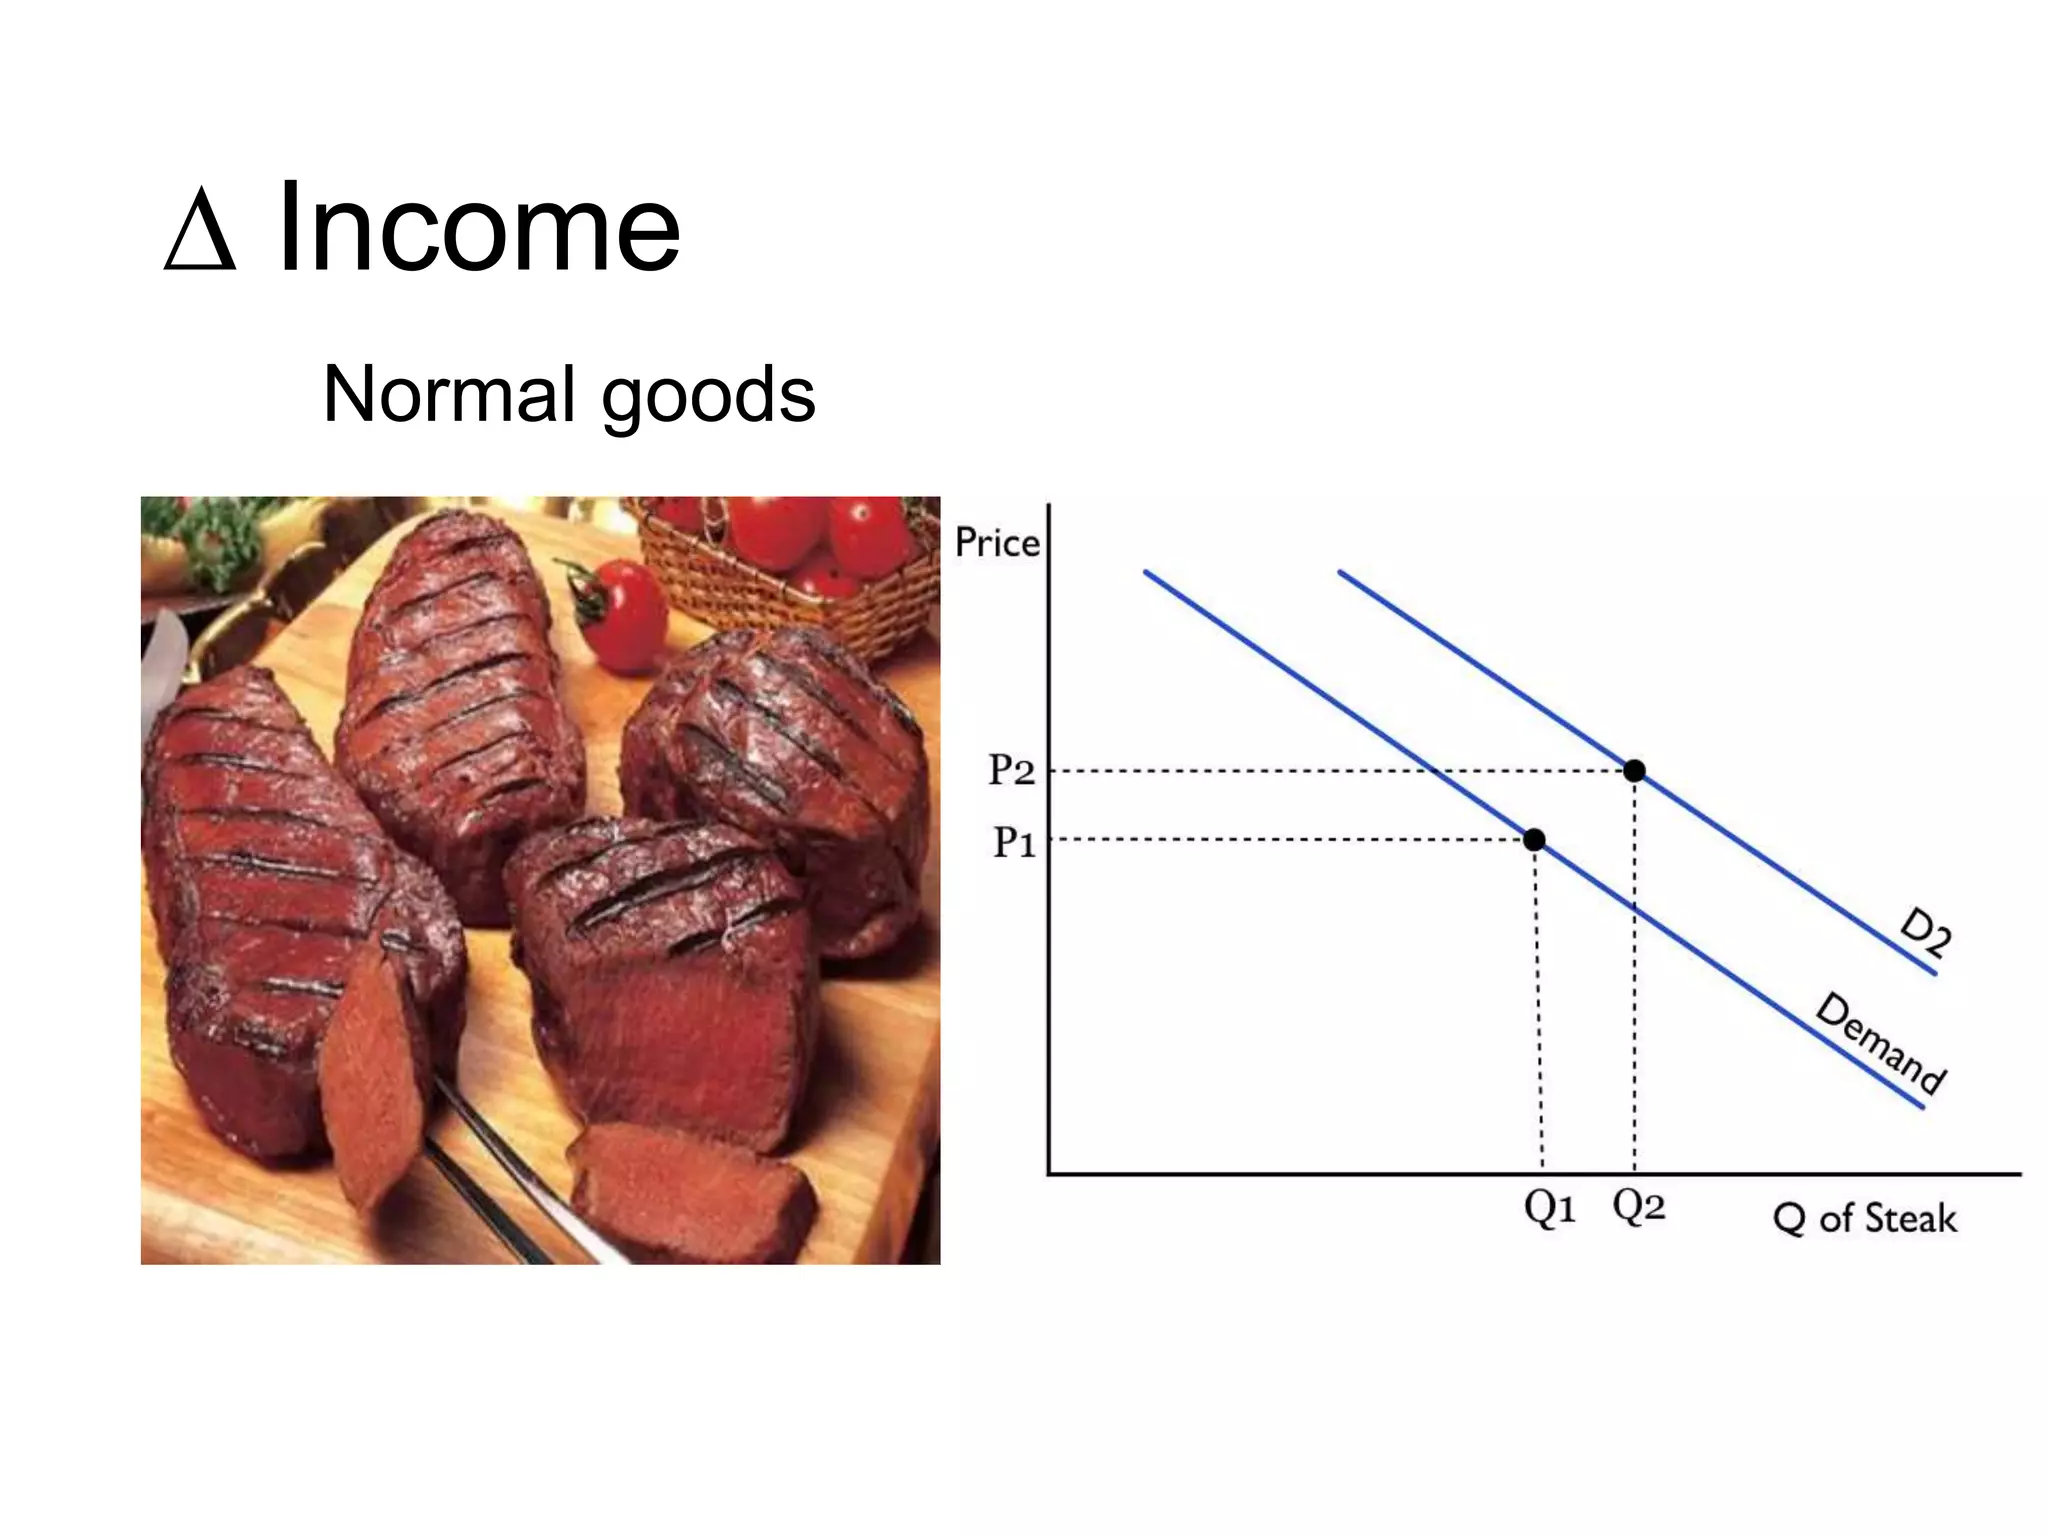
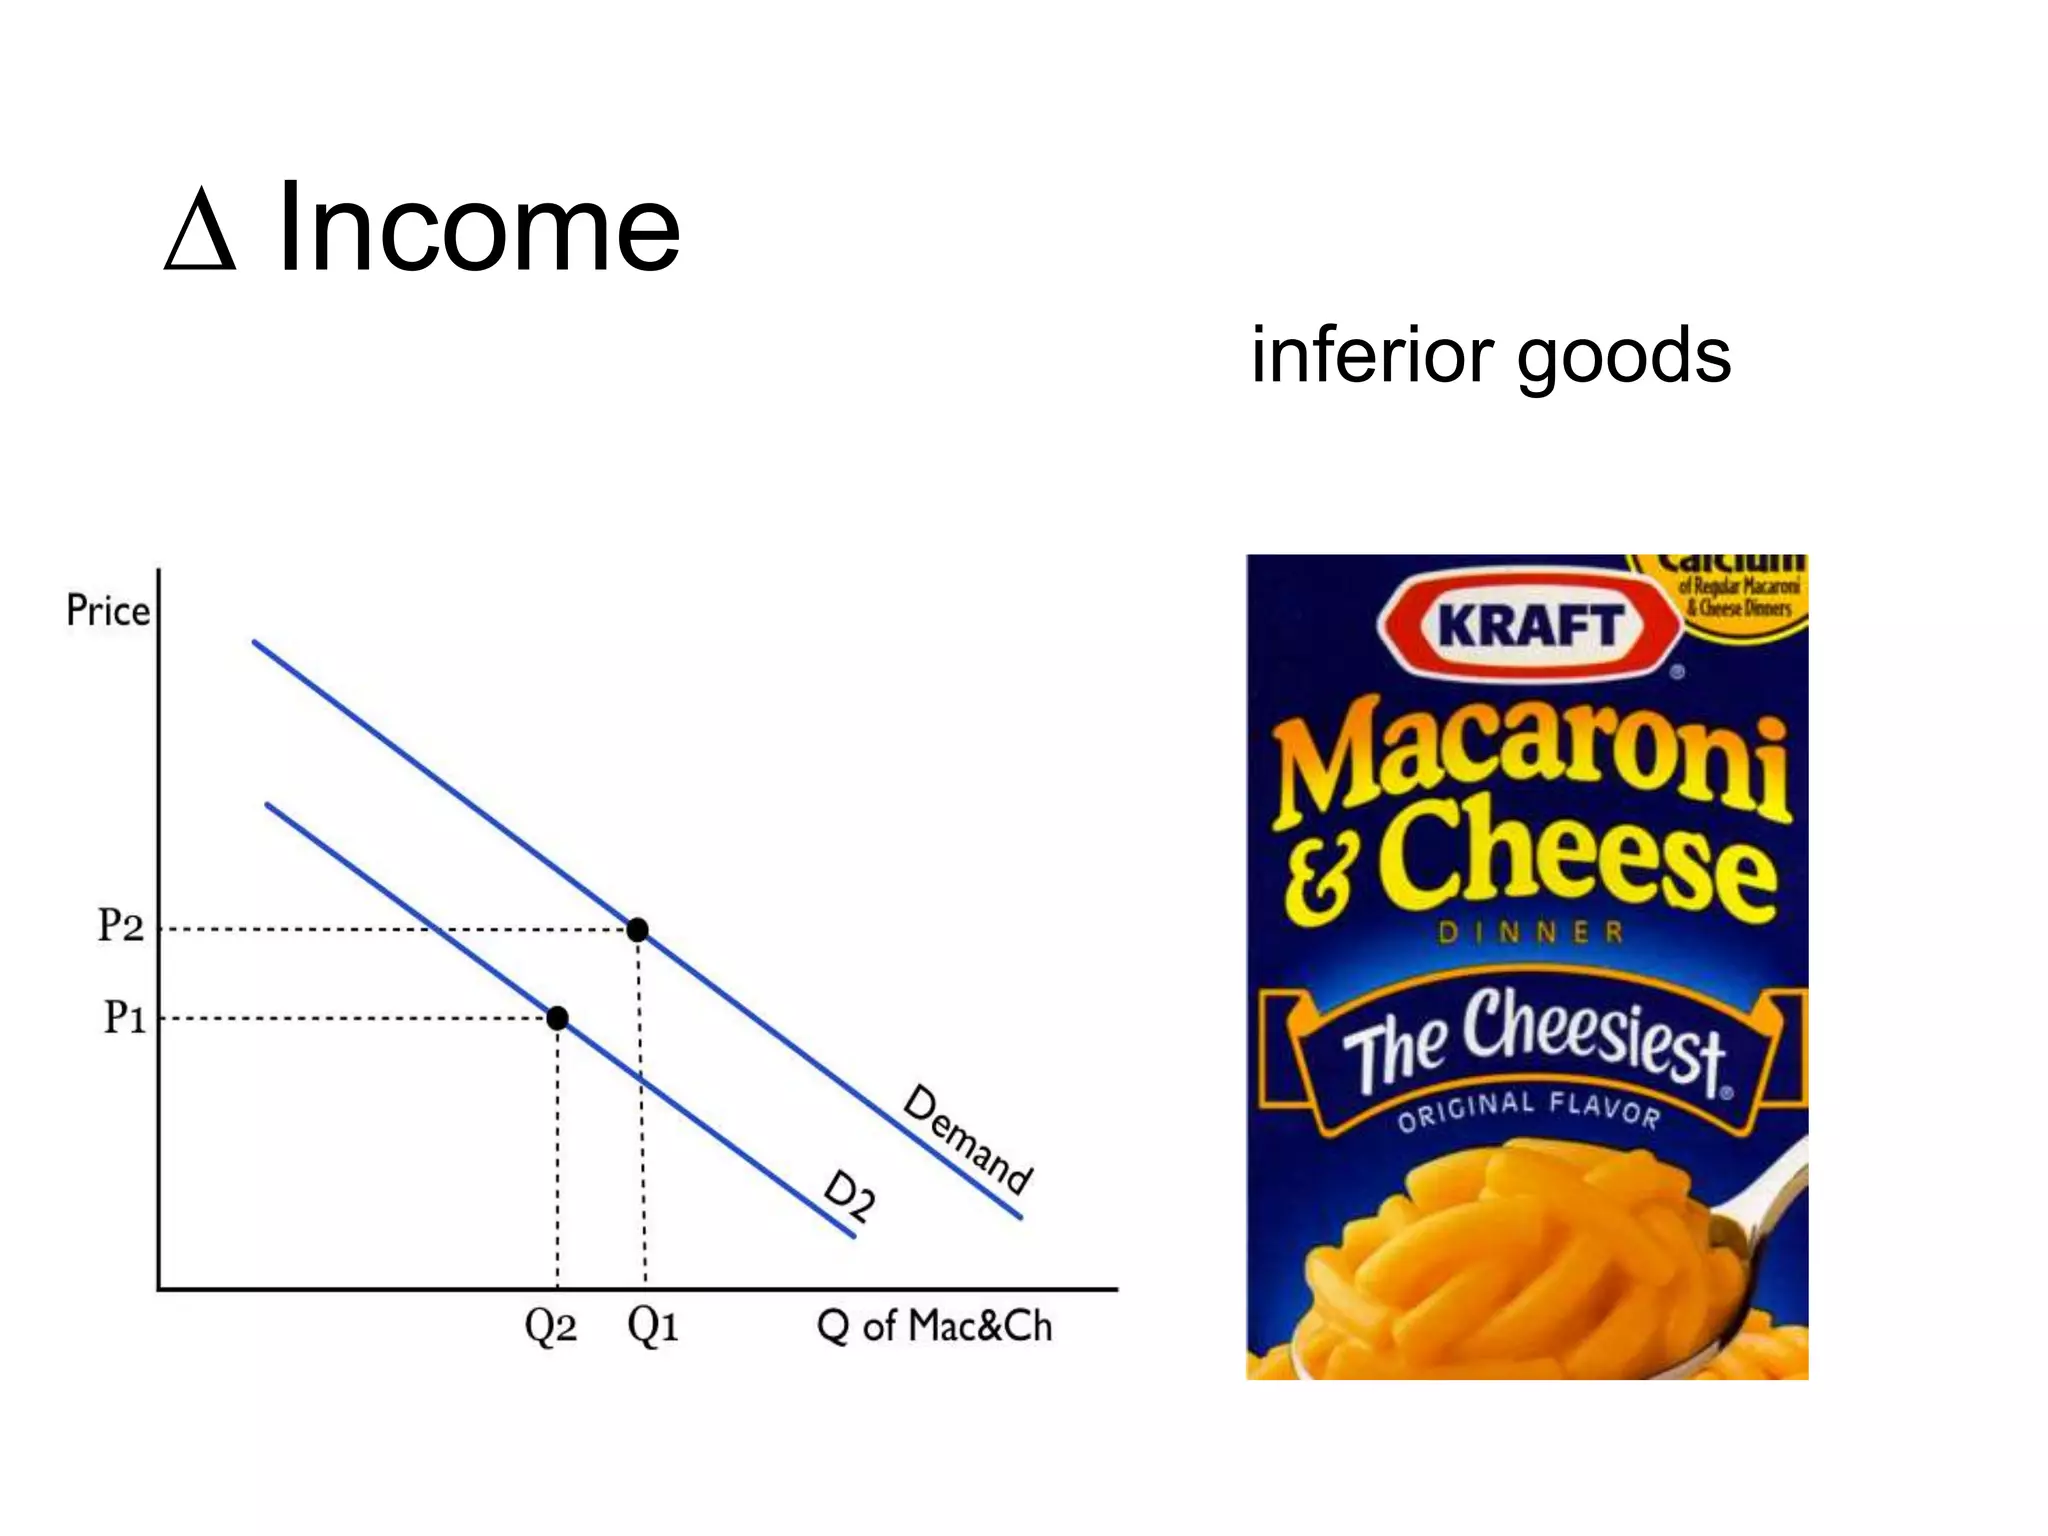
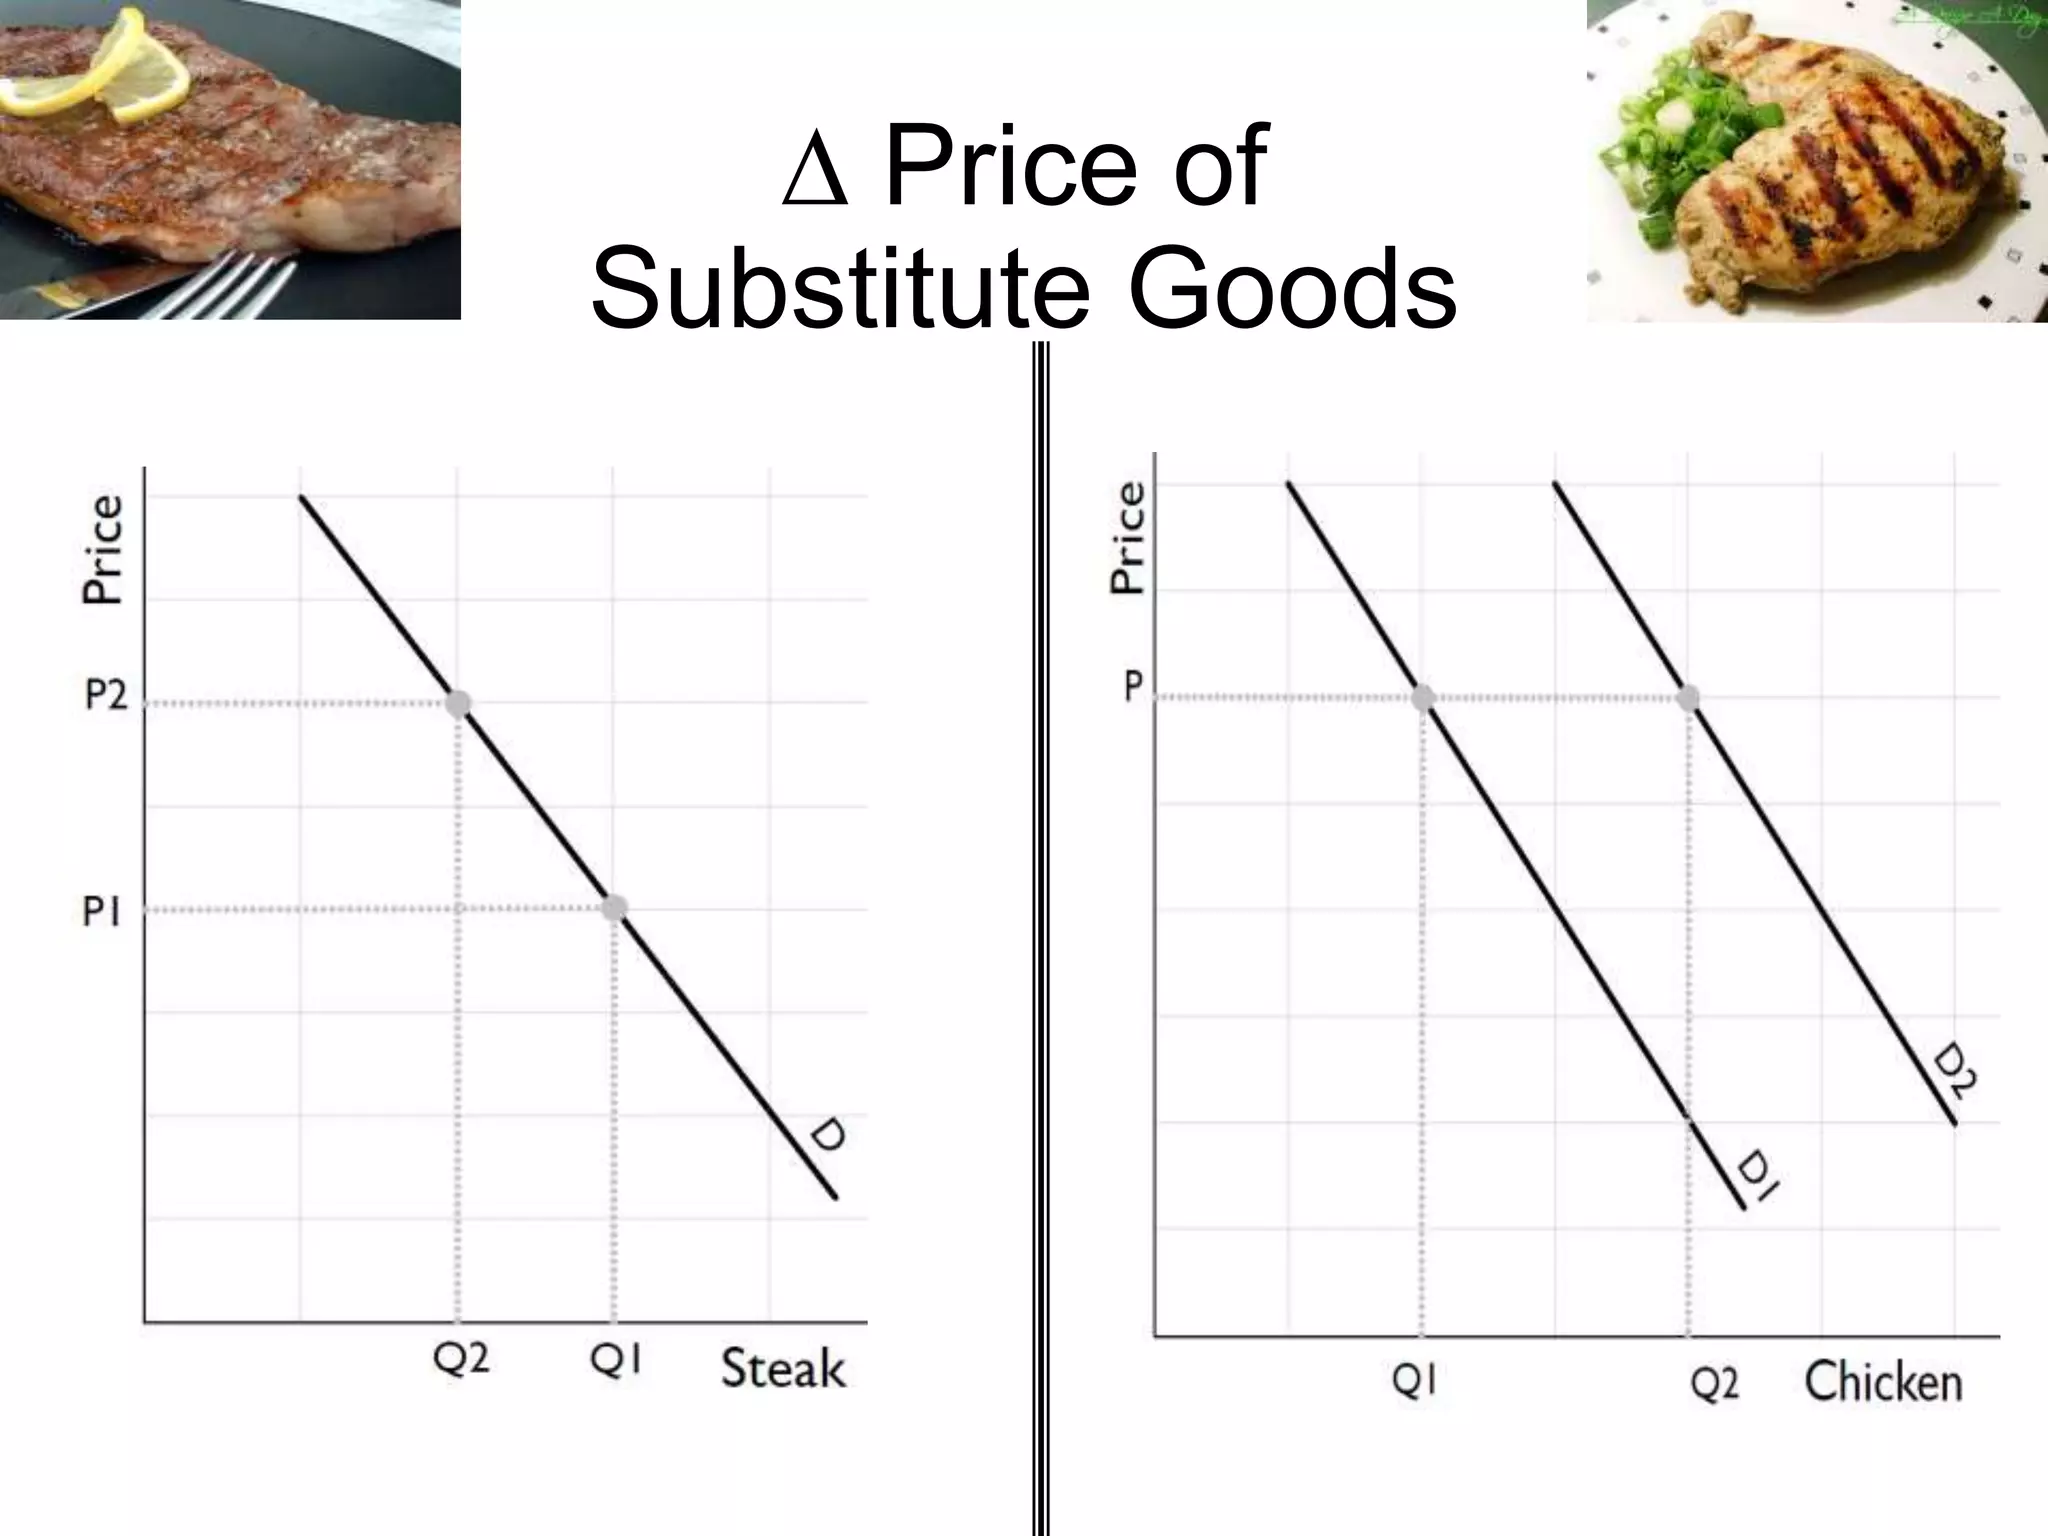
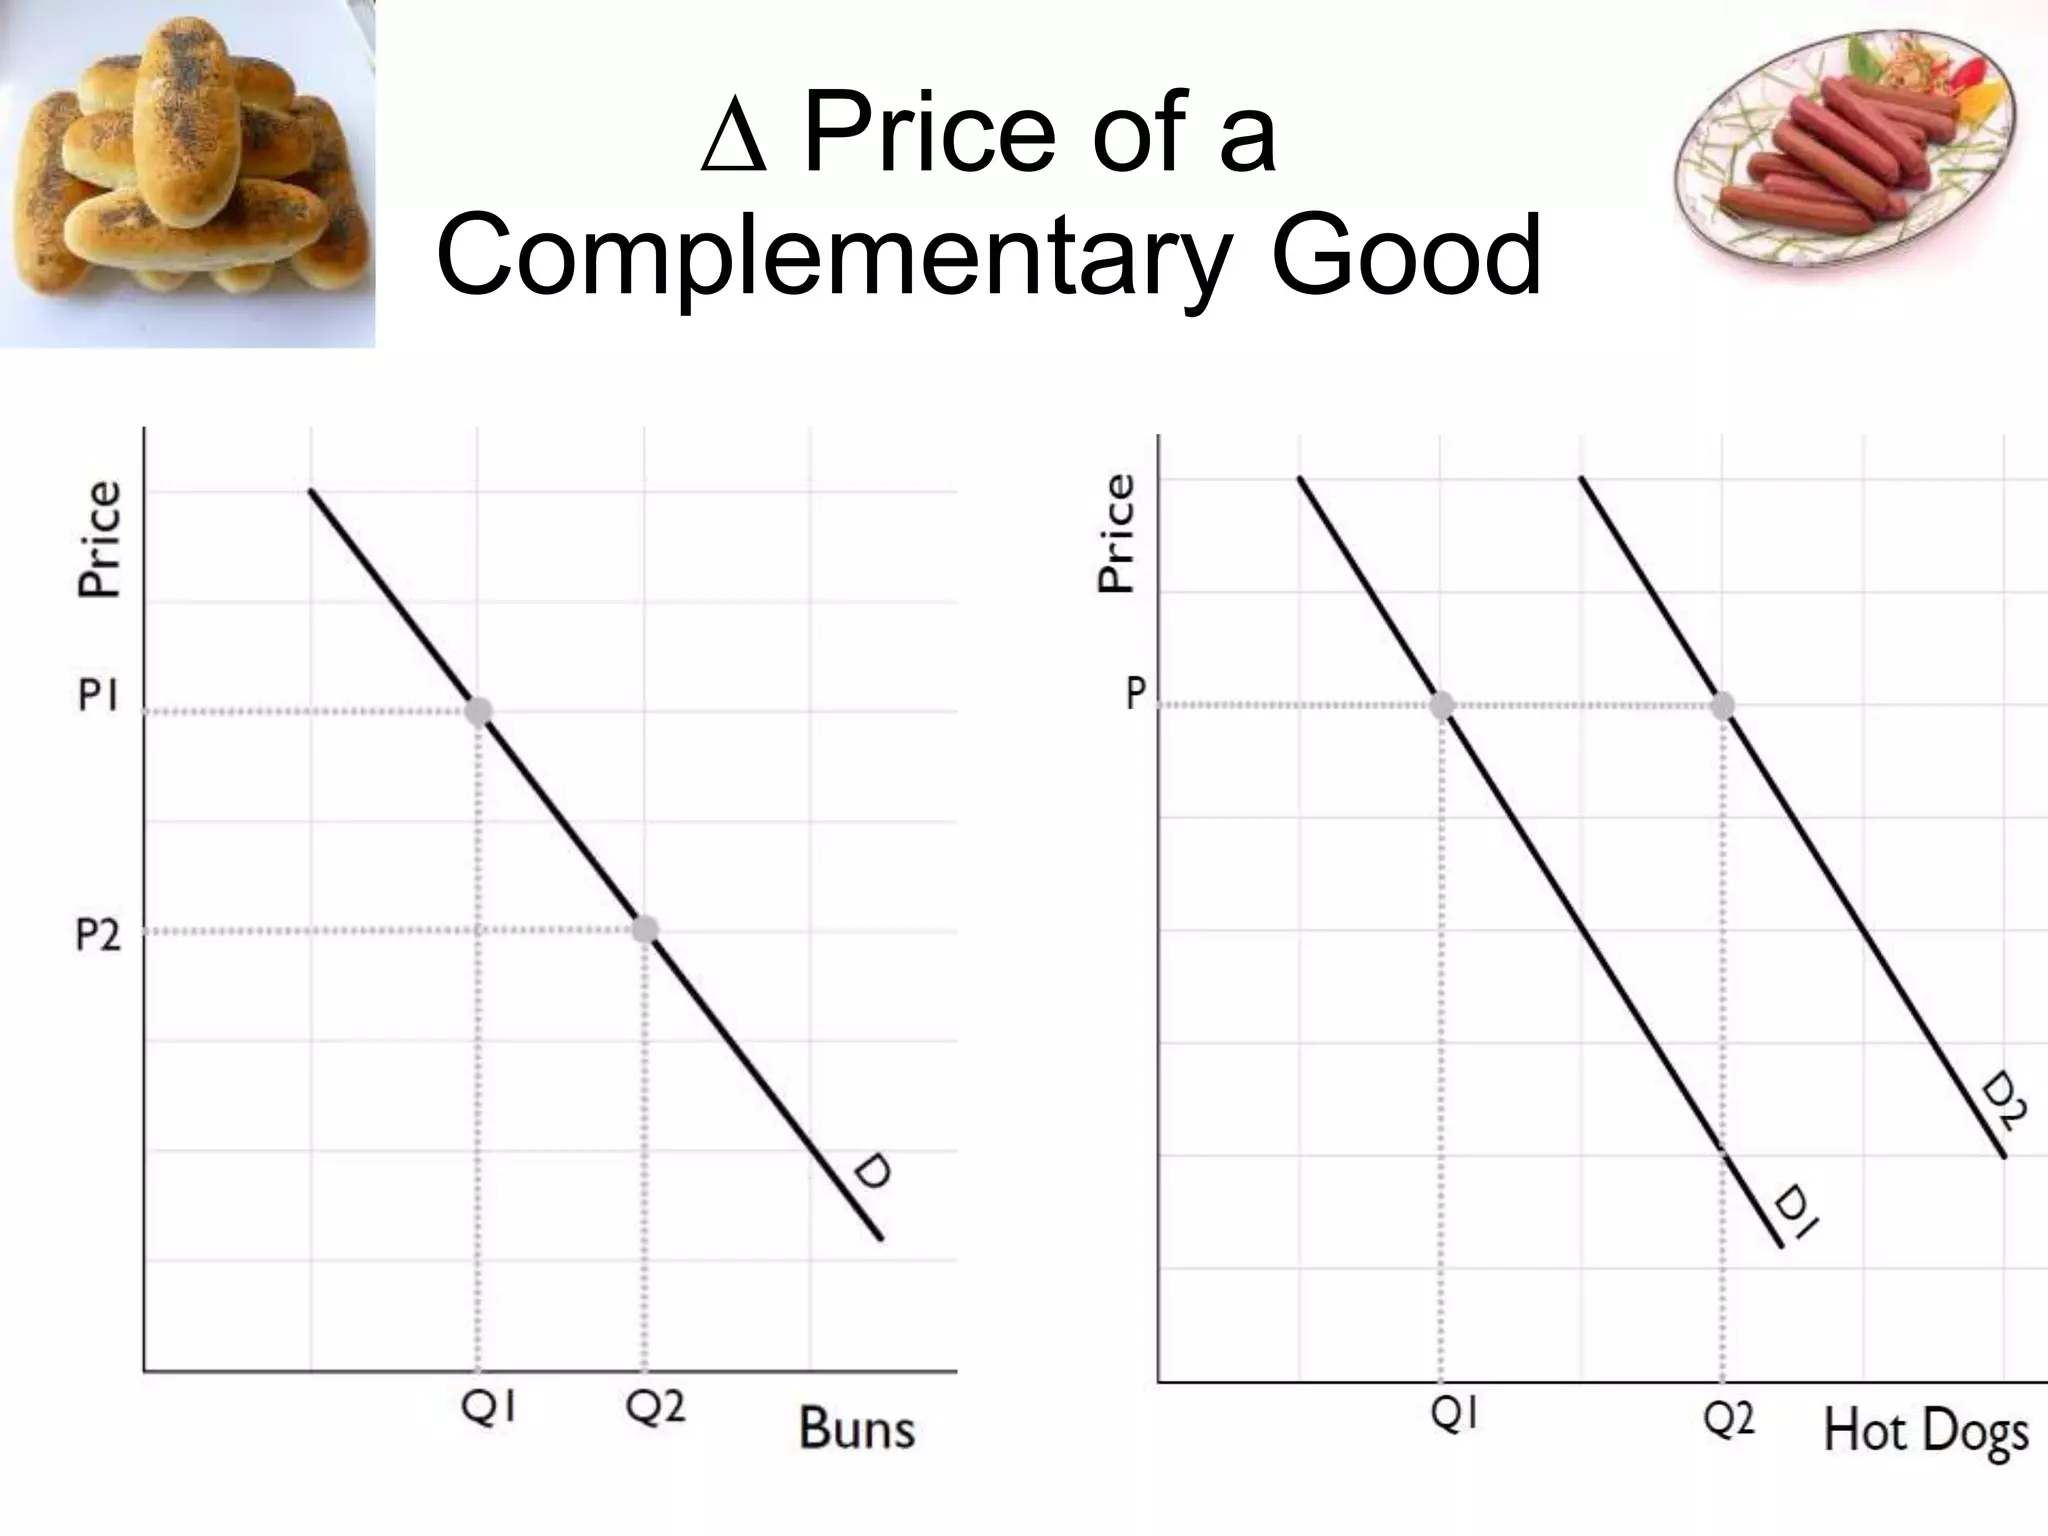
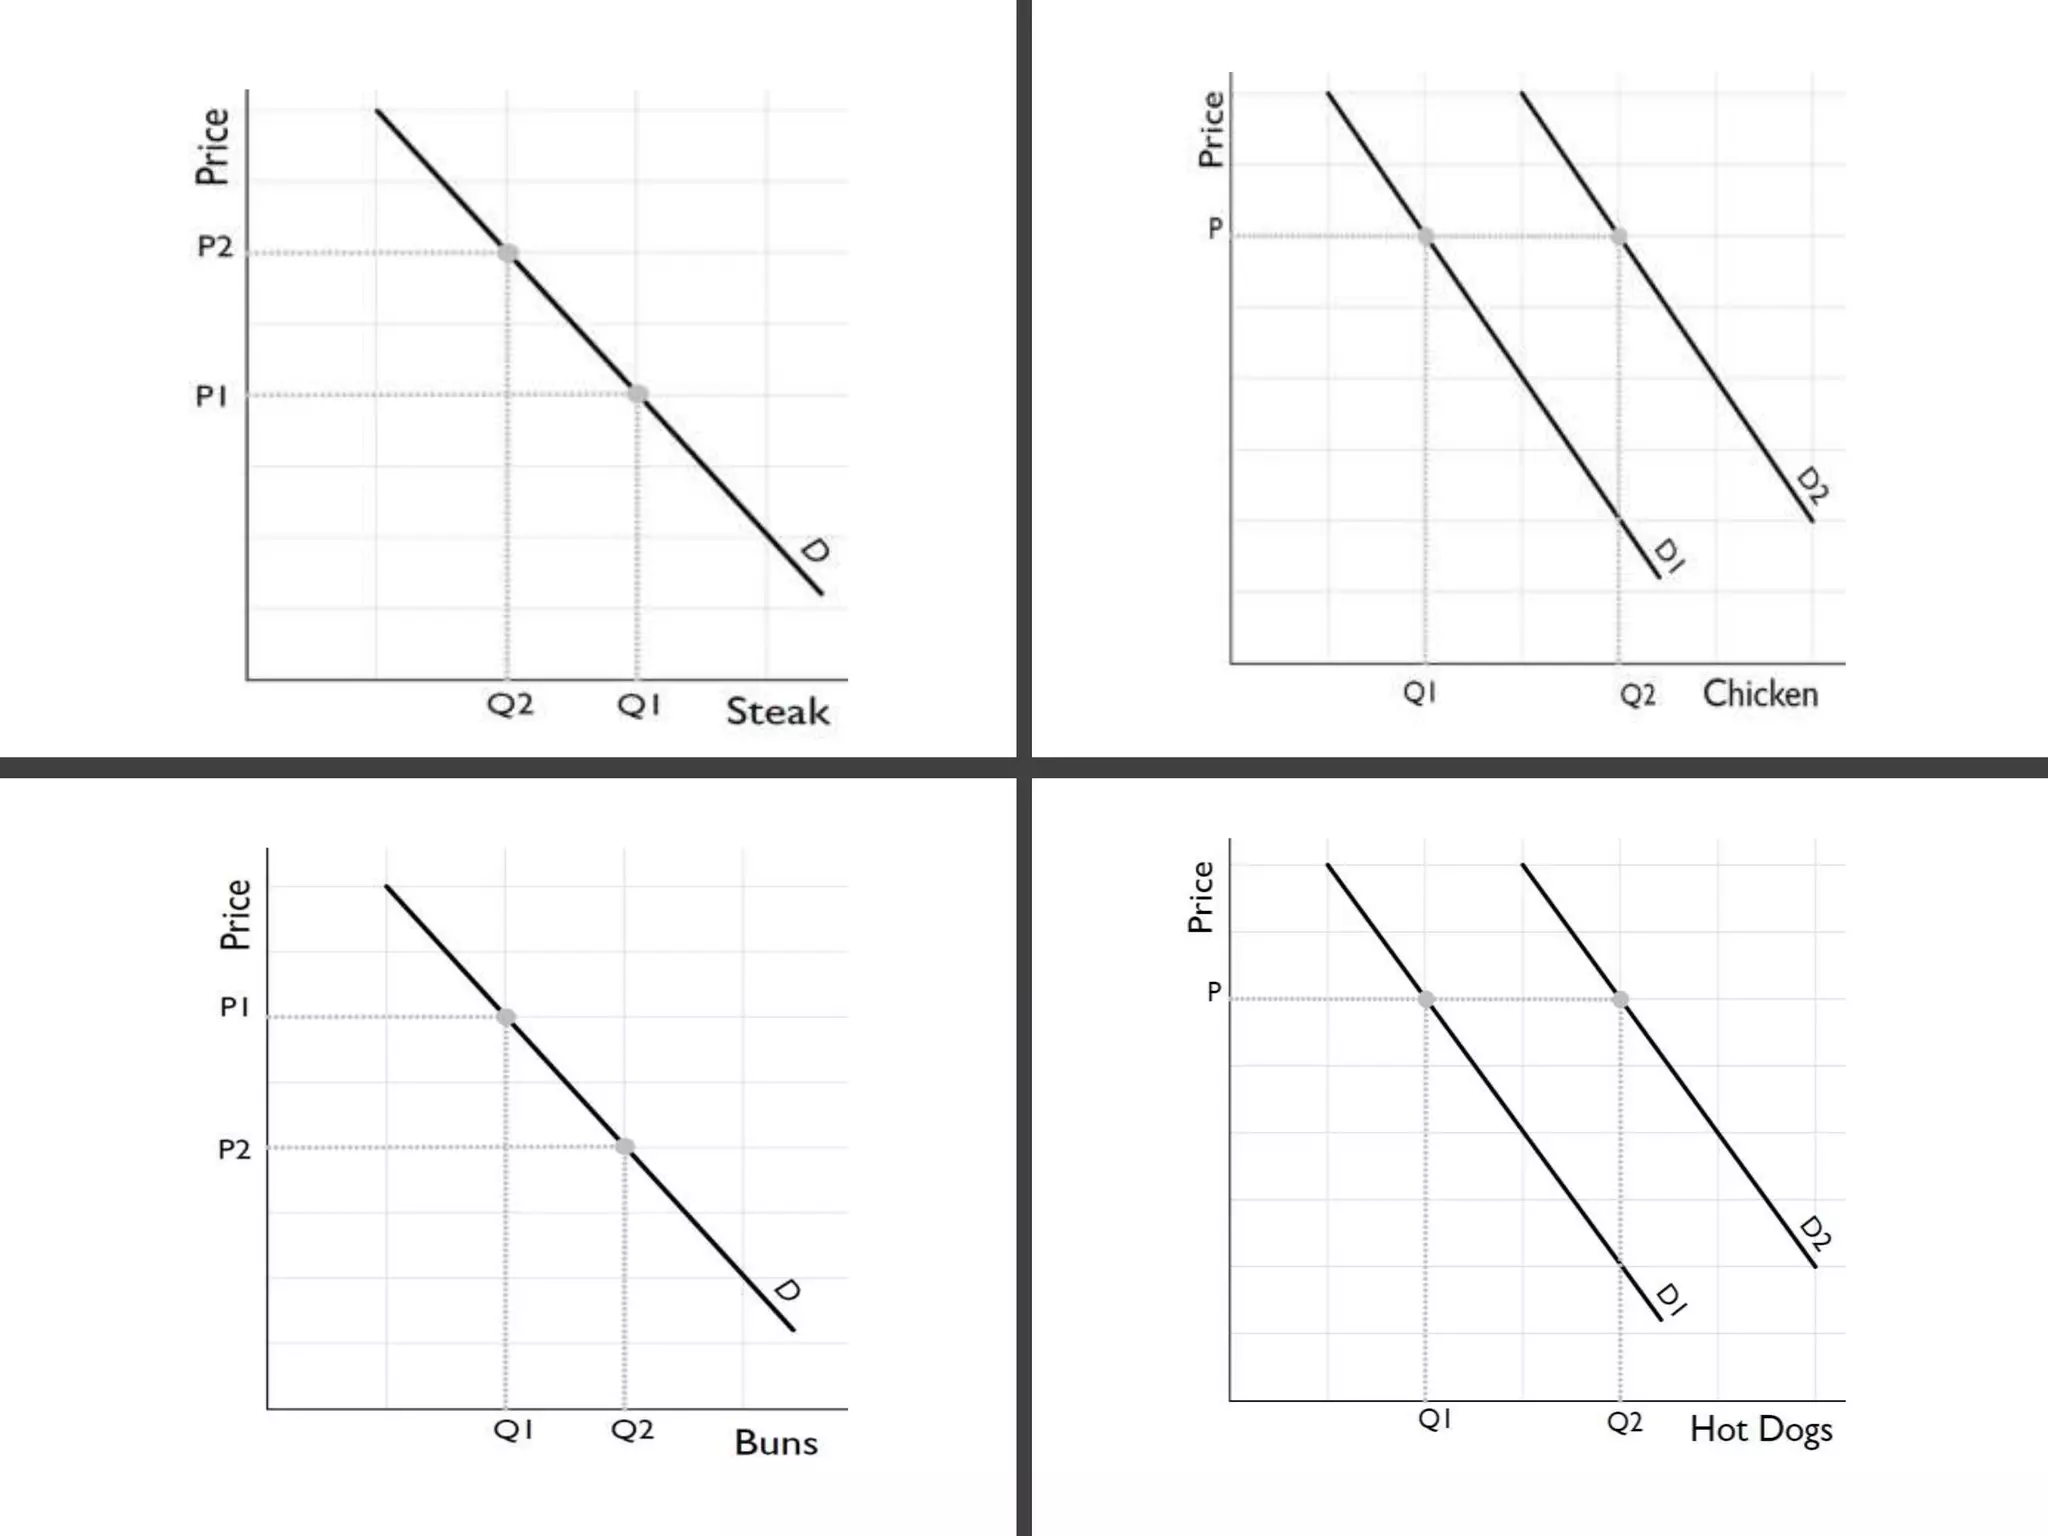
Determinants of Demand
(DemandShifters)
1. Δ Taste of
consumers.
2. Δ Number of
consumers
3. Δ Income of
consumers
4. Δ Price of related
good
• A change in any of
these determinants of
will shift the Demand
curve
Notice PRICE is
not a demand
shifter
Demand Shift Quiz(4 Questions)
• Explain whether each of the
following events represents:
• Shift of Demand curve
• Movement along Demand curve
31.
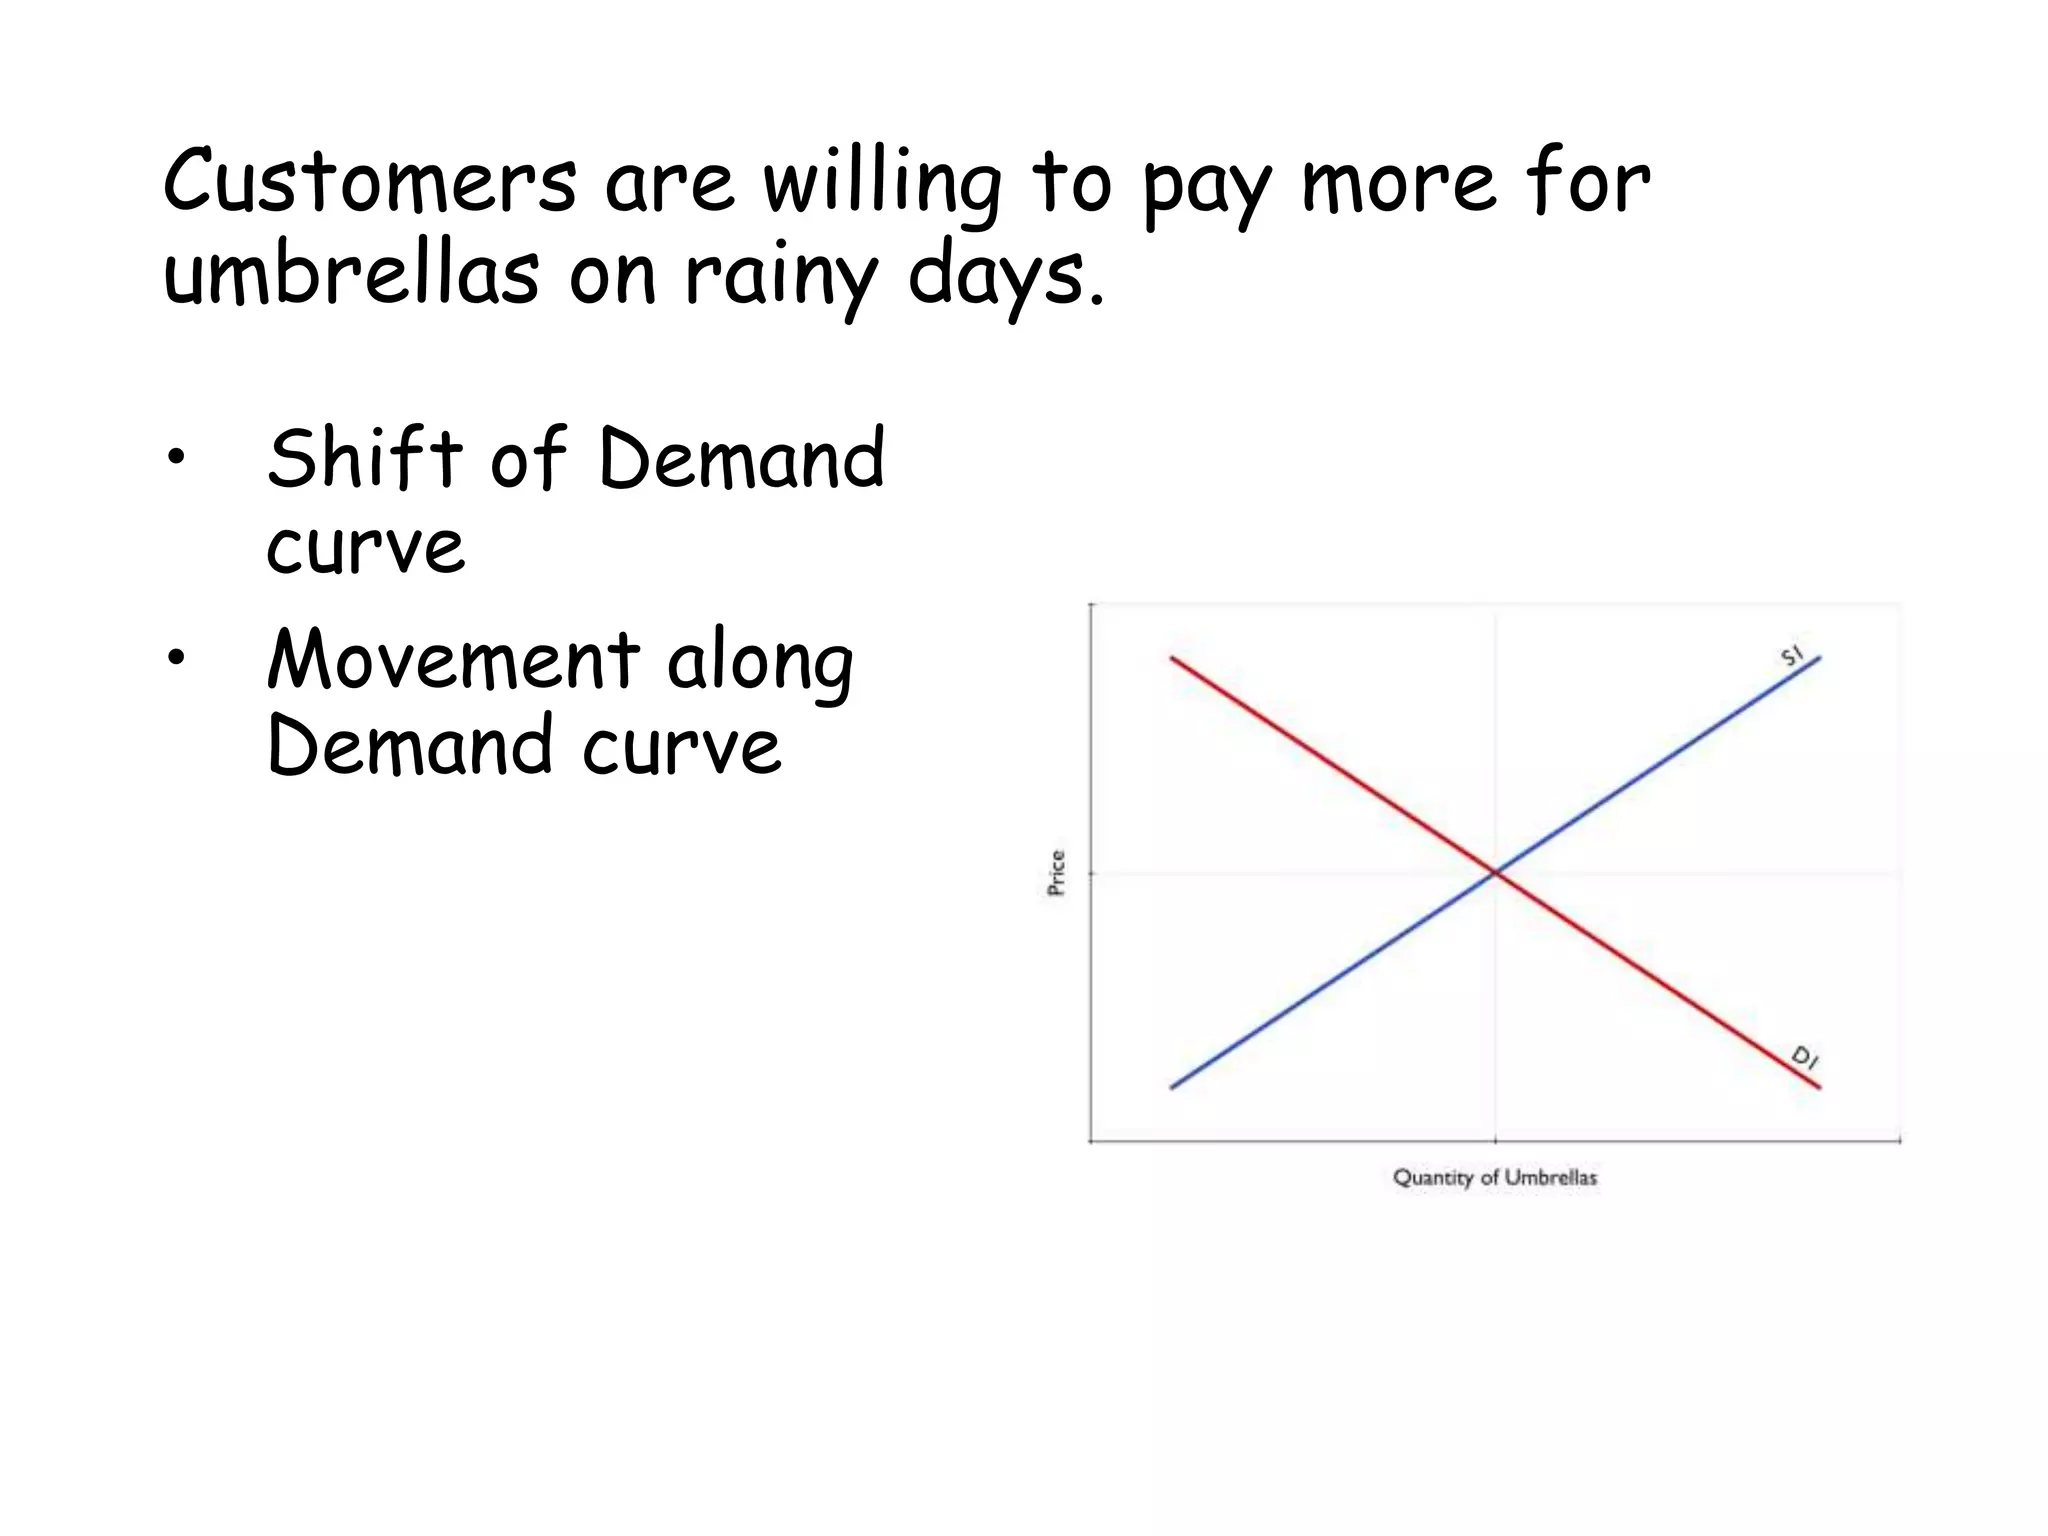
Customers are willingto pay more for
umbrellas on rainy days.
• Shift of Demand
curve
• Movement along
Demand curve
32.
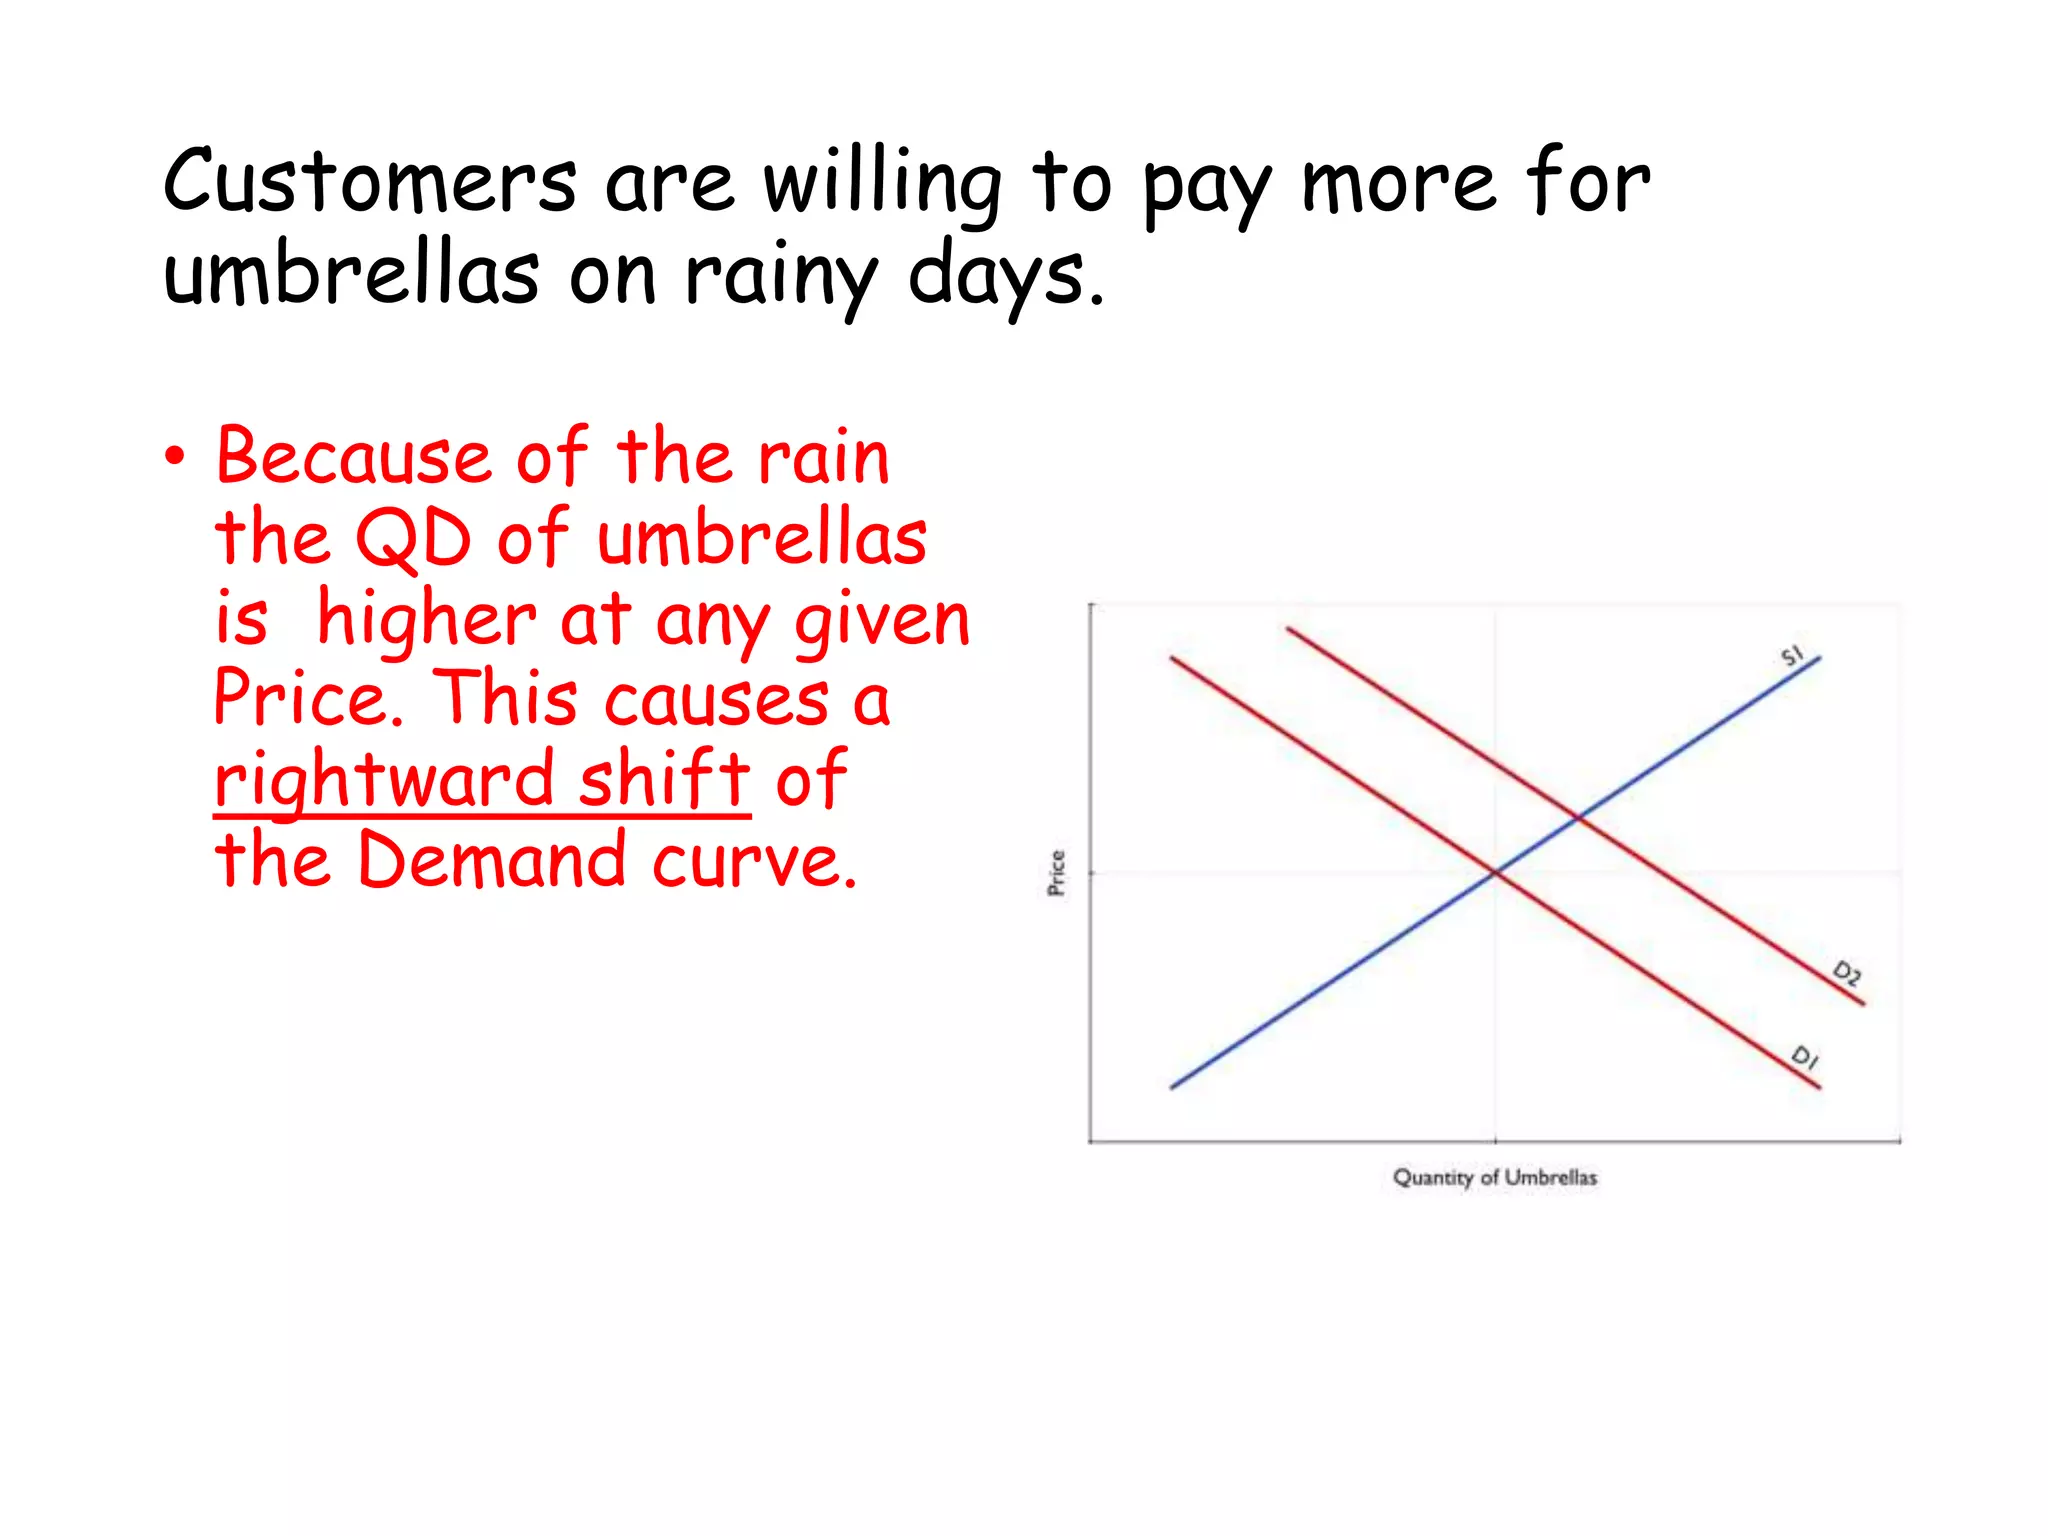
Customers are willingto pay more for
umbrellas on rainy days.
• Because of the rain
the QD of umbrellas
is higher at any given
Price. This causes a
rightward shift of
the Demand curve.
33.
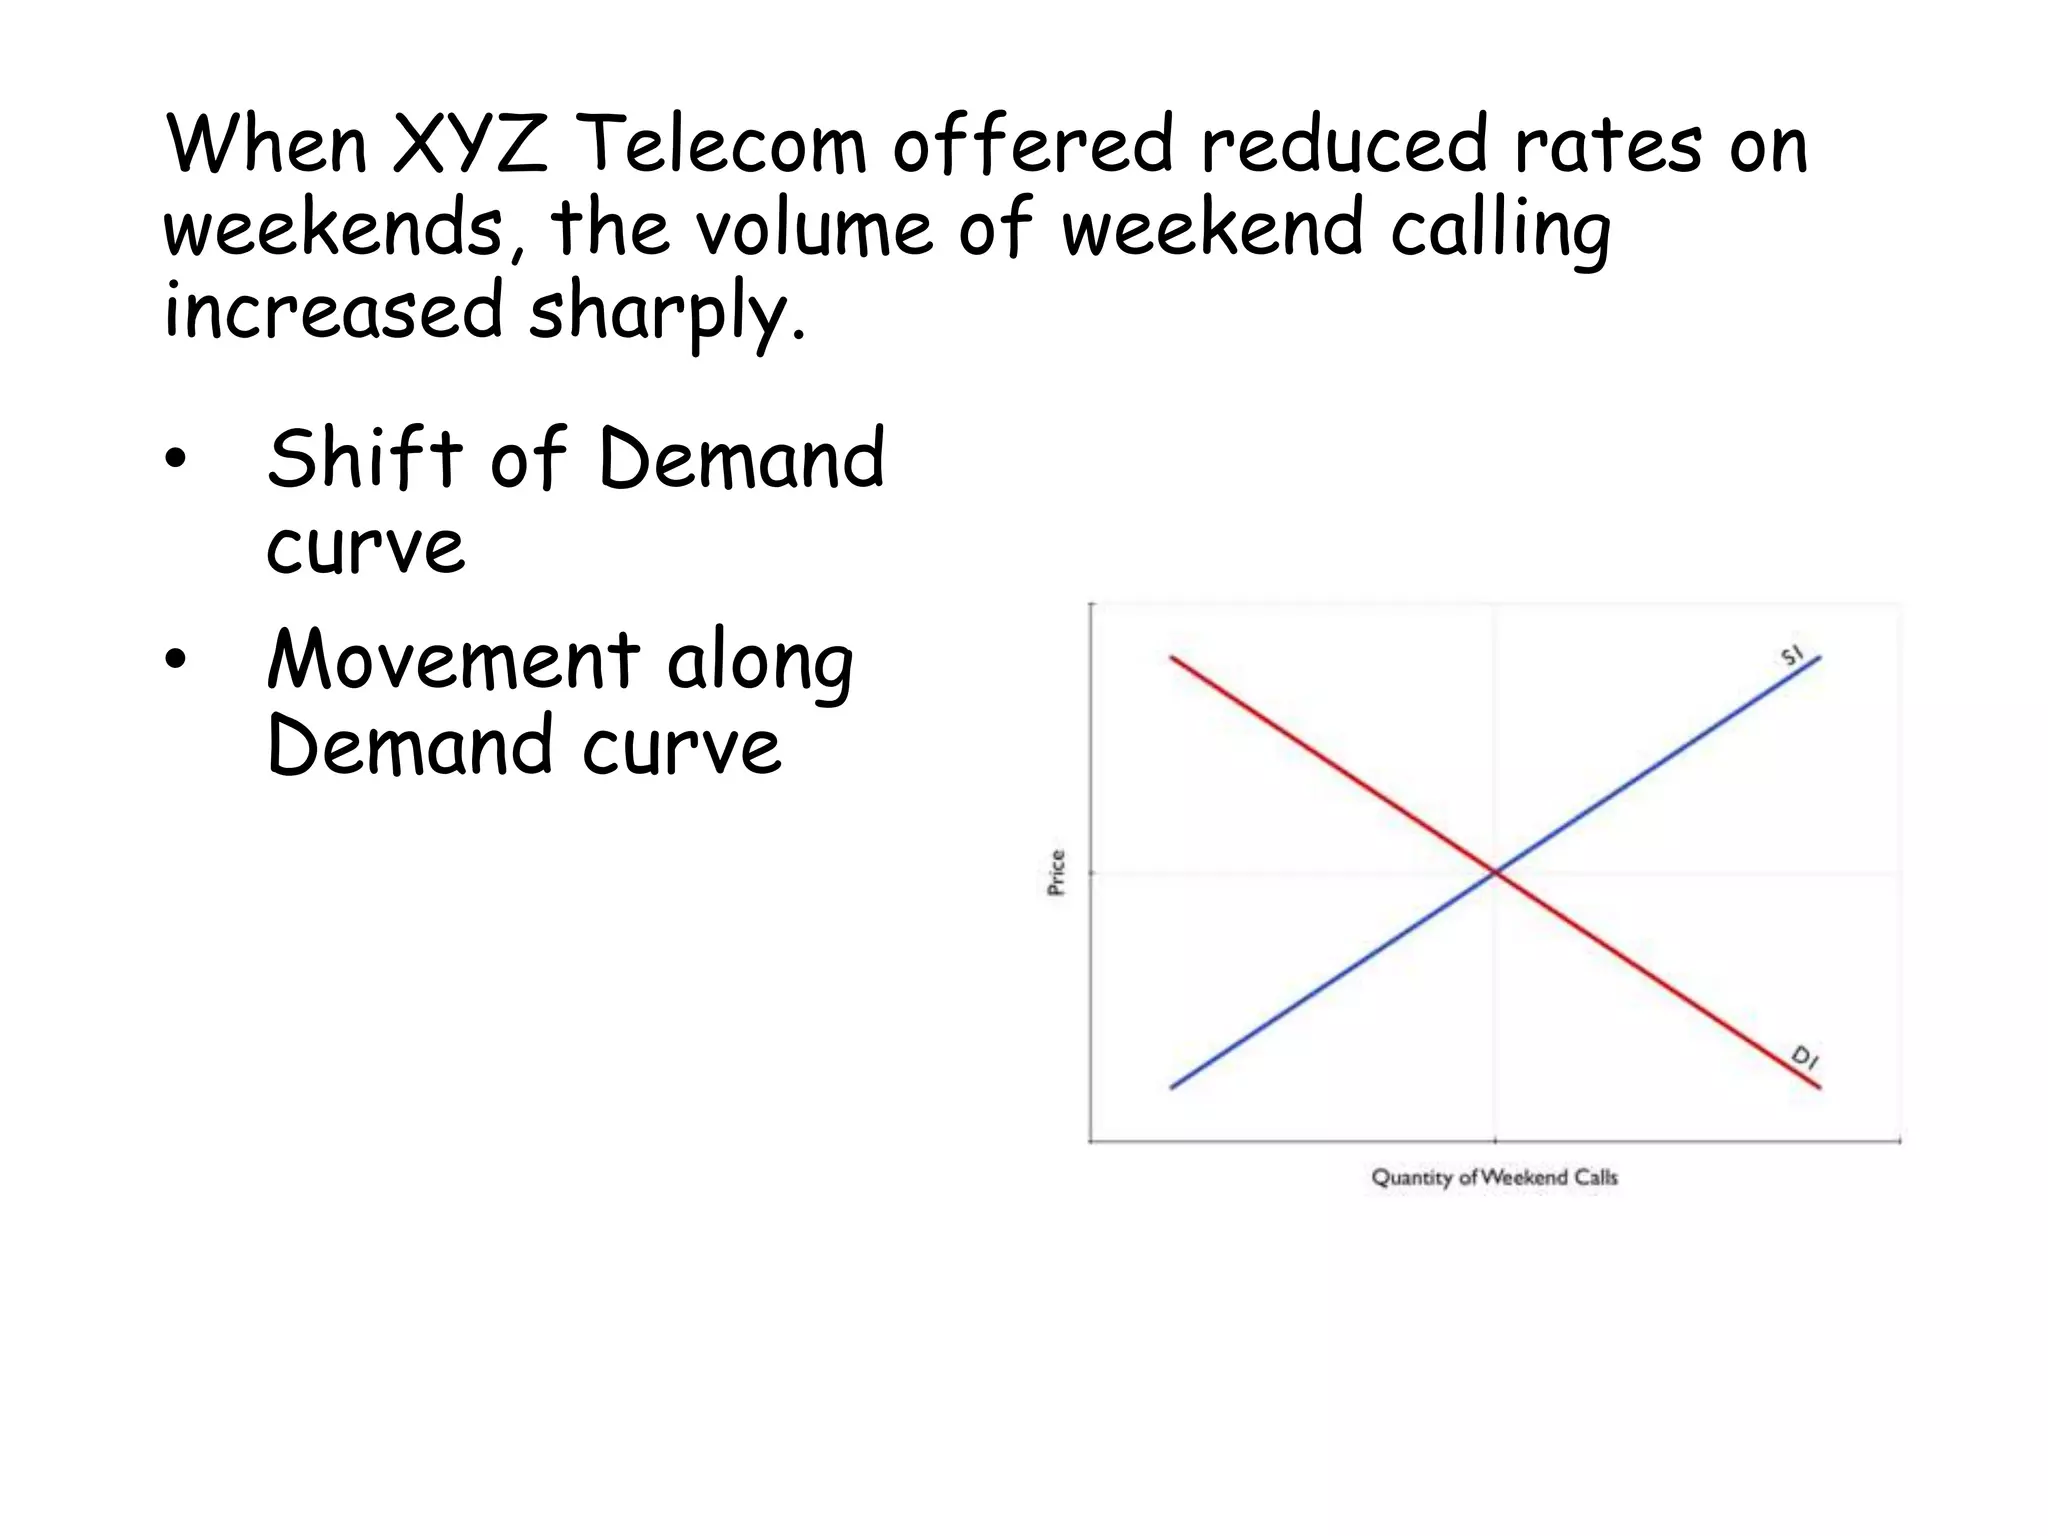
When XYZ Telecomoffered reduced rates on
weekends, the volume of weekend calling
increased sharply.
• Shift of Demand
curve
• Movement along
Demand curve
34.
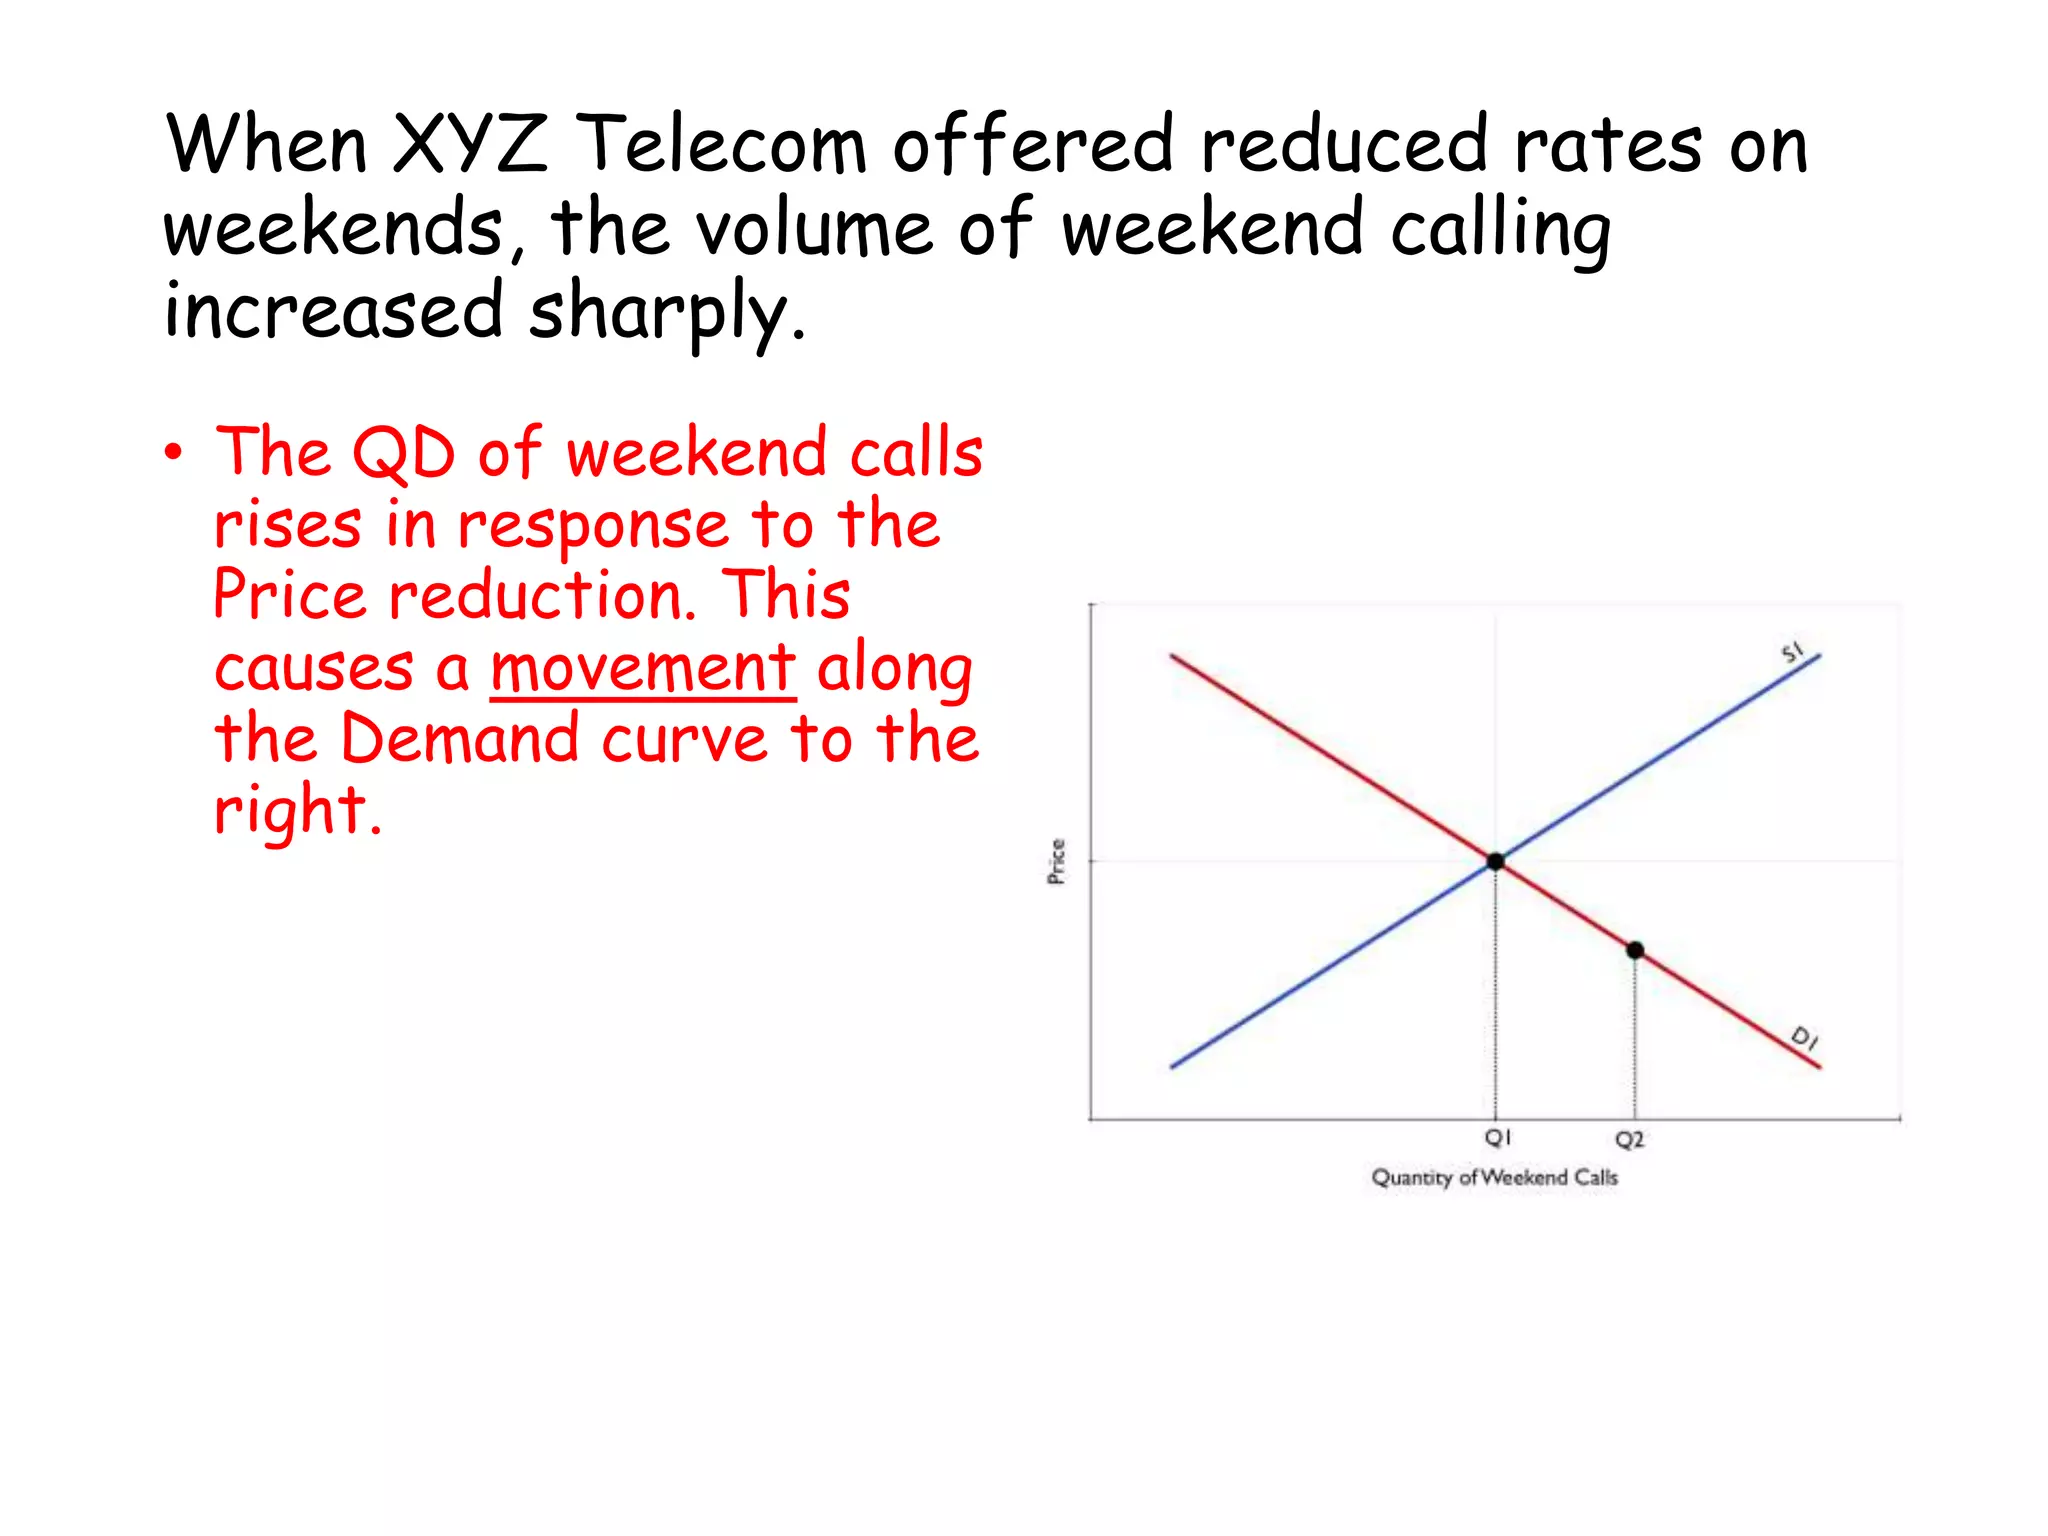
When XYZ Telecomoffered reduced rates on
weekends, the volume of weekend calling
increased sharply.
• The QD of weekend calls
rises in response to the
Price reduction. This
causes a movement along
the Demand curve to the
right.
35.
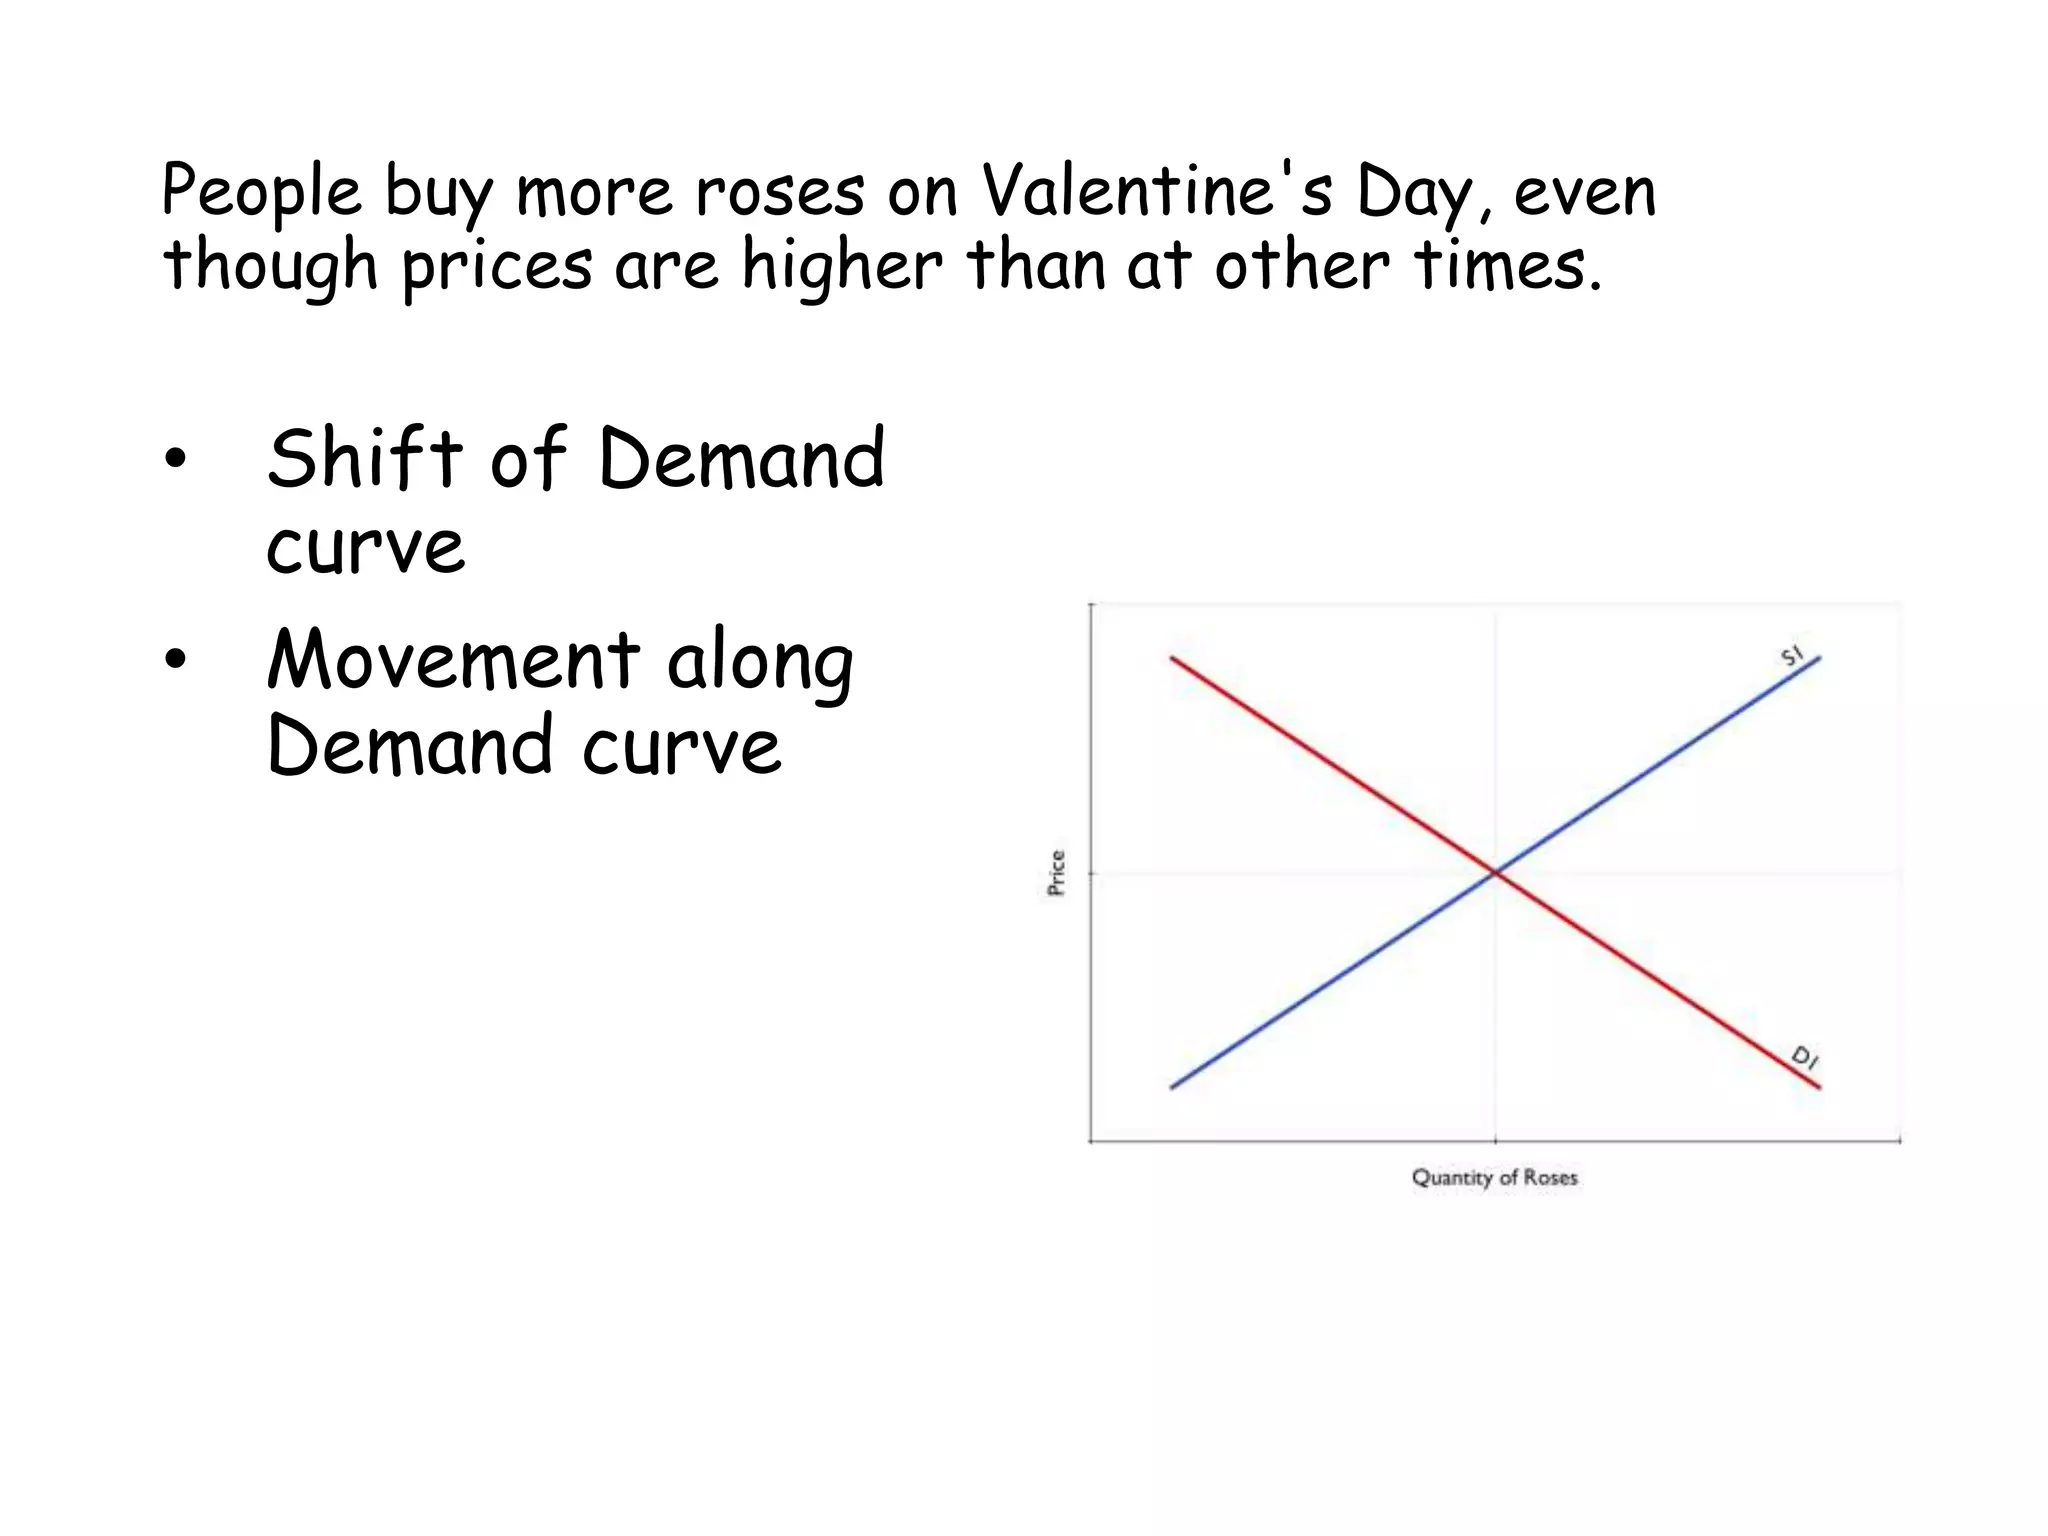
People buy moreroses on Valentine's Day, even
though prices are higher than at other times.
• Shift of Demand
curve
• Movement along
Demand curve
36.
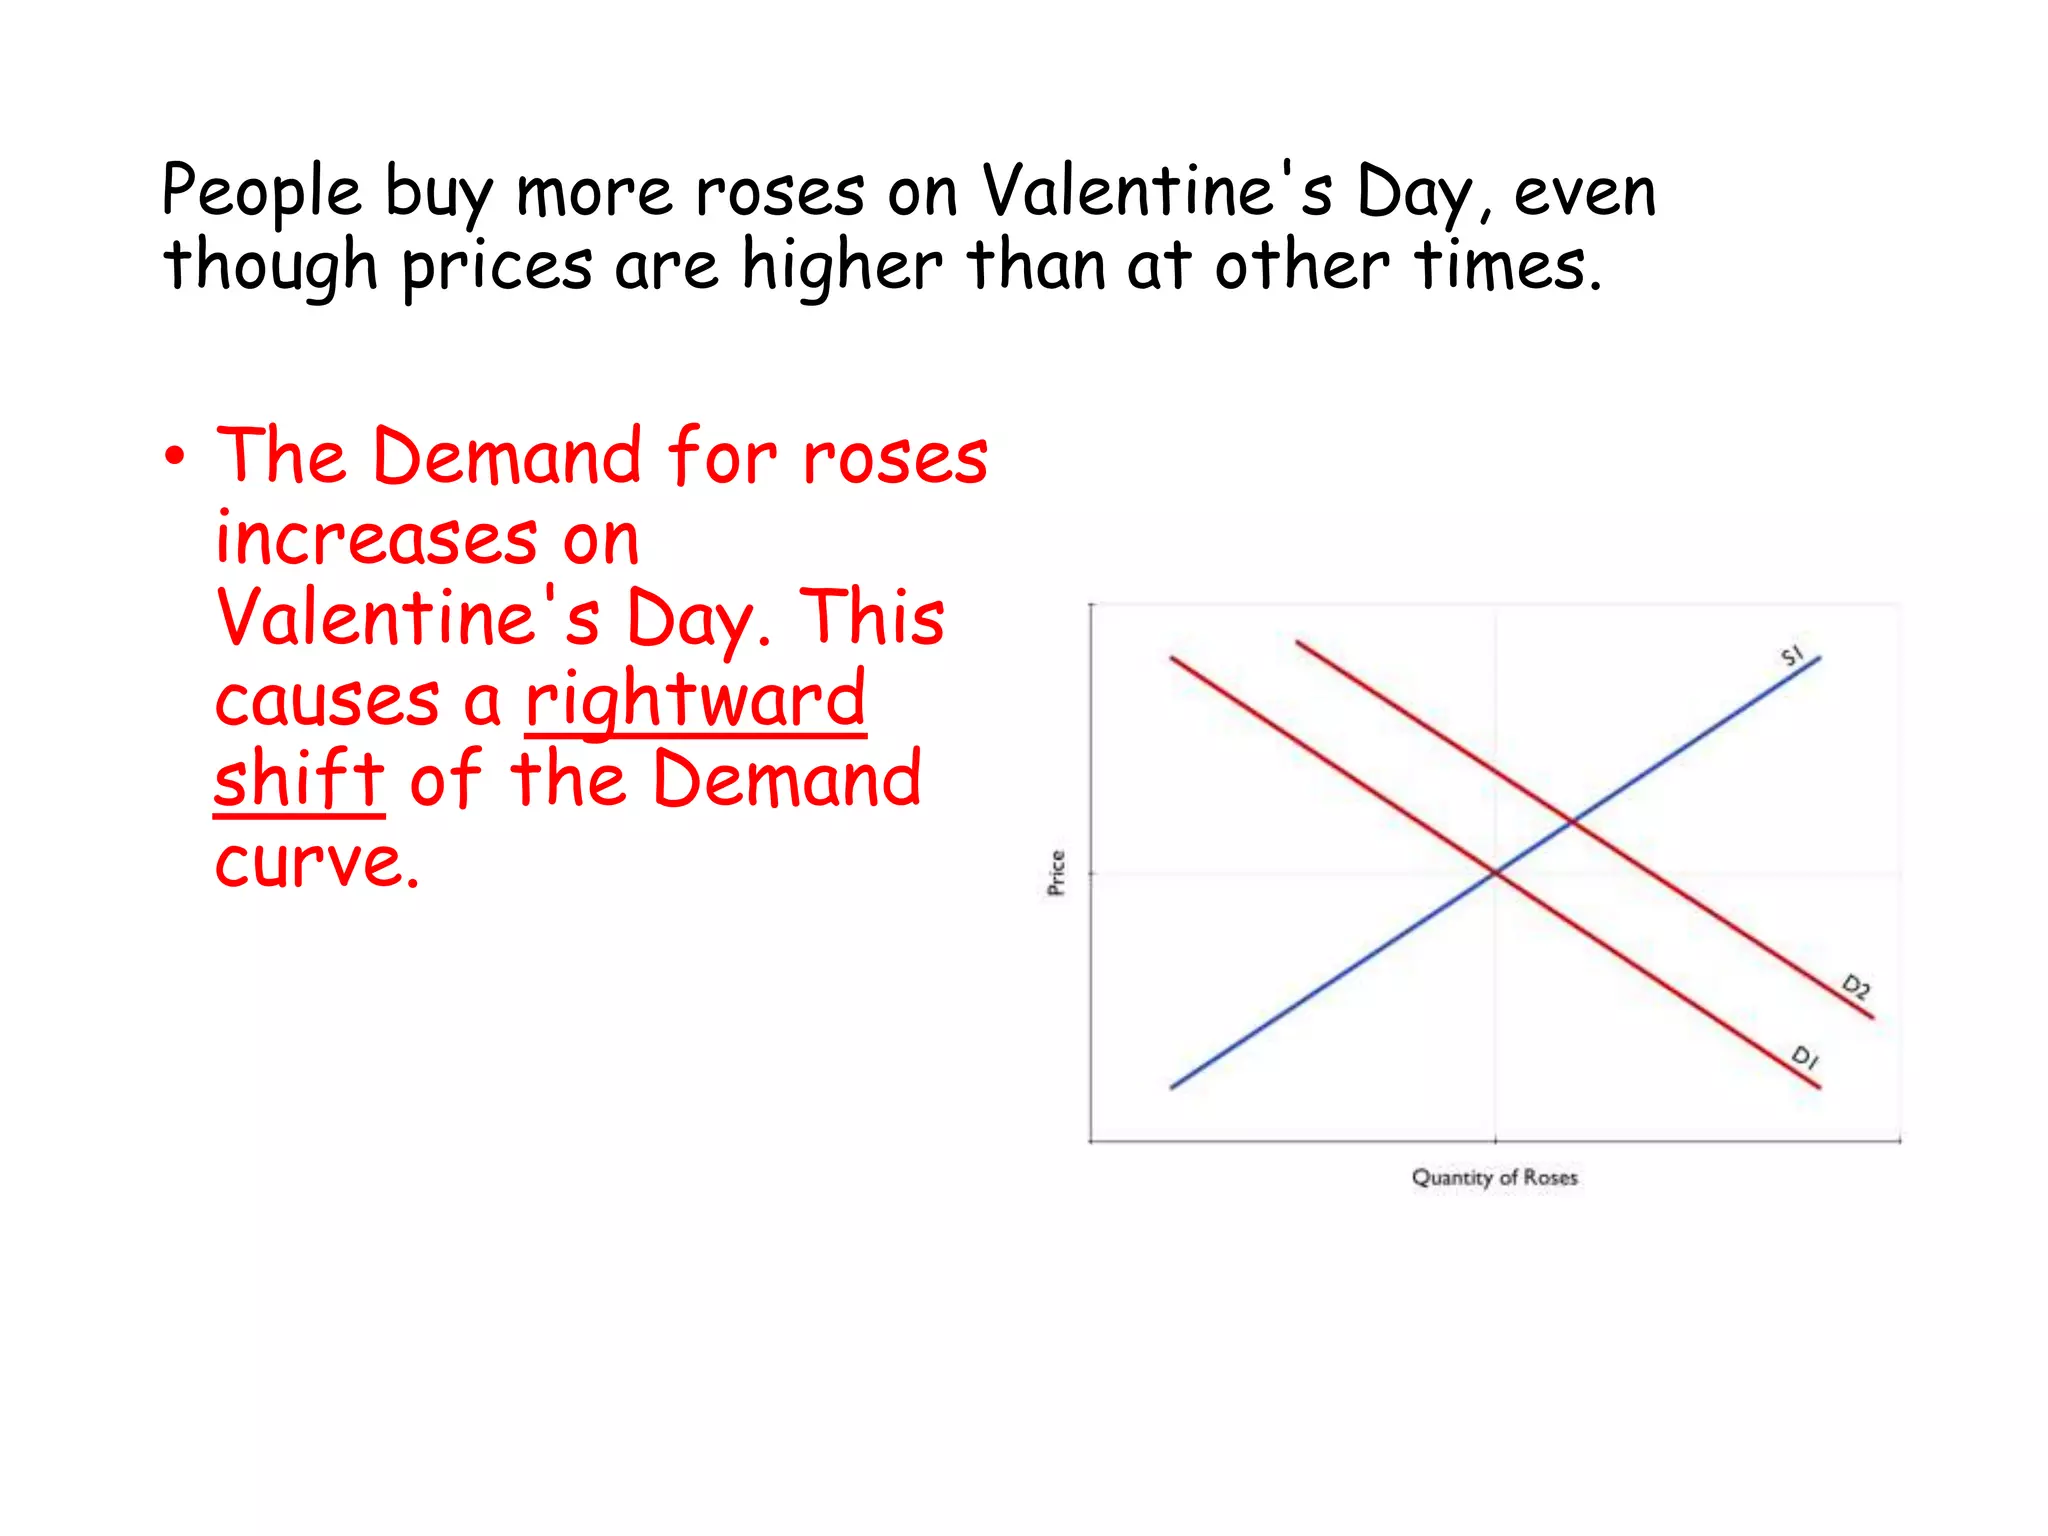
People buy moreroses on Valentine's Day, even
though prices are higher than at other times.
• The Demand for roses
increases on
Valentine's Day. This
causes a rightward
shift of the Demand
curve.
37.
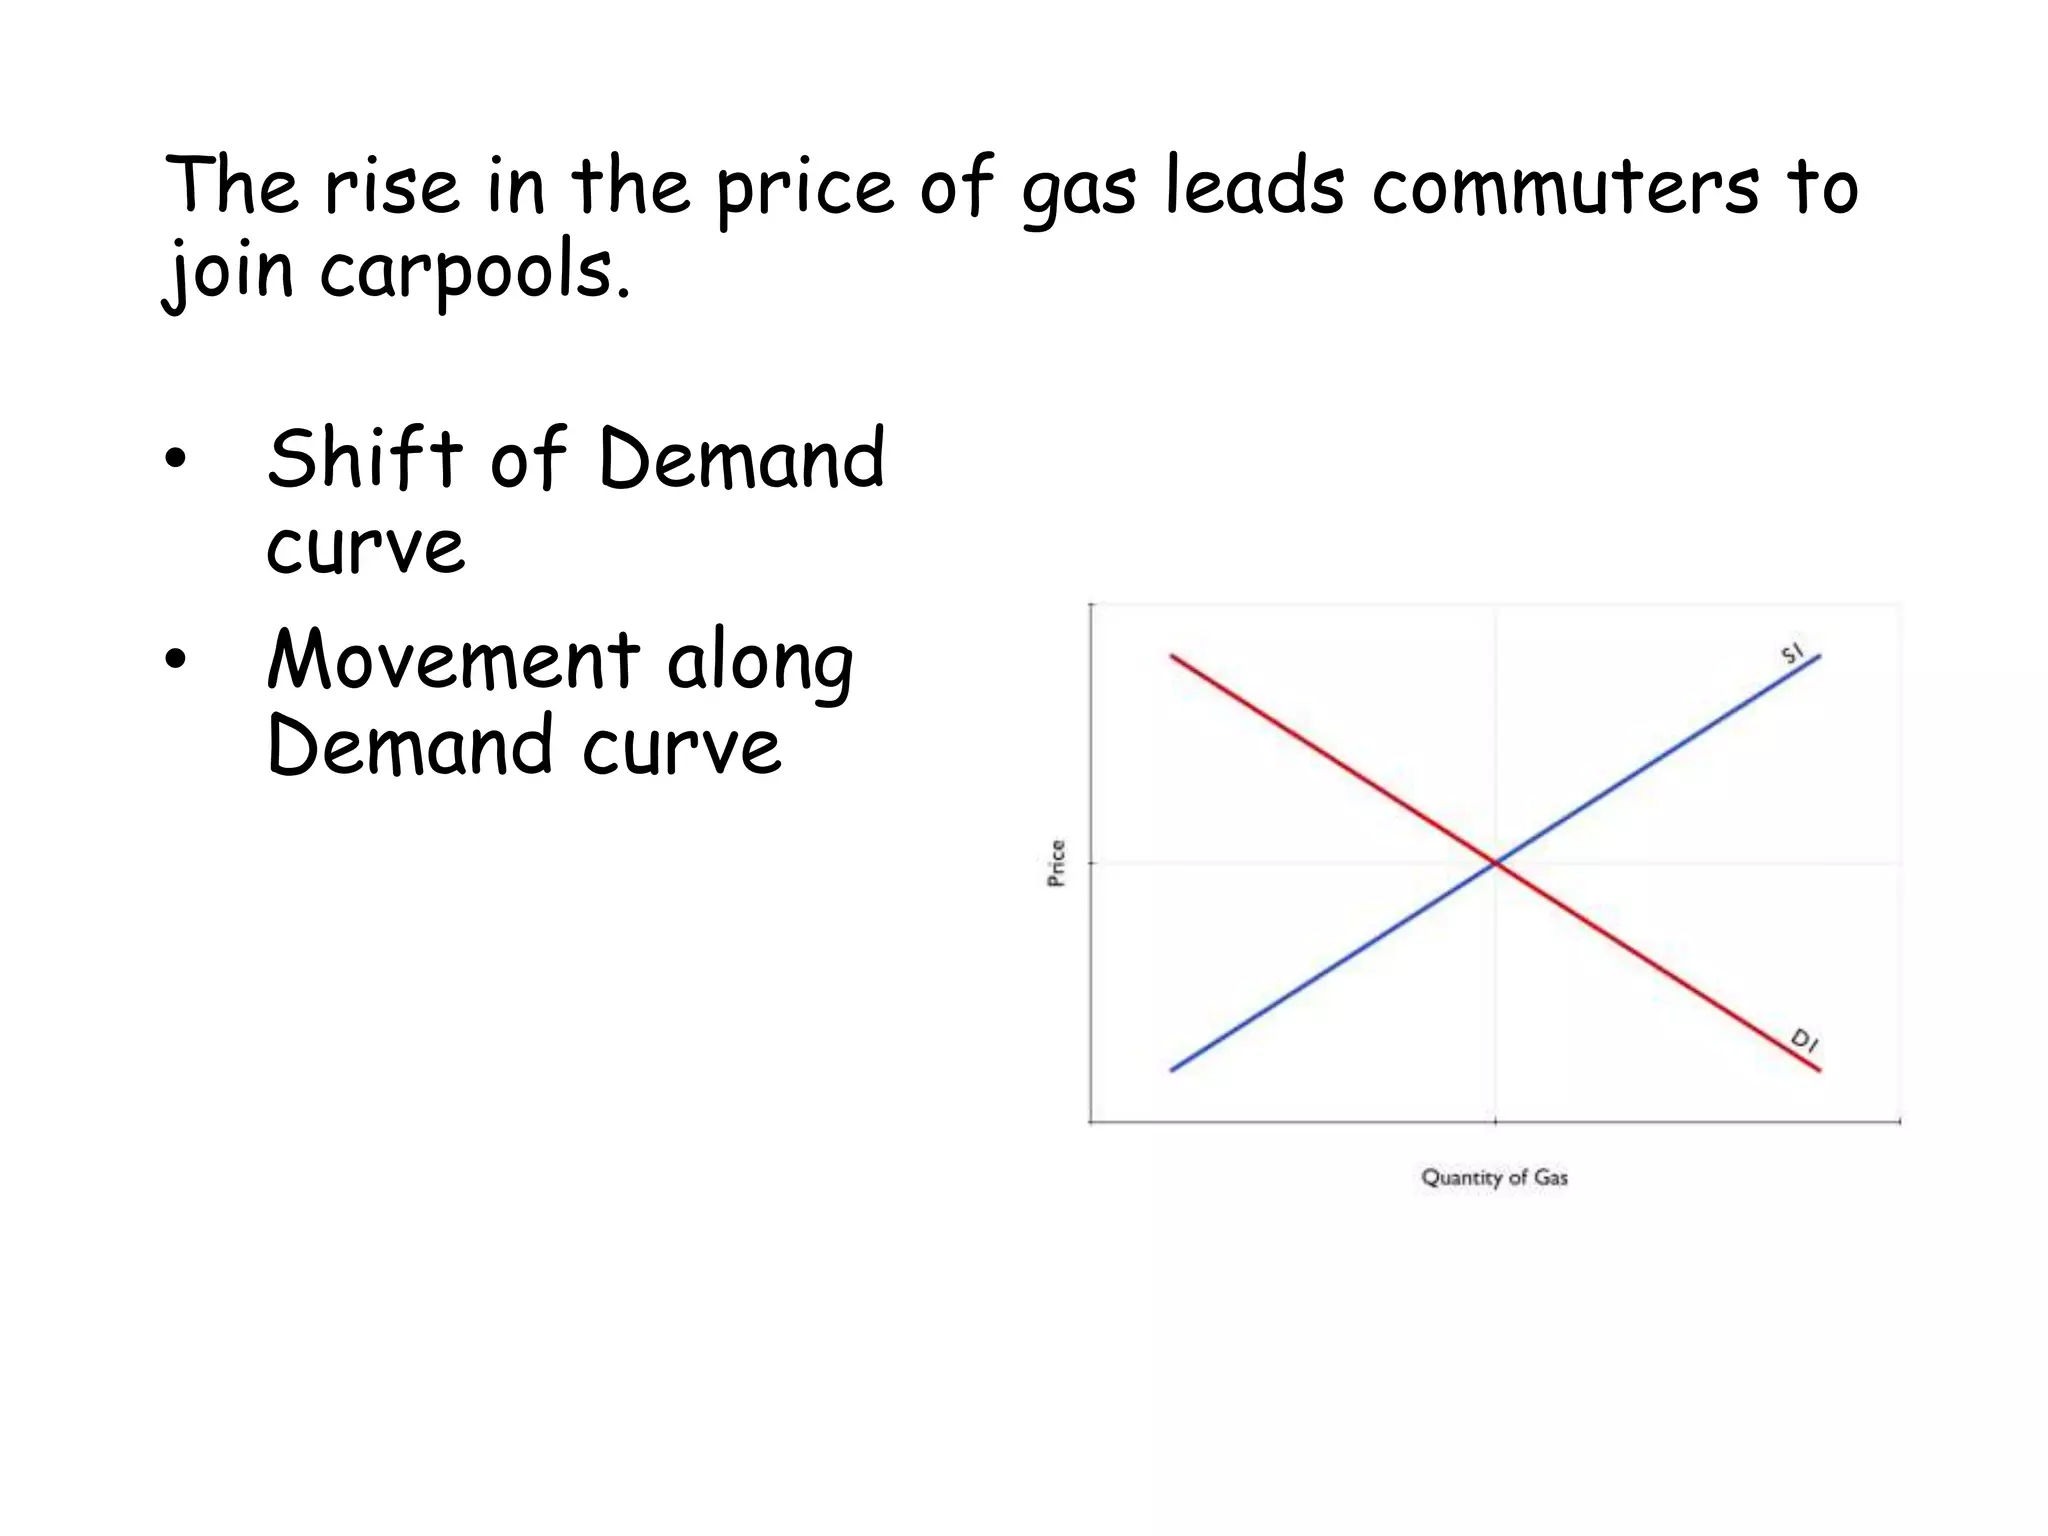
The rise inthe price of gas leads commuters to
join carpools.
• Shift of Demand
curve
• Movement along
Demand curve
38.
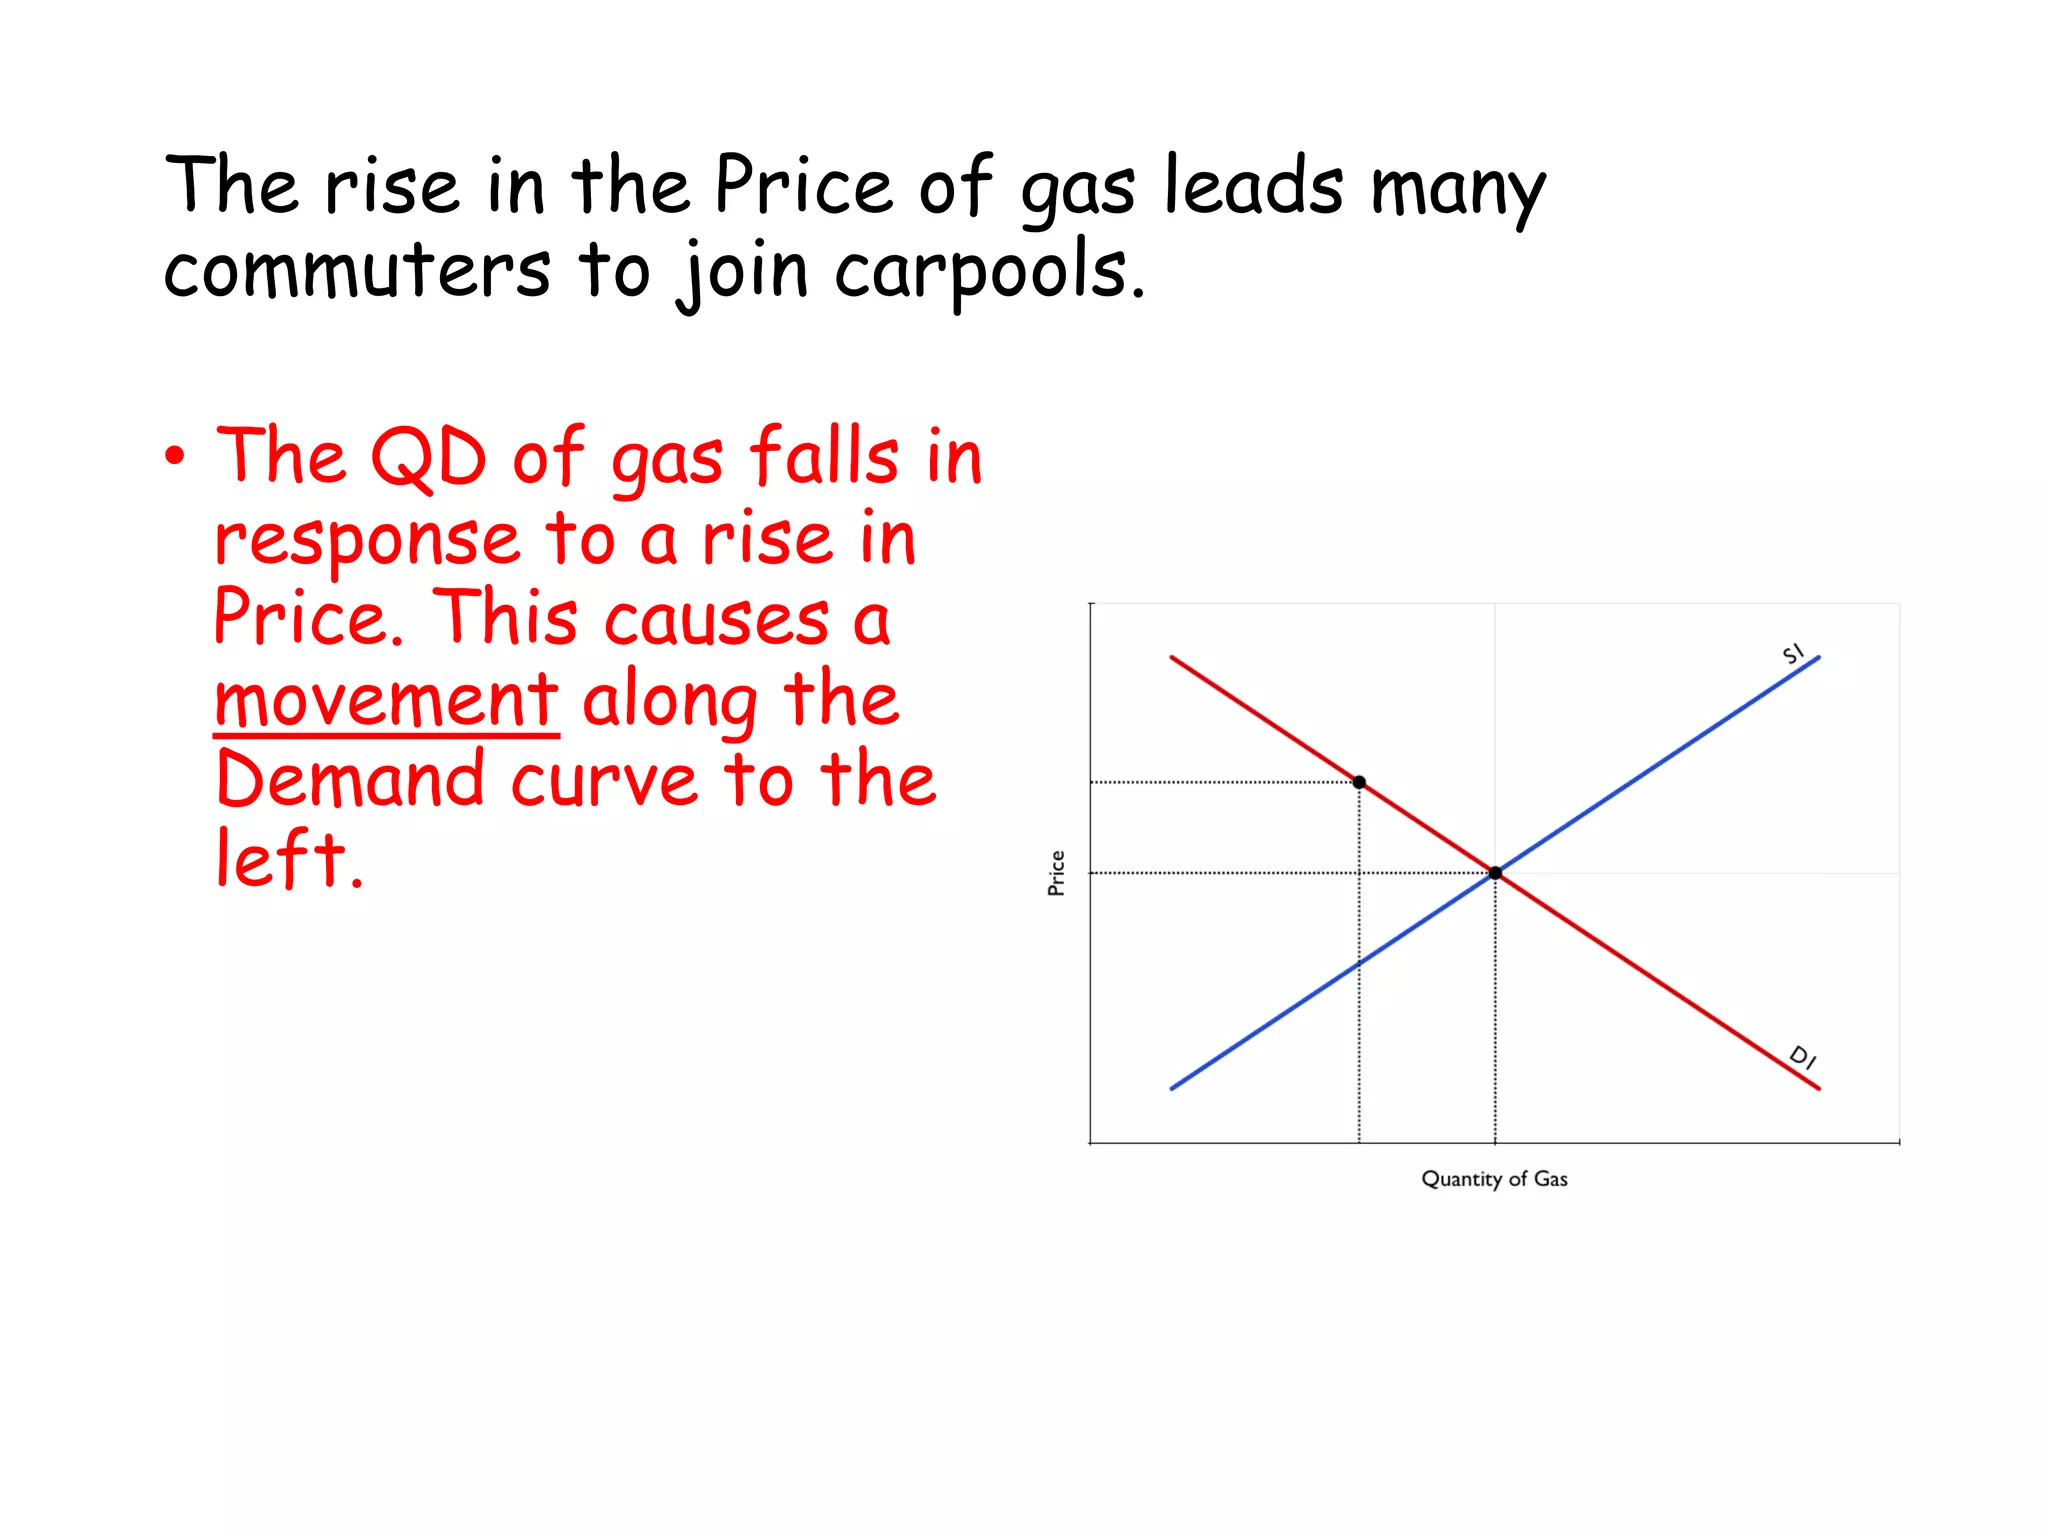
The rise inthe Price of gas leads many
commuters to join carpools.
• The QD of gas falls in
response to a rise in
Price. This causes a
movement along the
Demand curve to the
left.
39.
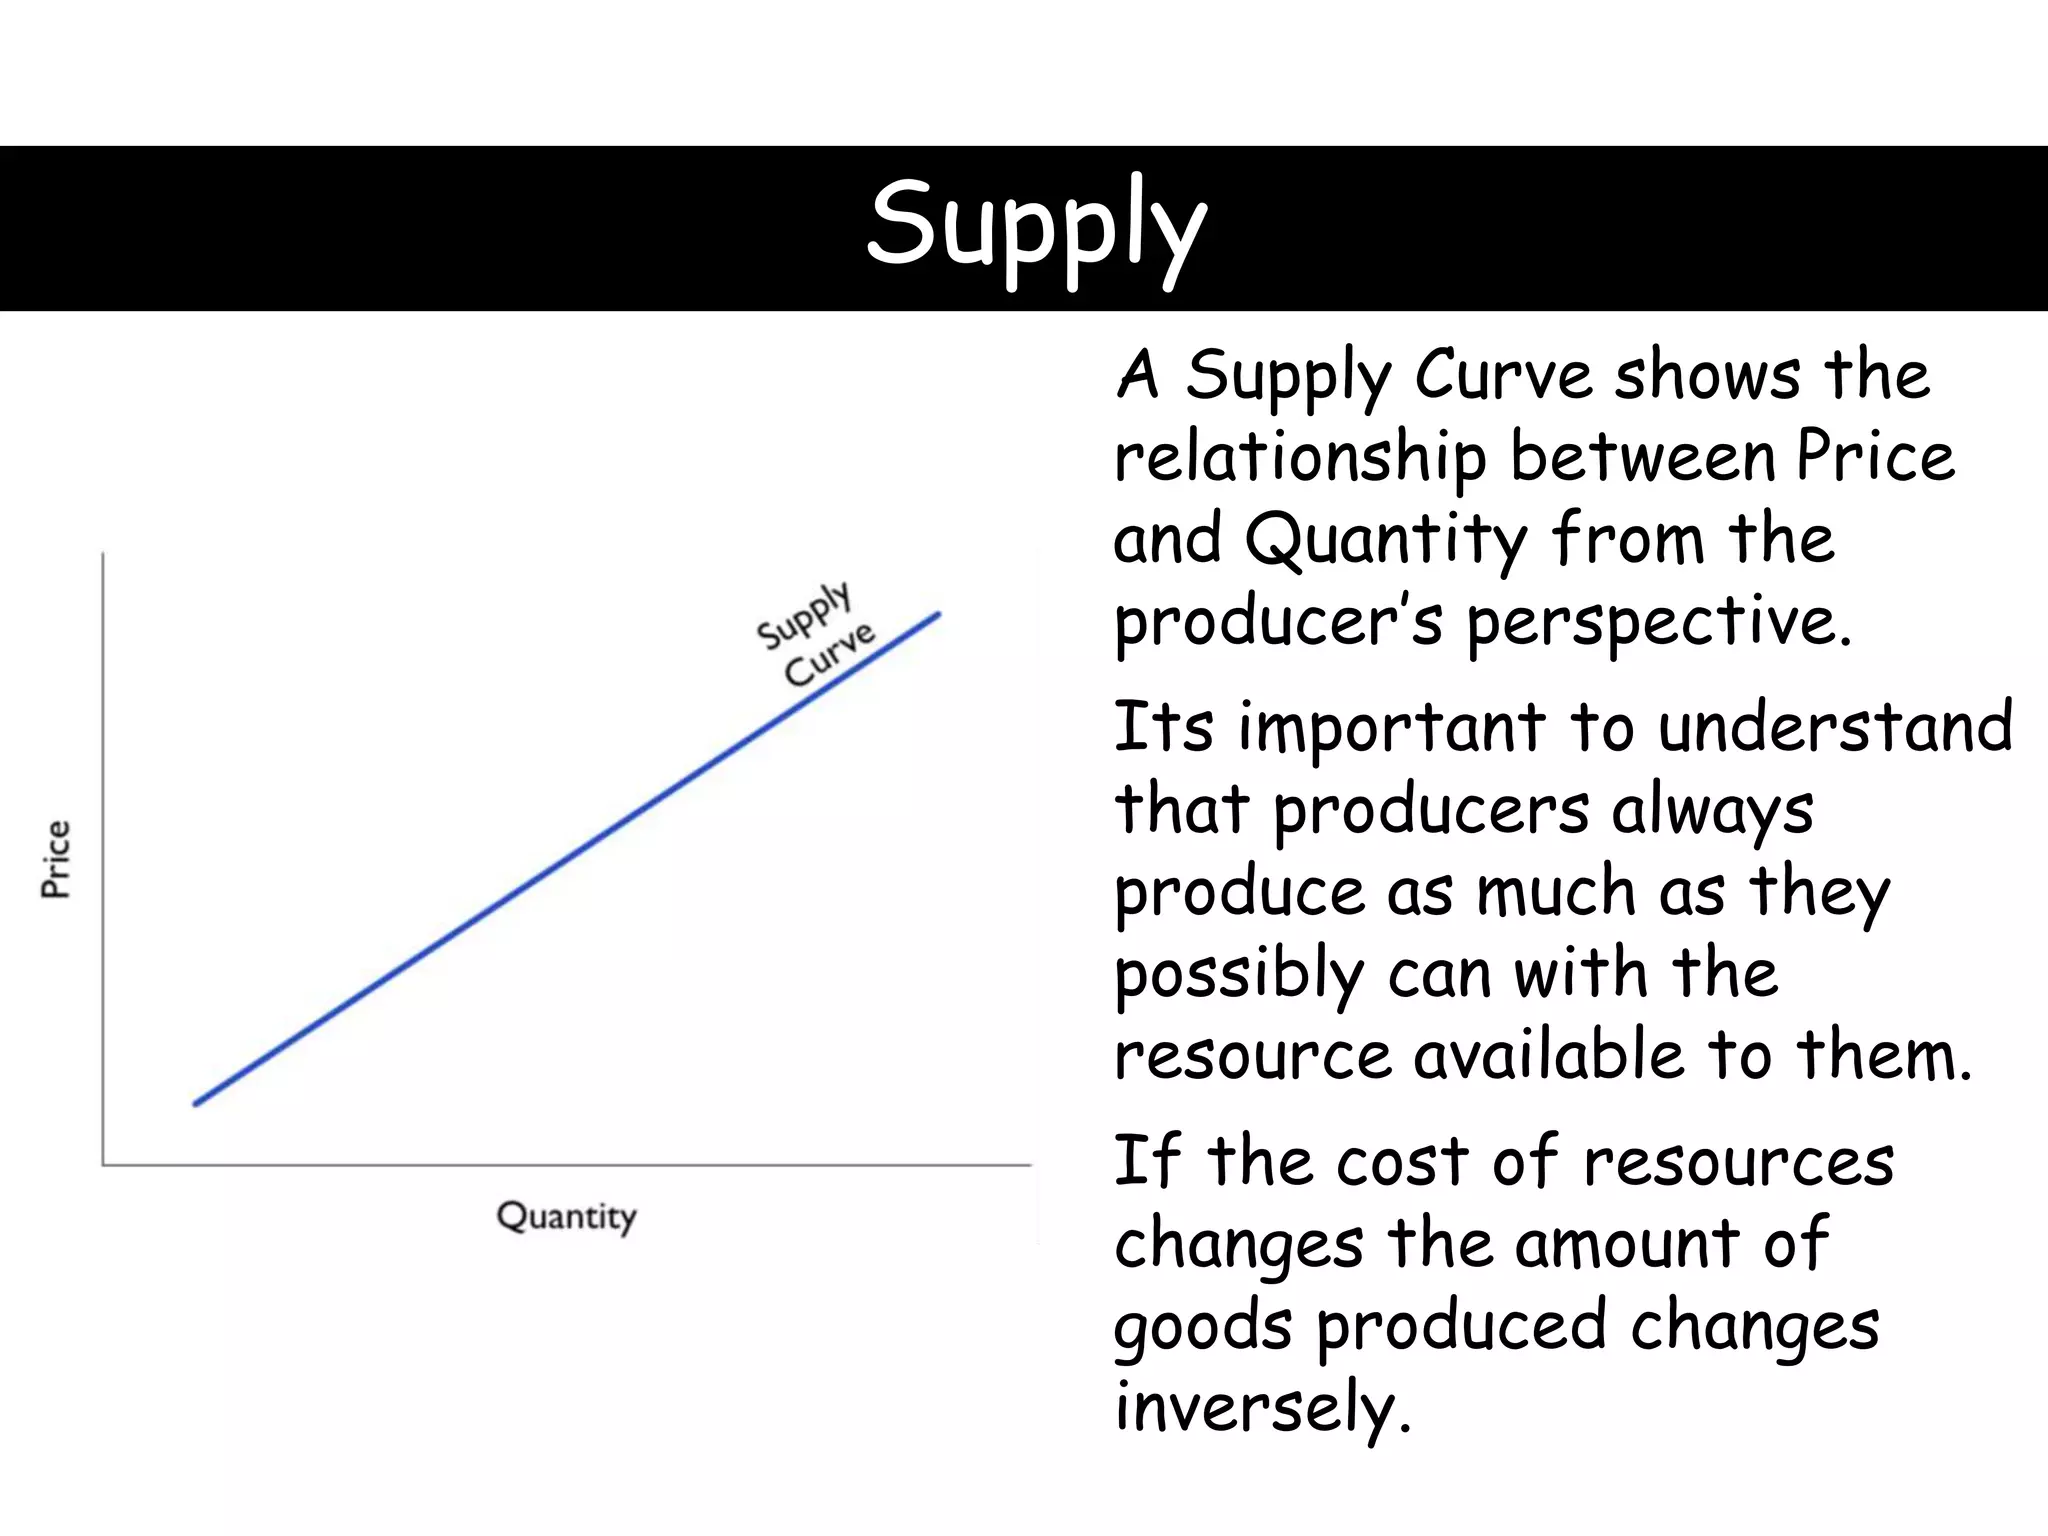
Supply
A Supply Curveshows the
relationship between Price
and Quantity from the
producer’s perspective.
Its important to understand
that producers always
produce as much as they
possibly can with the
resource available to them.
If the cost of resources
changes the amount of
goods produced changes
inversely.
40.
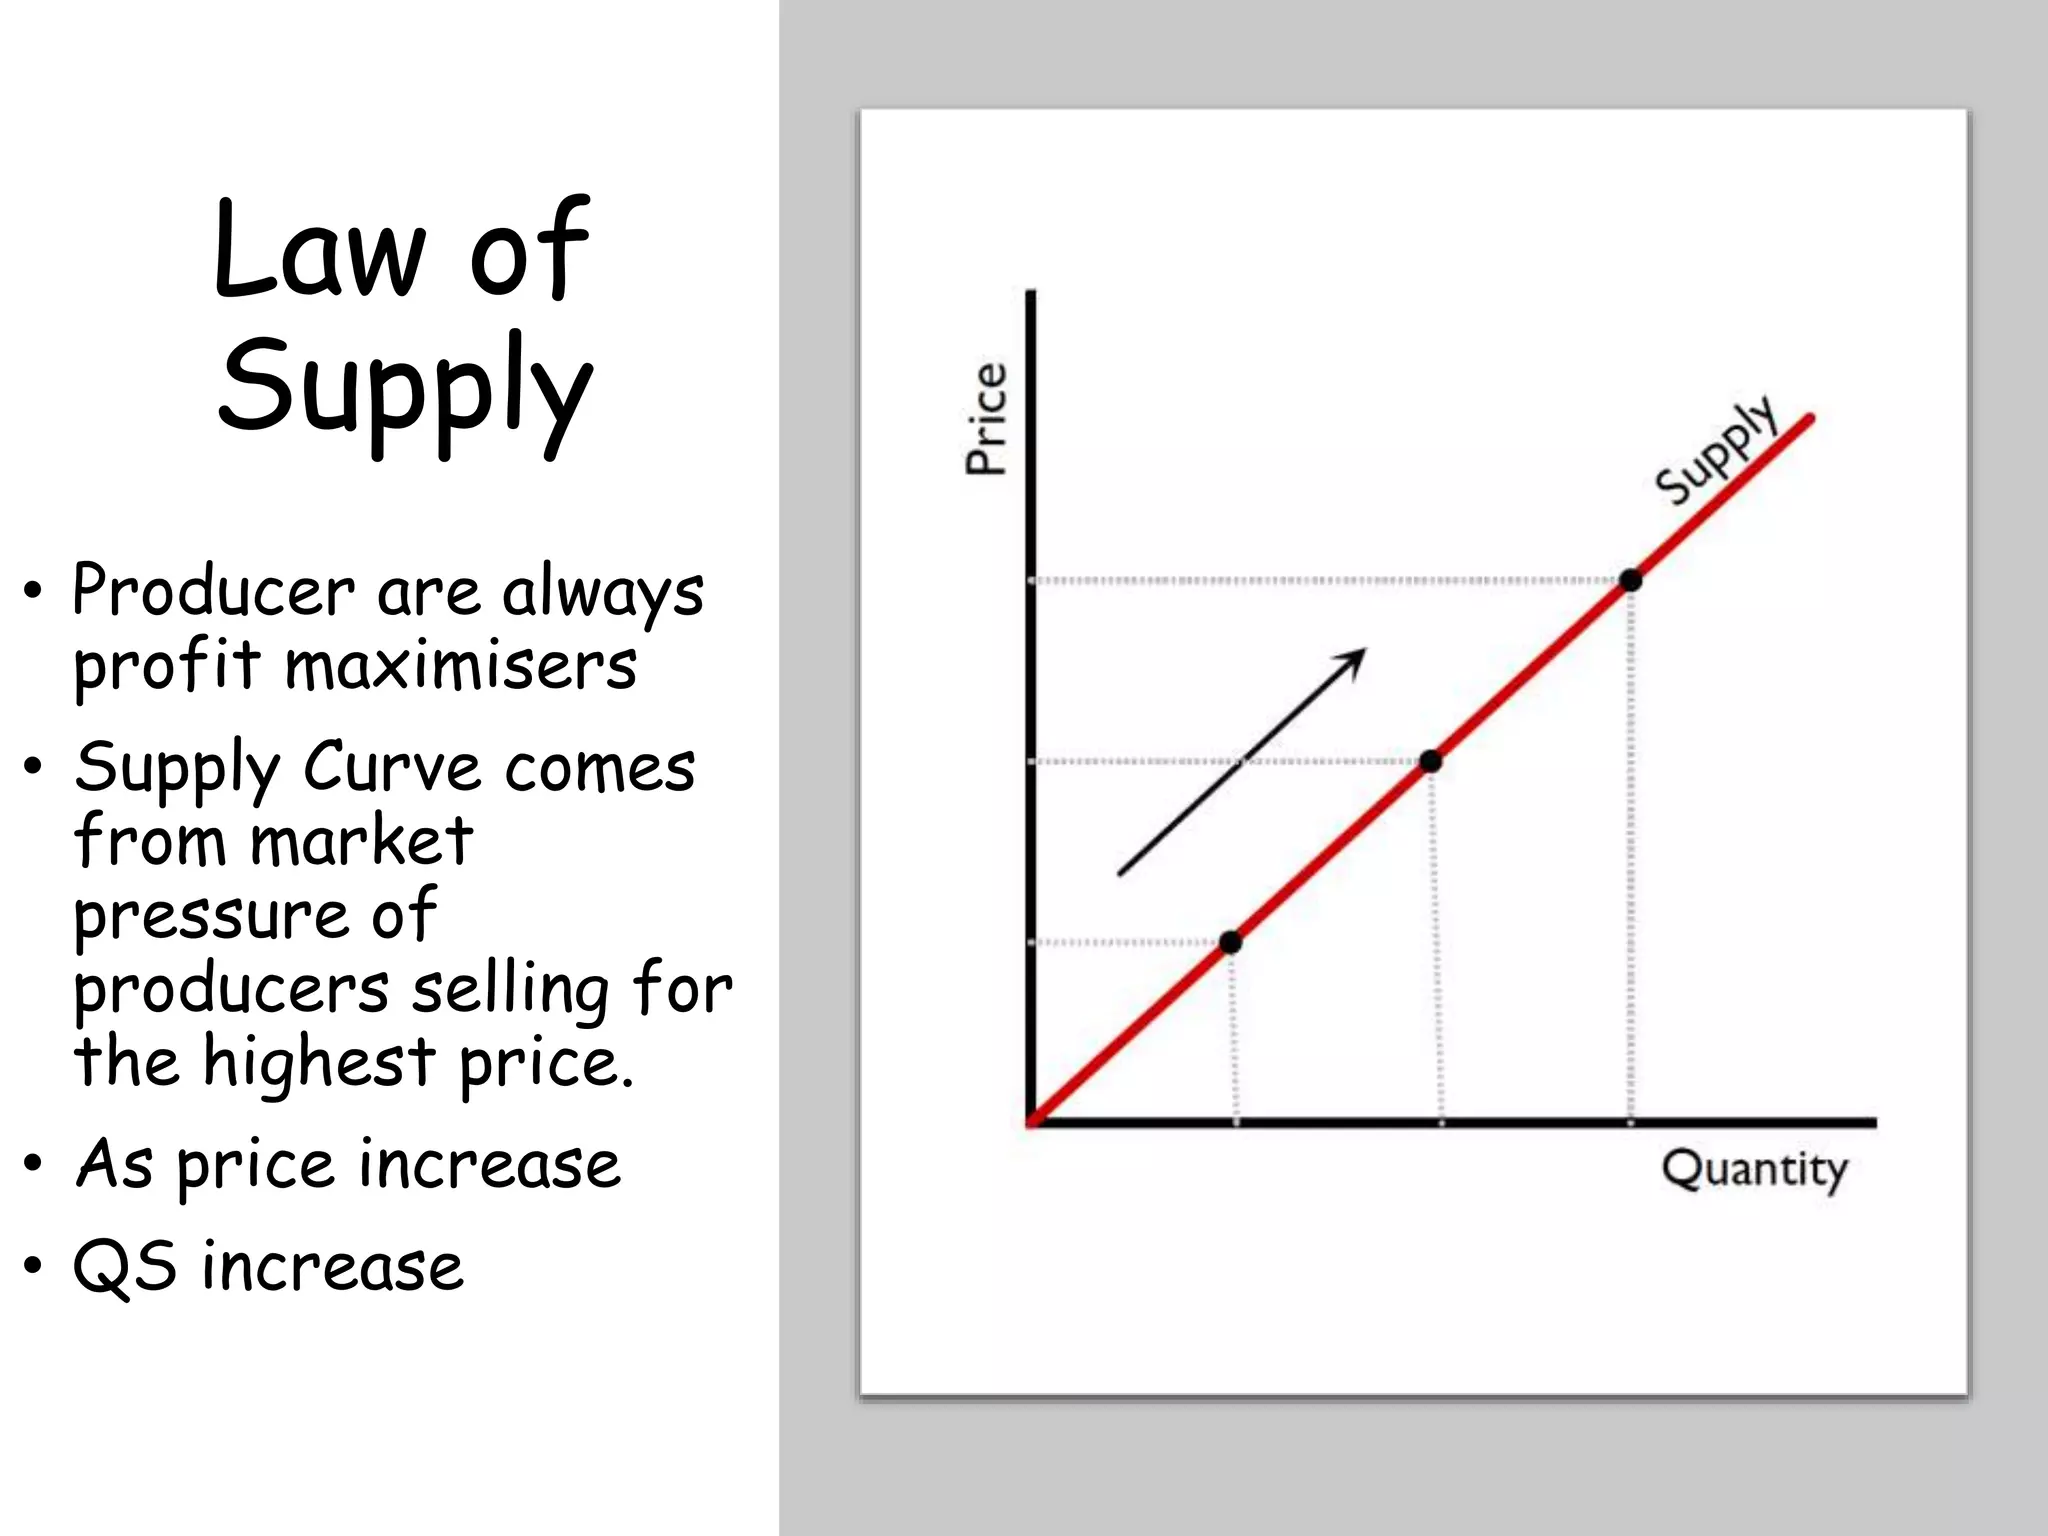
Law of
Supply
• Producerare always
profit maximisers
• Supply Curve comes
from market
pressure of
producers selling for
the highest price.
• As price increase
• QS increase
41.
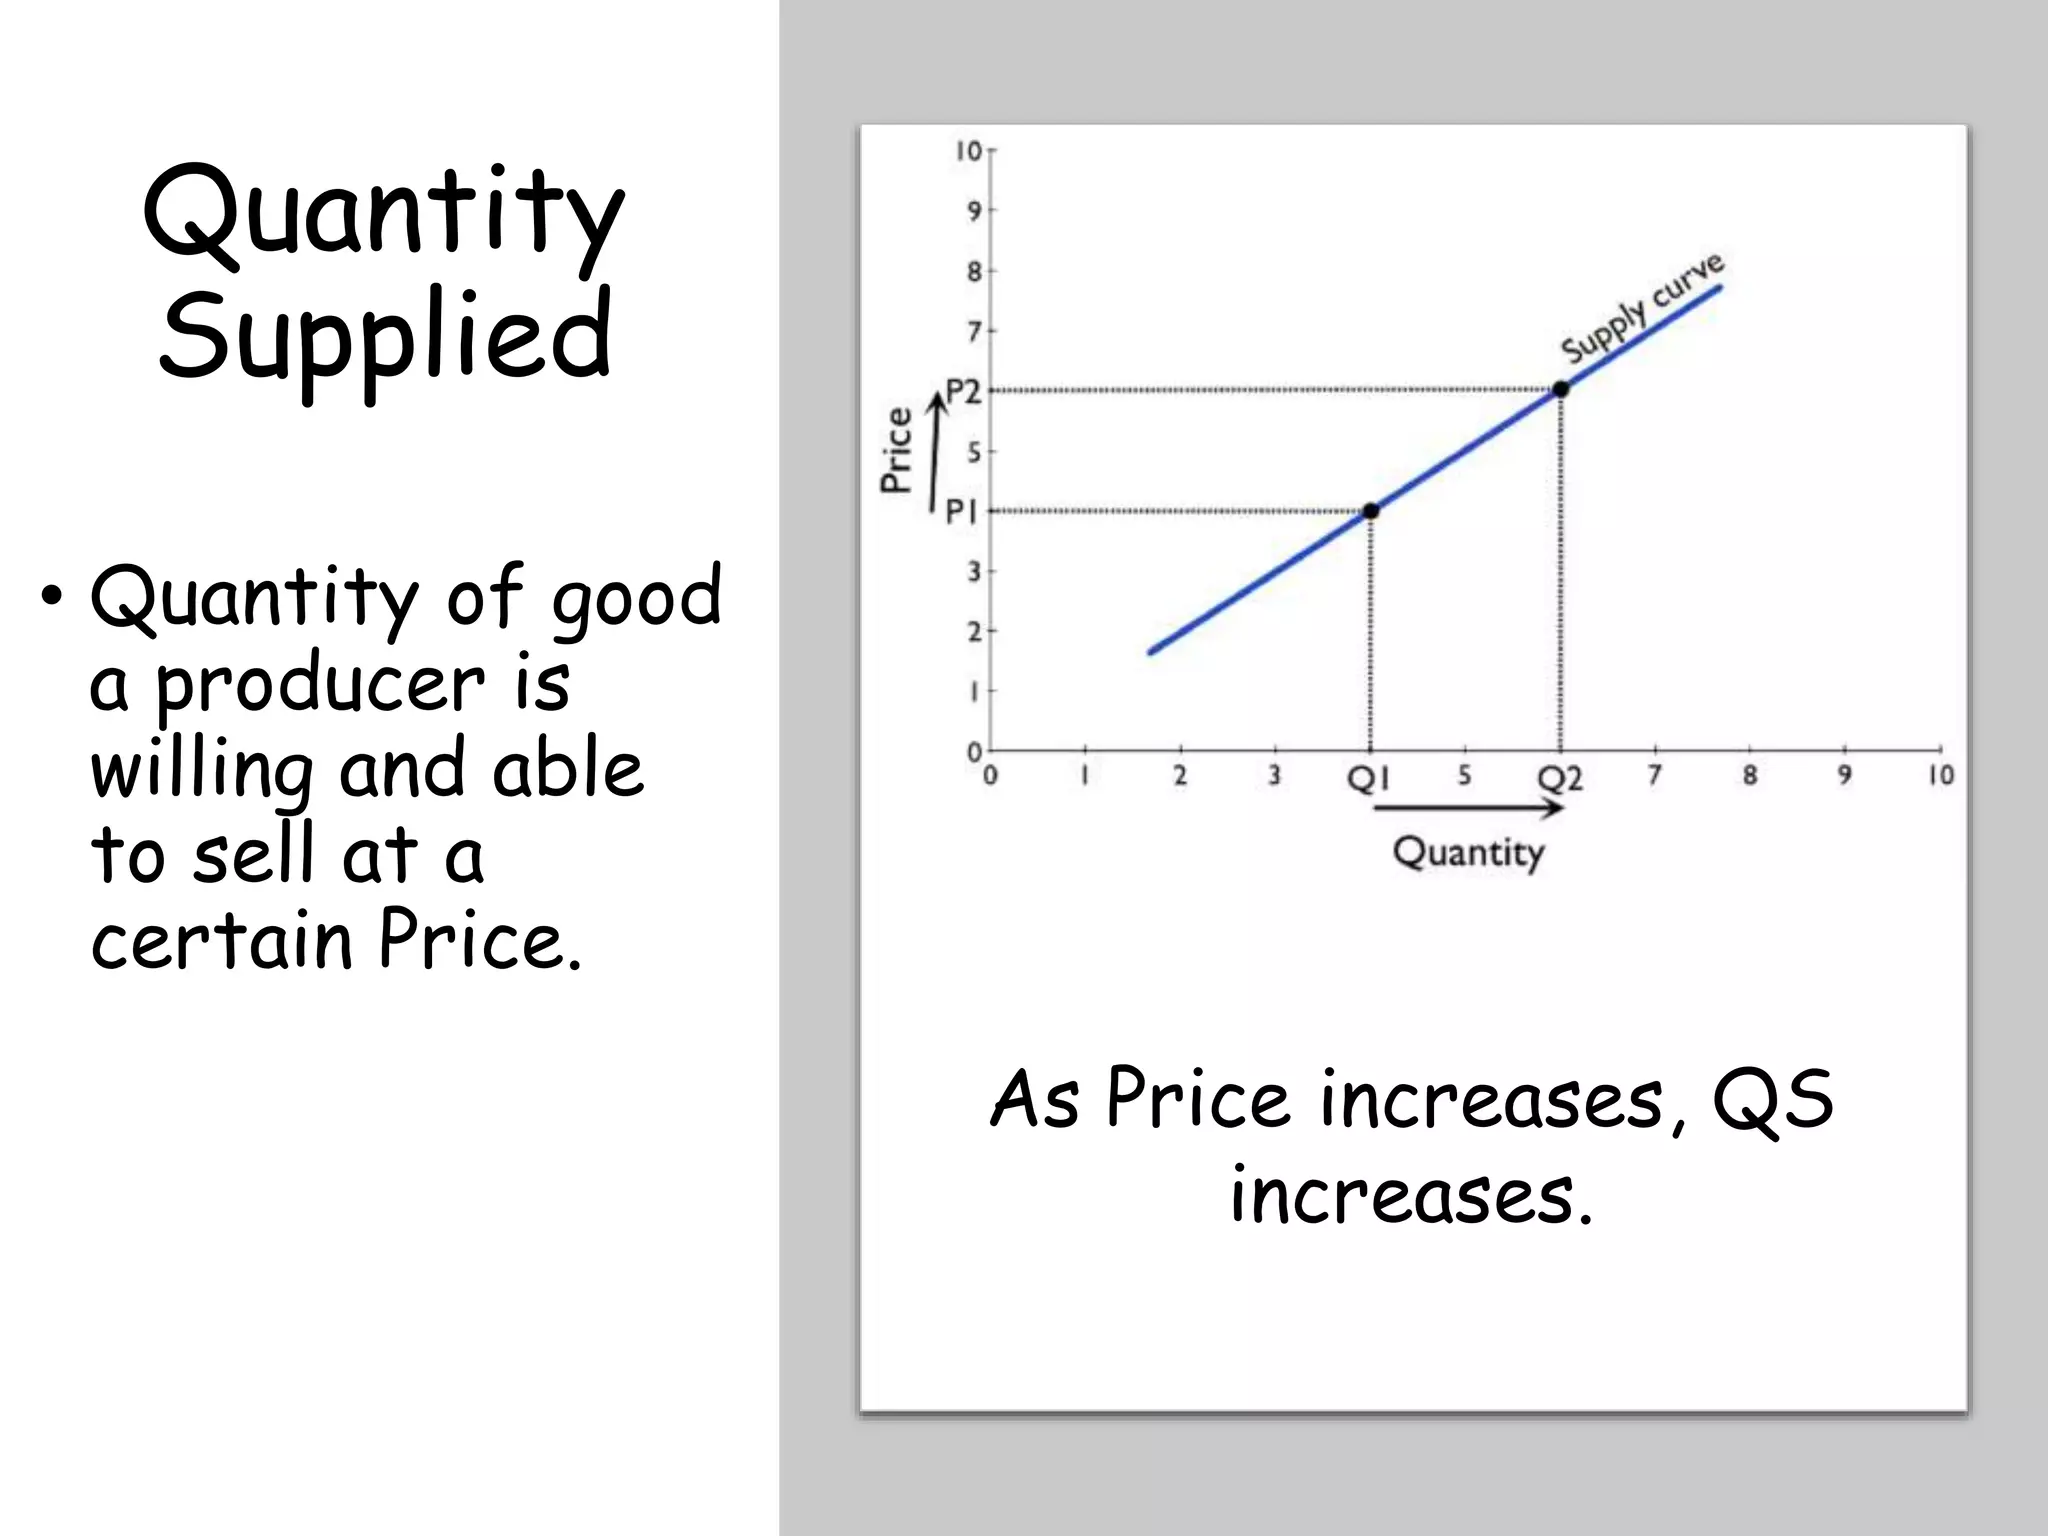
Quantity
Supplied
• Quantity ofgood
a producer is
willing and able
to sell at a
certain Price.
As Price increases, QS
increases.
42.
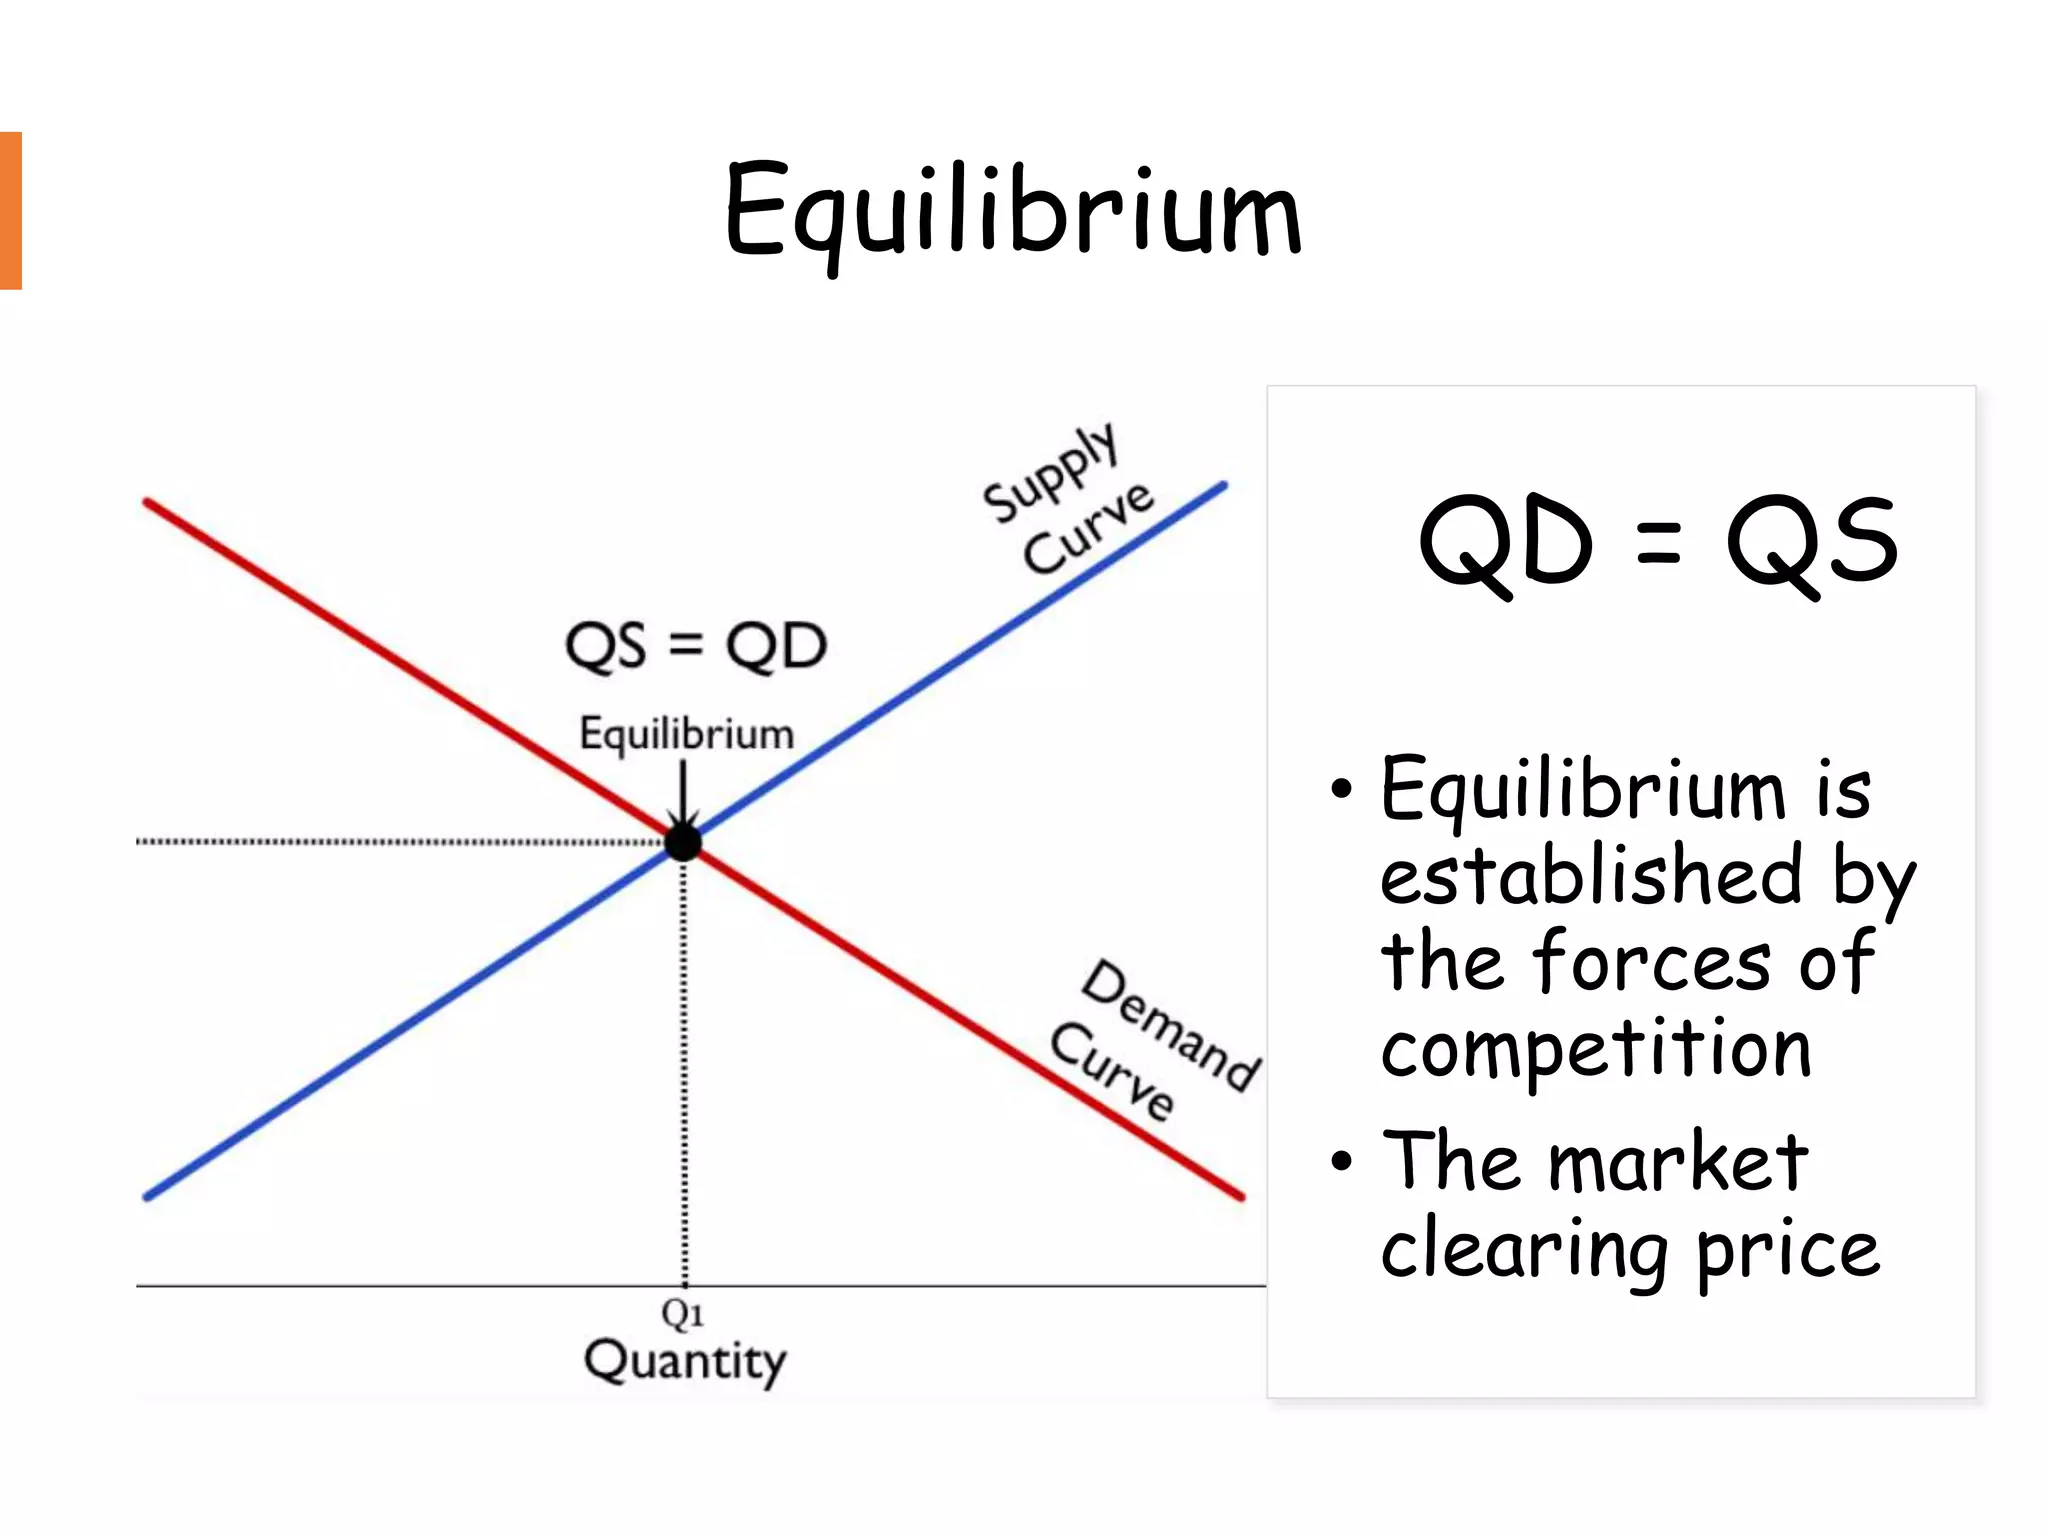
Equilibrium
QD = QS
•Equilibrium is
established by
the forces of
competition
• The market
clearing price
43.
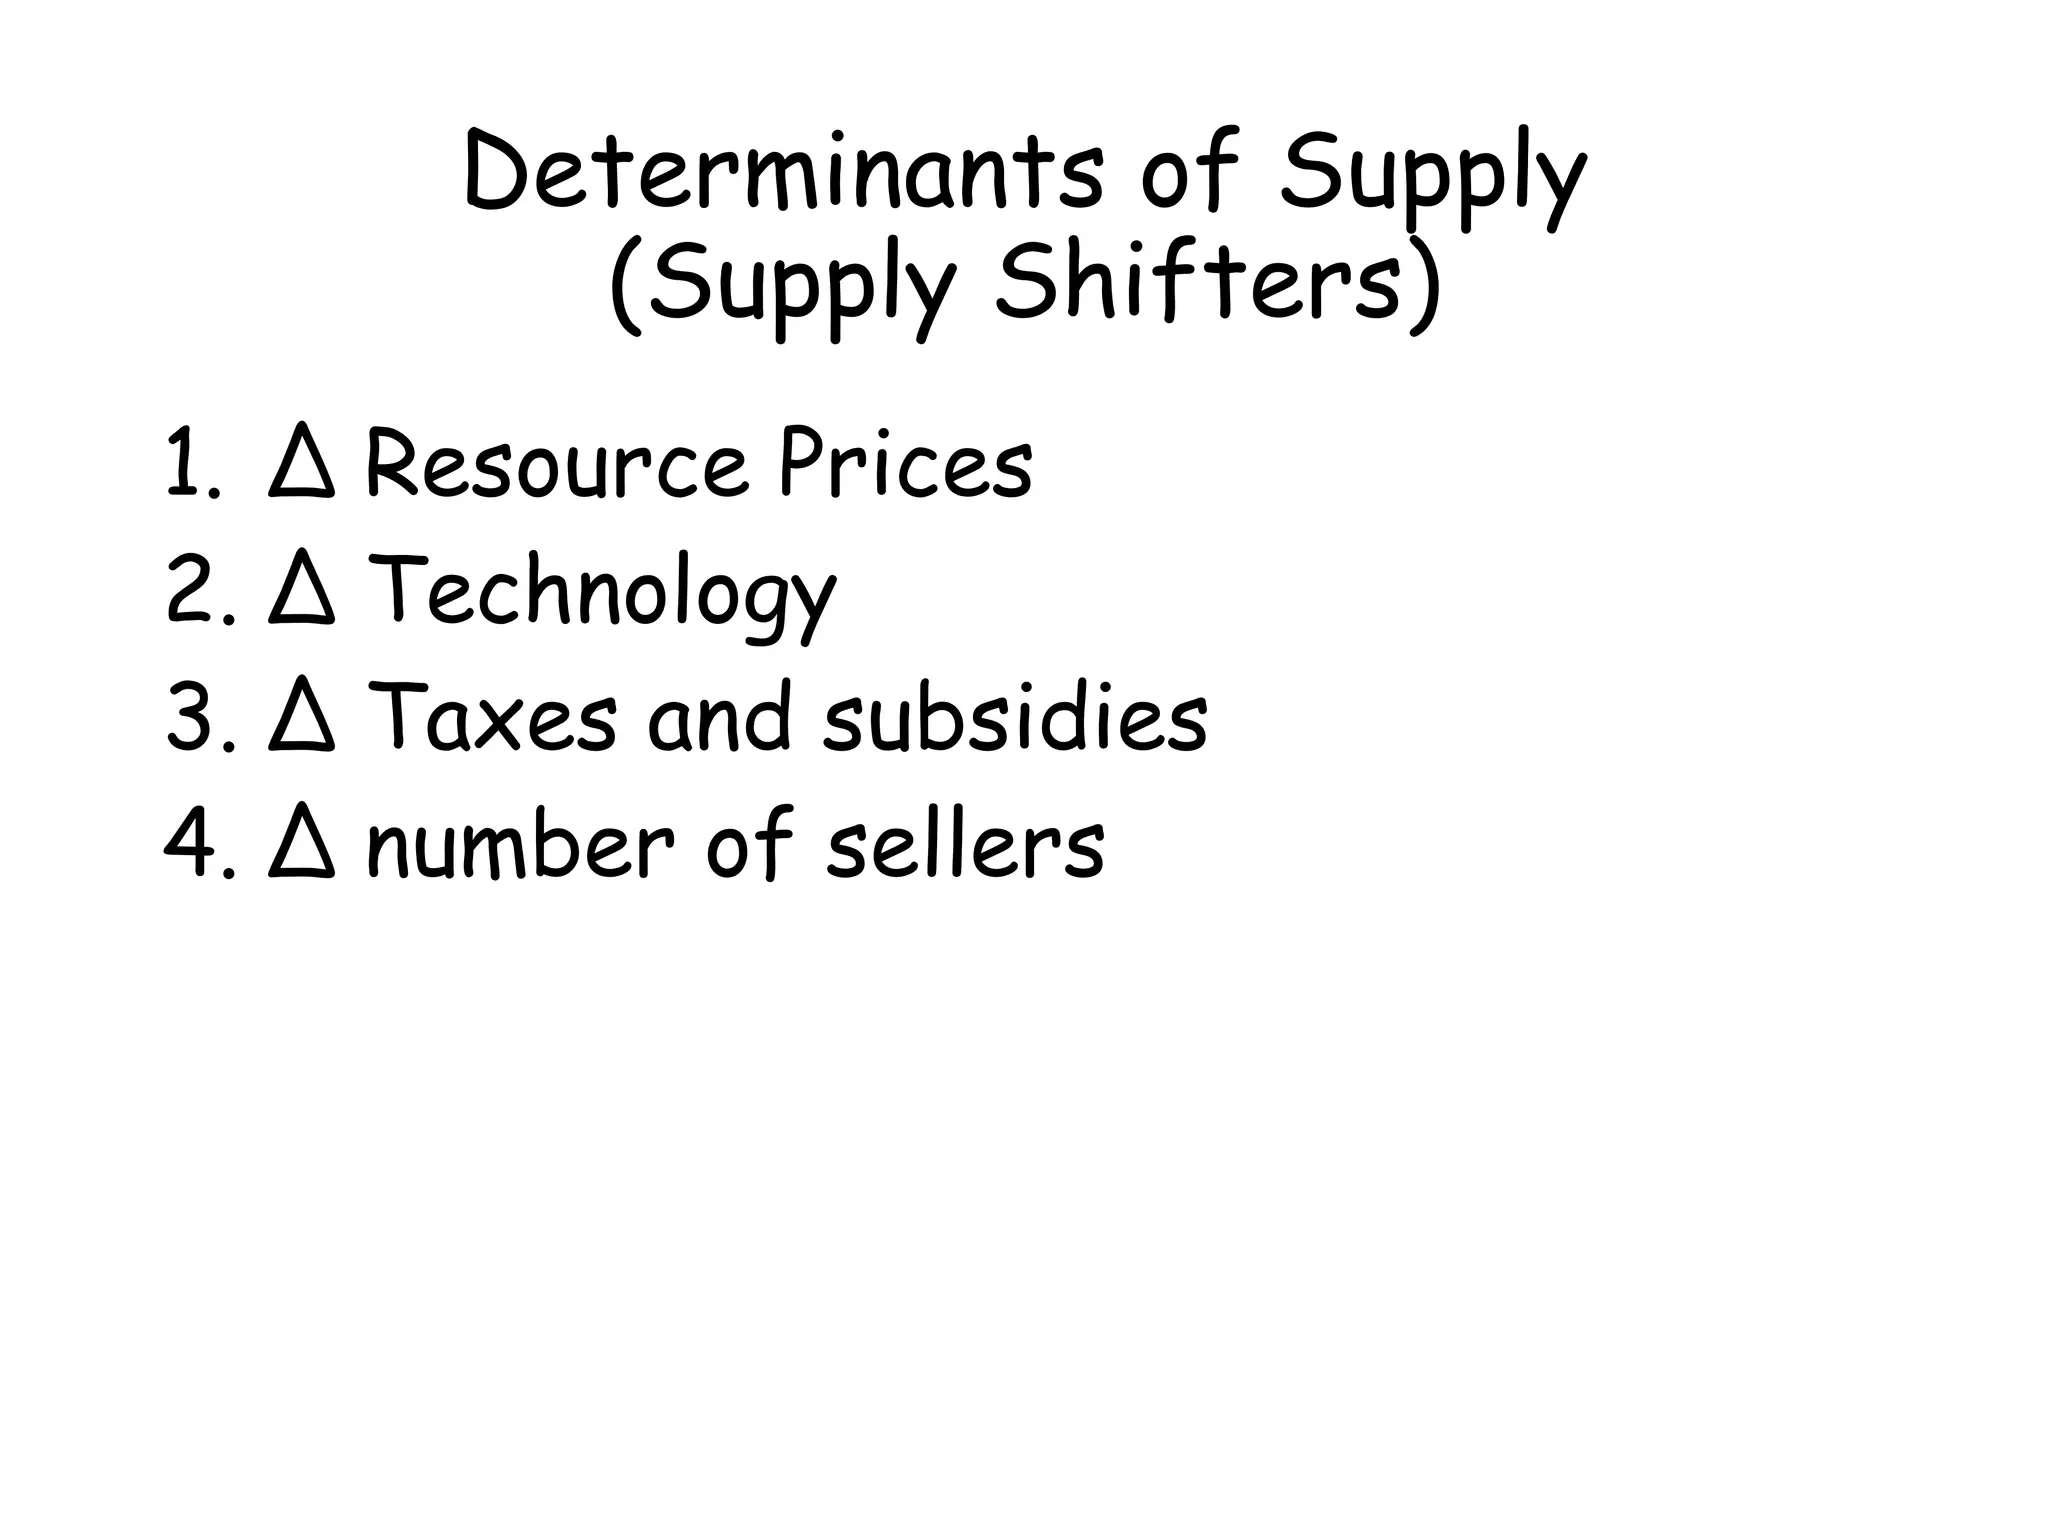
Determinants of Supply
(SupplyShifters)
1. ∆ Resource Prices
2. ∆ Technology
3. ∆ Taxes and subsidies
4. ∆ number of sellers
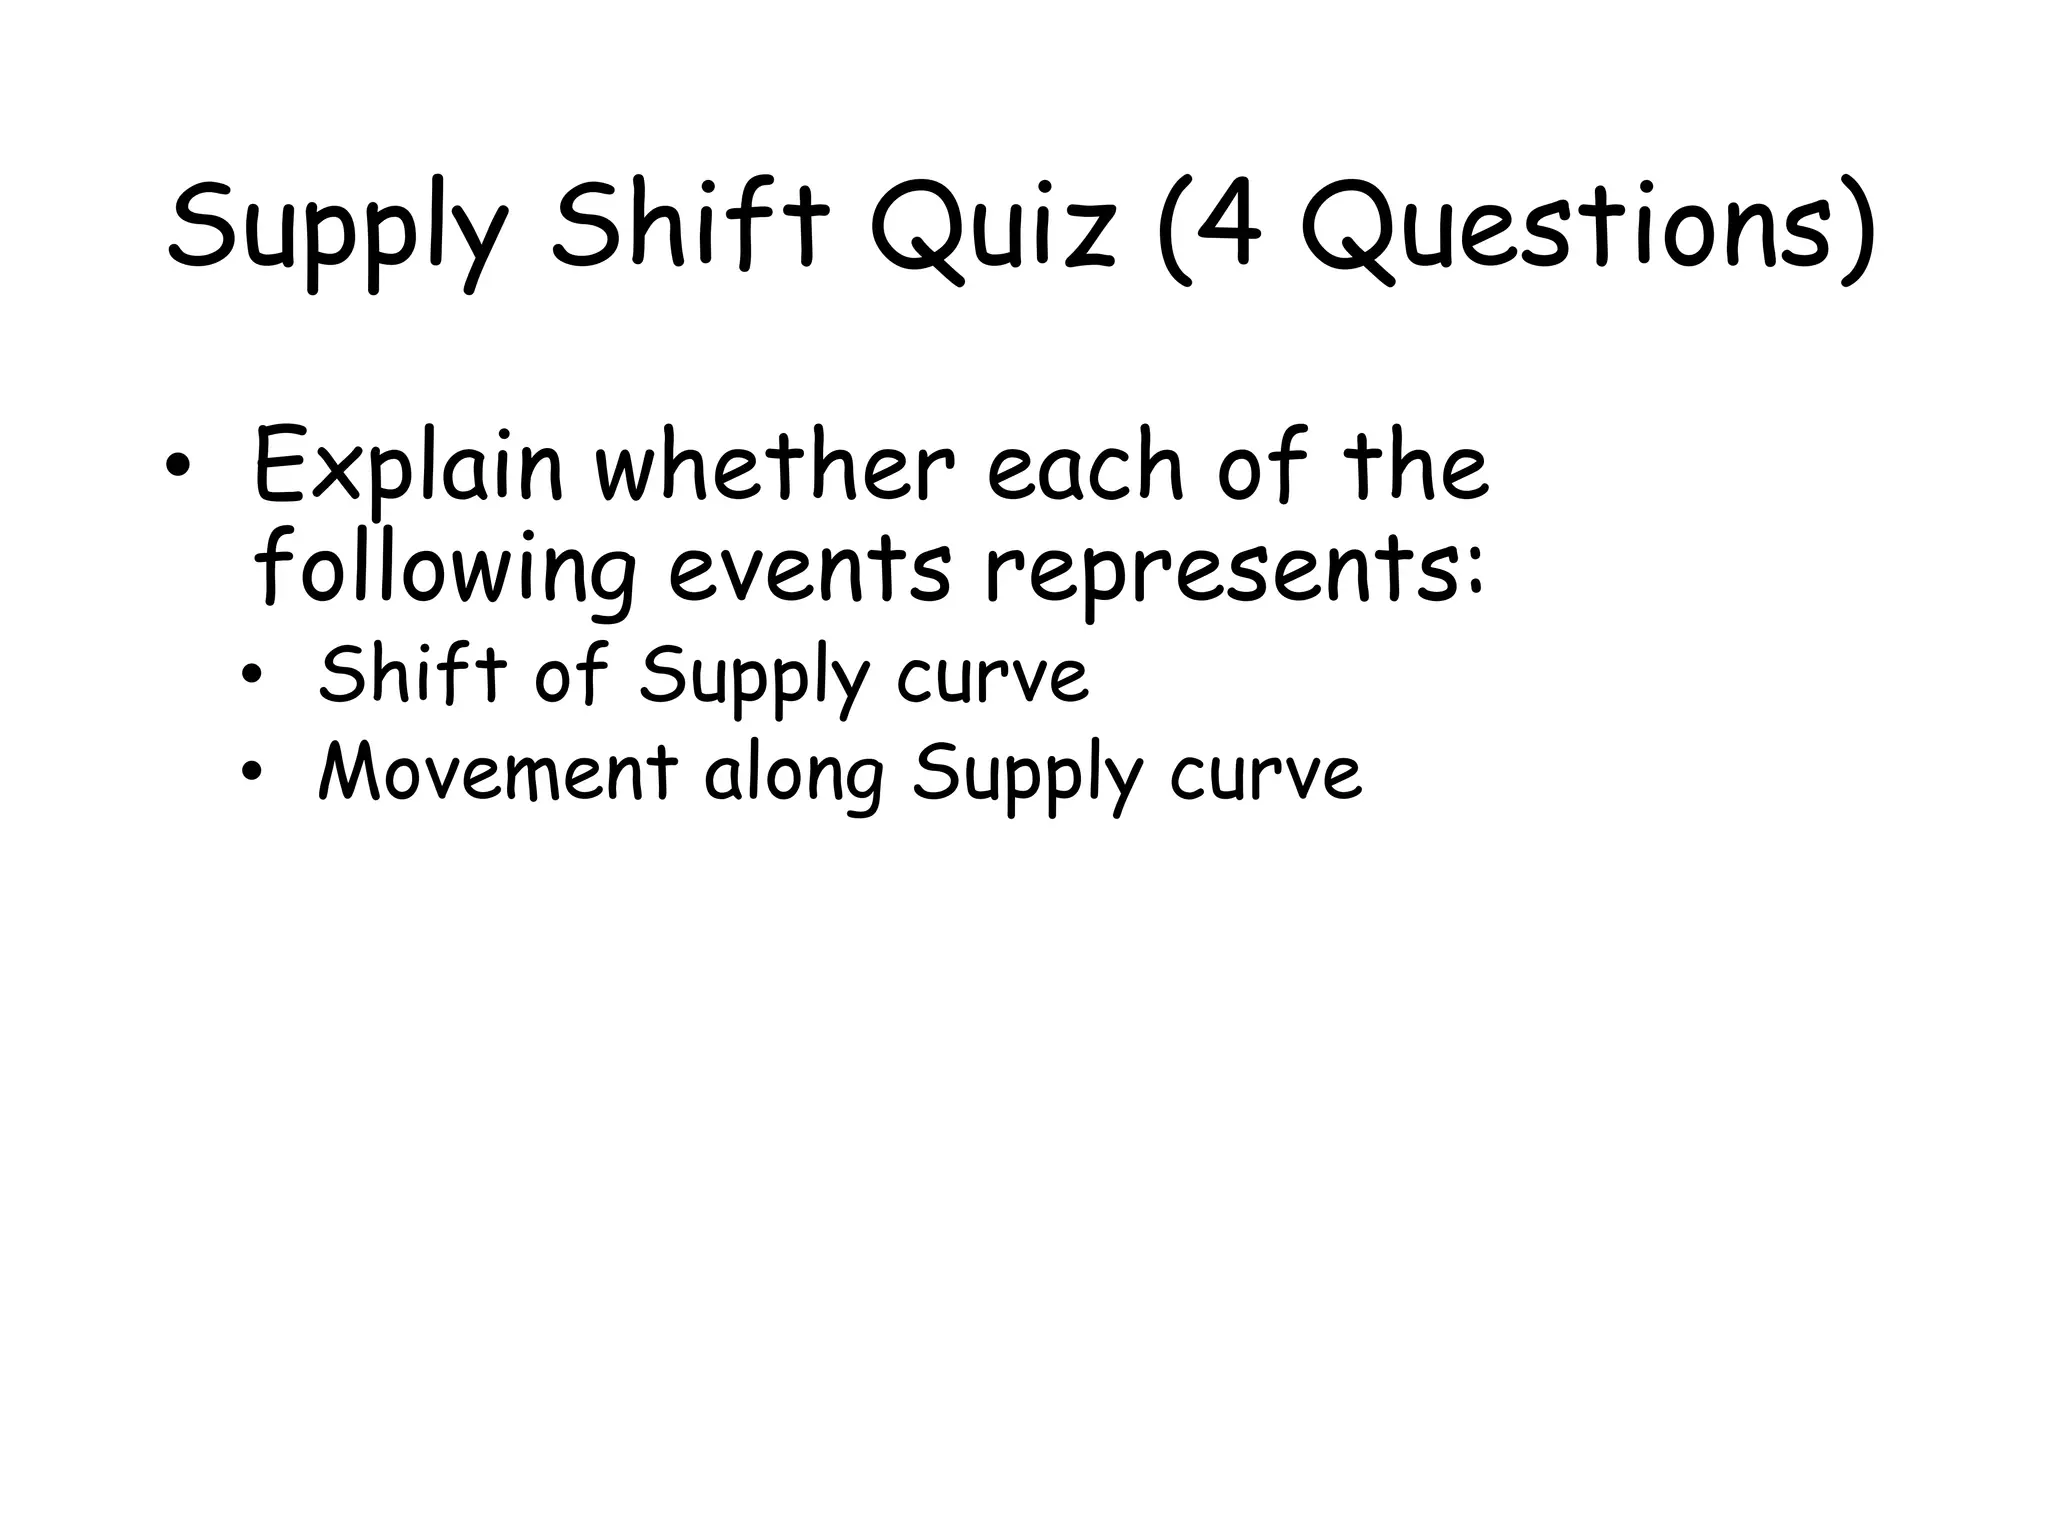
Supply Shift Quiz(4 Questions)
• Explain whether each of the
following events represents:
• Shift of Supply curve
• Movement along Supply curve
46.
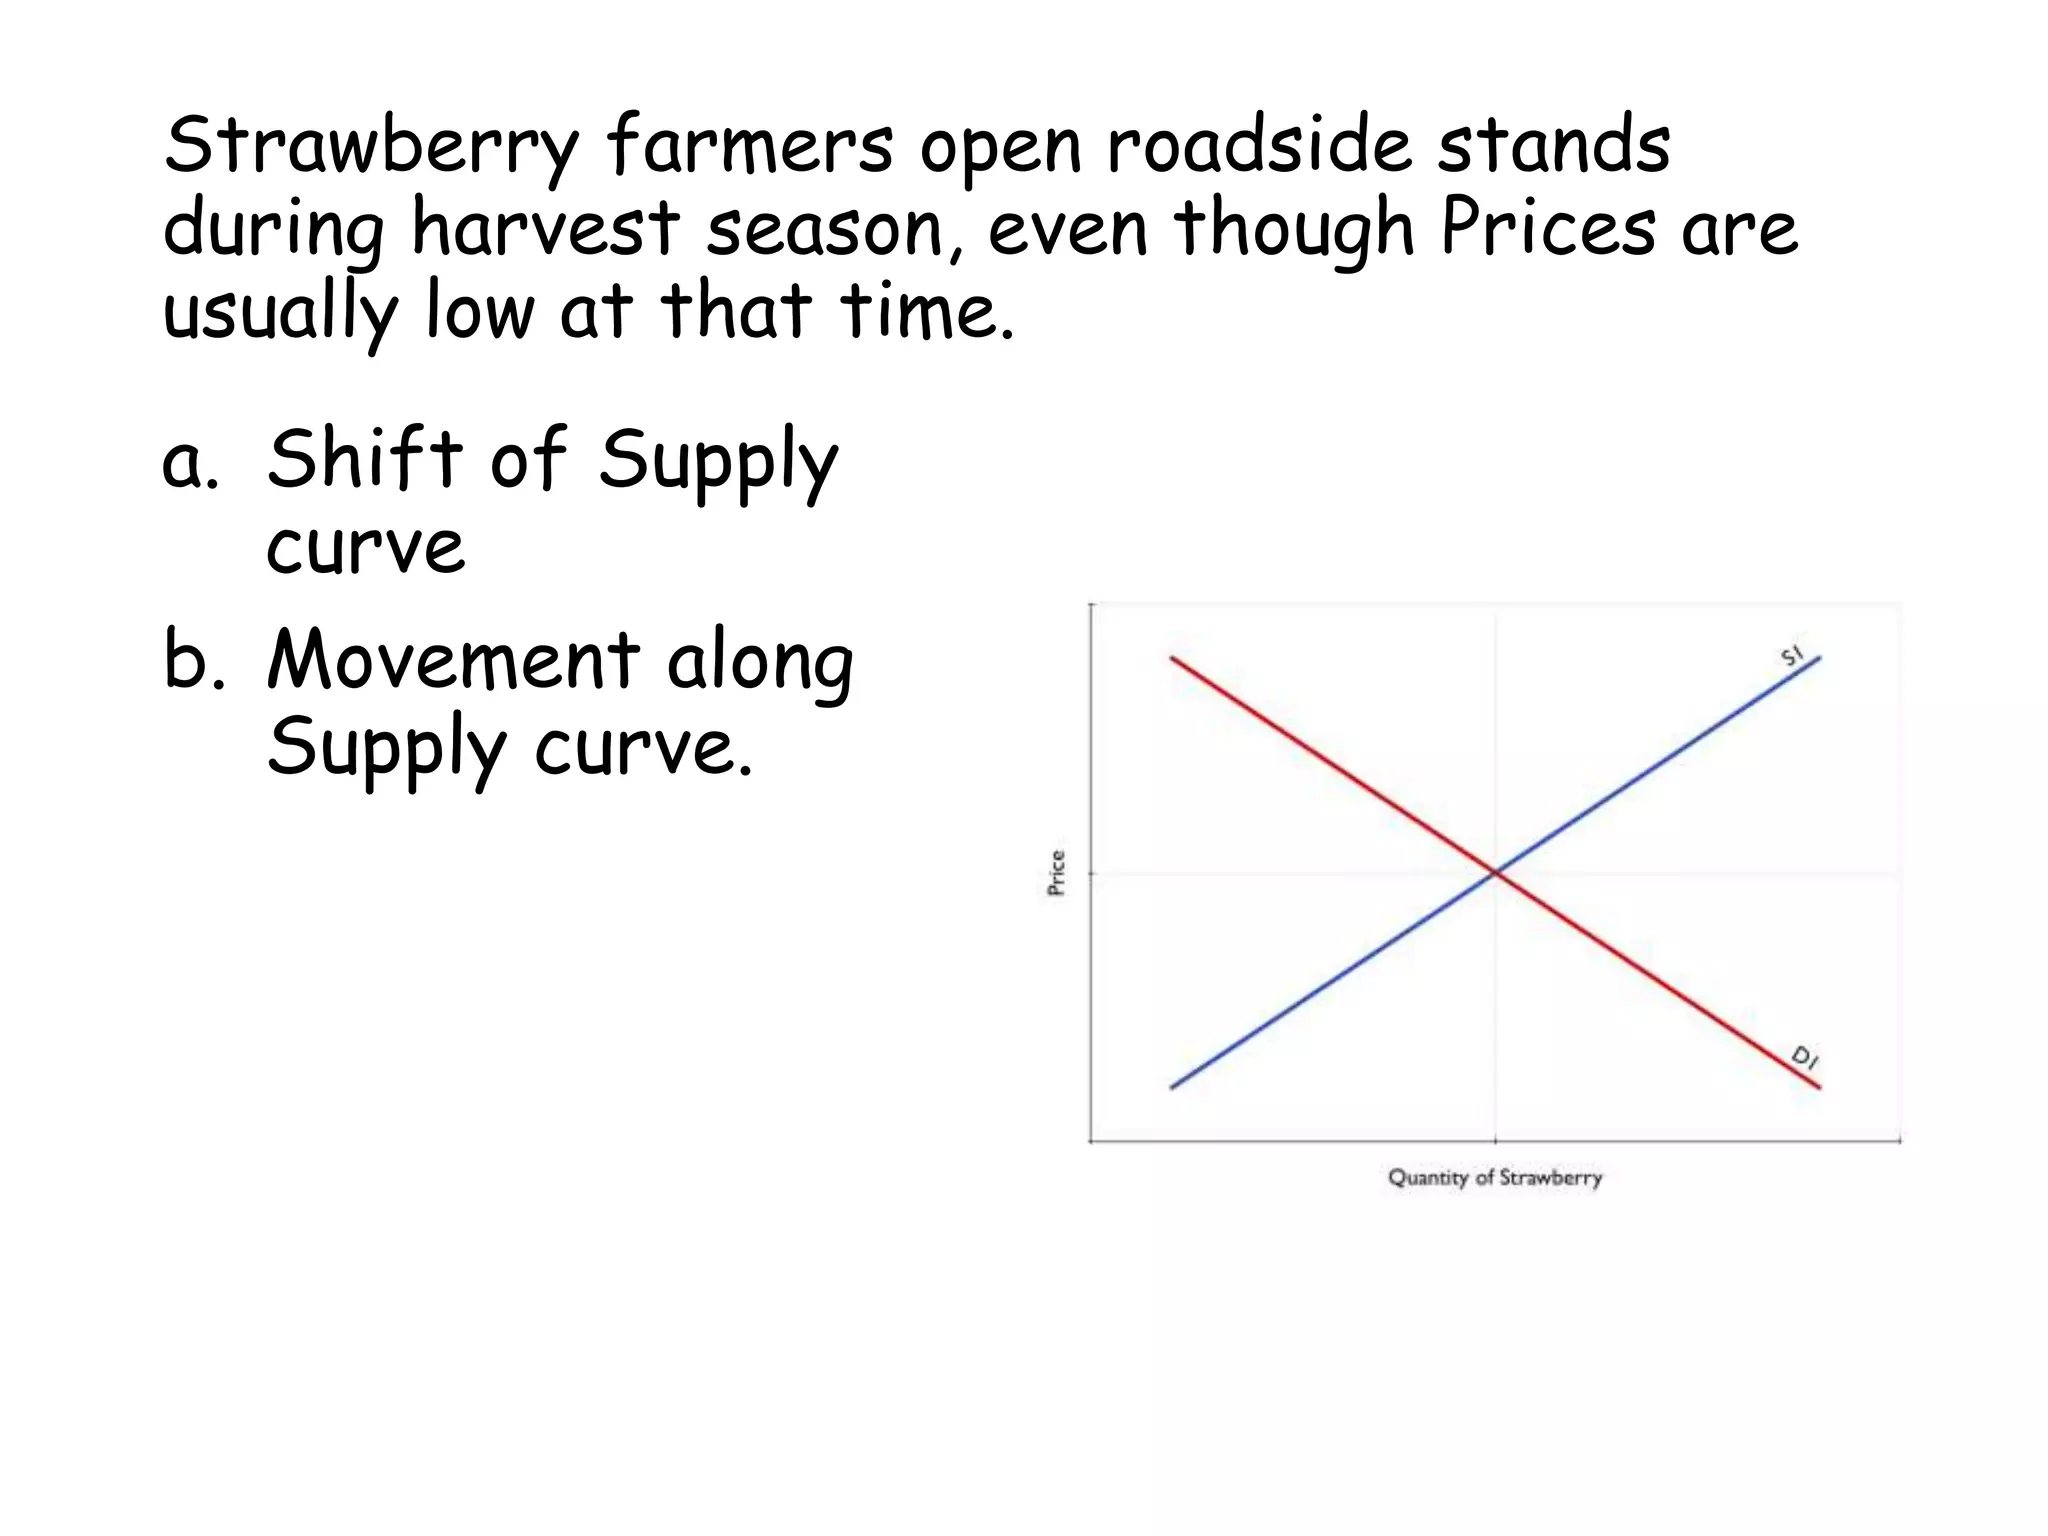
Strawberry farmers openroadside stands
during harvest season, even though Prices are
usually low at that time.
a. Shift of Supply
curve
b. Movement along
Supply curve.
47.
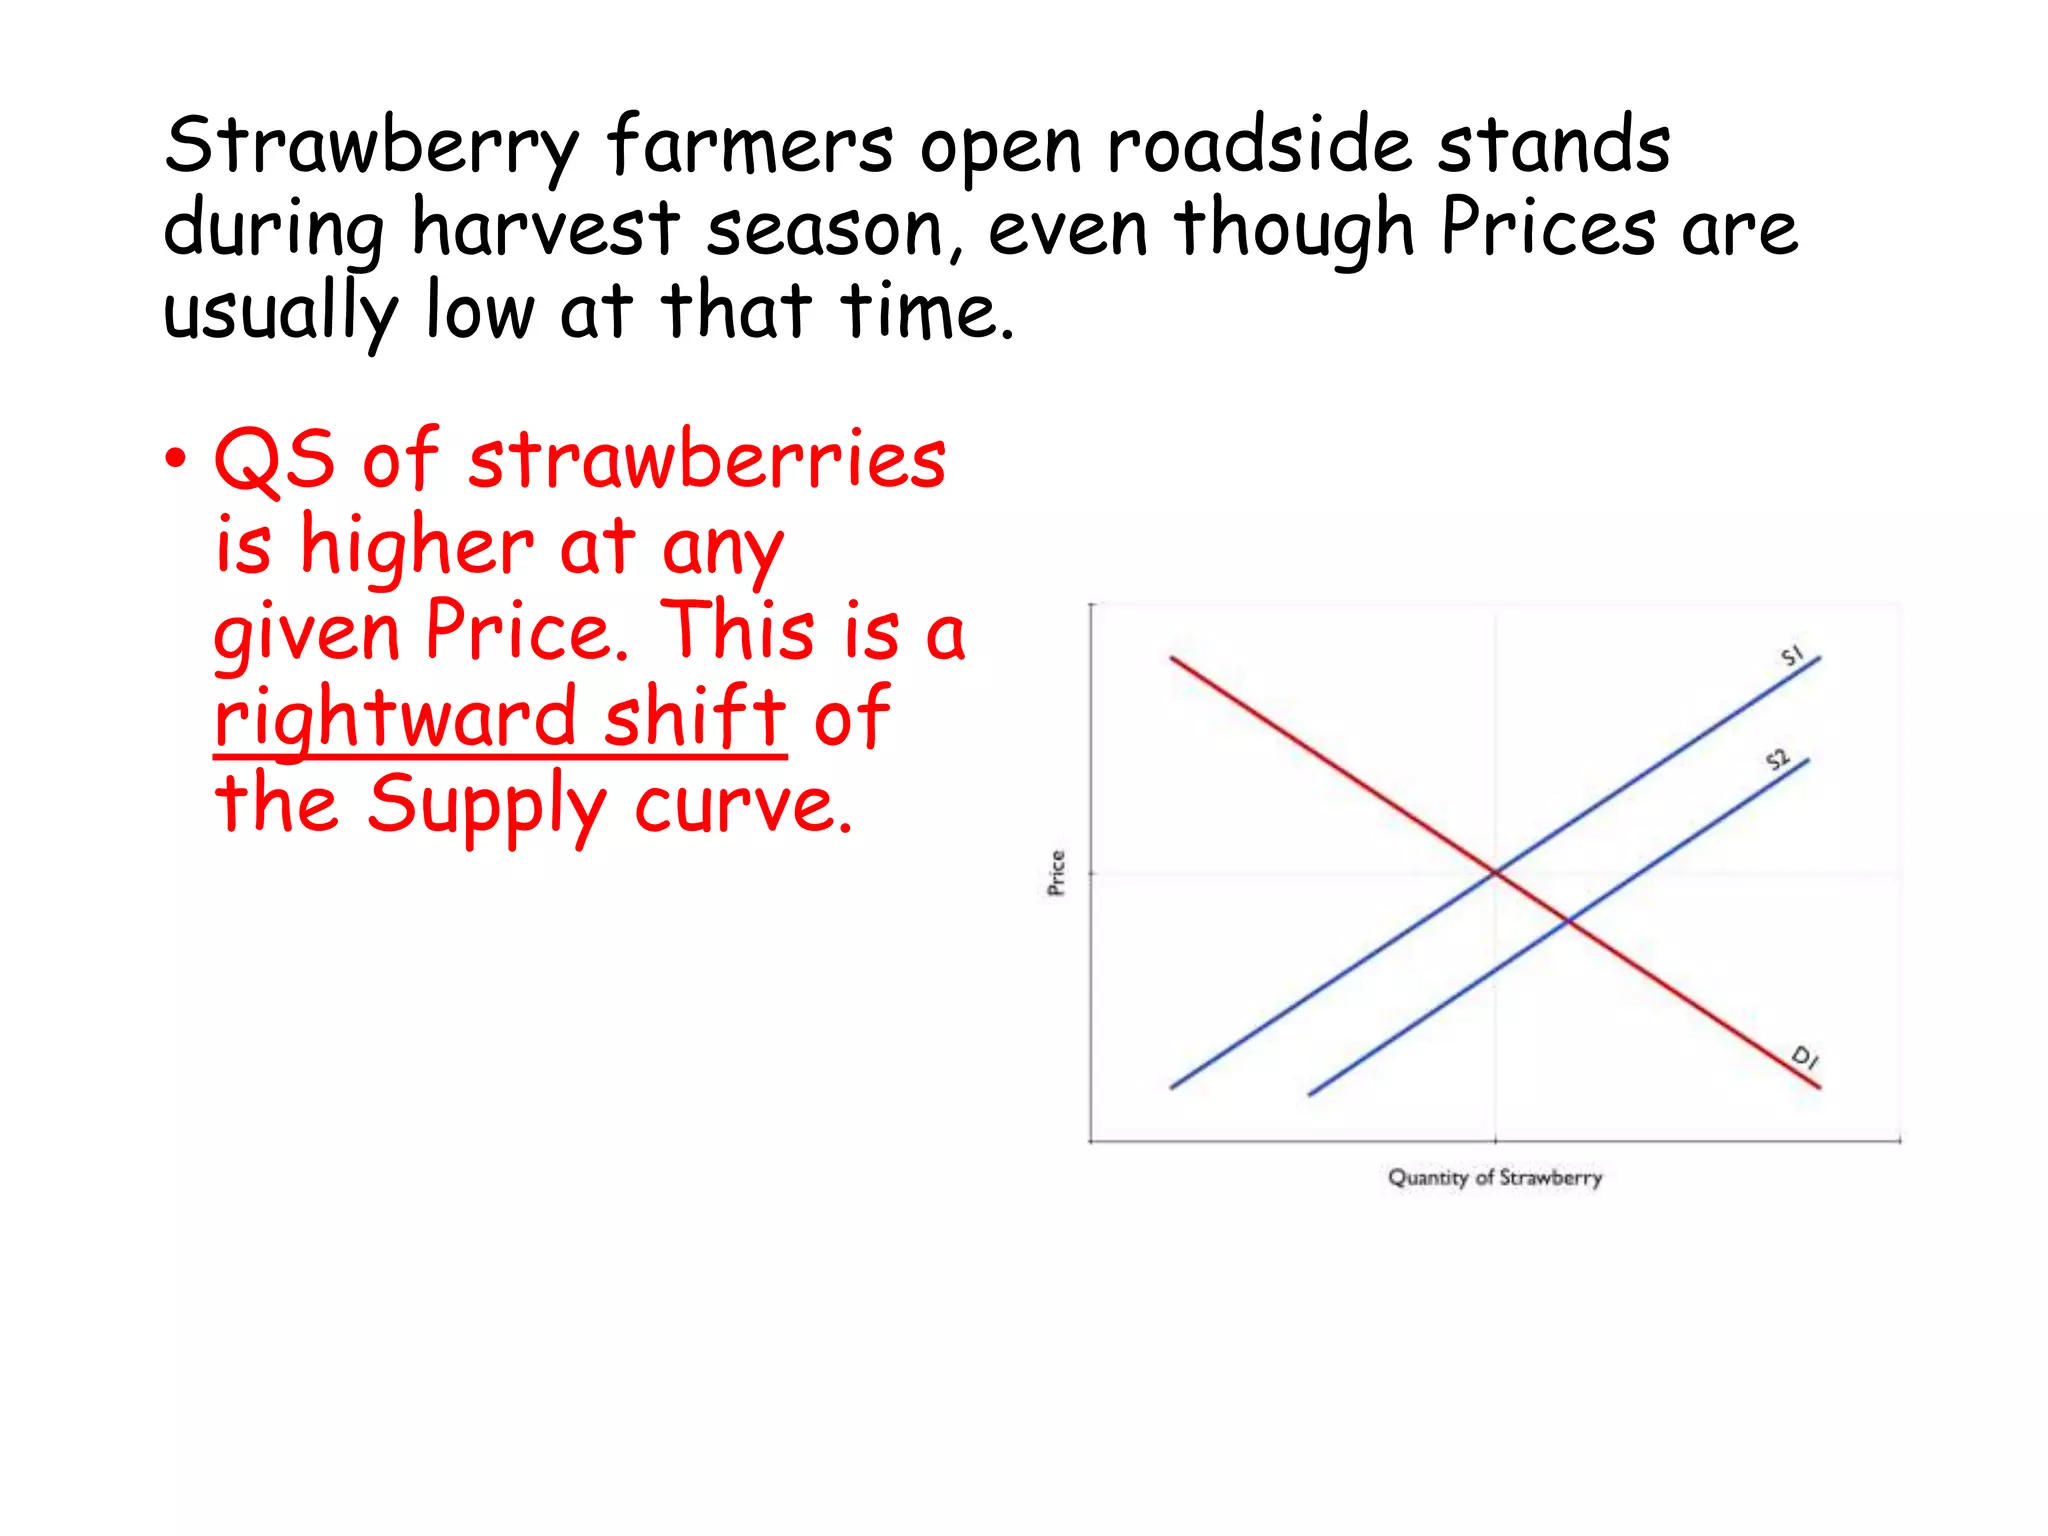
Strawberry farmers openroadside stands
during harvest season, even though Prices are
usually low at that time.
• QS of strawberries
is higher at any
given Price. This is a
rightward shift of
the Supply curve.
48.
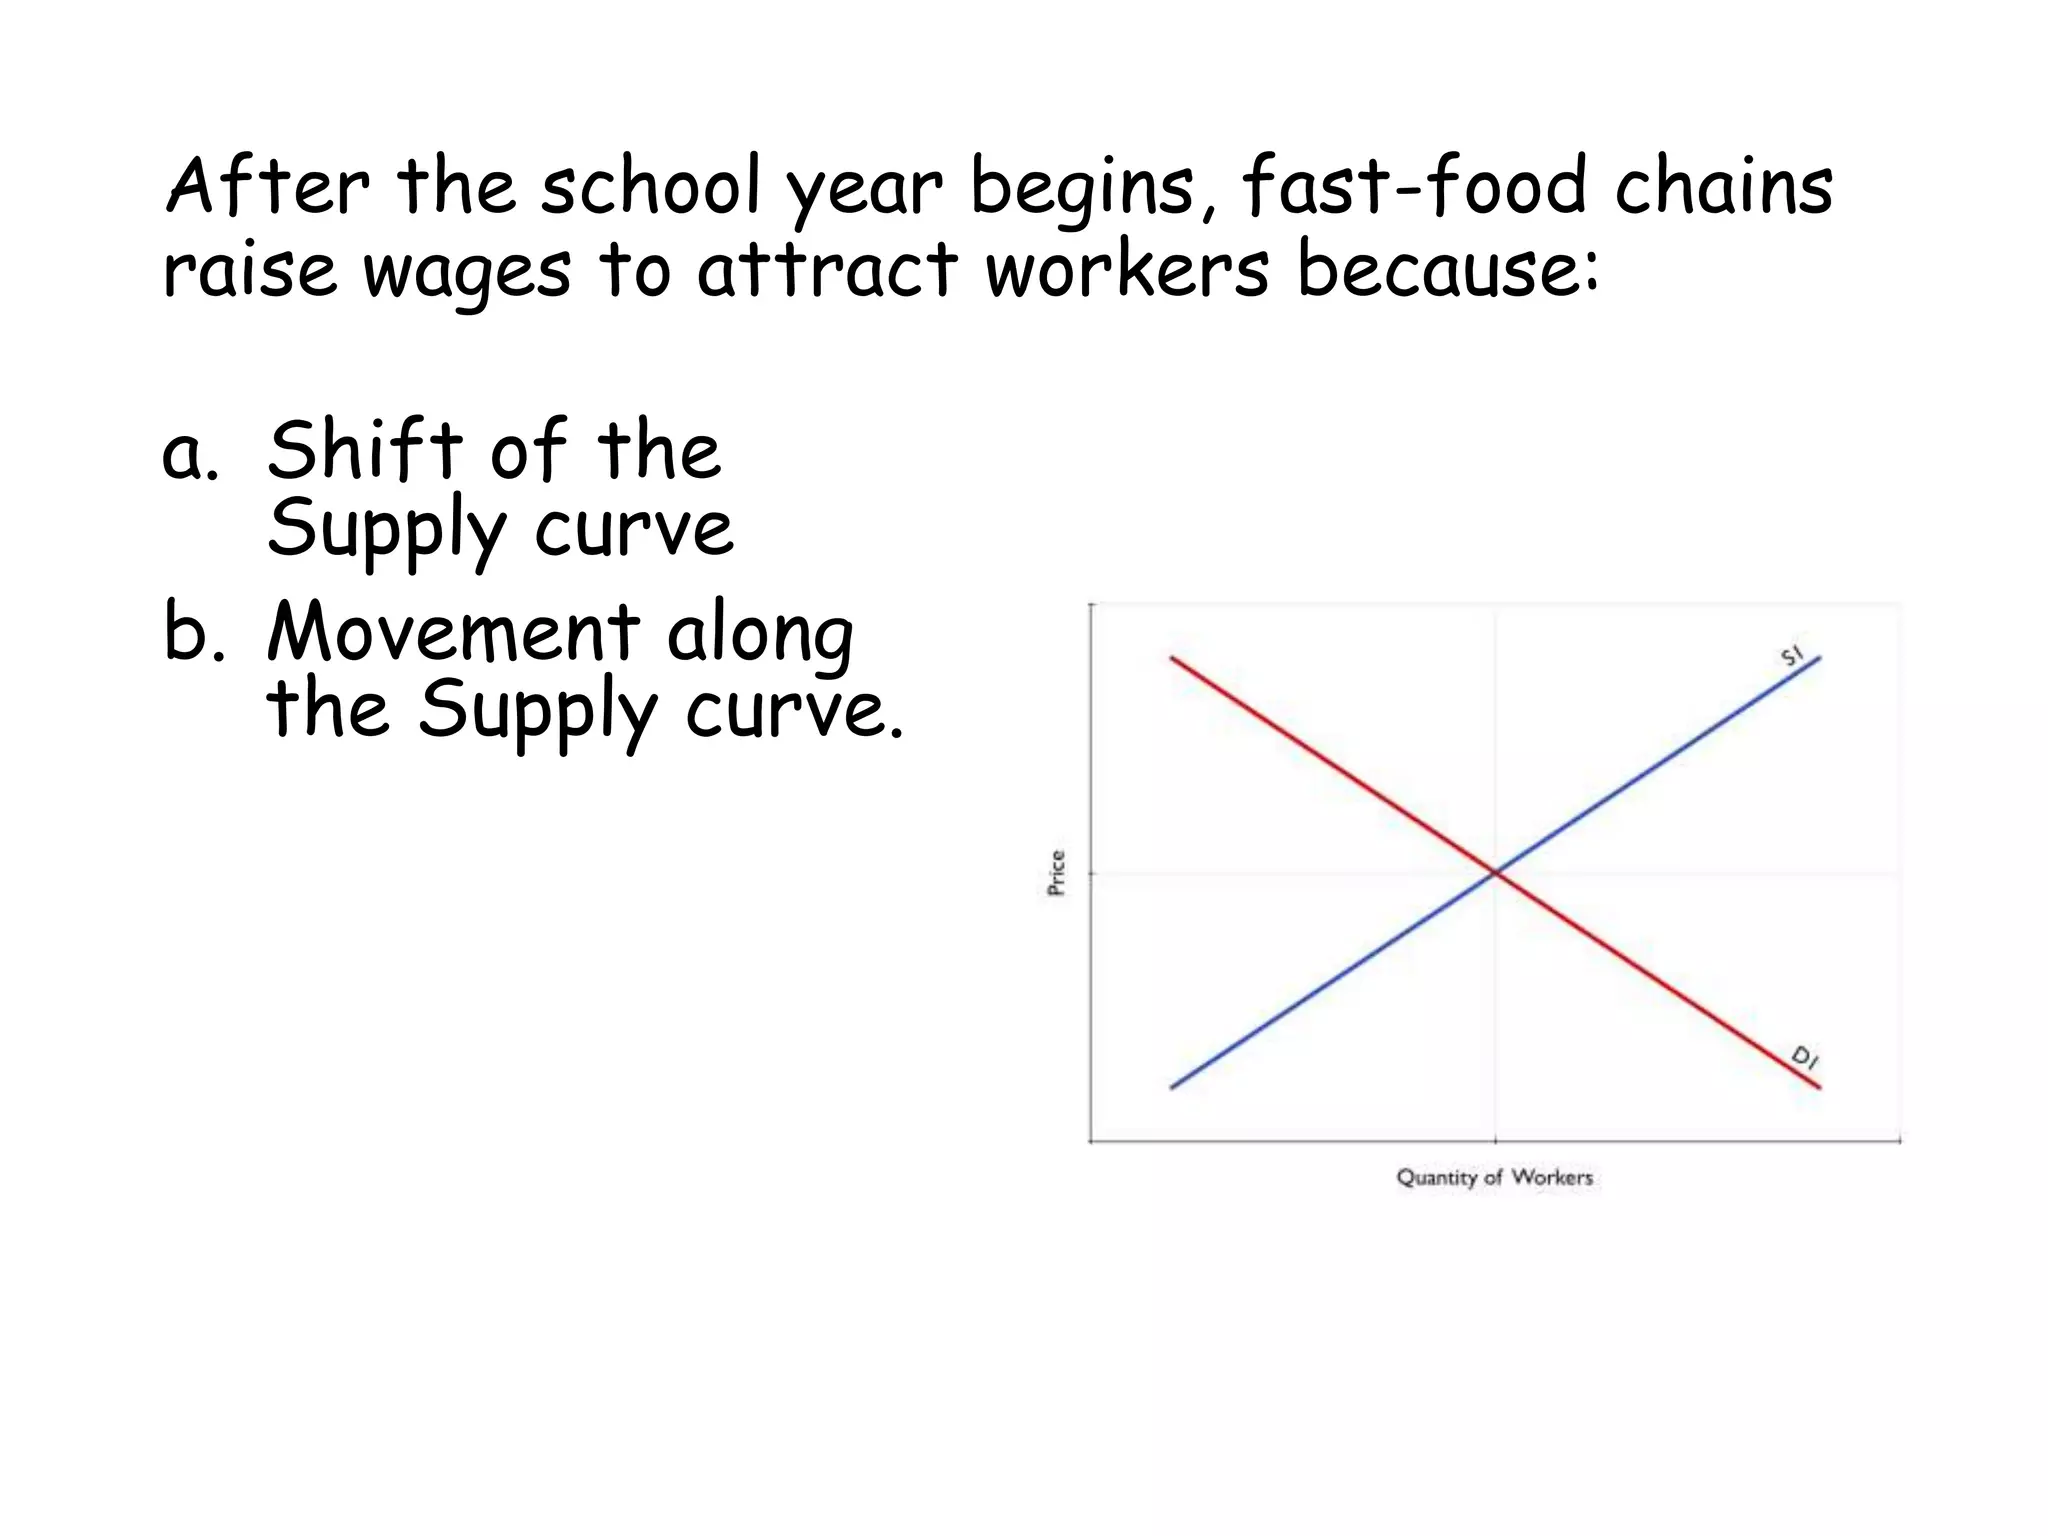
After the schoolyear begins, fast-food chains
raise wages to attract workers because:
a. Shift of the
Supply curve
b. Movement along
the Supply curve.
49.
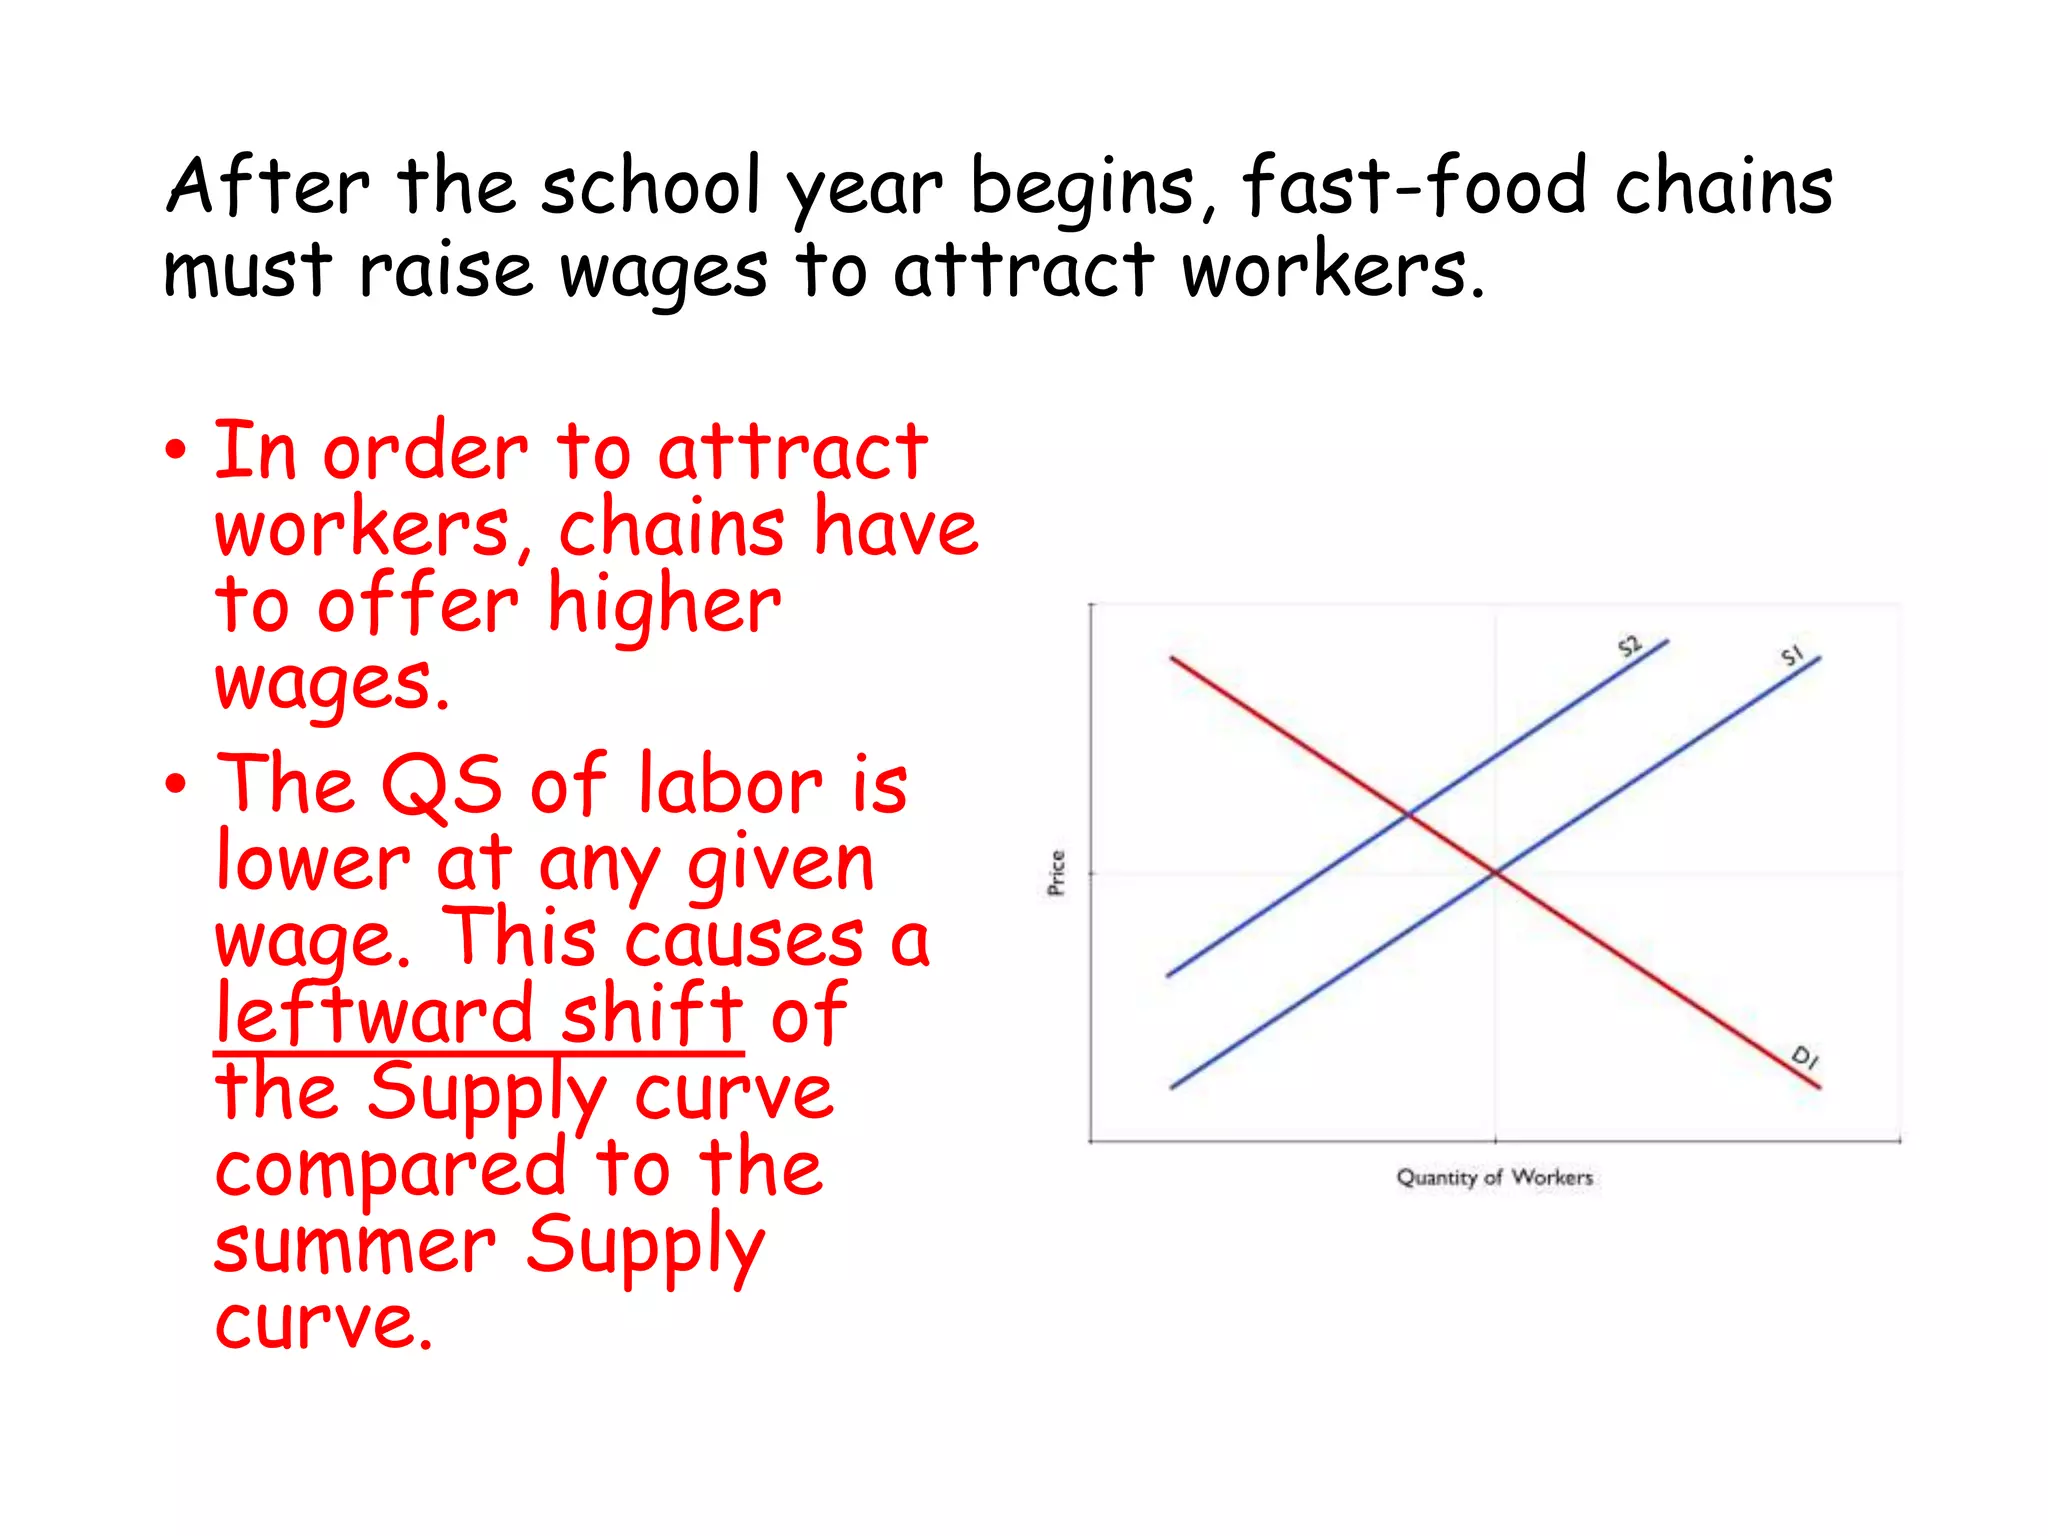
After the schoolyear begins, fast-food chains
must raise wages to attract workers.
• In order to attract
workers, chains have
to offer higher
wages.
• The QS of labor is
lower at any given
wage. This causes a
leftward shift of
the Supply curve
compared to the
summer Supply
curve.
50.
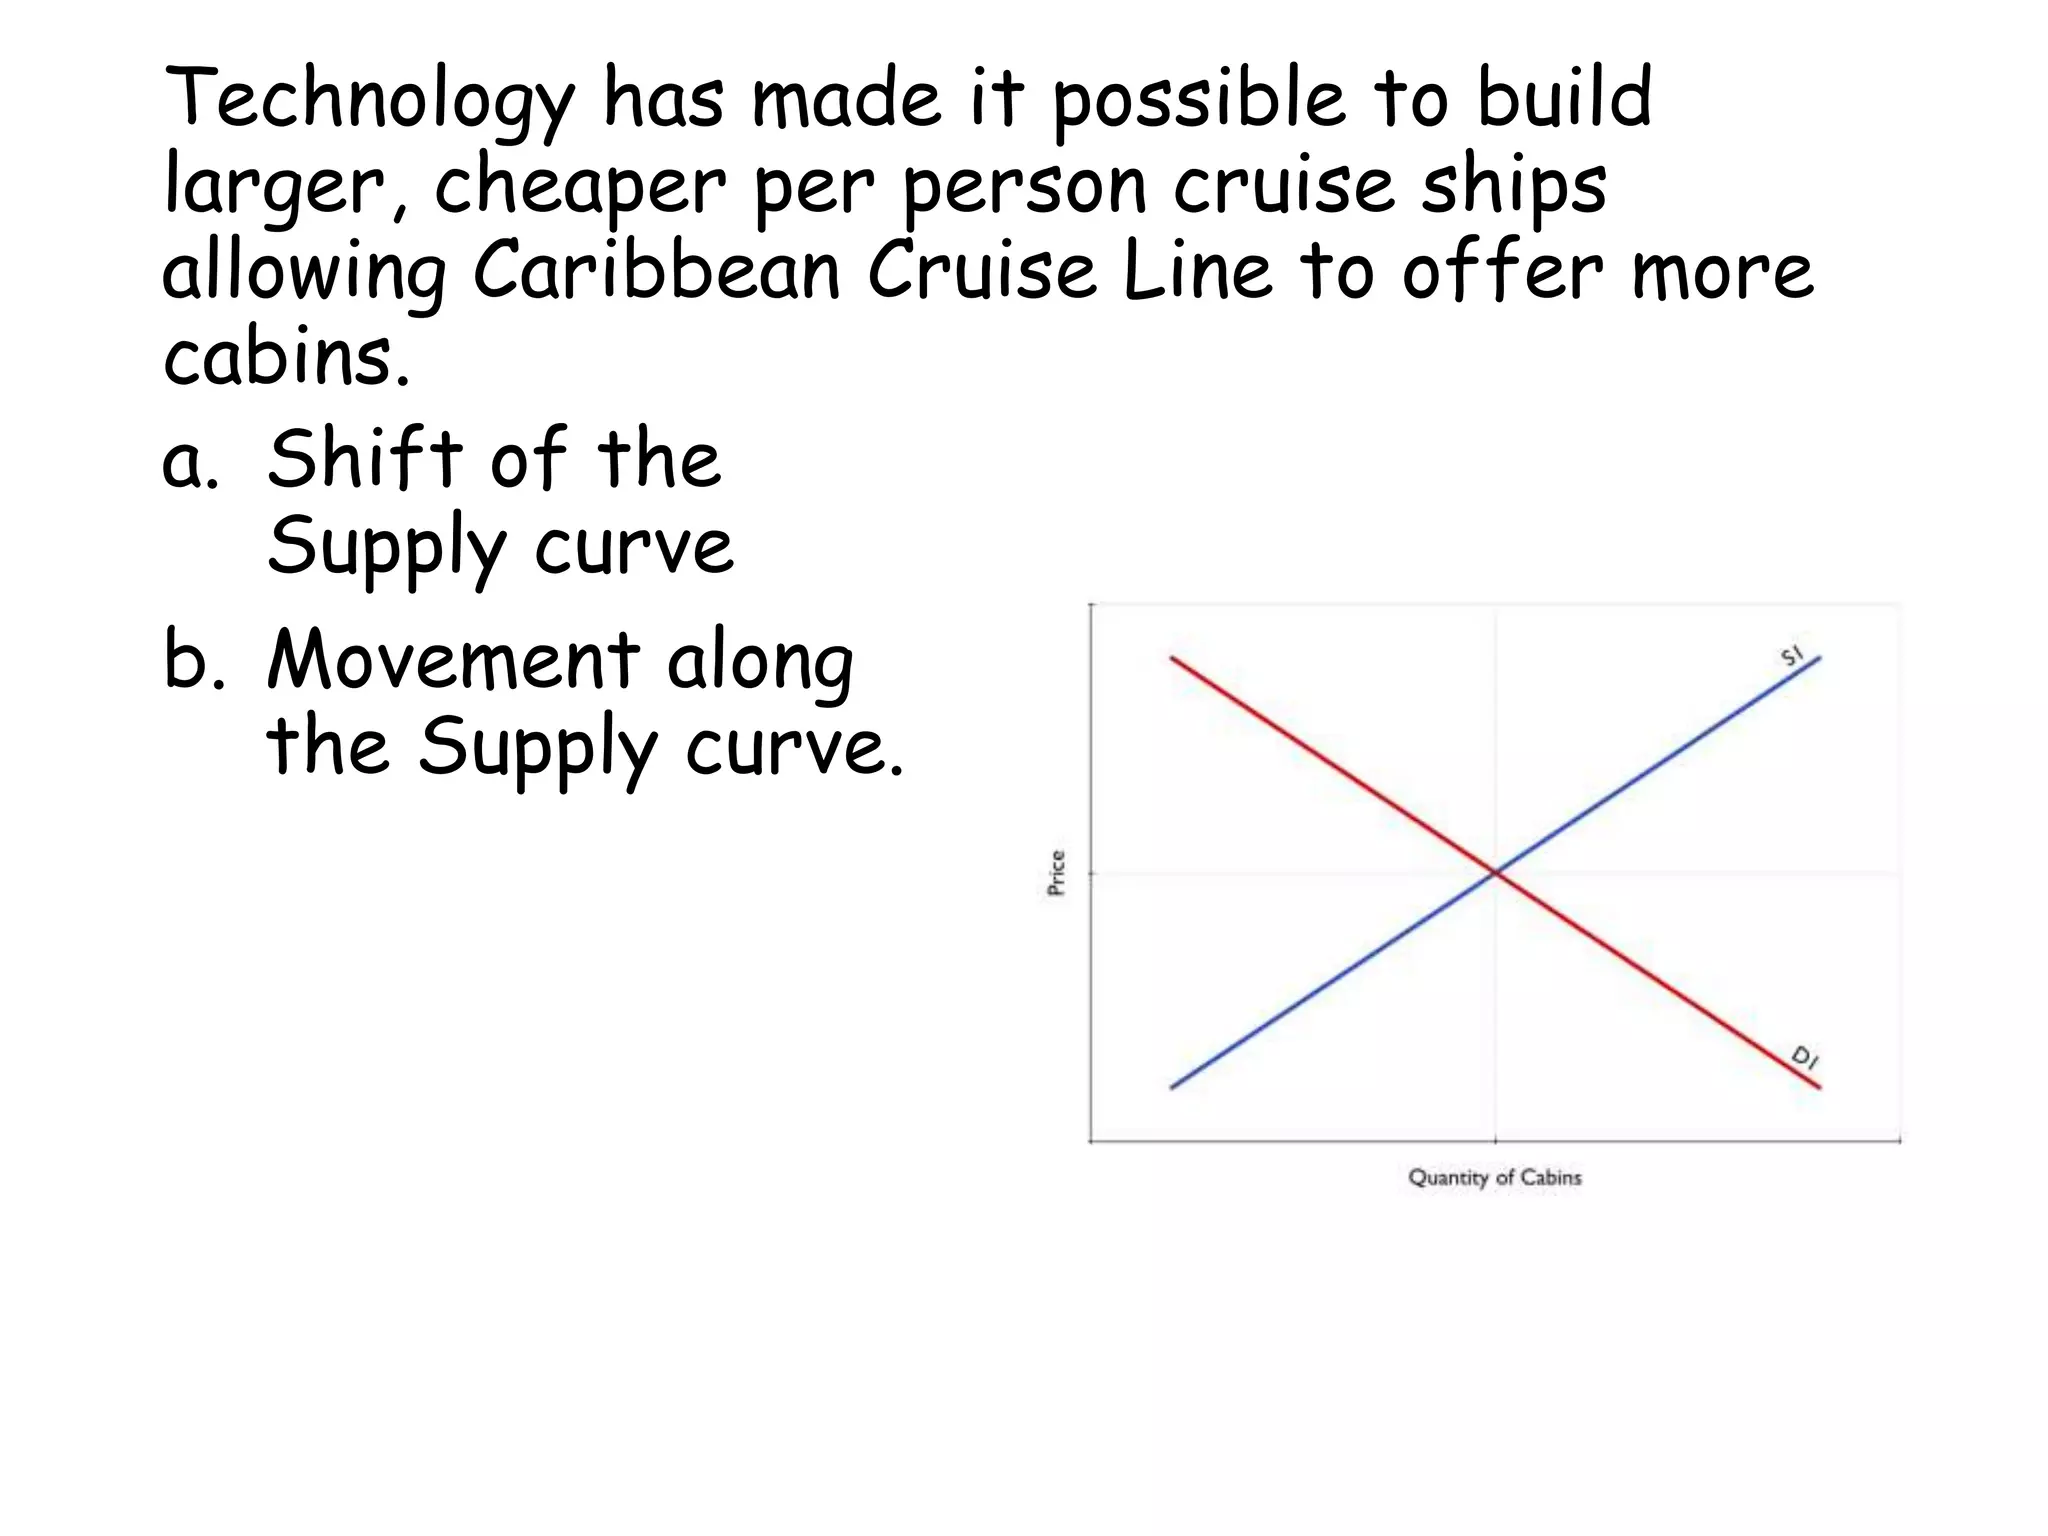
Technology has madeit possible to build
larger, cheaper per person cruise ships
allowing Caribbean Cruise Line to offer more
cabins.
a. Shift of the
Supply curve
b. Movement along
the Supply curve.
51.
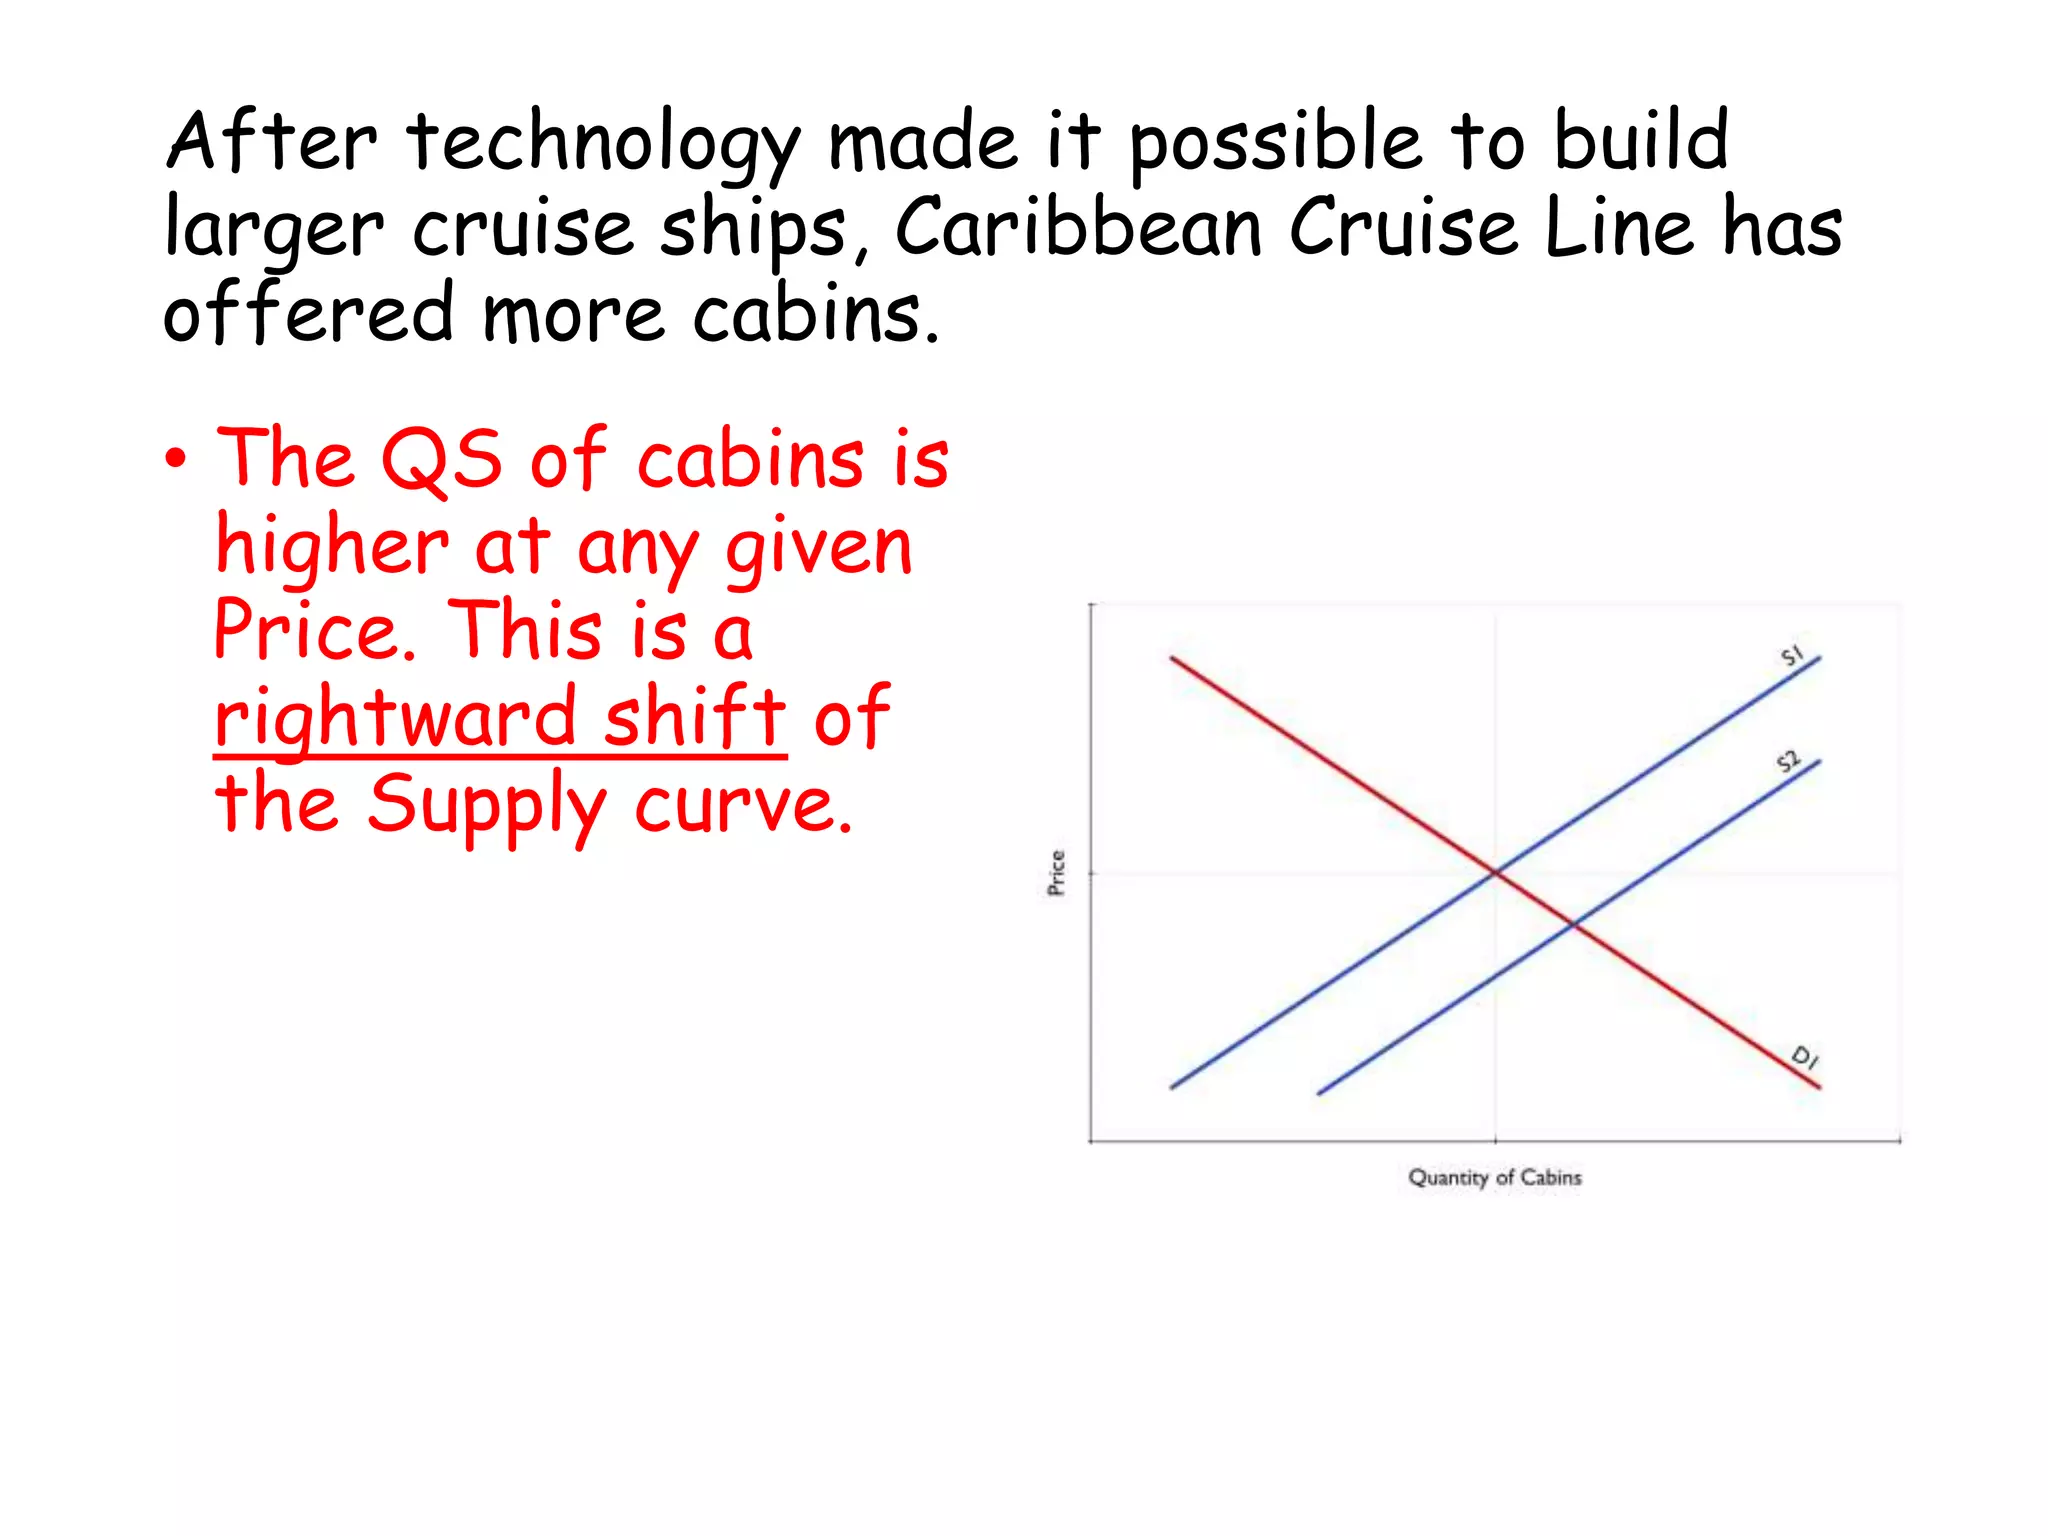
After technology madeit possible to build
larger cruise ships, Caribbean Cruise Line has
offered more cabins.
• The QS of cabins is
higher at any given
Price. This is a
rightward shift of
the Supply curve.
52.
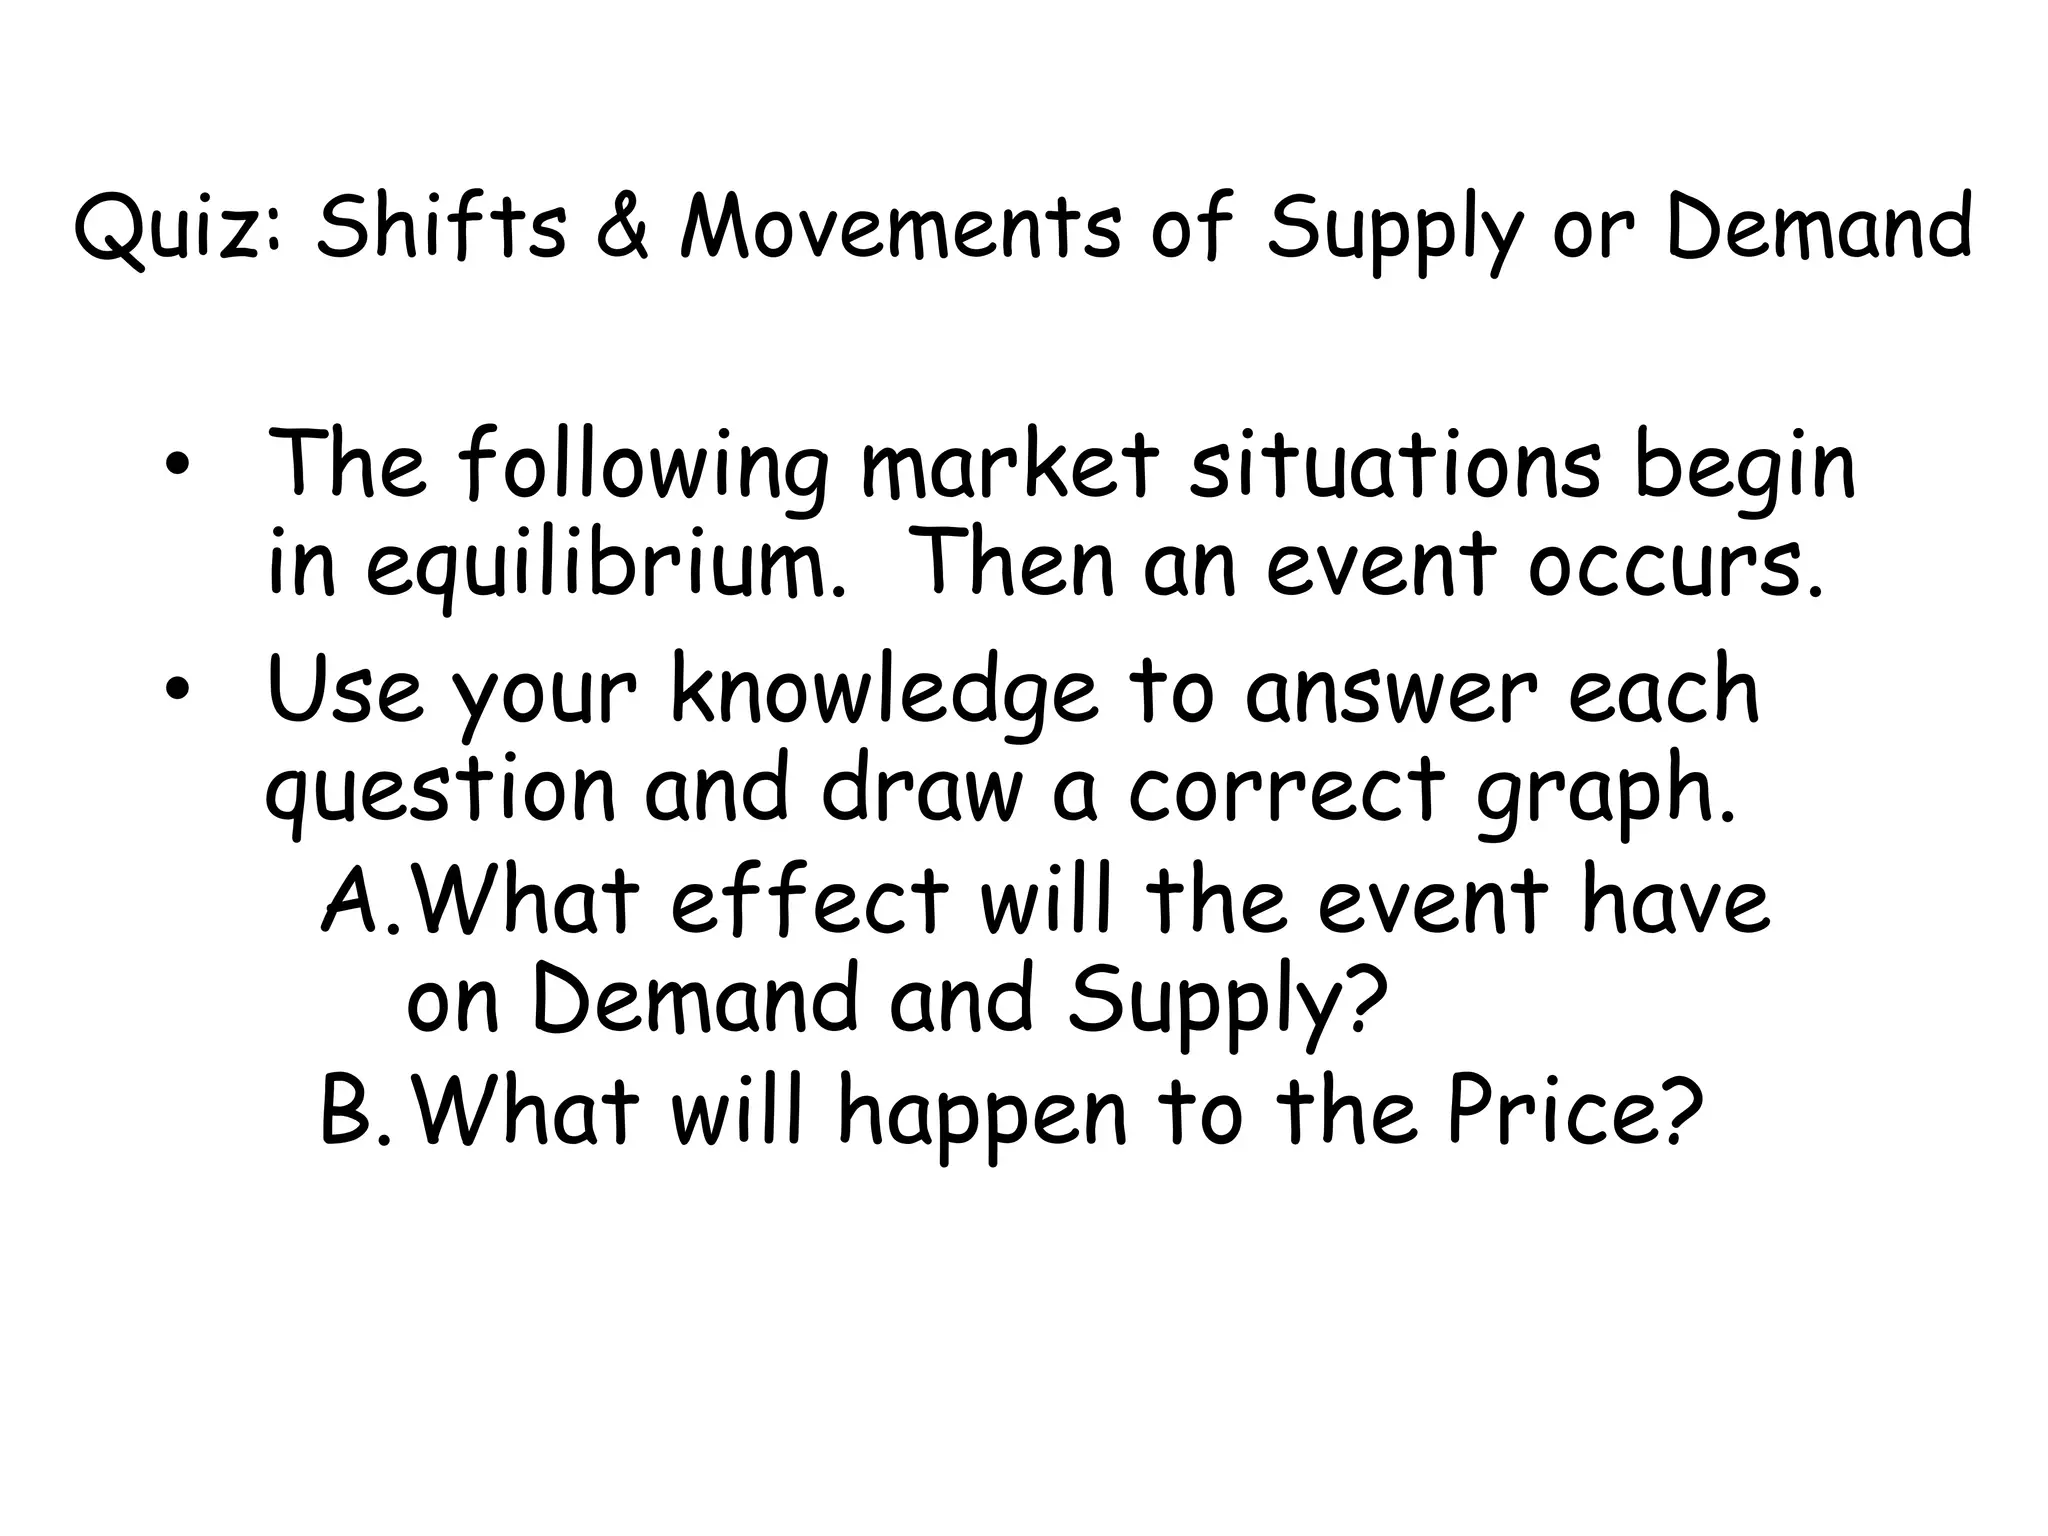
Quiz: Shifts &Movements of Supply or Demand
• The following market situations begin
in equilibrium. Then an event occurs.
• Use your knowledge to answer each
question and draw a correct graph.
A.What effect will the event have
on Demand and Supply?
B.What will happen to the Price?
53.
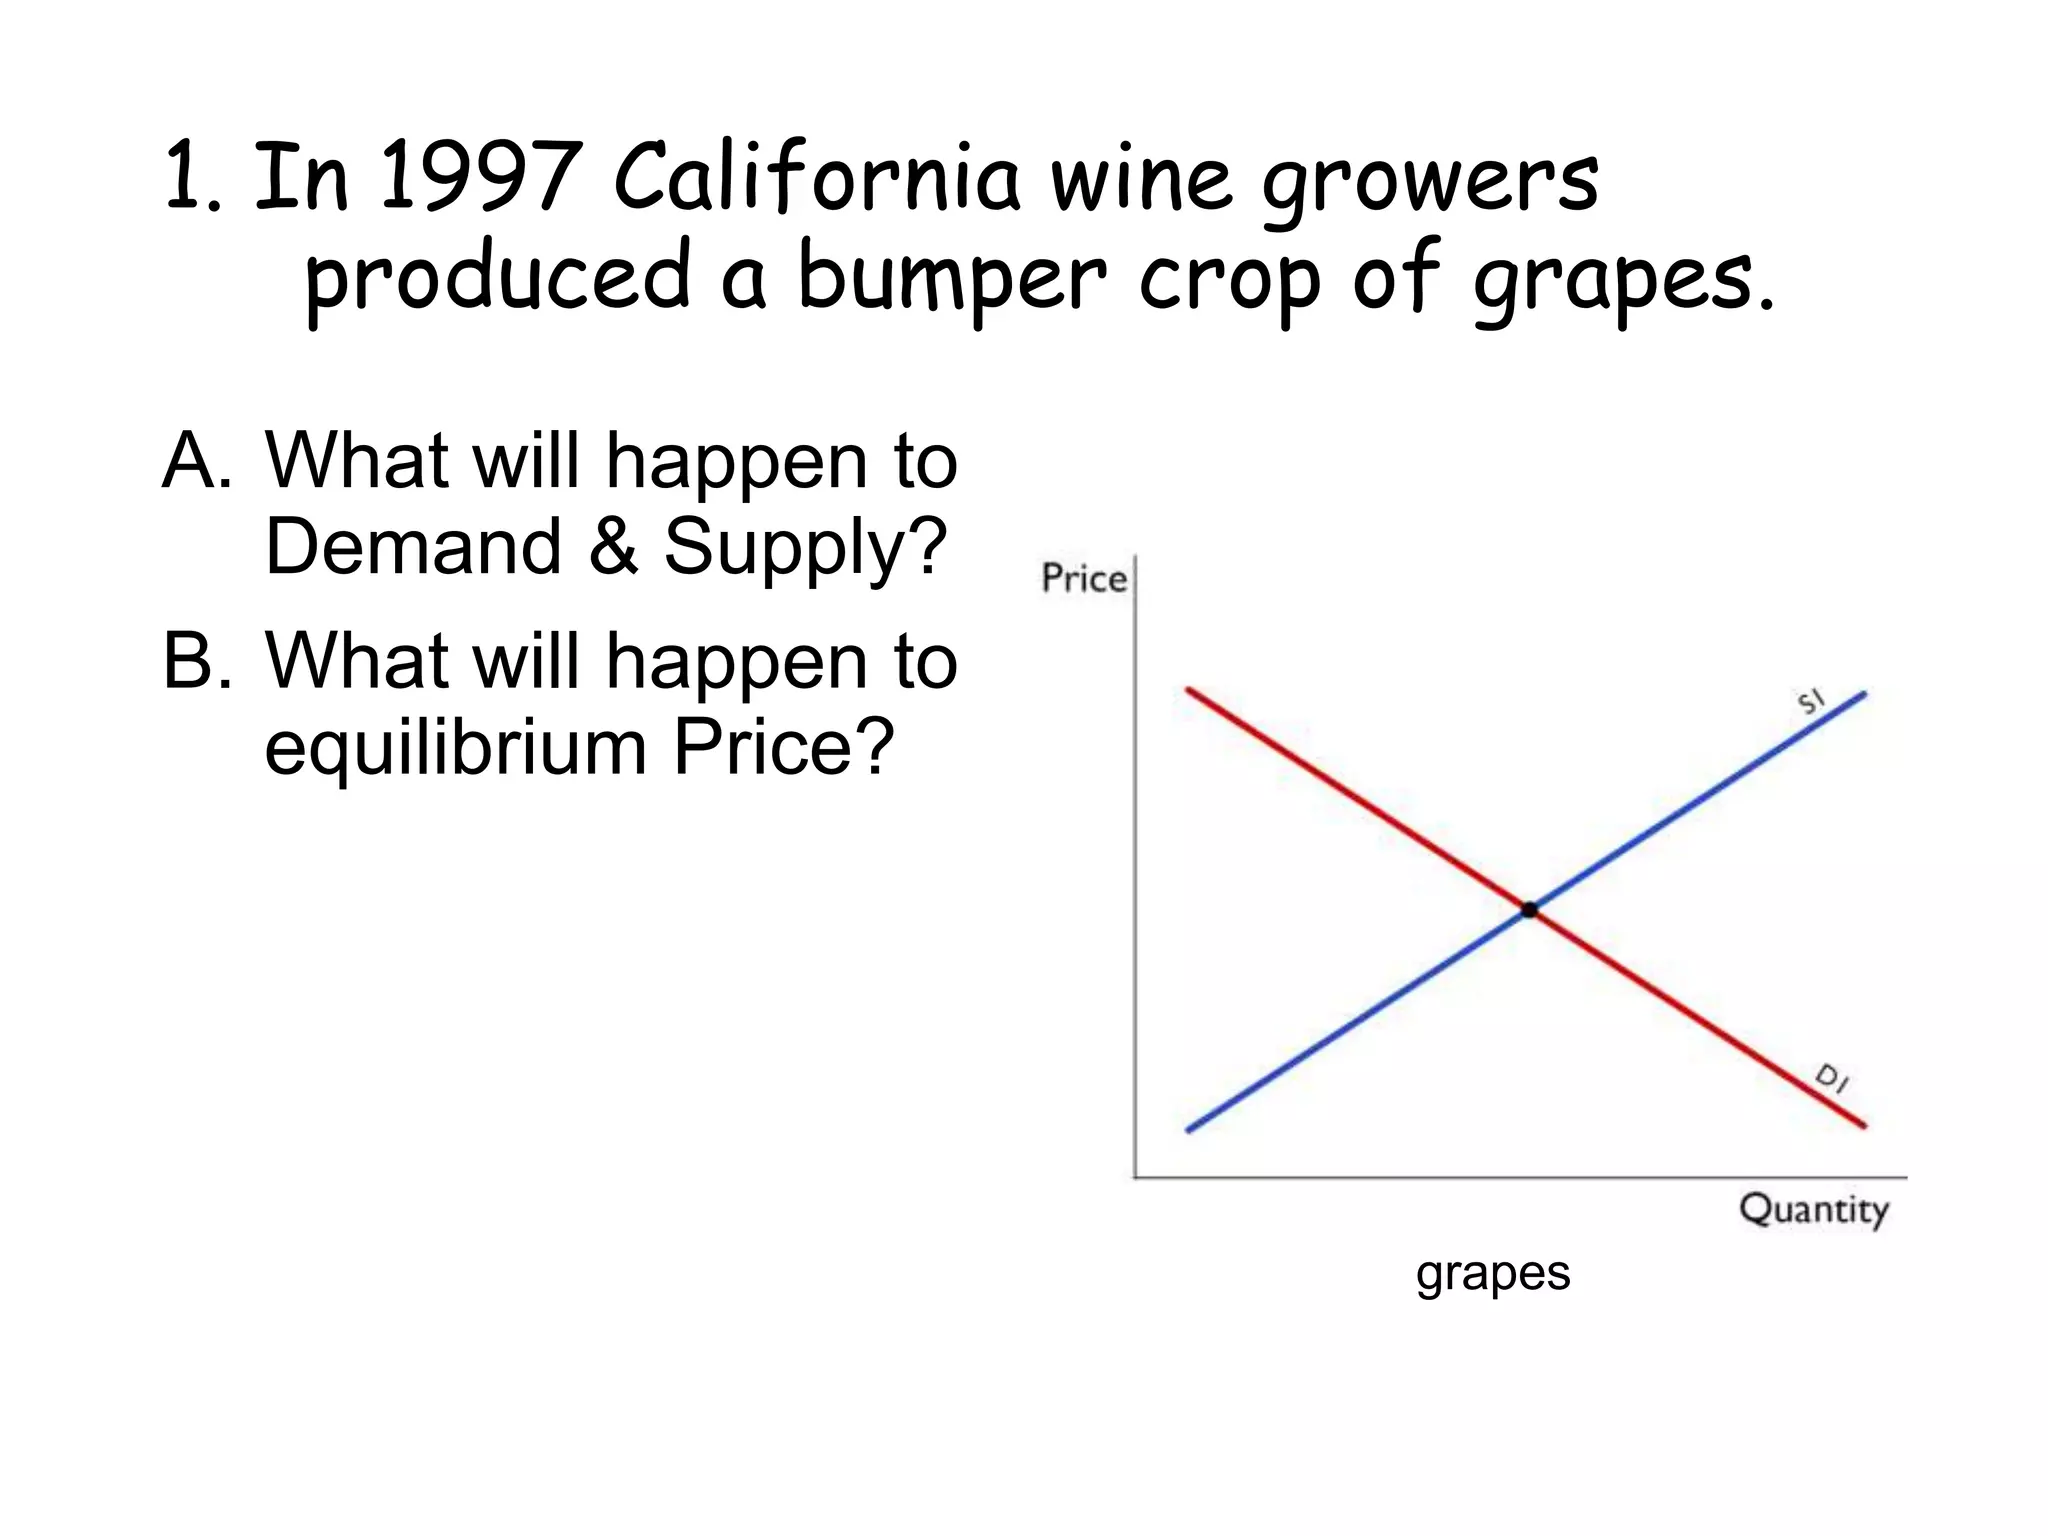
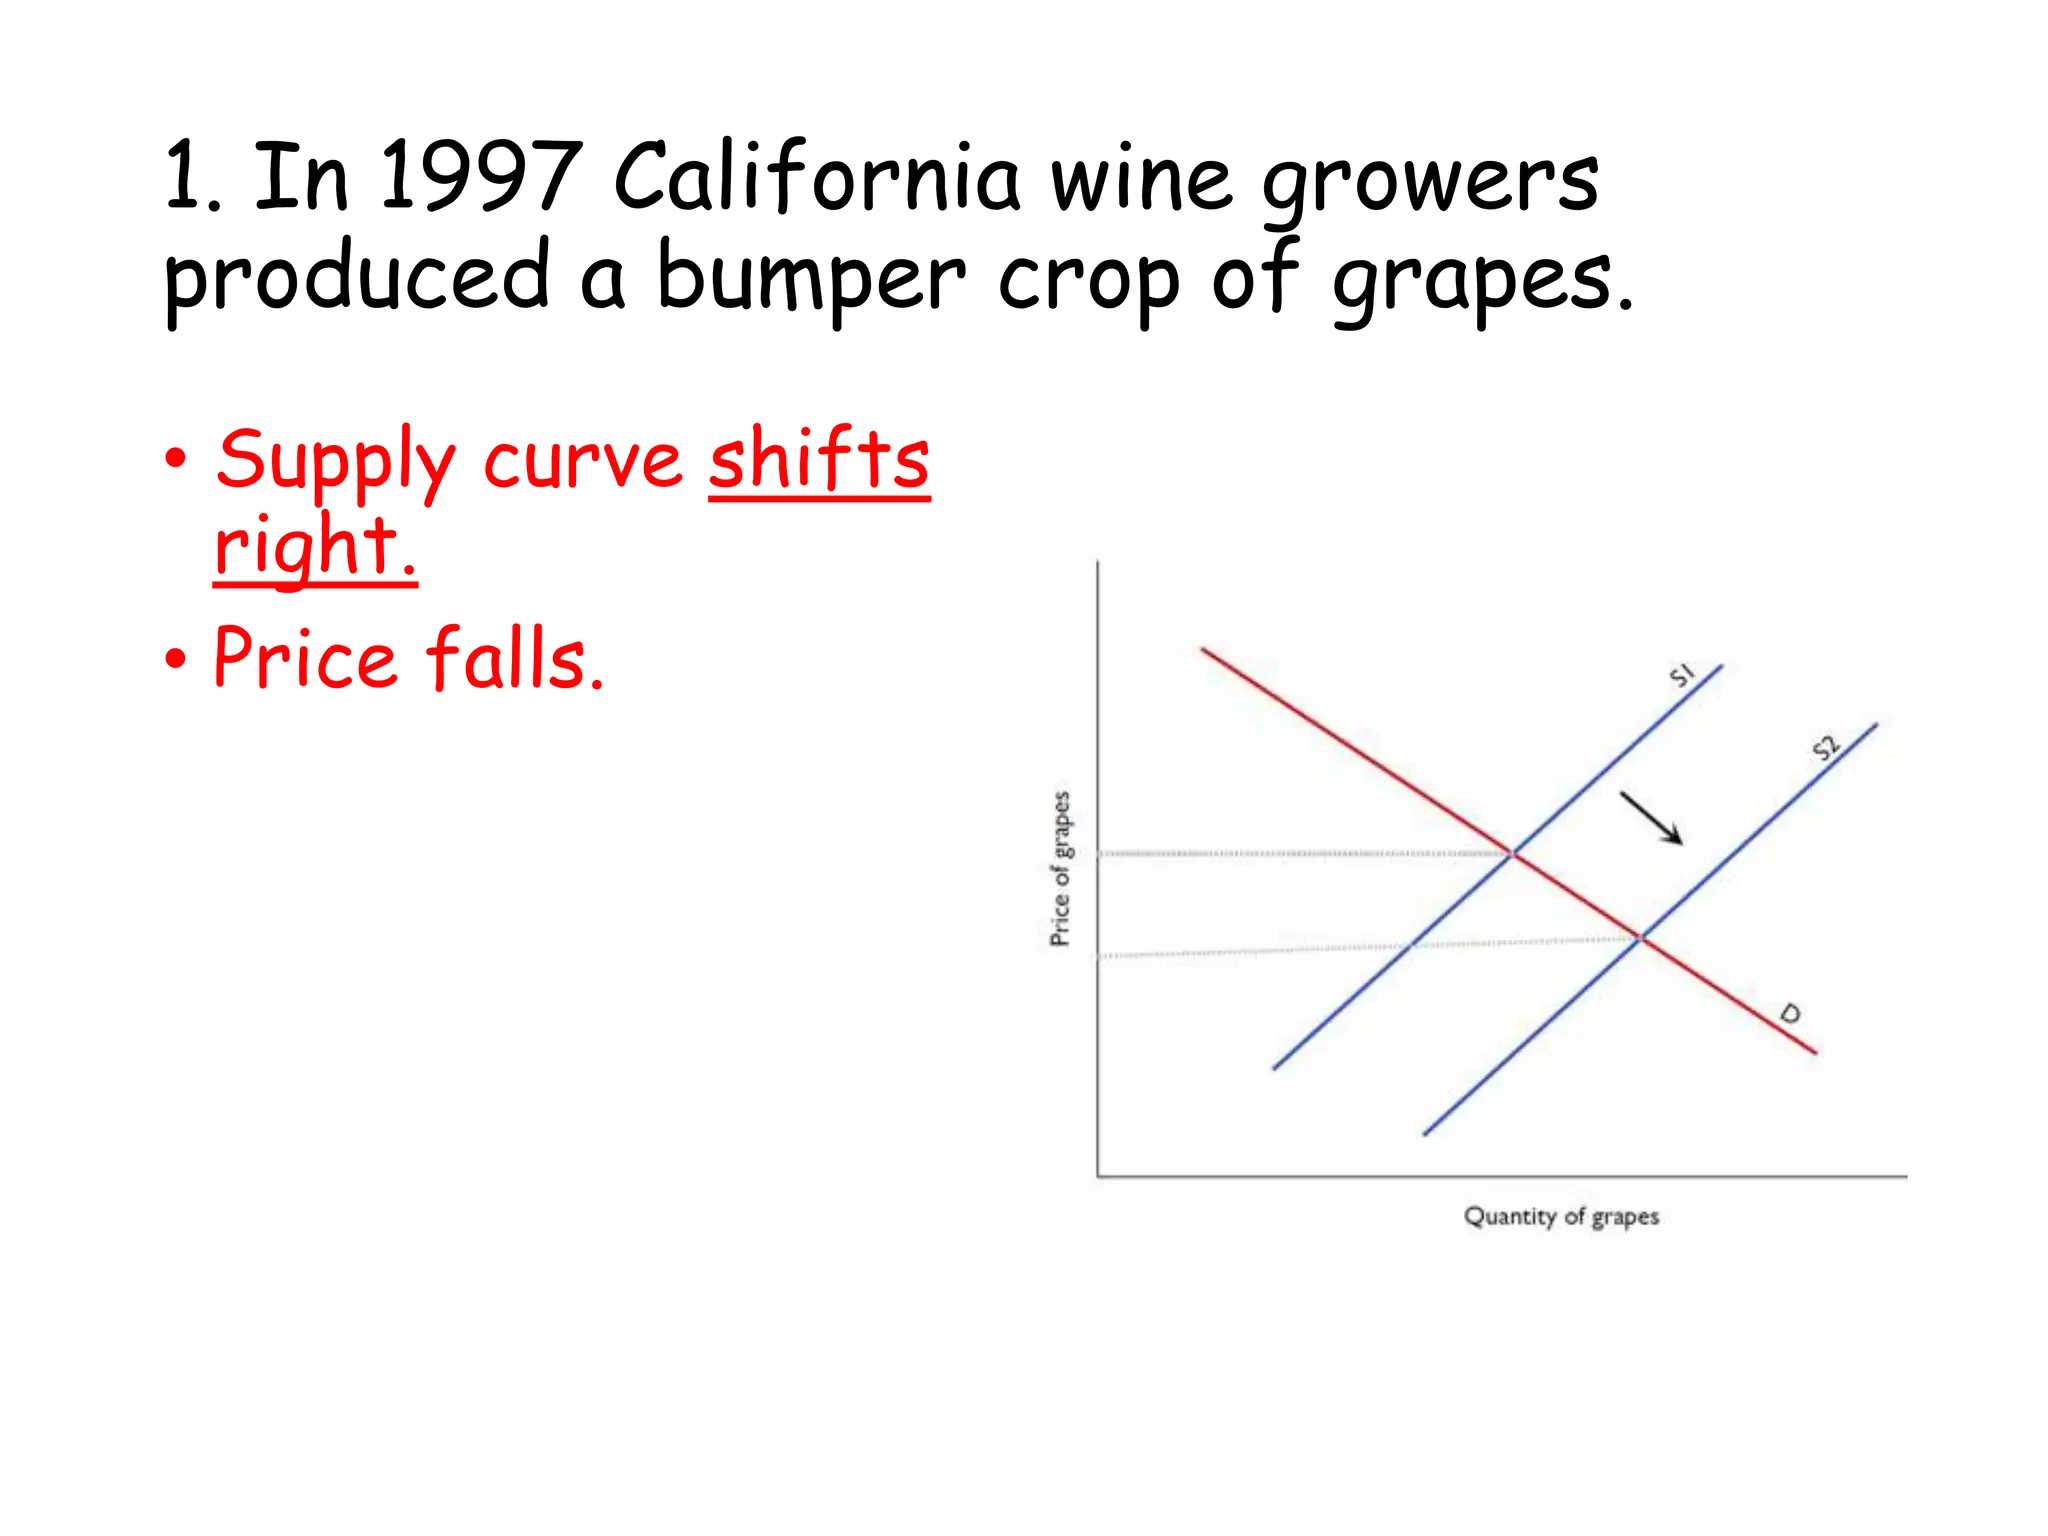
1. In 1997California wine growers
produced a bumper crop of grapes.
A. What will happen to
Demand & Supply?
B. What will happen to
equilibrium Price?
grapes
54.
1. In 1997California wine growers
produced a bumper crop of grapes.
• Supply curve shifts
right.
• Price falls.
55.
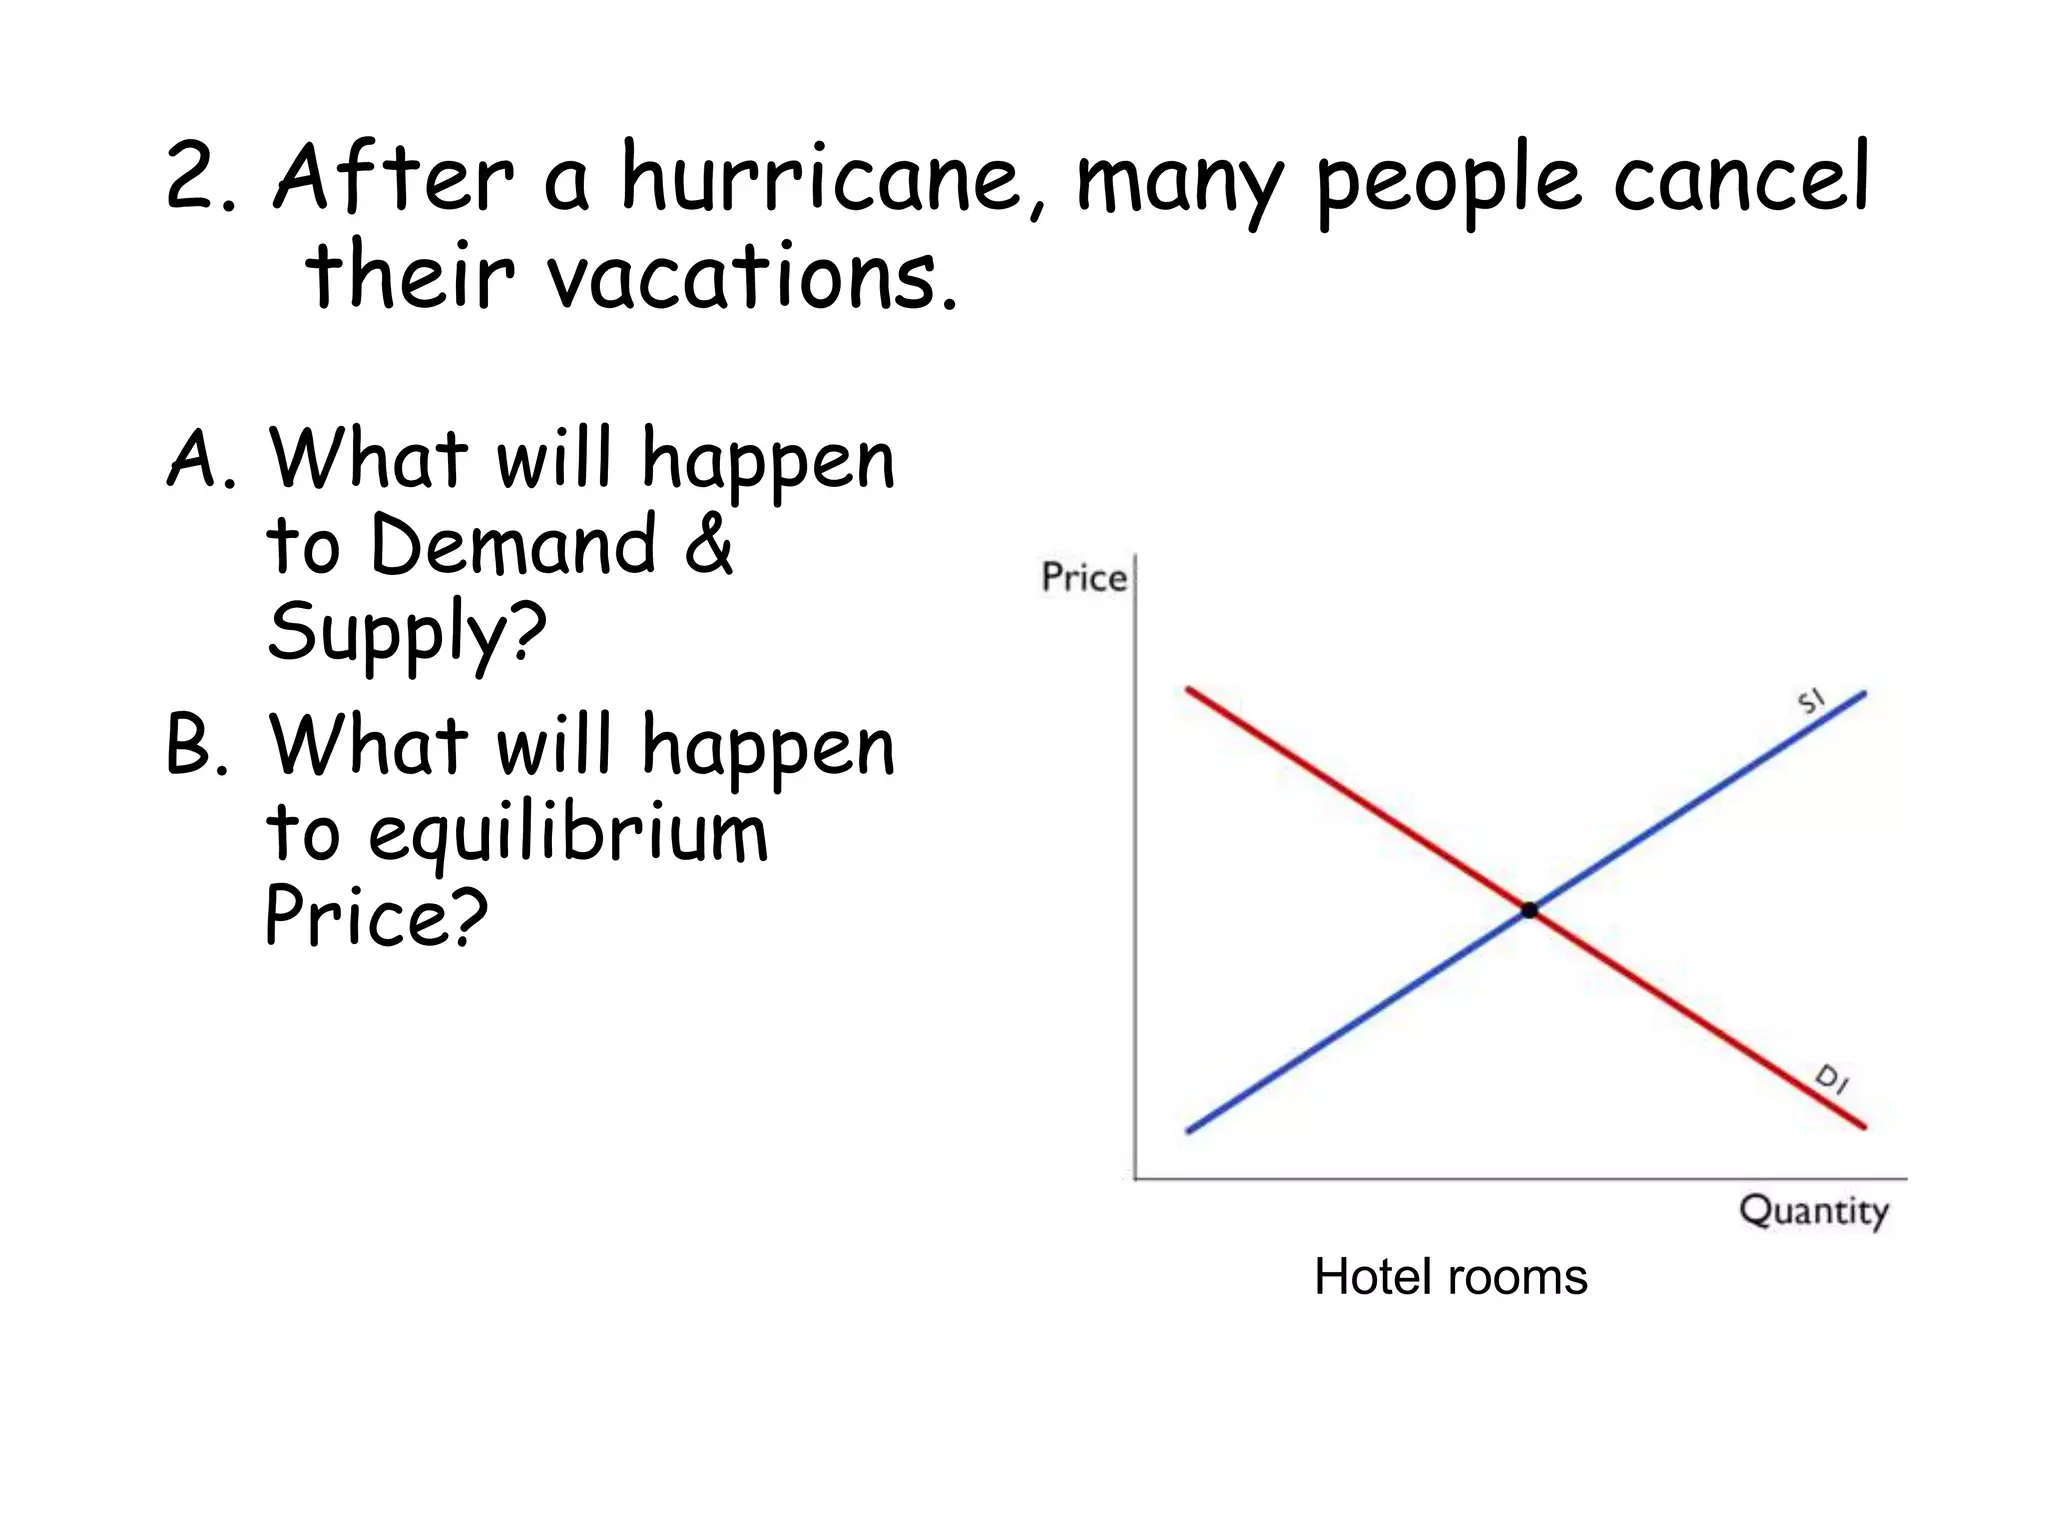
2. After ahurricane, many people cancel
their vacations.
A. What will happen
to Demand &
Supply?
B. What will happen
to equilibrium
Price?
Hotel rooms
56.
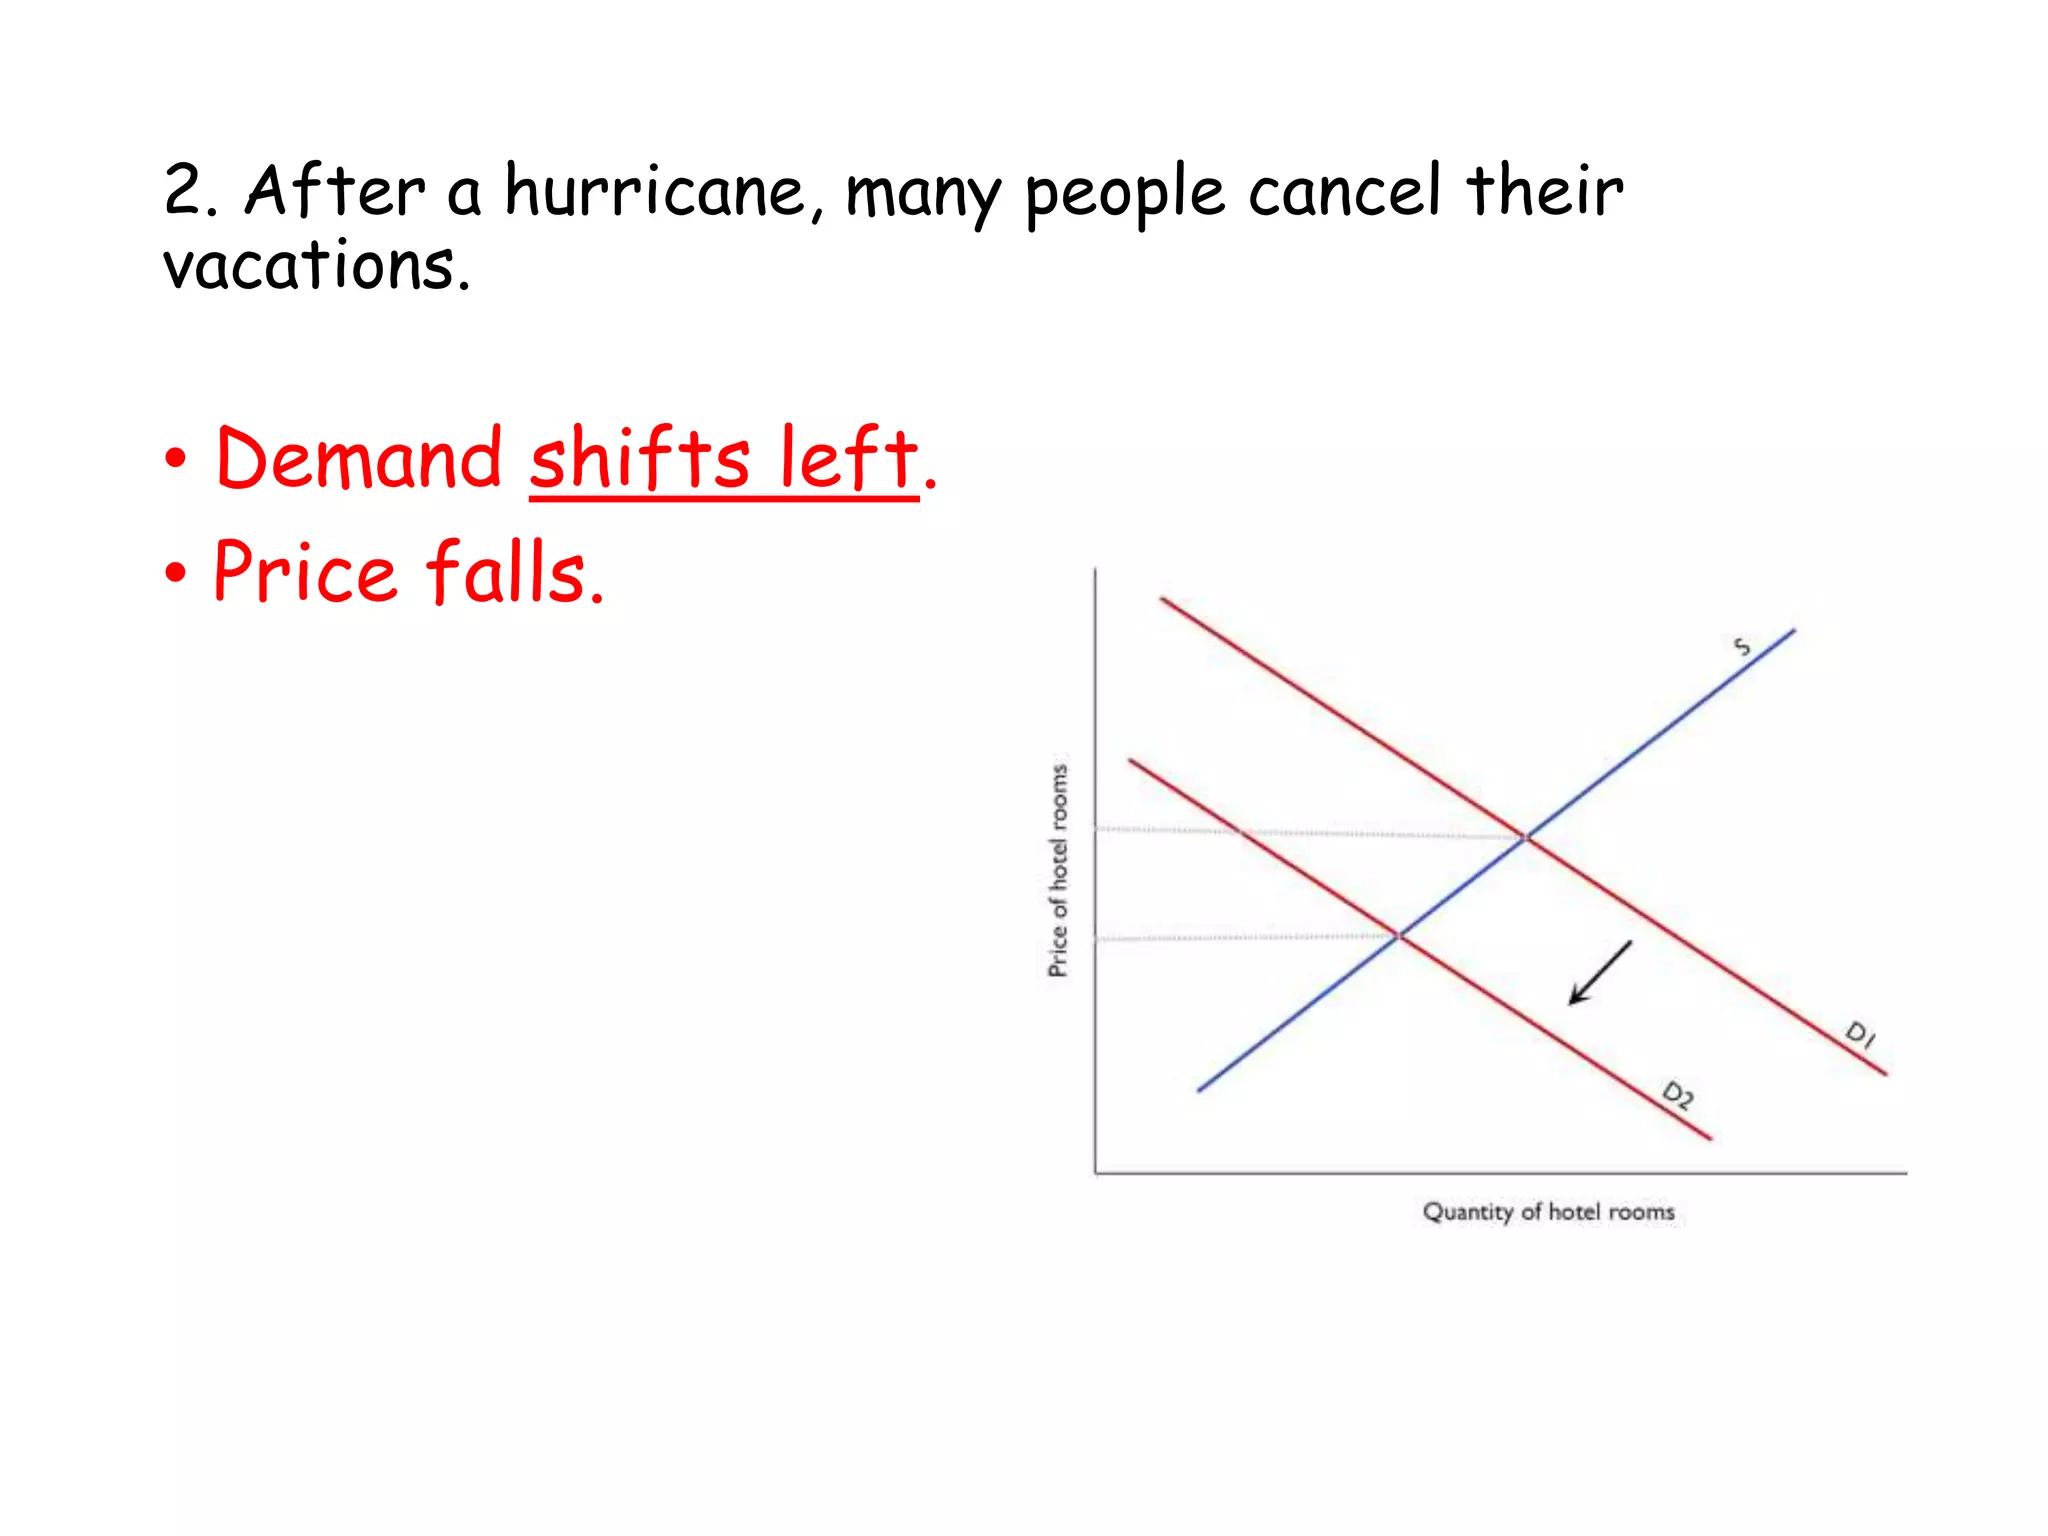
2. After ahurricane, many people cancel their
vacations.
• Demand shifts left.
• Price falls.
57.
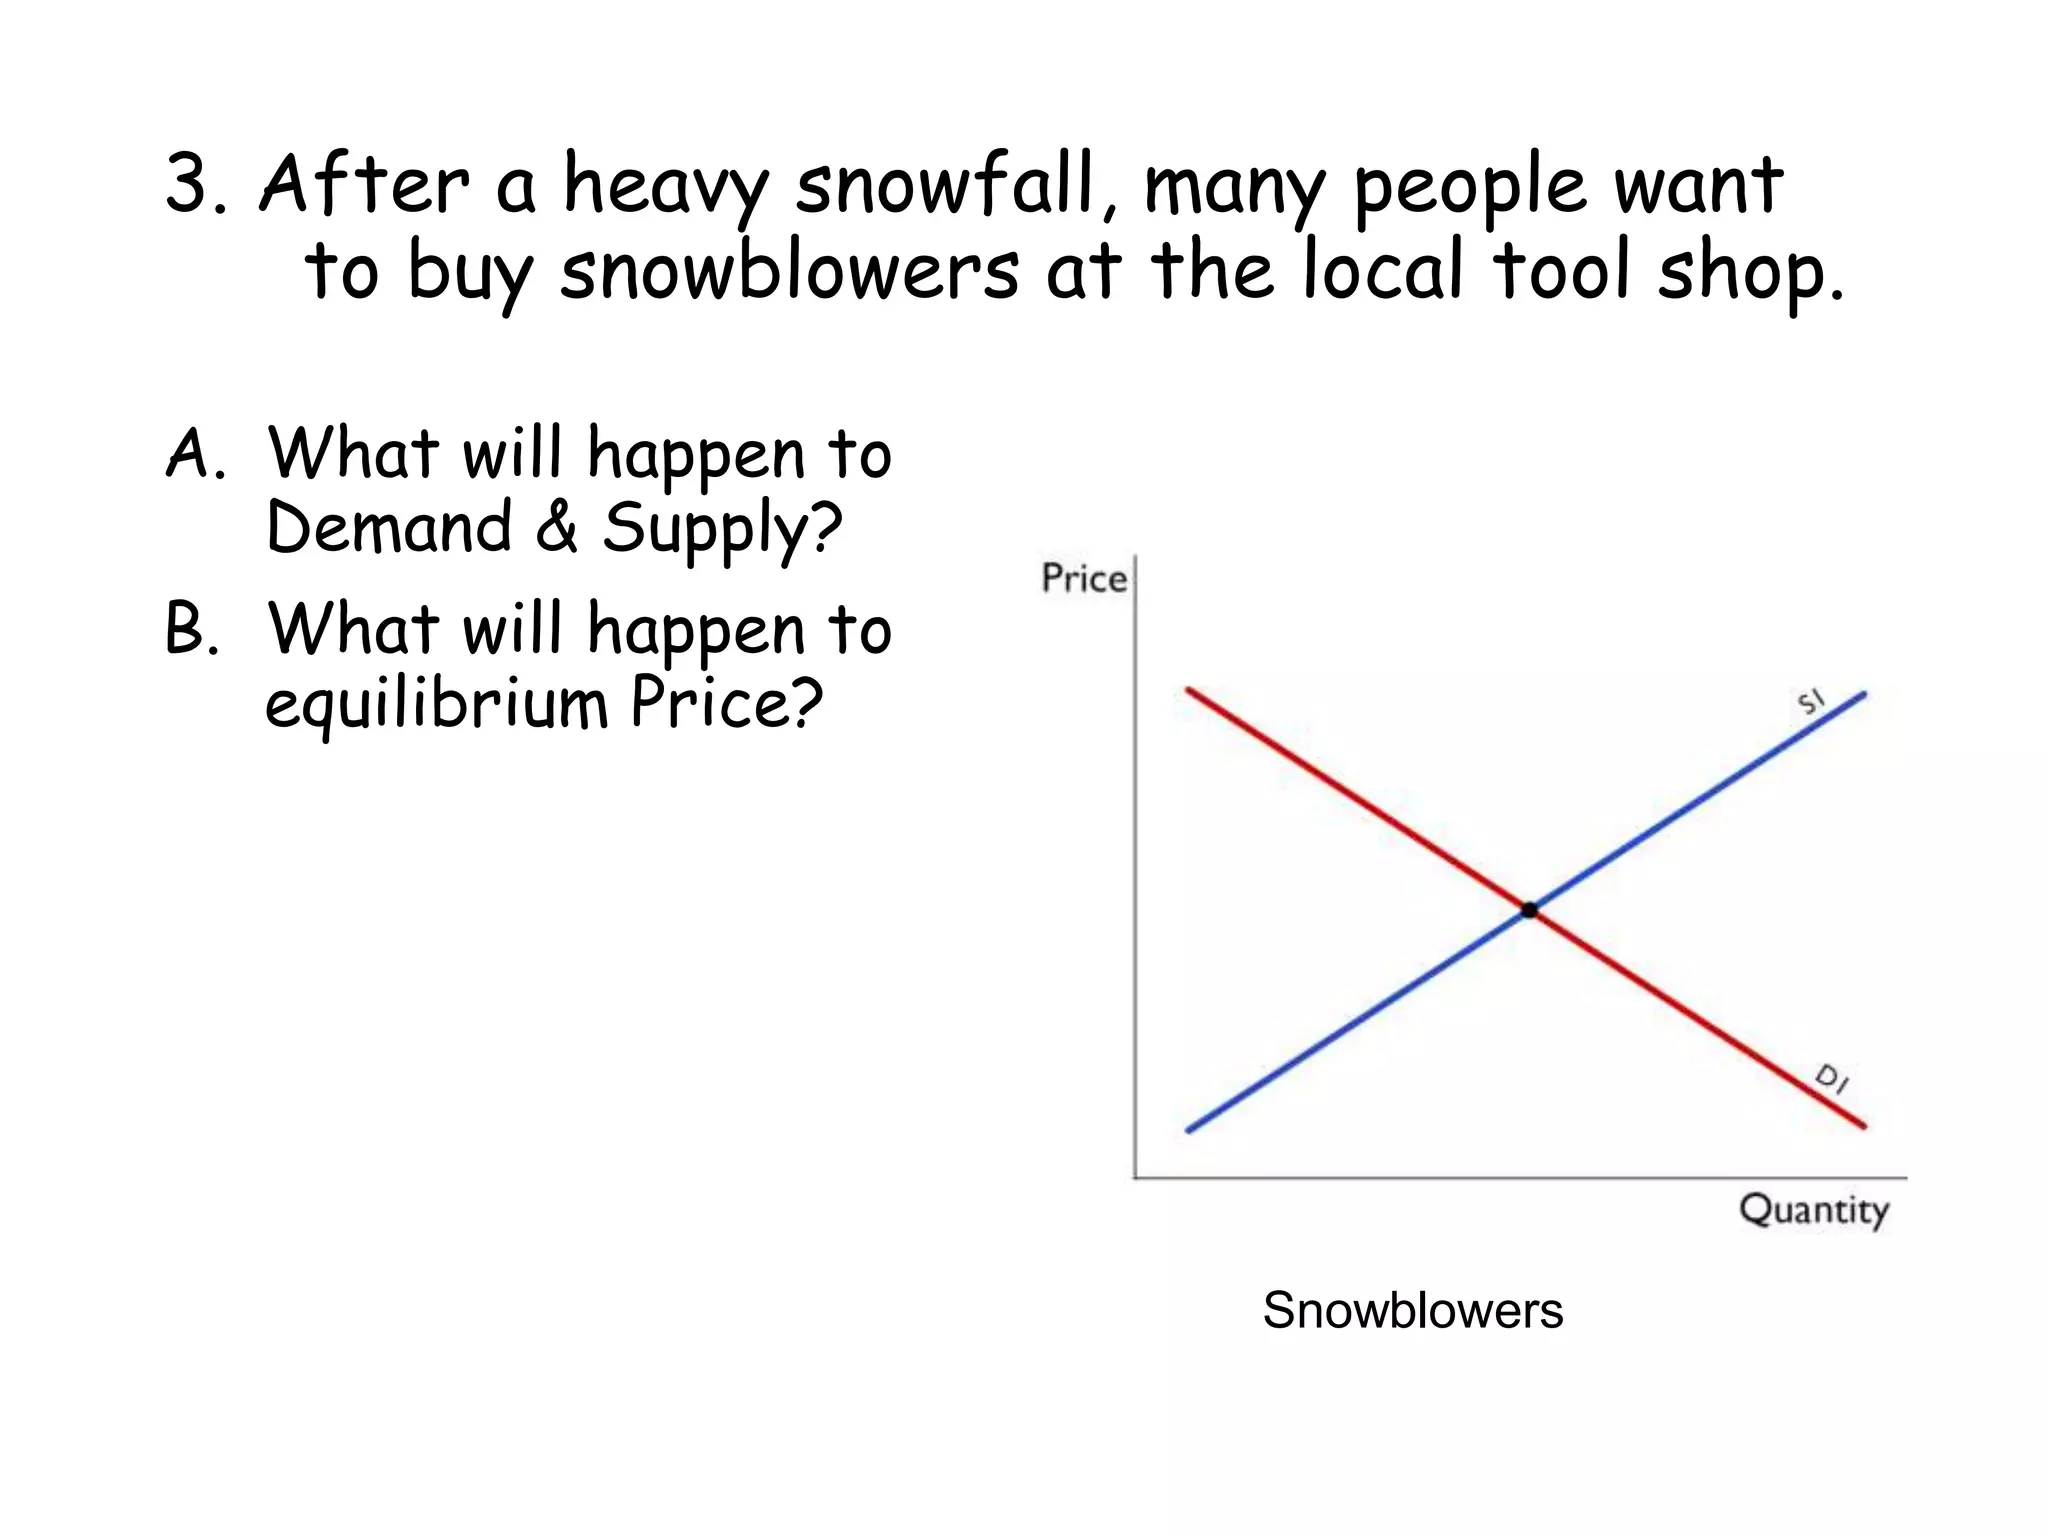
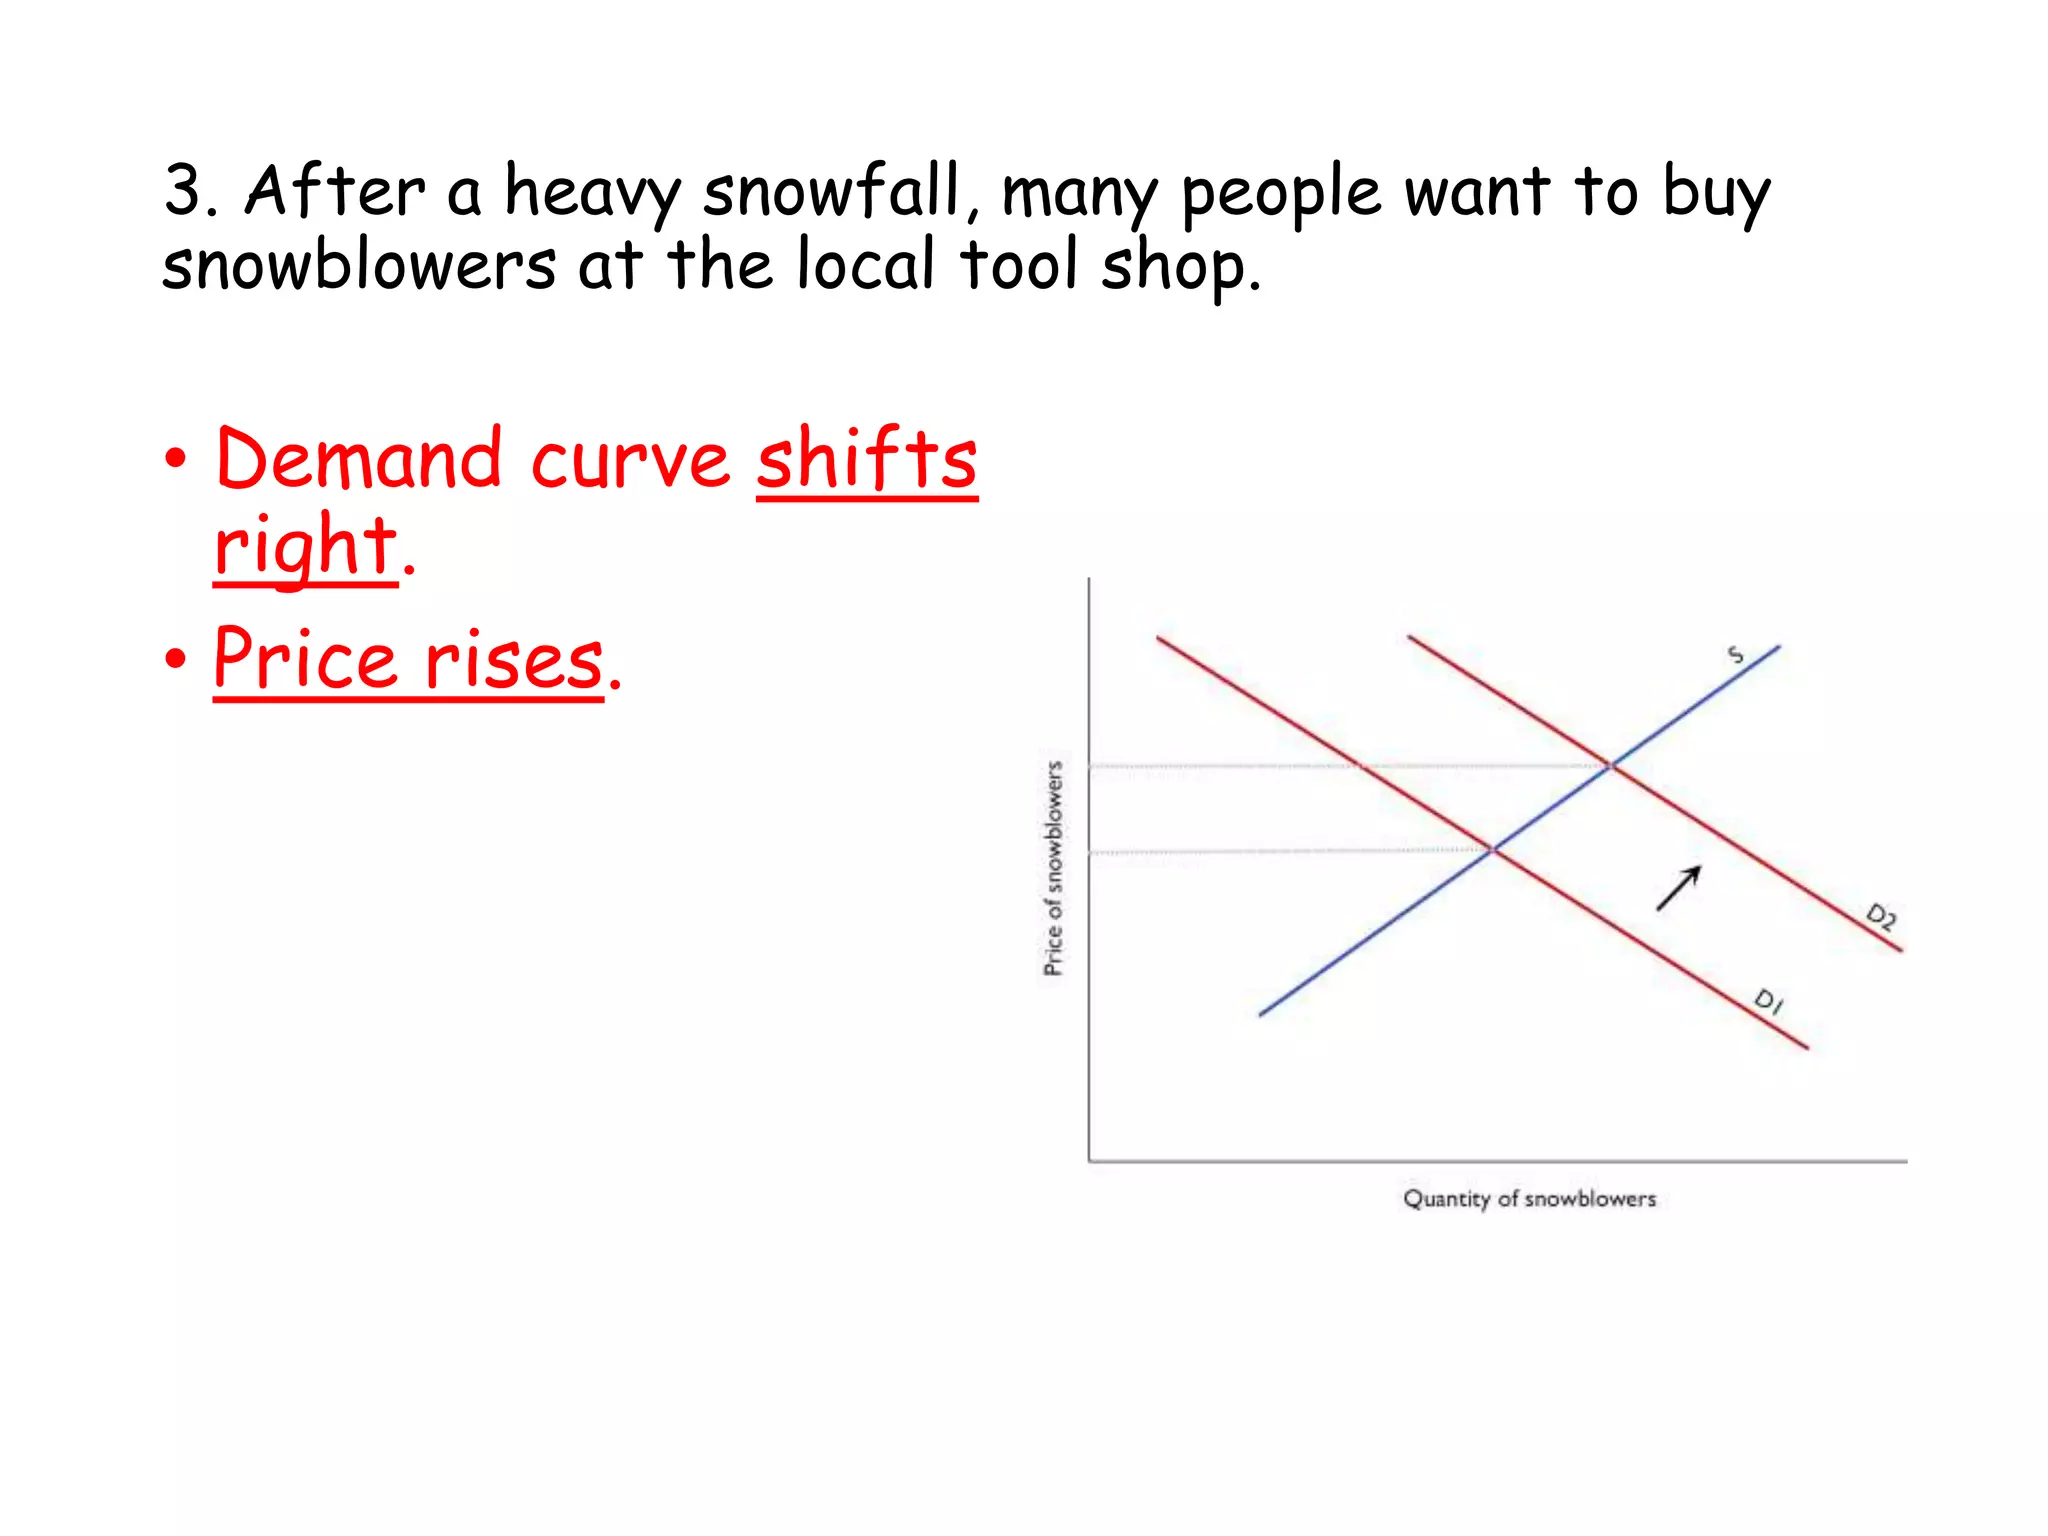
3. After aheavy snowfall, many people want
to buy snowblowers at the local tool shop.
A. What will happen to
Demand & Supply?
B. What will happen to
equilibrium Price?
Snowblowers
58.
3. After aheavy snowfall, many people want to buy
snowblowers at the local tool shop.
• Demand curve shifts
right.
• Price rises.
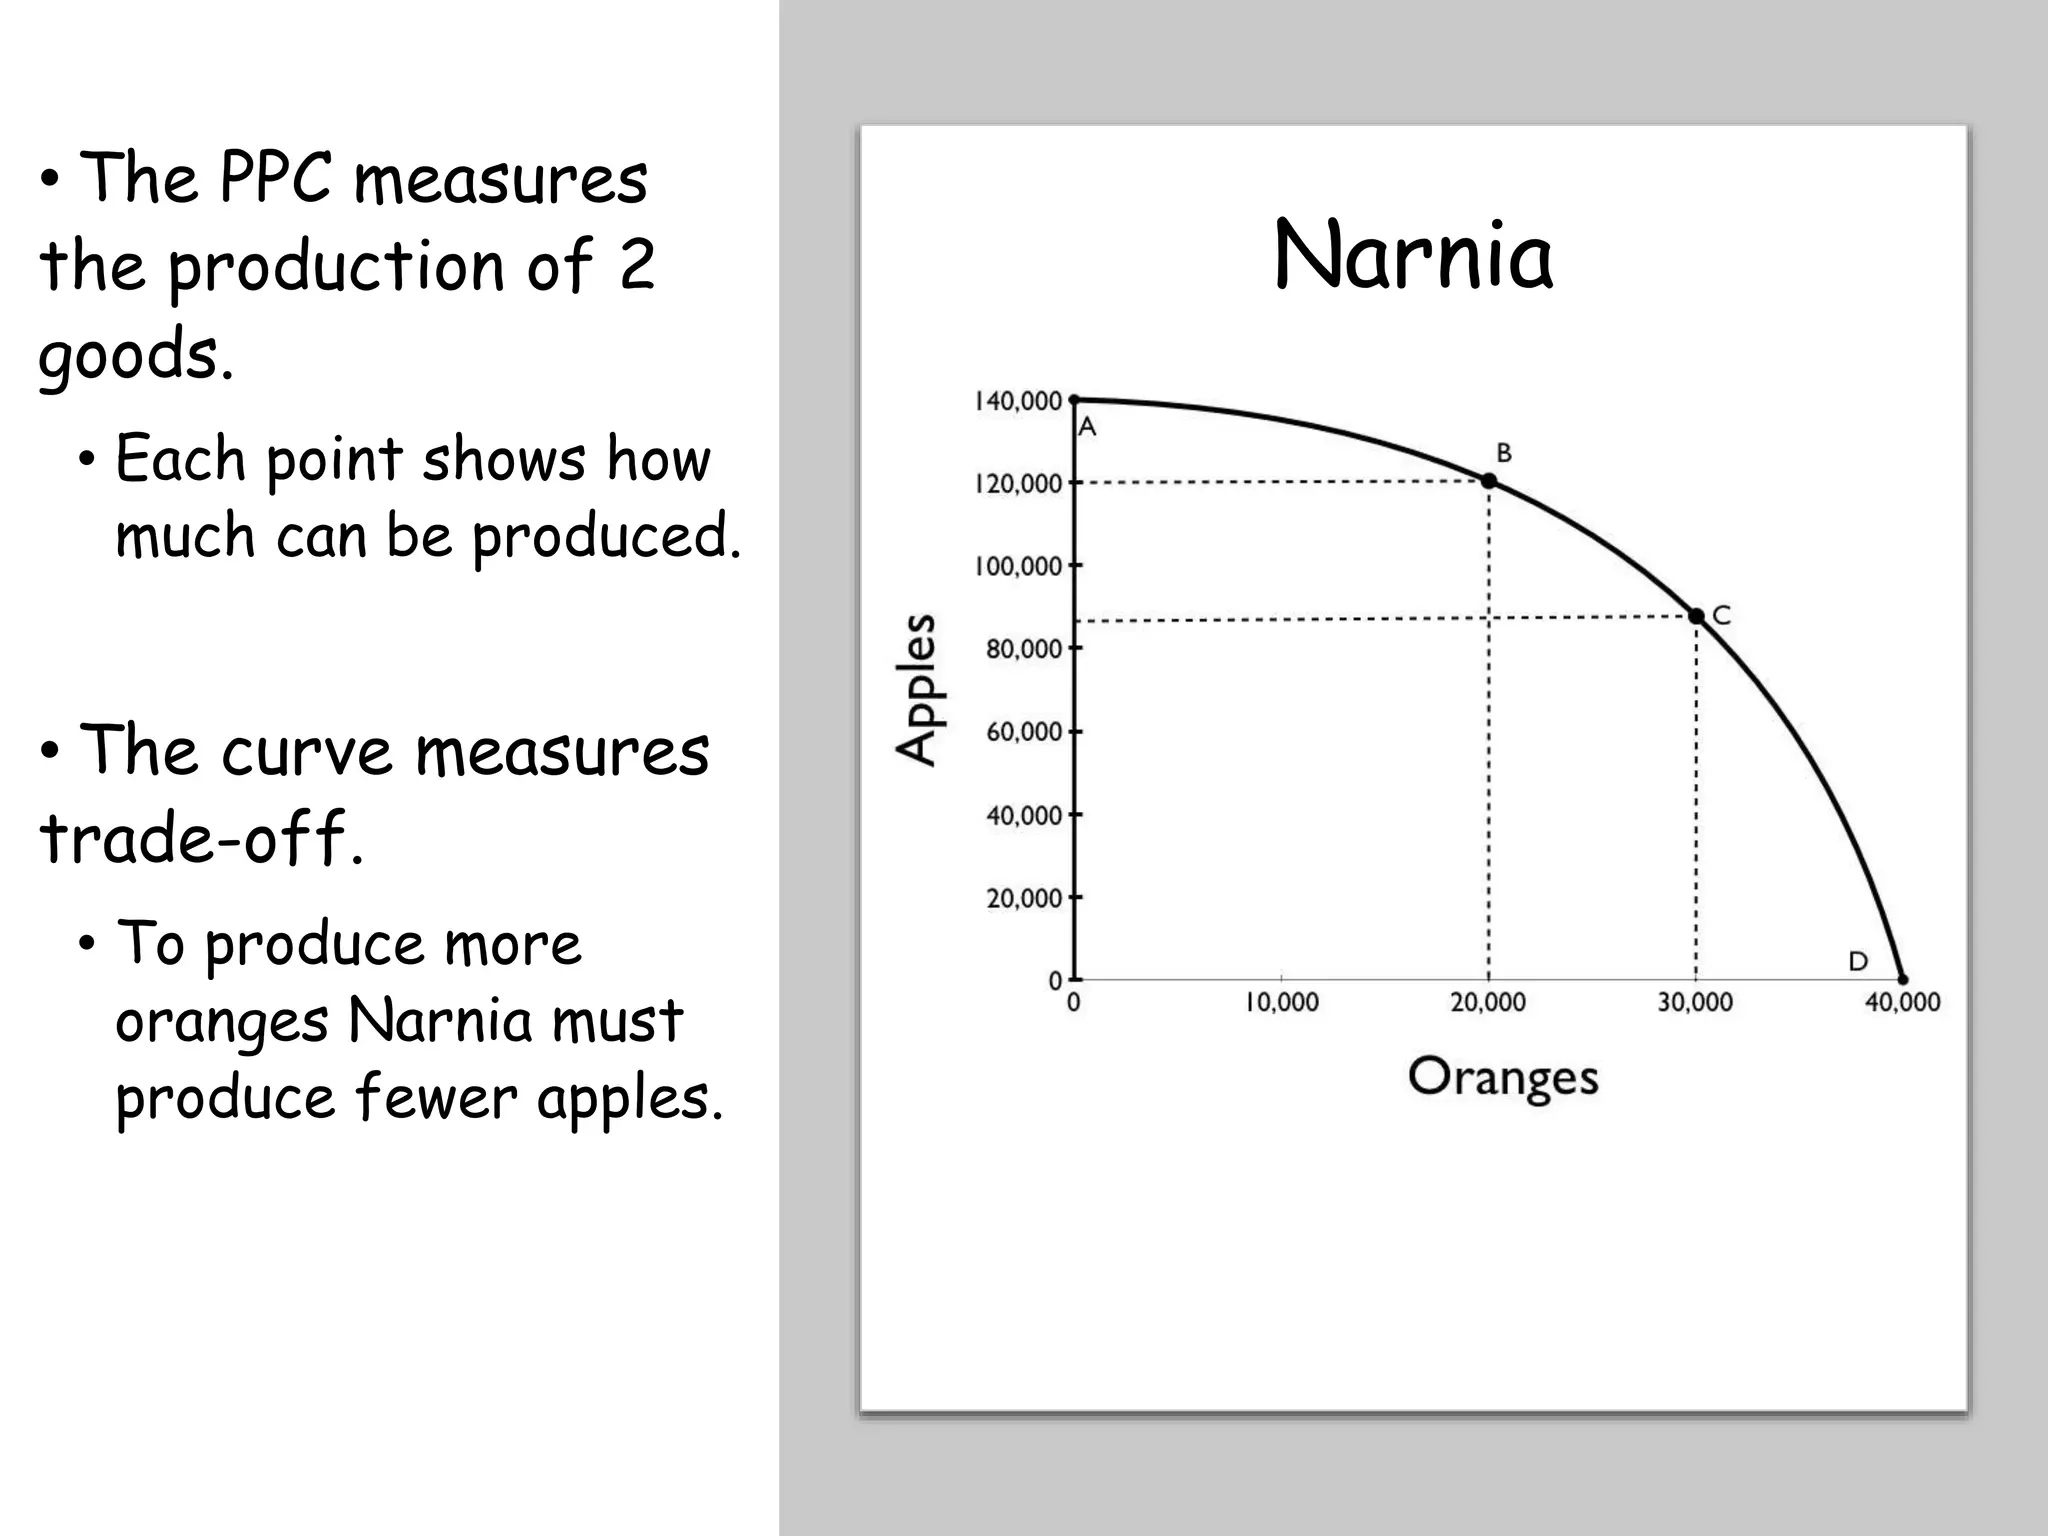
• The PPCmeasures
the production of 2
goods.
• Each point shows how
much can be produced.
• The curve measures
trade-off.
• To produce more
oranges Narnia must
produce fewer apples.
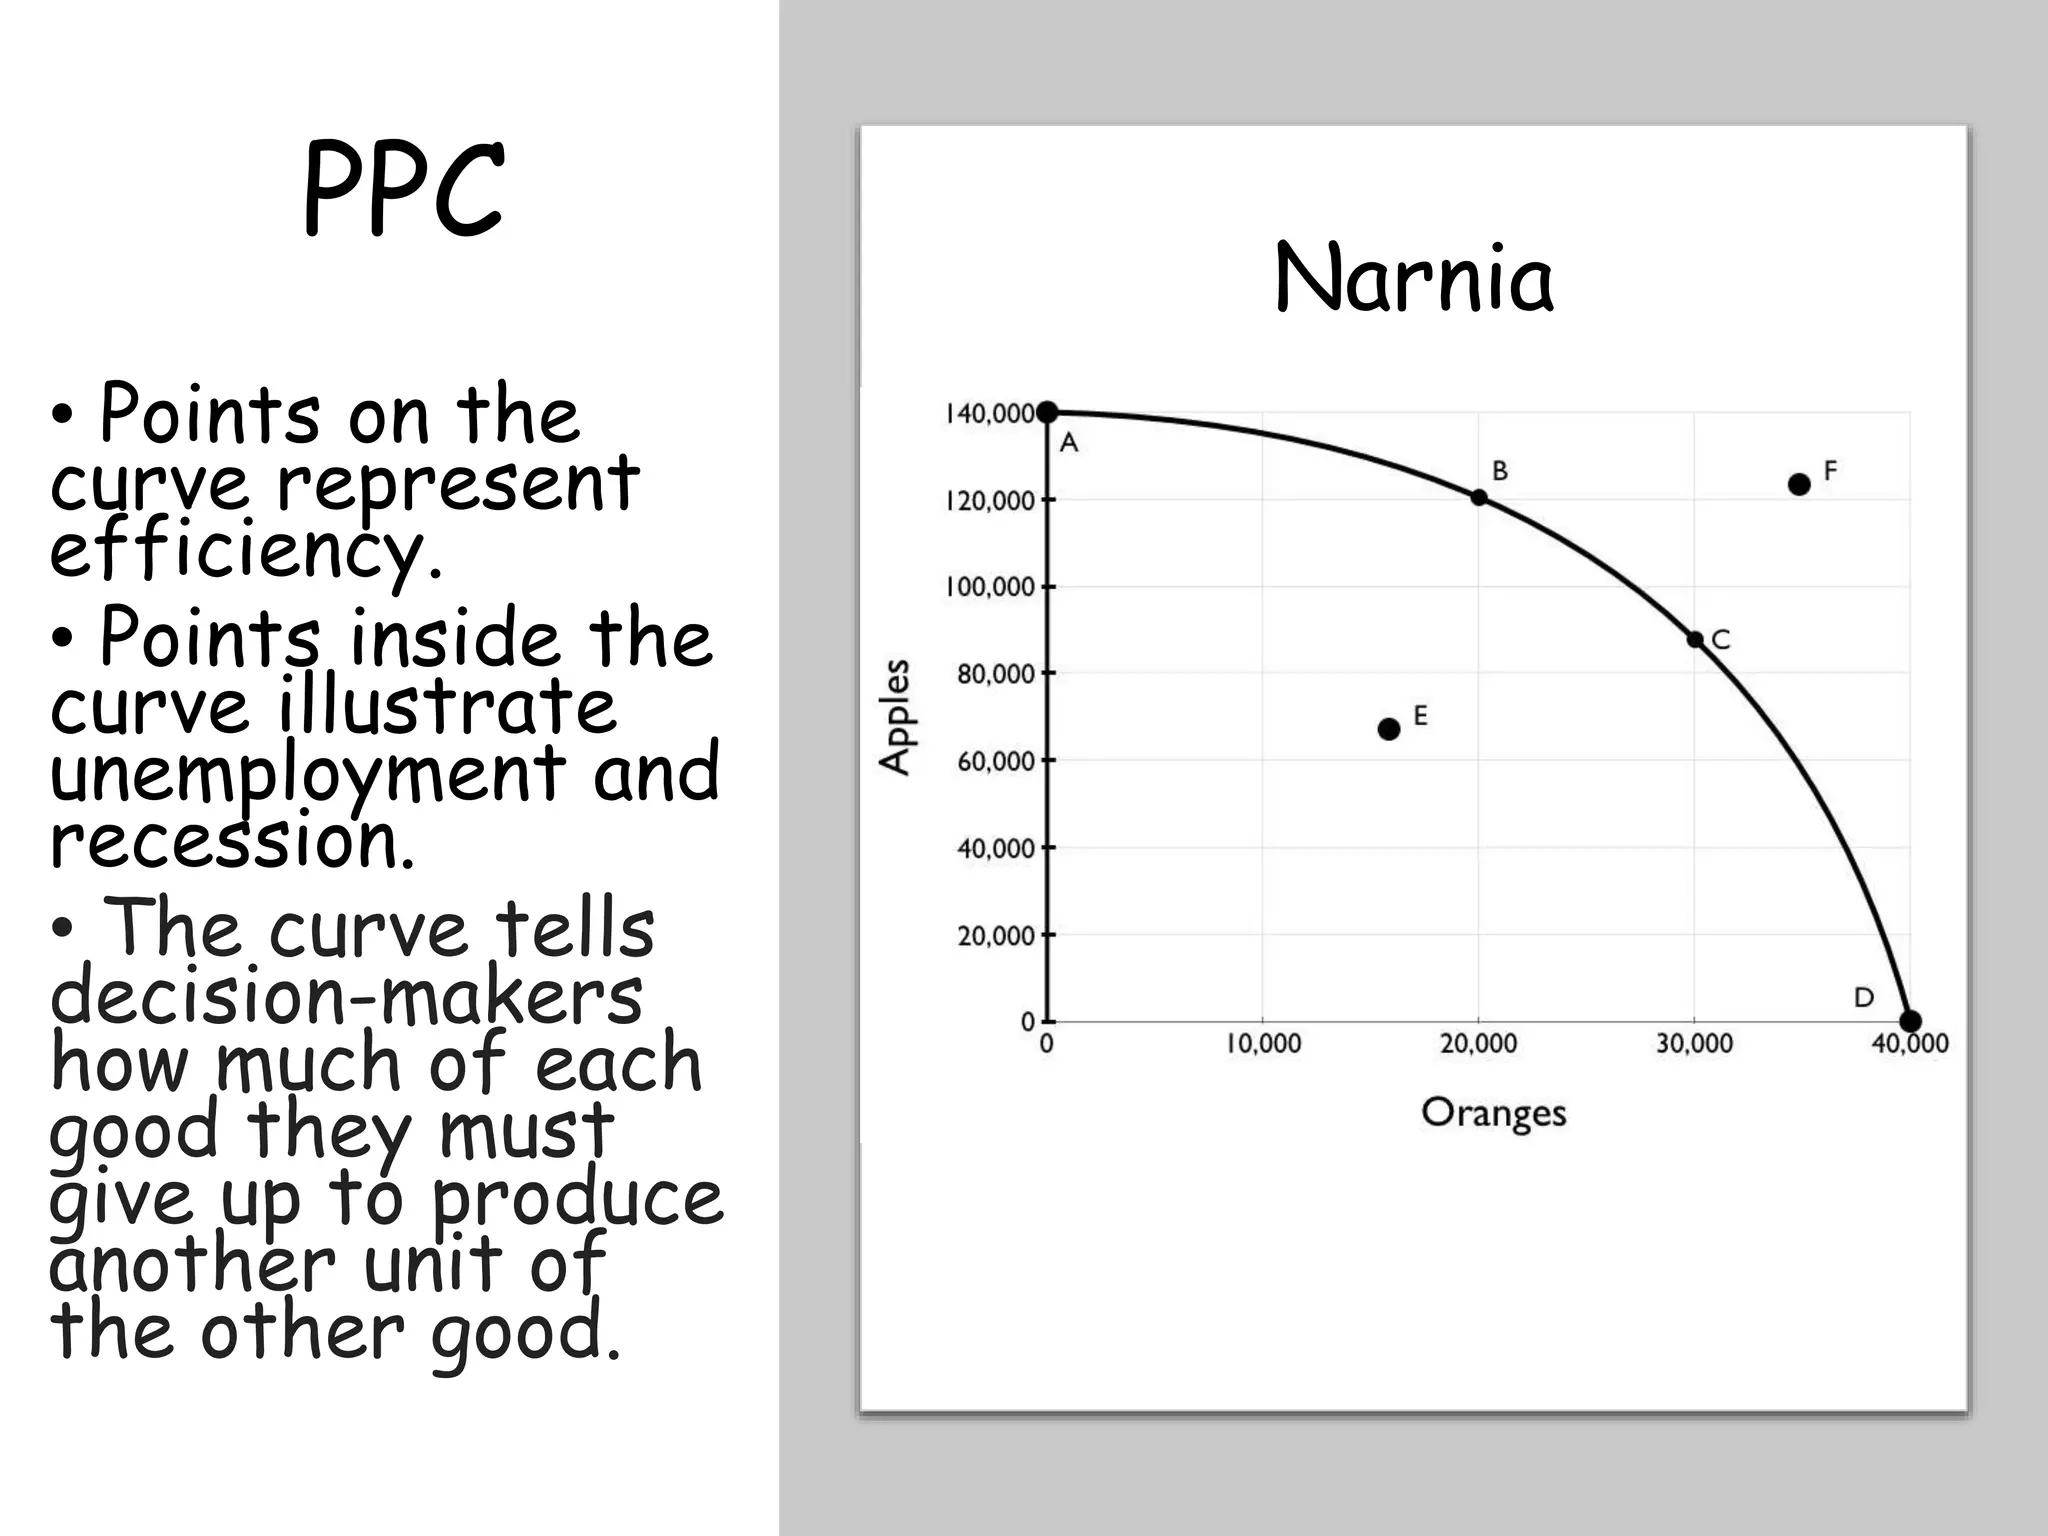
Narnia
61.
PPC
• Points onthe
curve represent
efficiency.
• Points inside the
curve illustrate
unemployment and
recession.
• The curve tells
decision-makers
how much of each
good they must
give up to produce
another unit of
the other good.
Narnia
62.
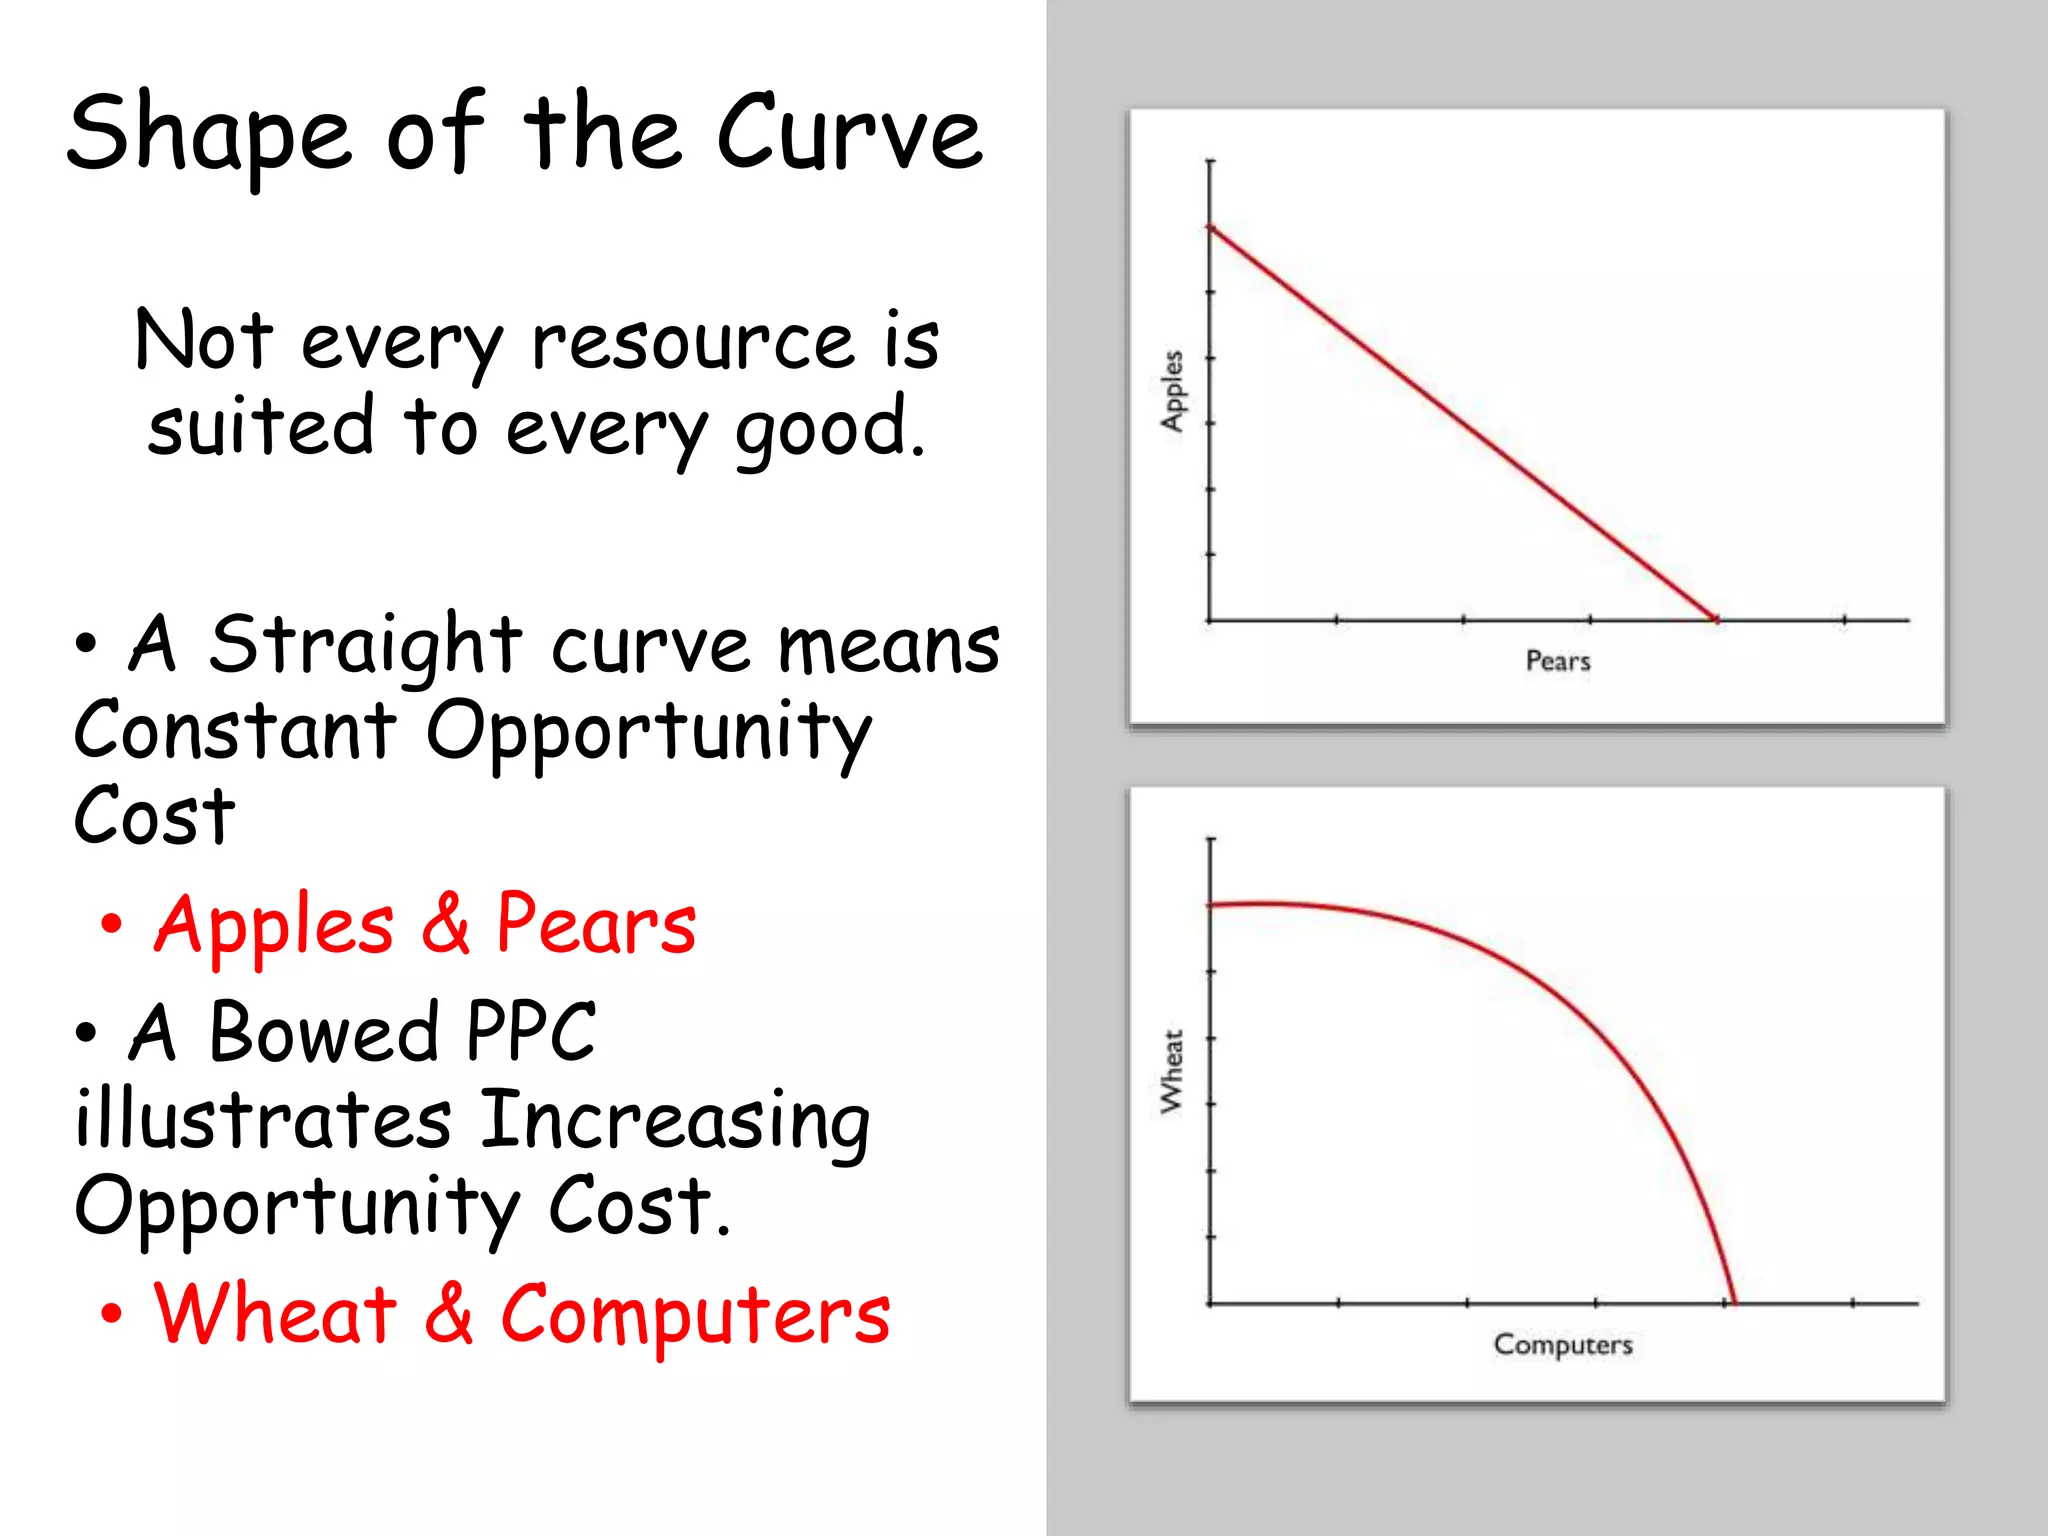
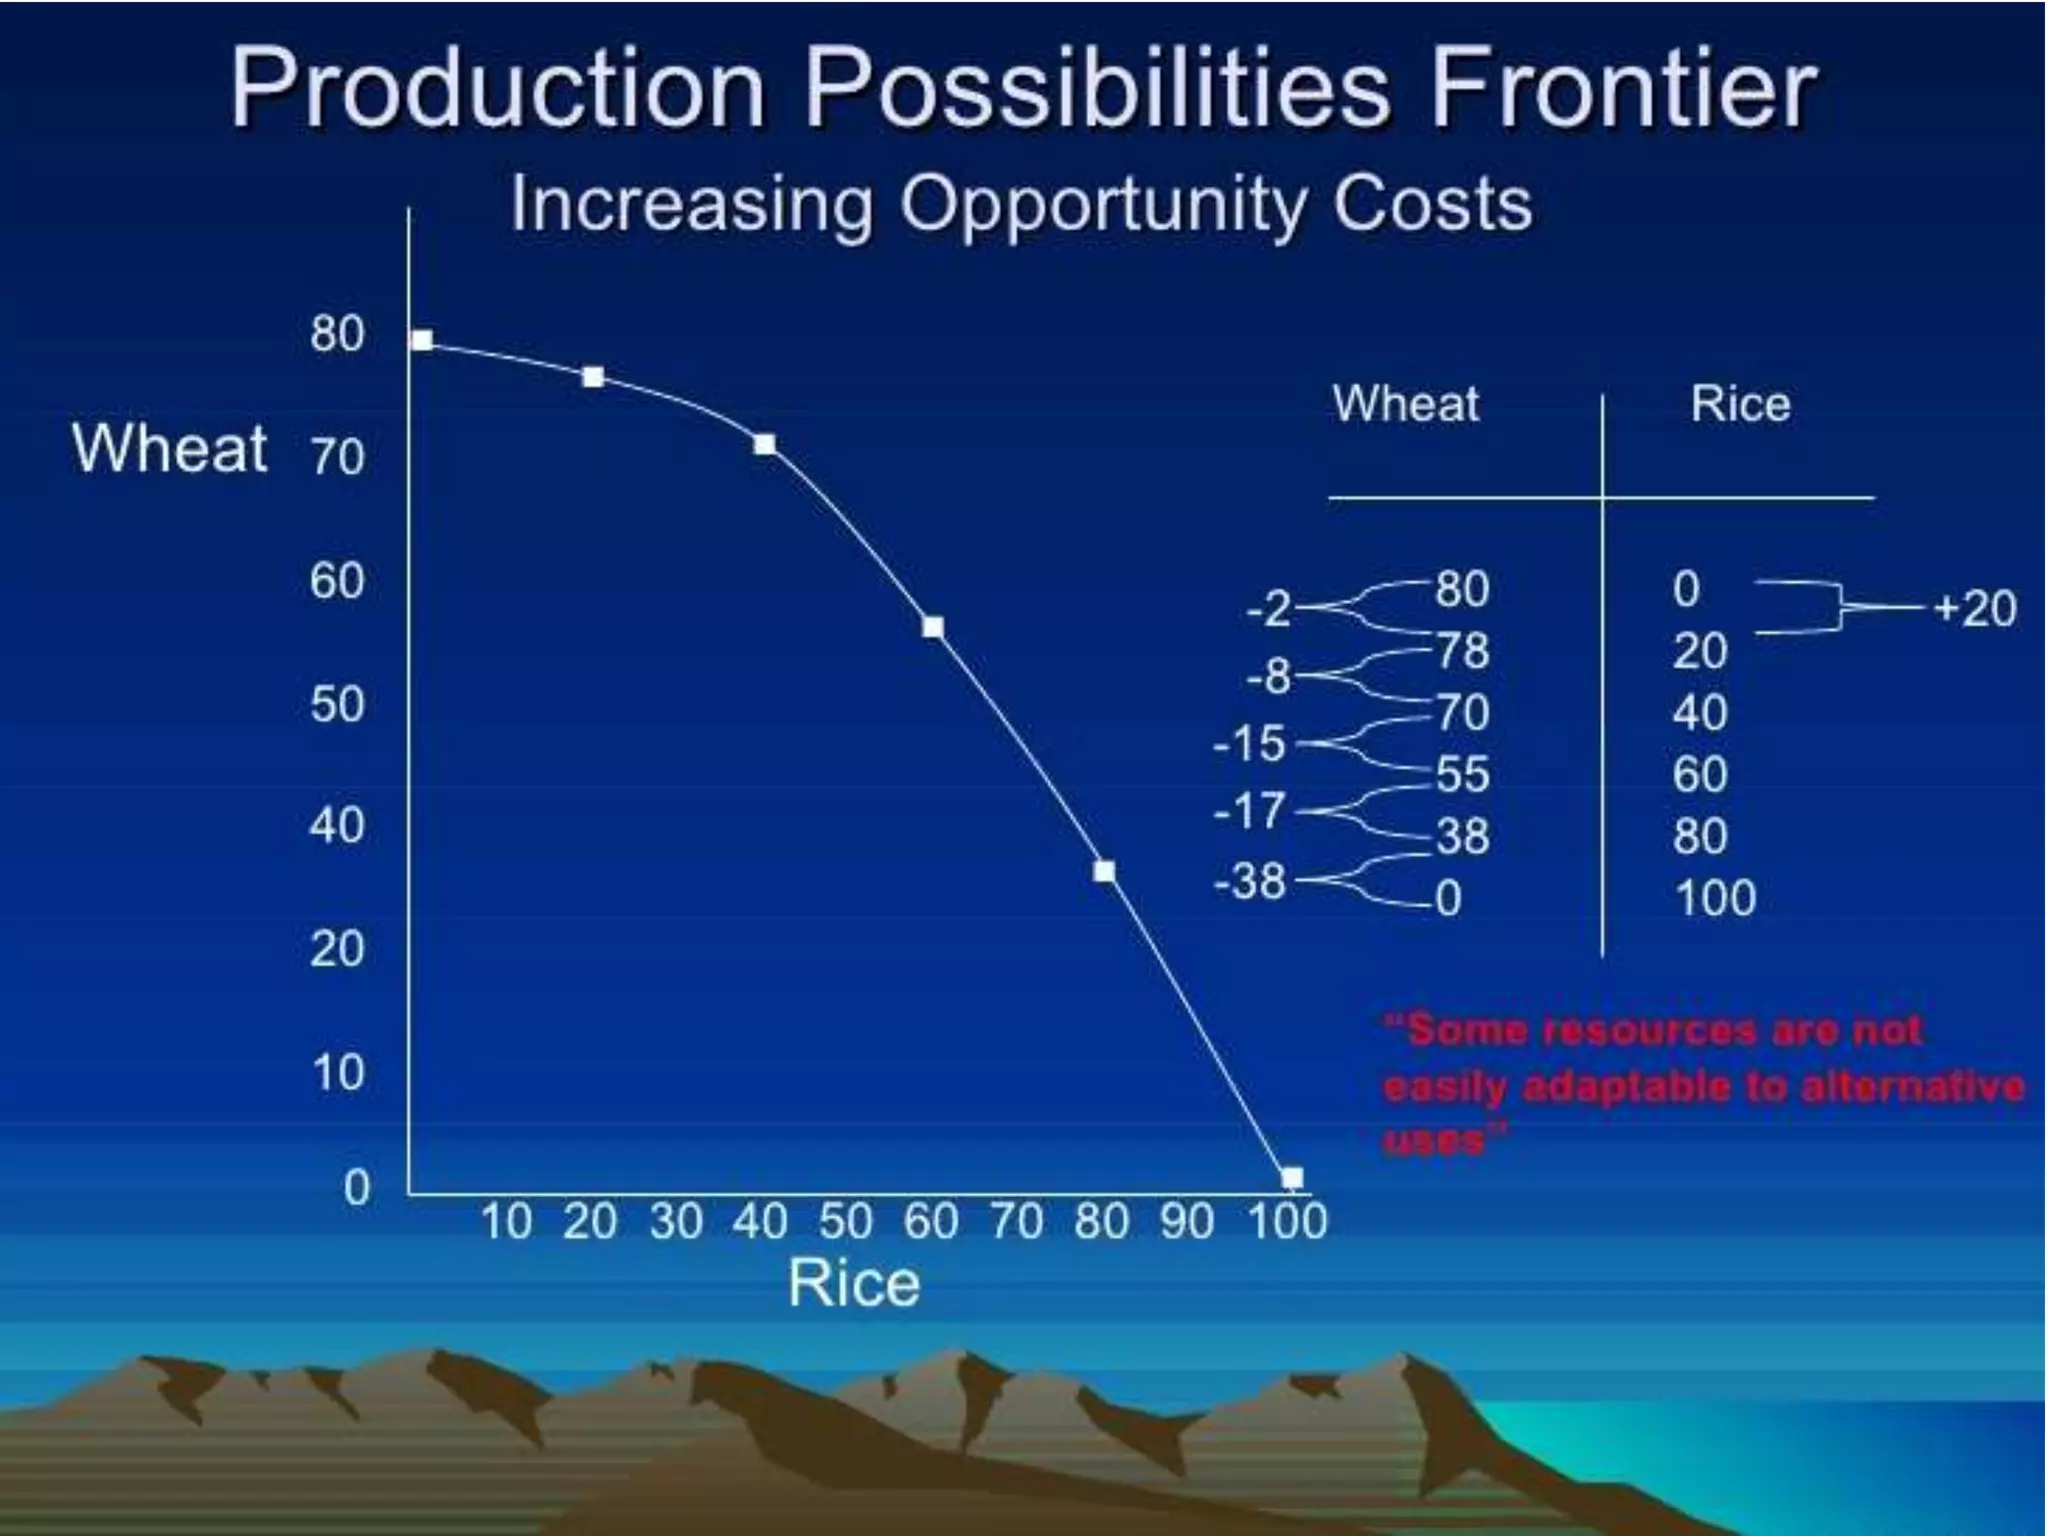
Shape of theCurve
Not every resource is
suited to every good.
• A Straight curve means
Constant Opportunity
Cost
• Apples & Pears
• A Bowed PPC
illustrates Increasing
Opportunity Cost.
• Wheat & Computers
63.
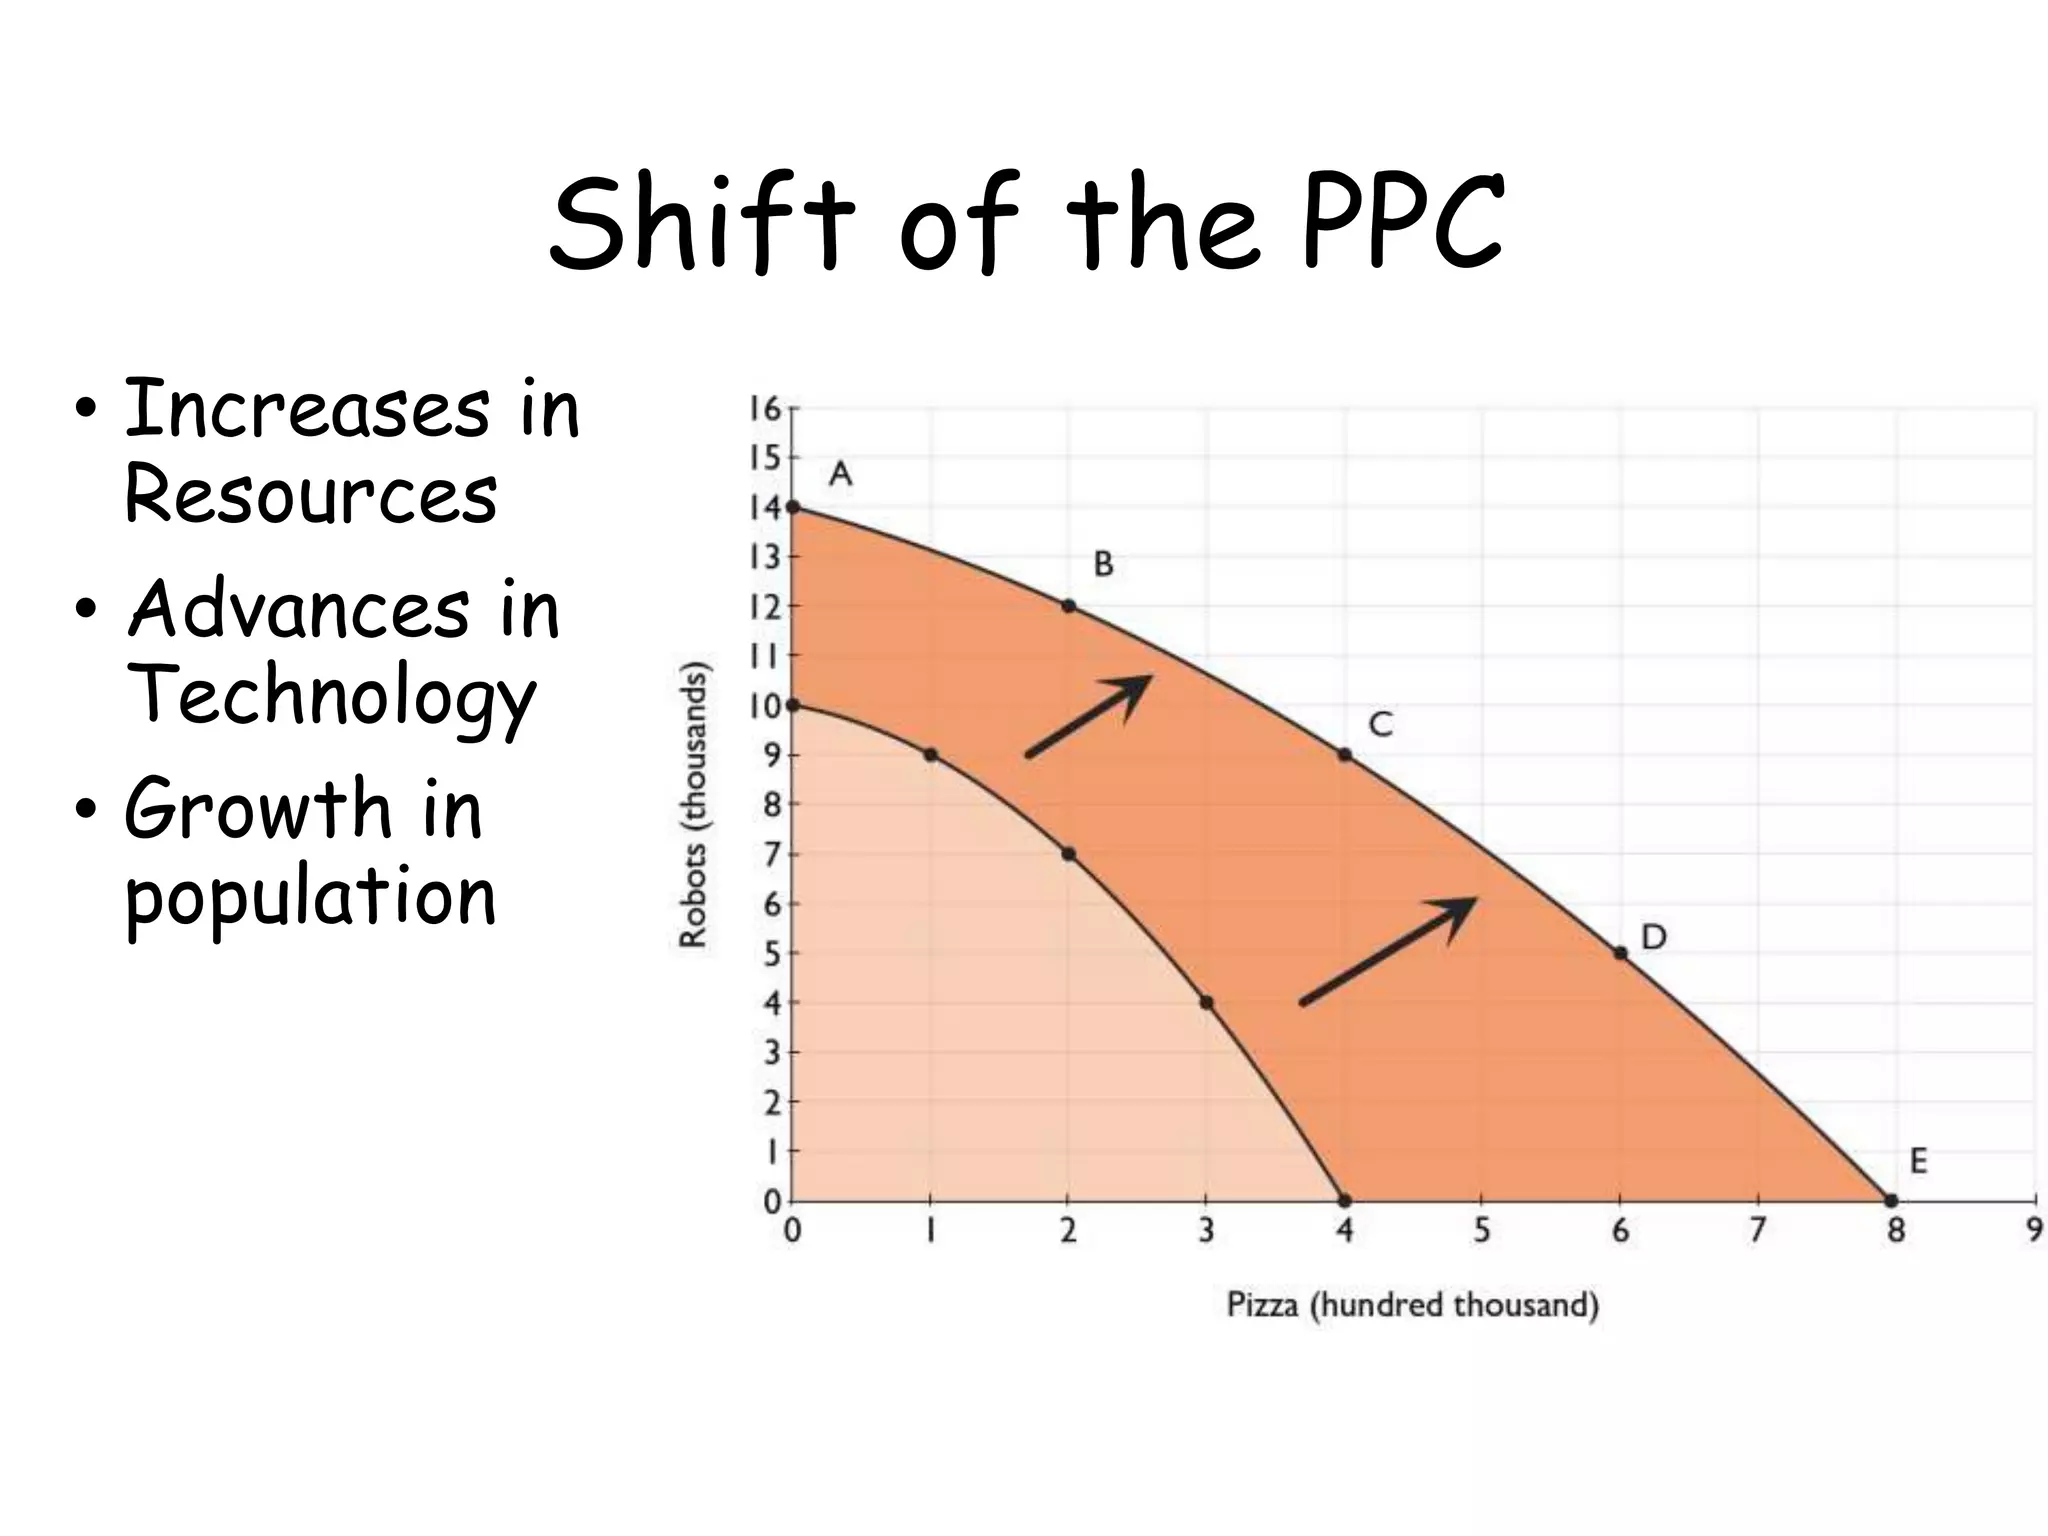
Shift of thePPC
• Increases in
Resources
• Advances in
Technology
• Growth in
population
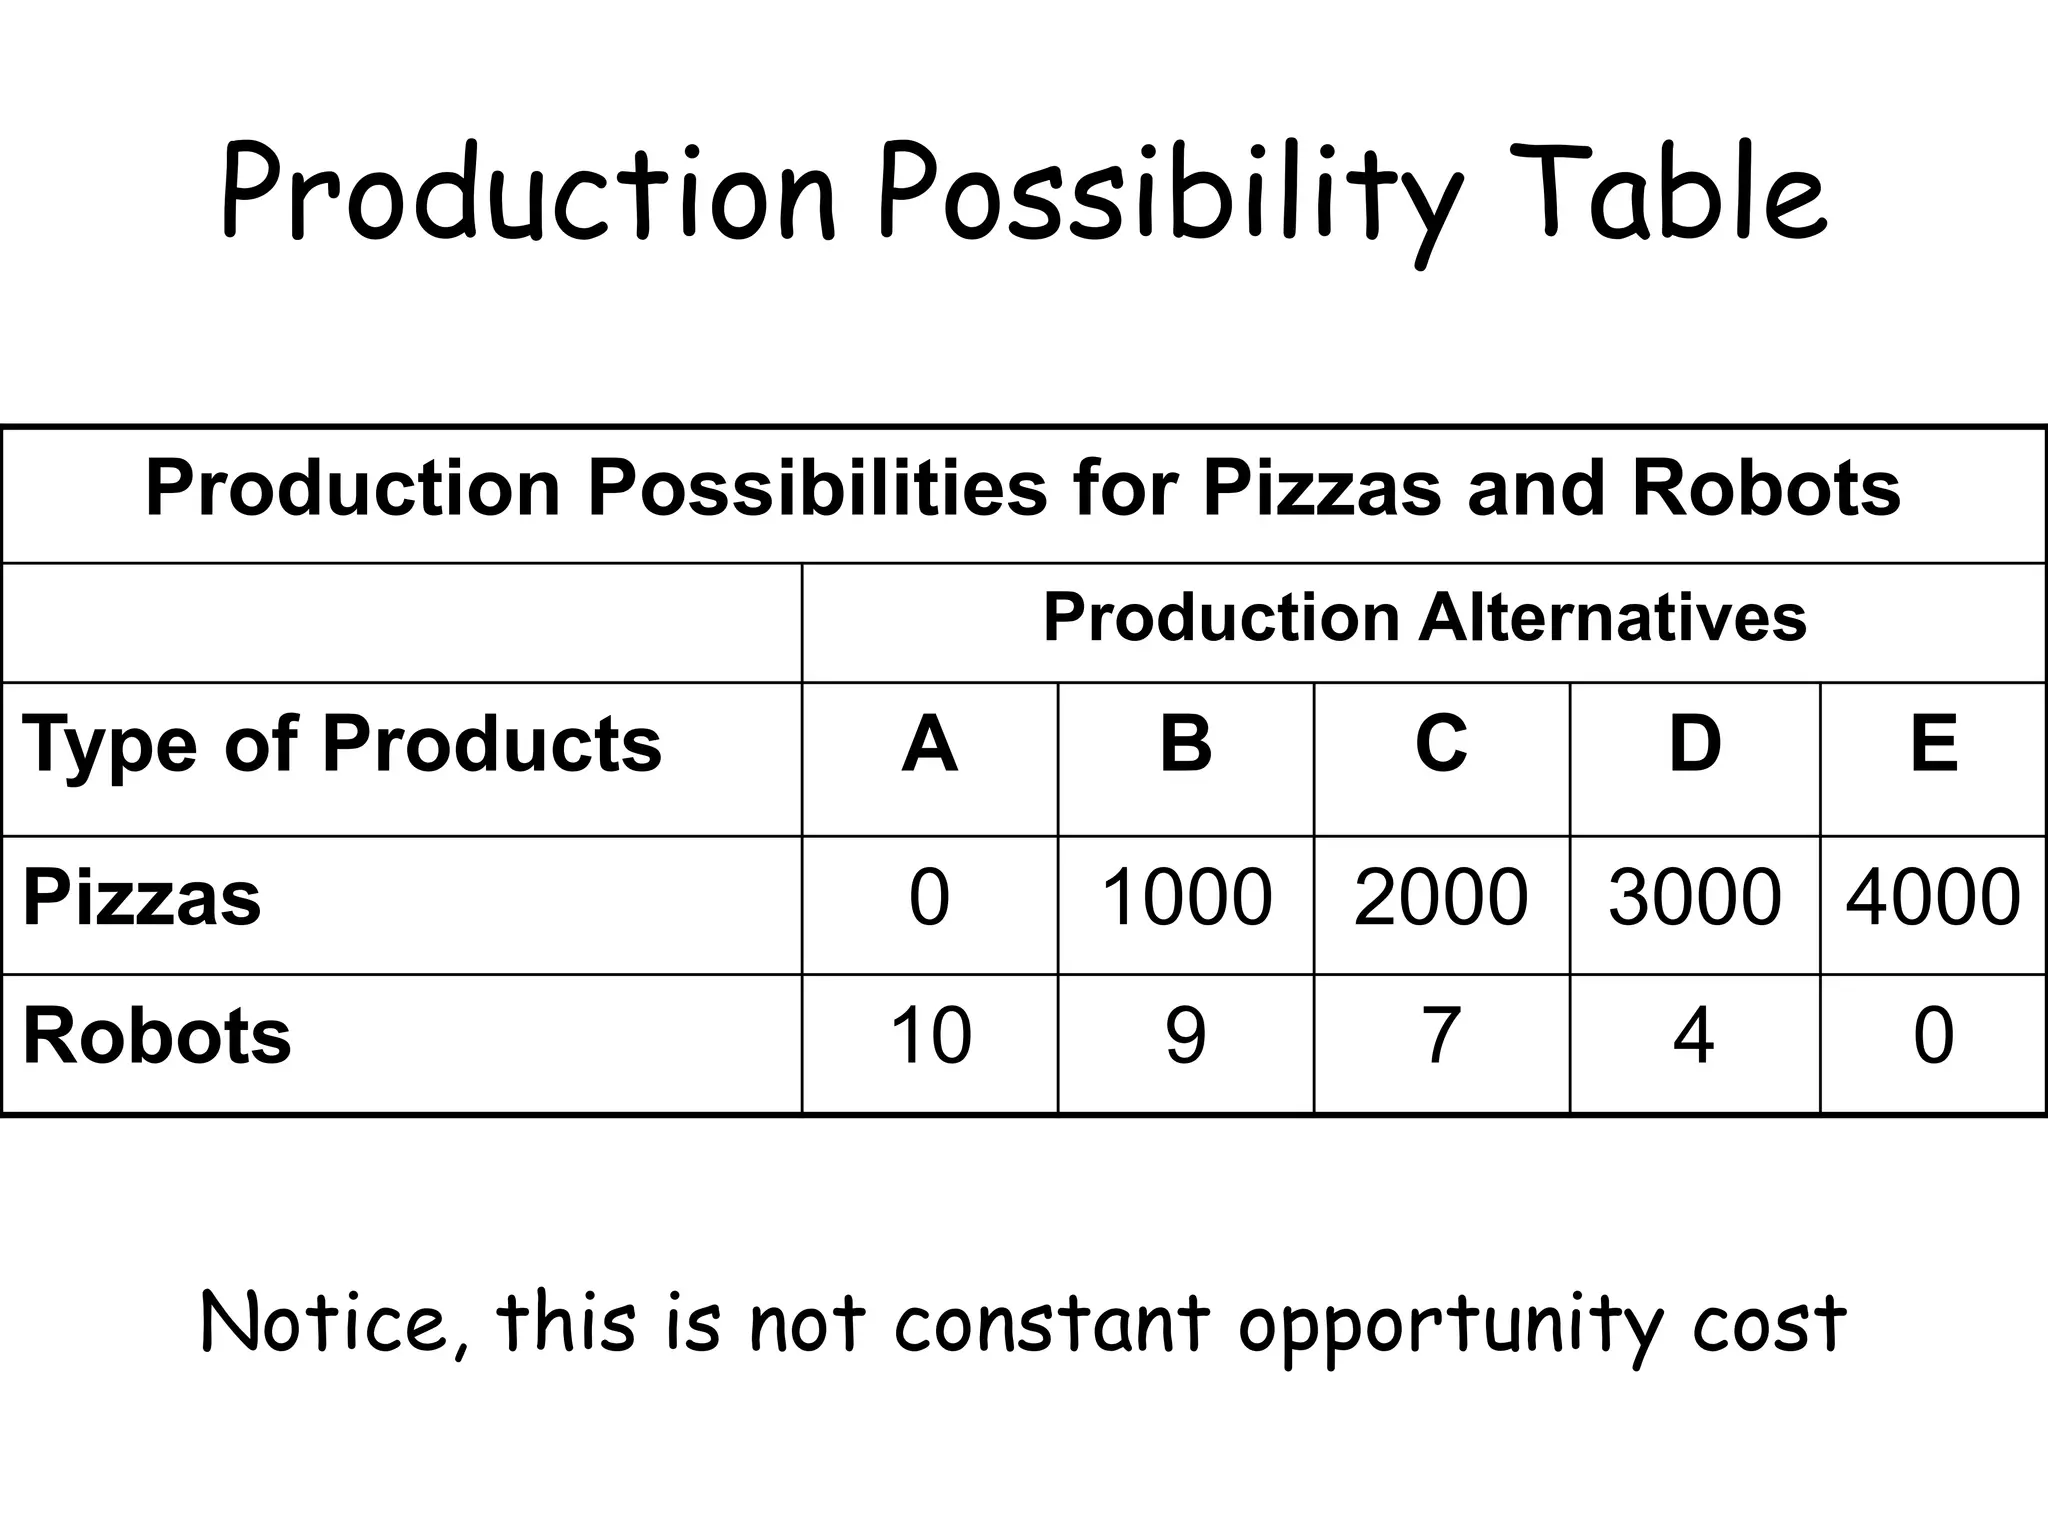
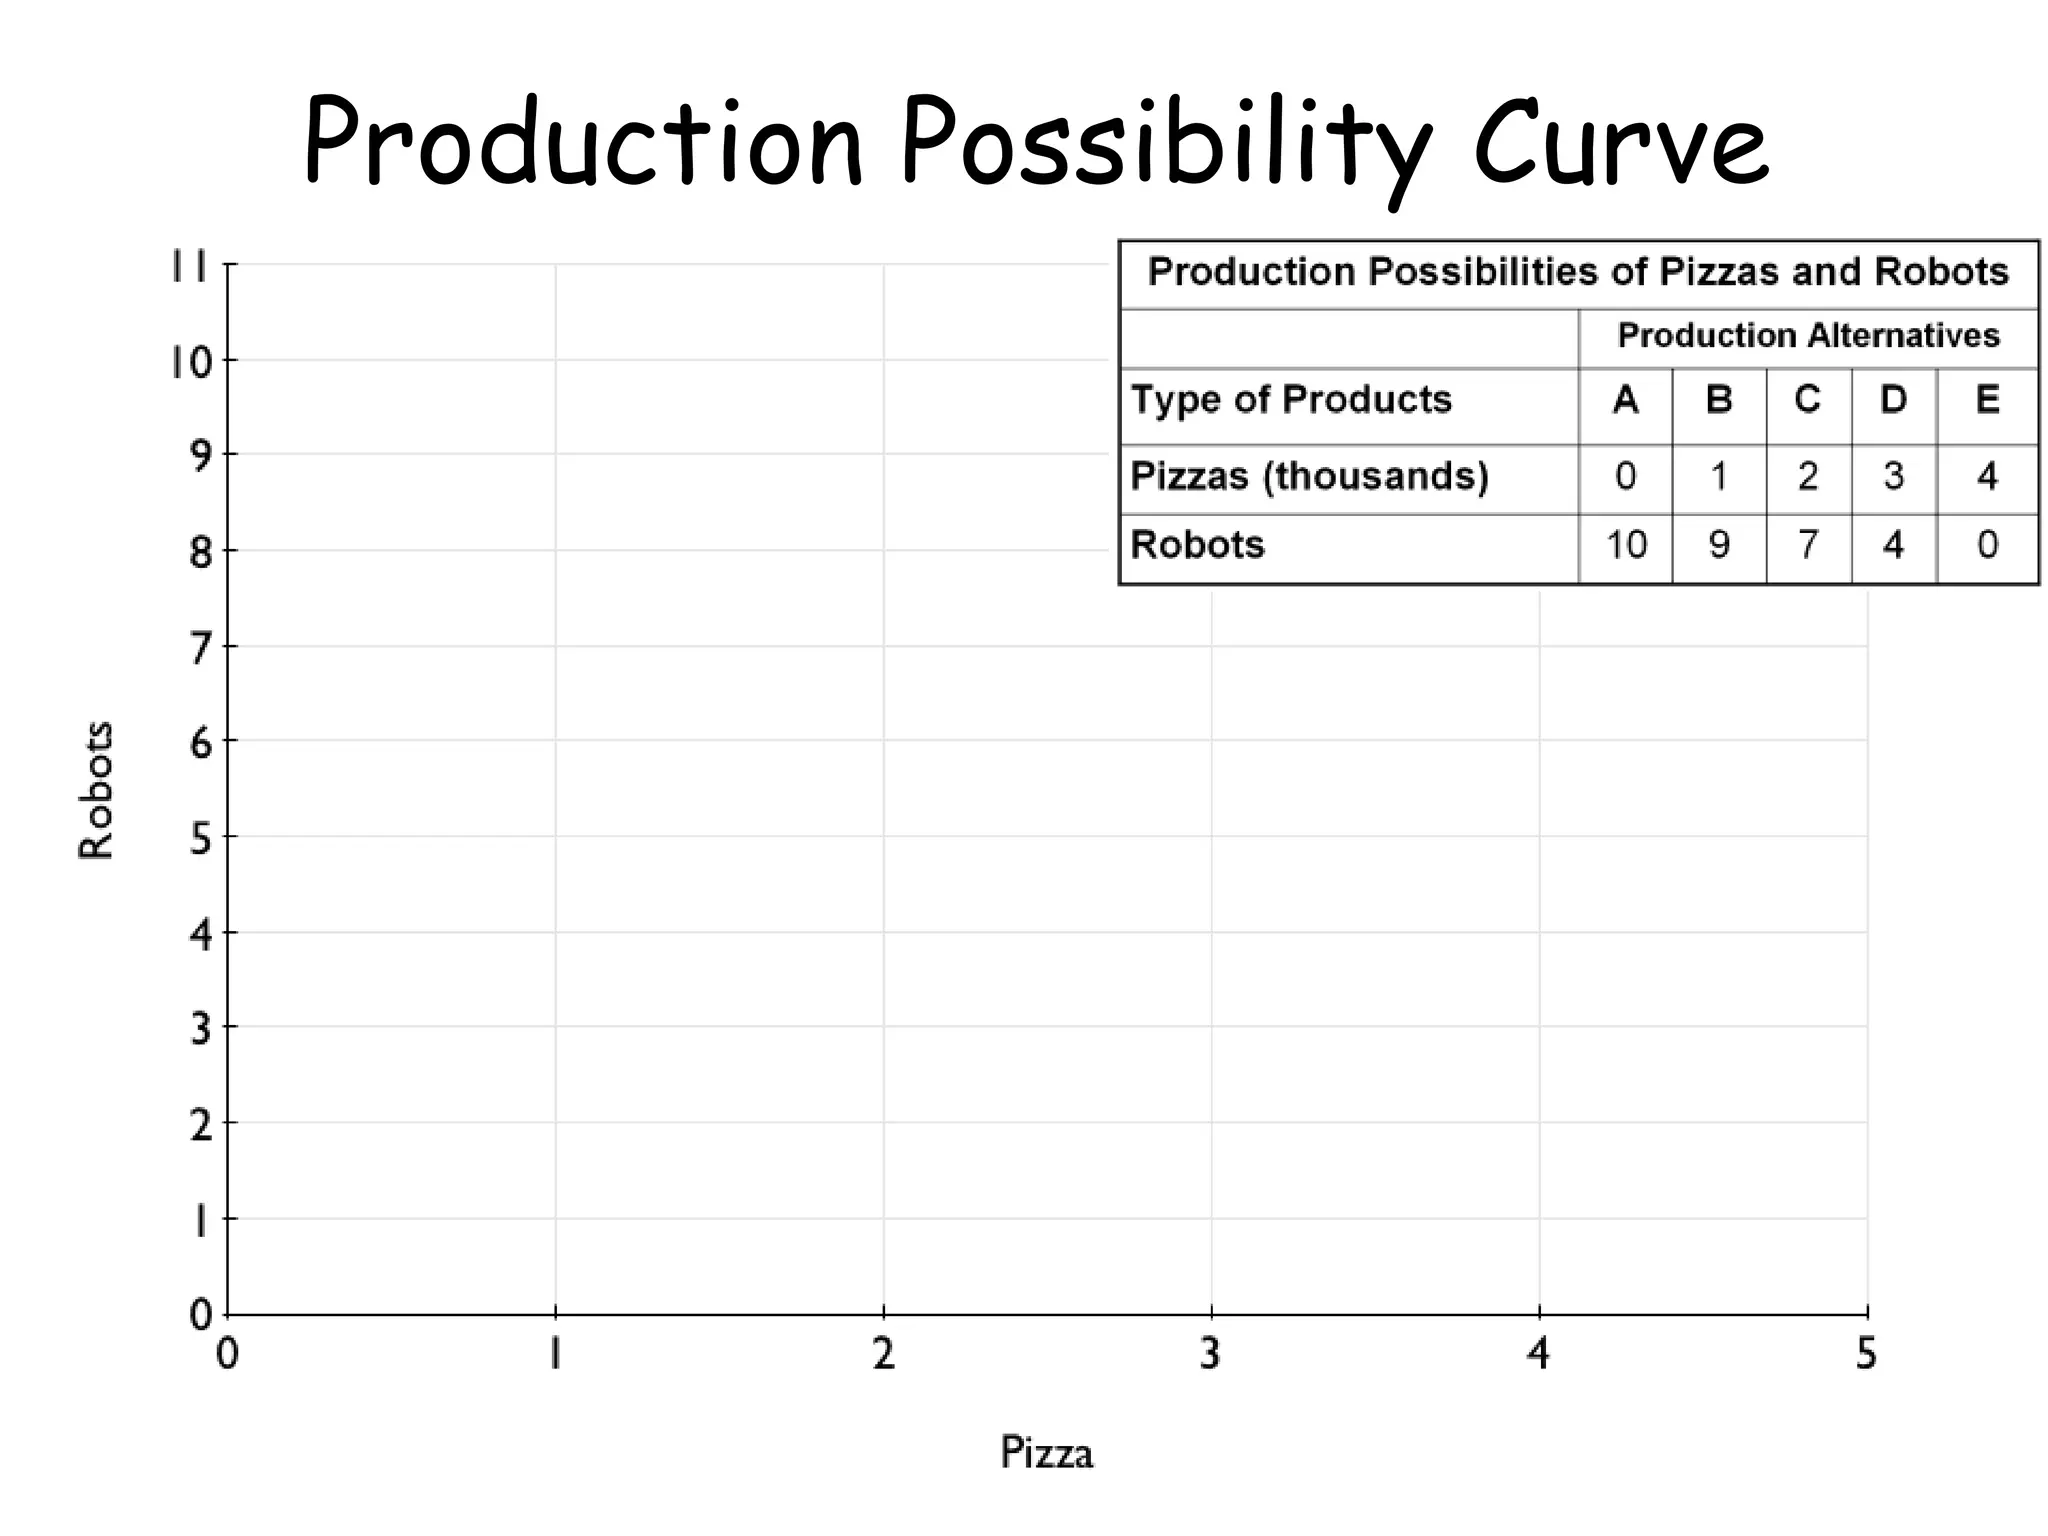
Production Possibility Table
ProductionPossibilities for Pizzas and Robots
Production Alternatives
Type of Products A B C D E
Pizzas 0 1000 2000 3000 4000
Robots 10 9 7 4 0
Notice, this is not constant opportunity cost
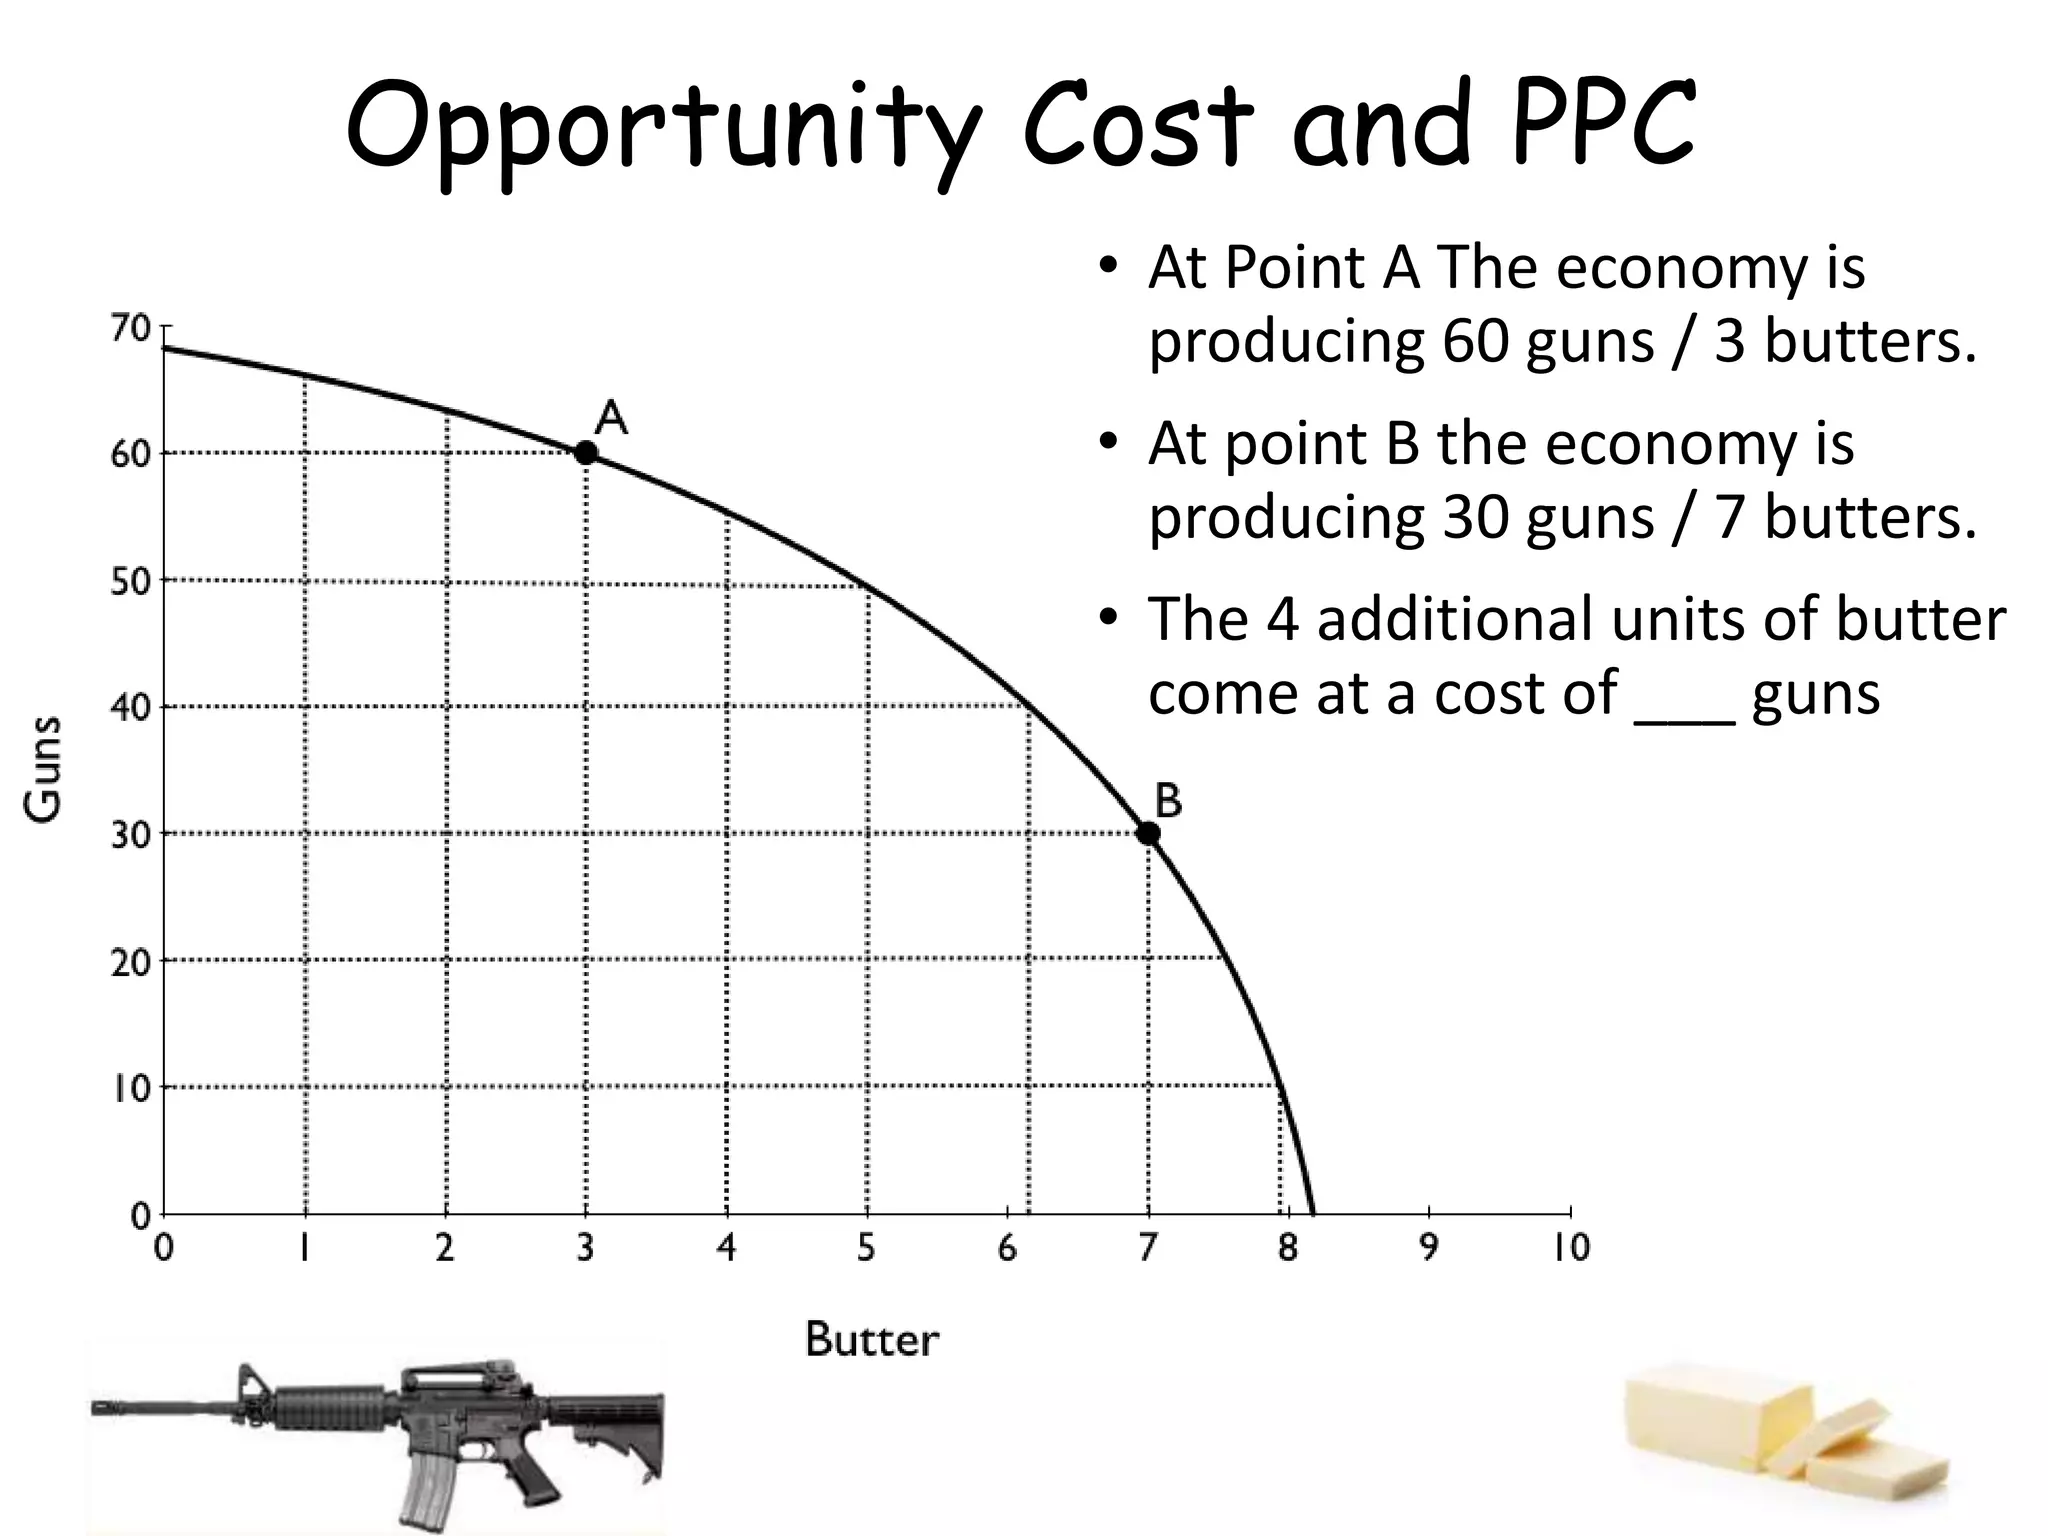
Opportunity Cost andPPC
• At Point A The economy is
producing 60 guns / 3 butters.
• At point B the economy is
producing 30 guns / 7 butters.
• The 4 additional units of butter
come at a cost of ___ guns
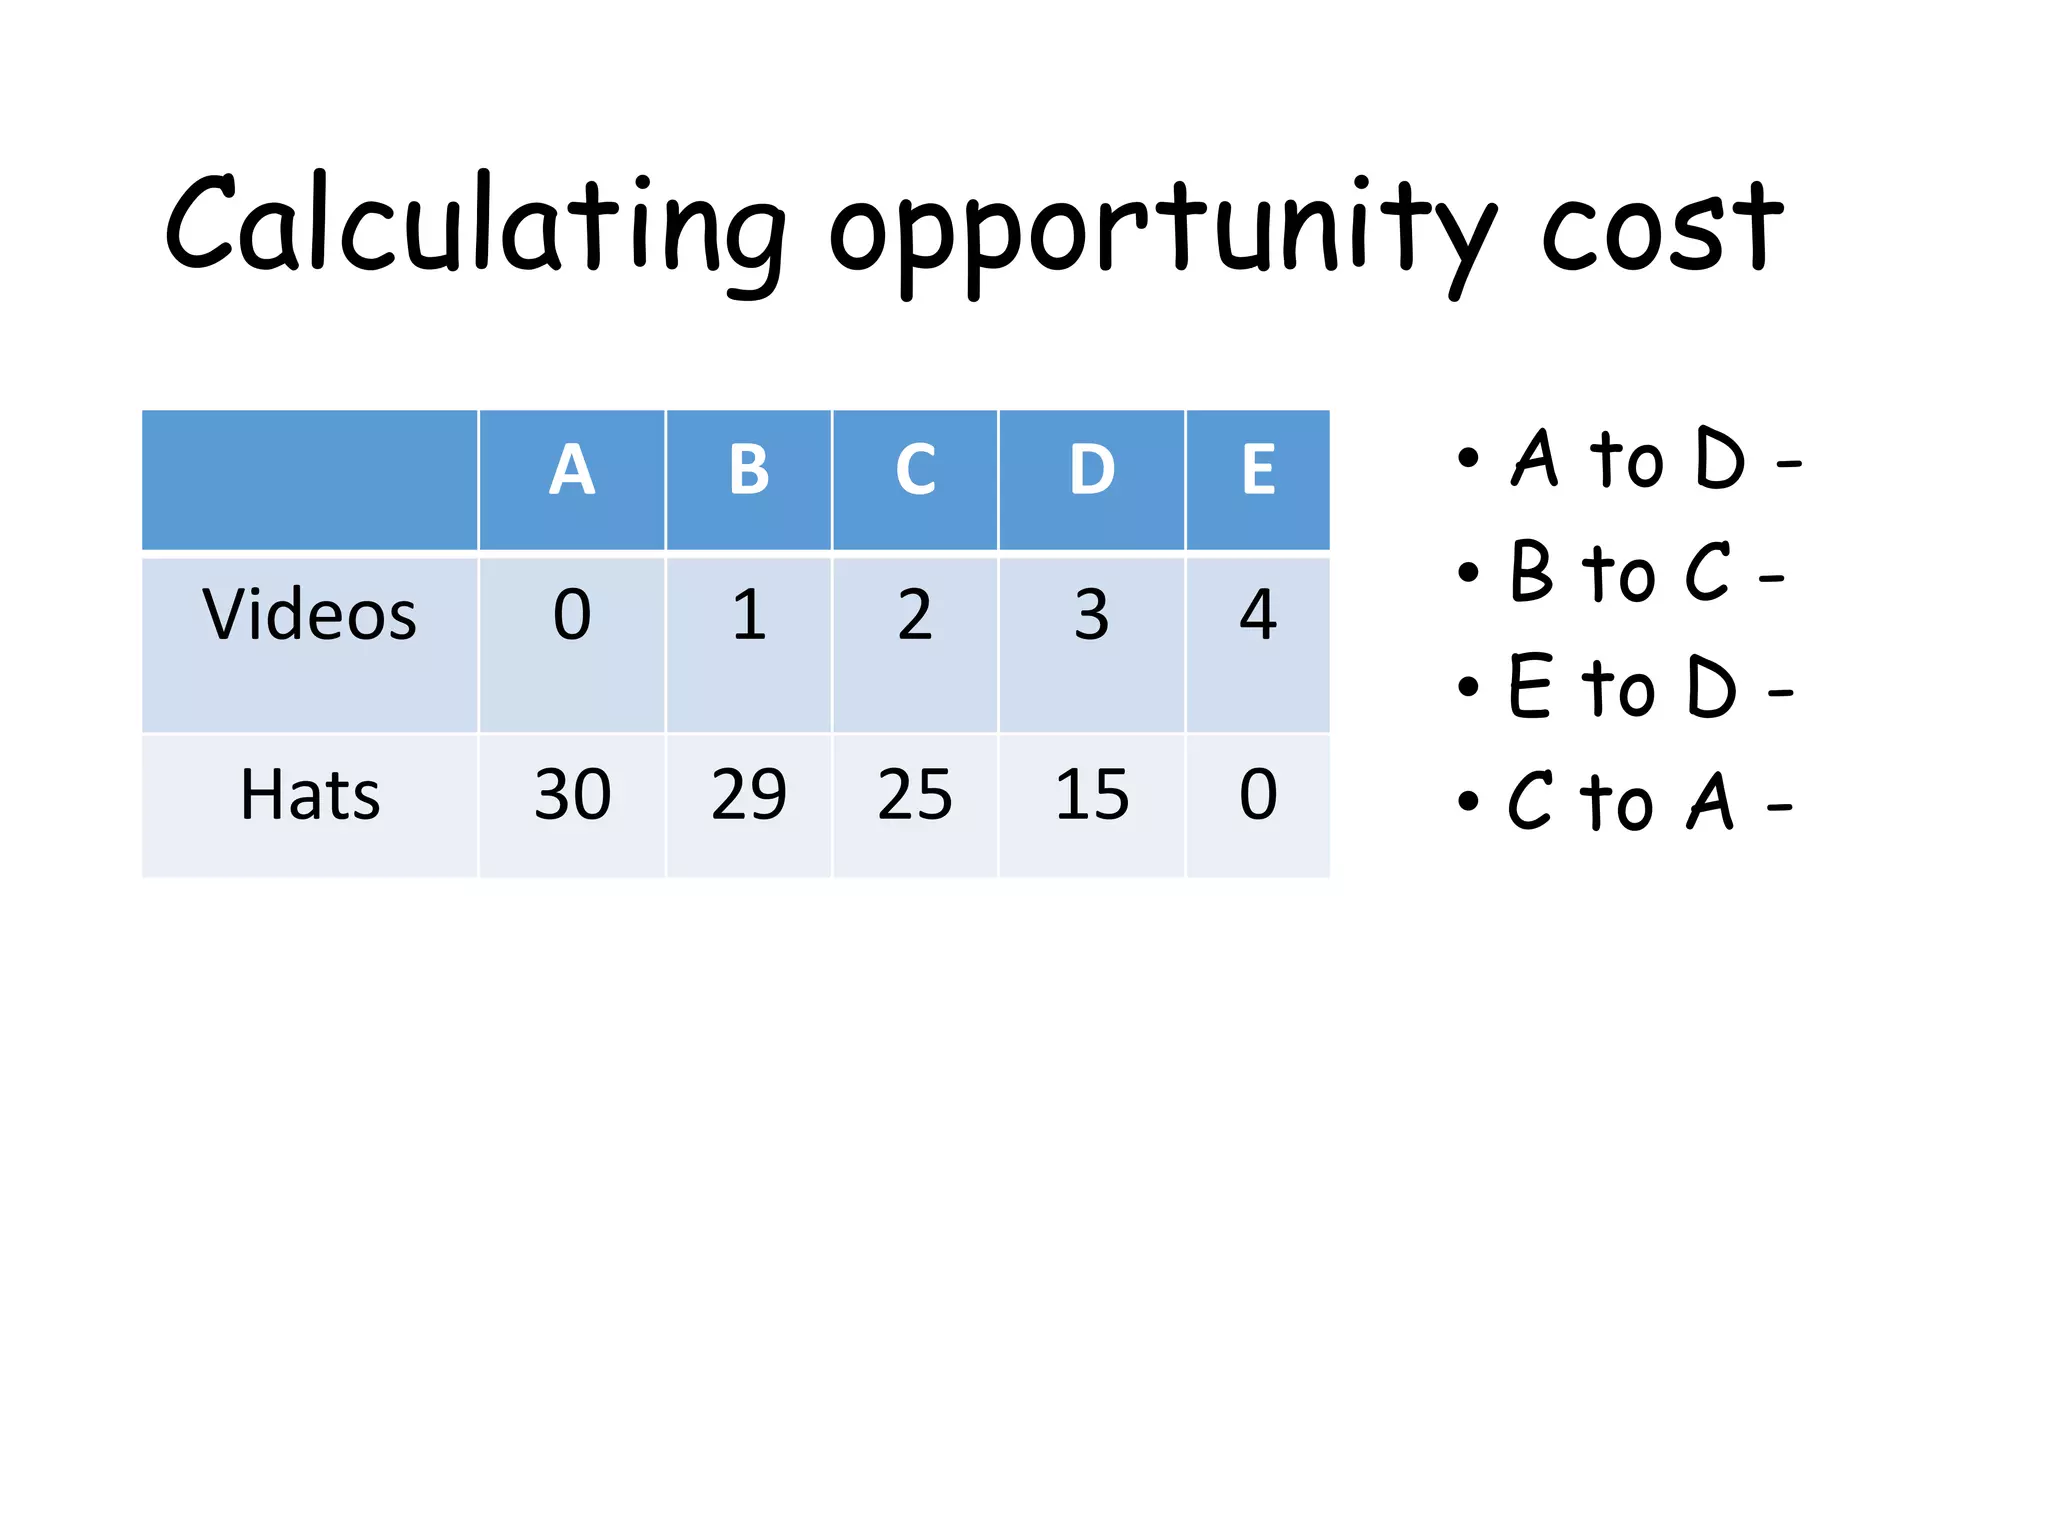
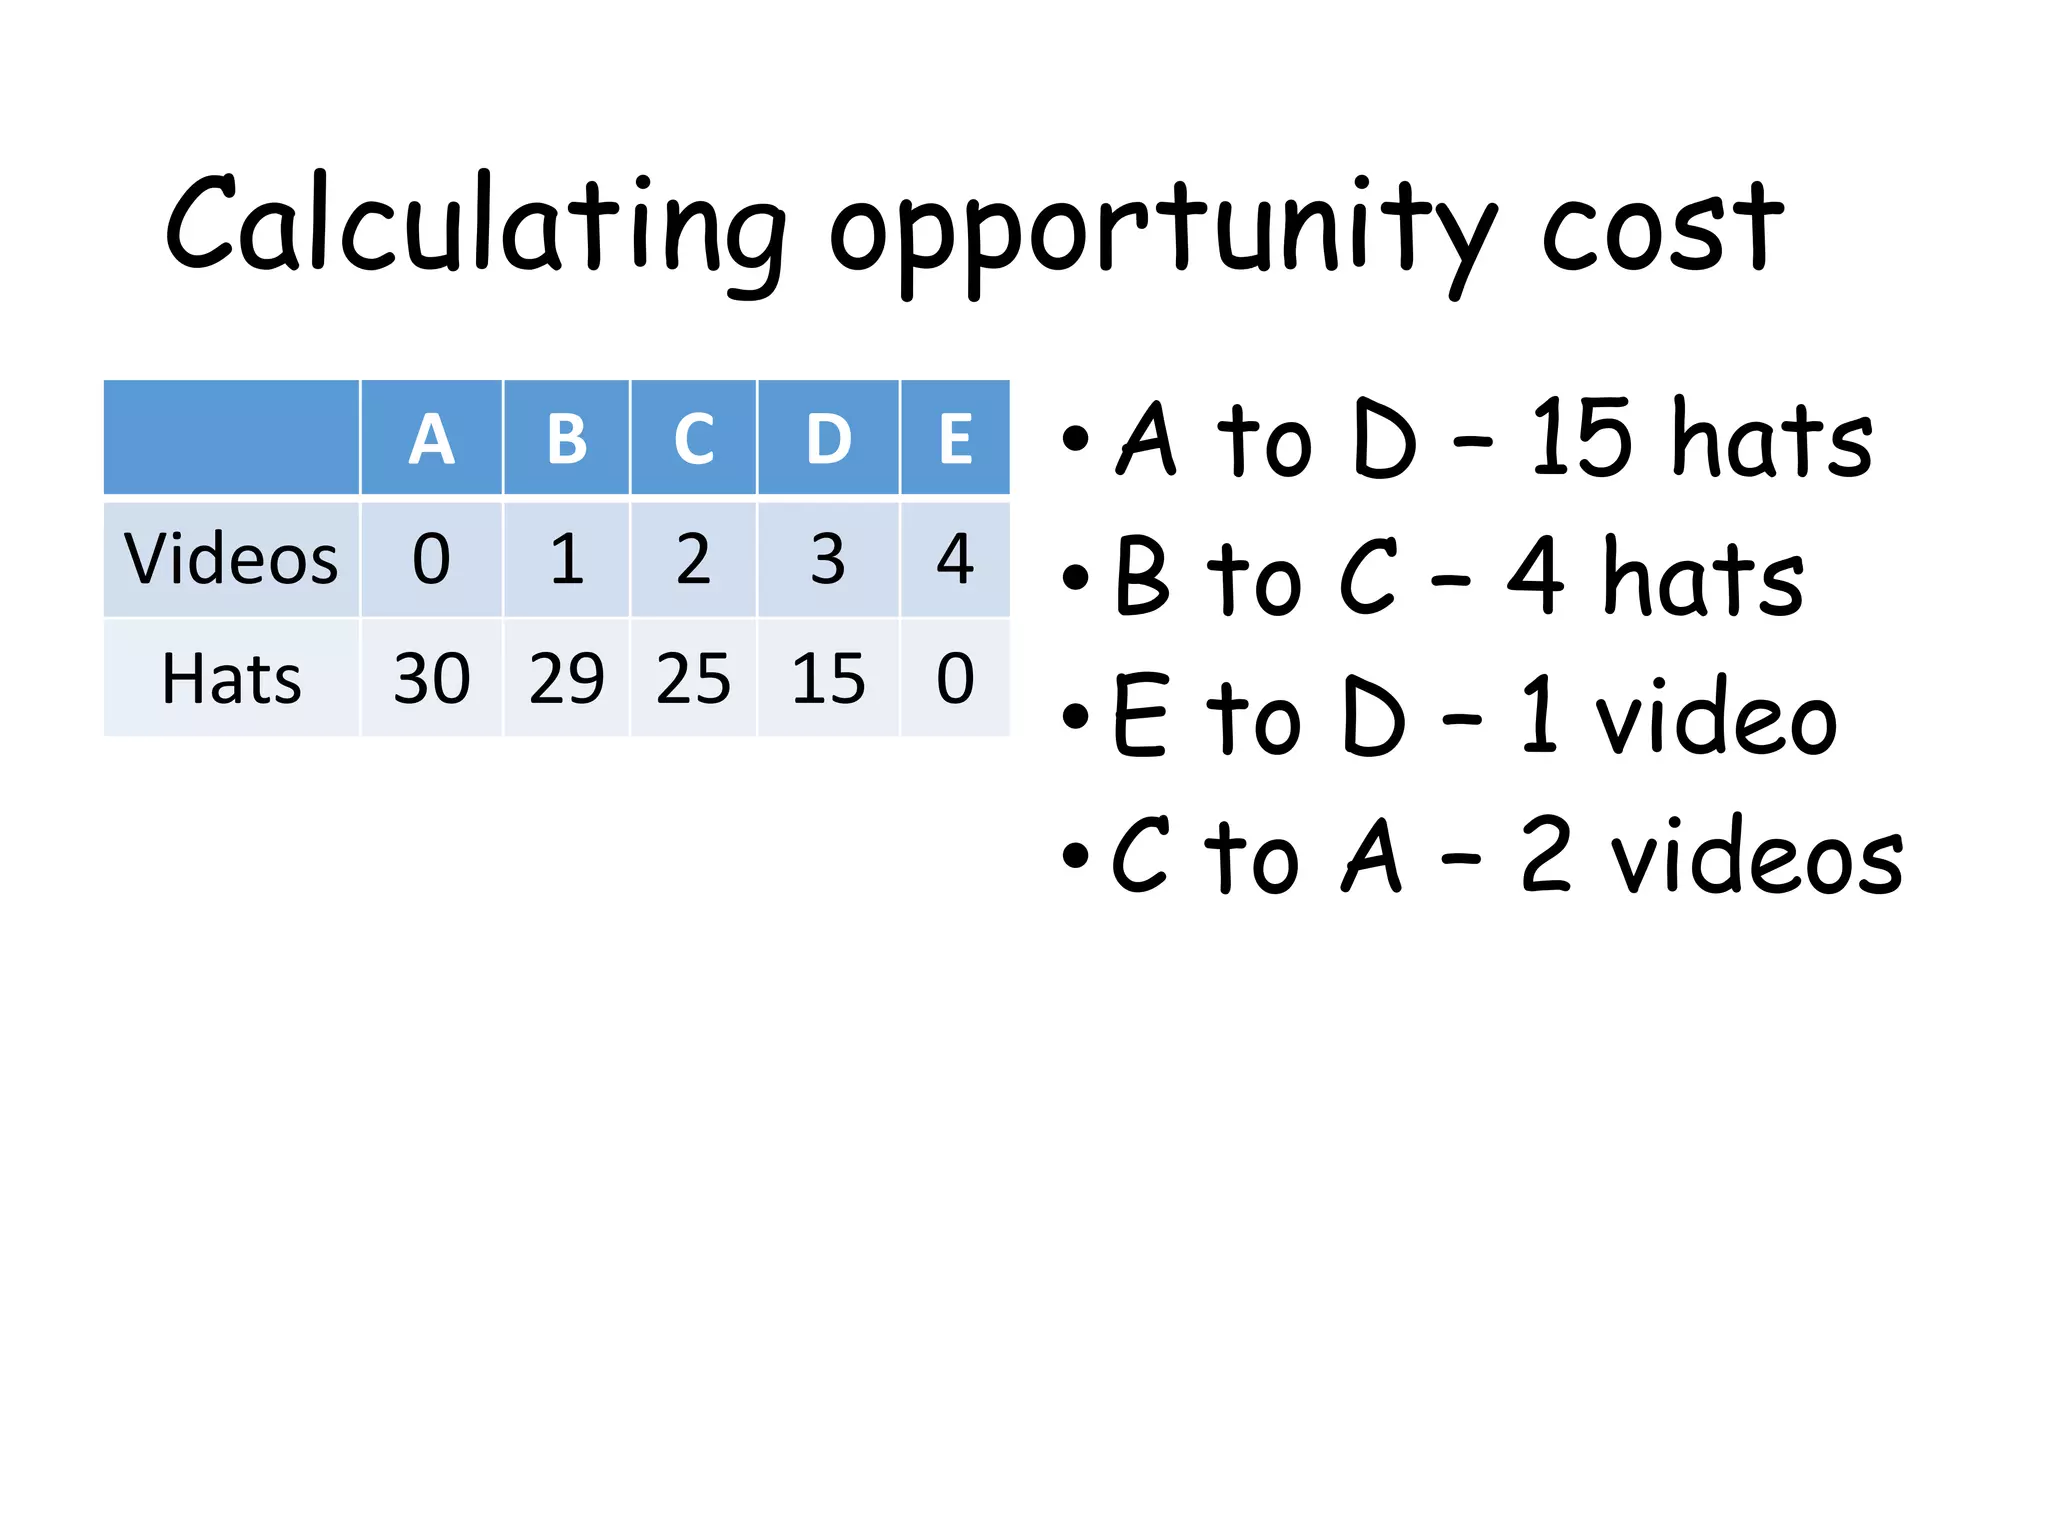
Calculating opportunity cost
AB C D E
Videos 0 1 2 3 4
Hats 30 29 25 15 0
•A to D – 15 hats
•B to C – 4 hats
•E to D – 1 video
•C to A – 2 videos
72.
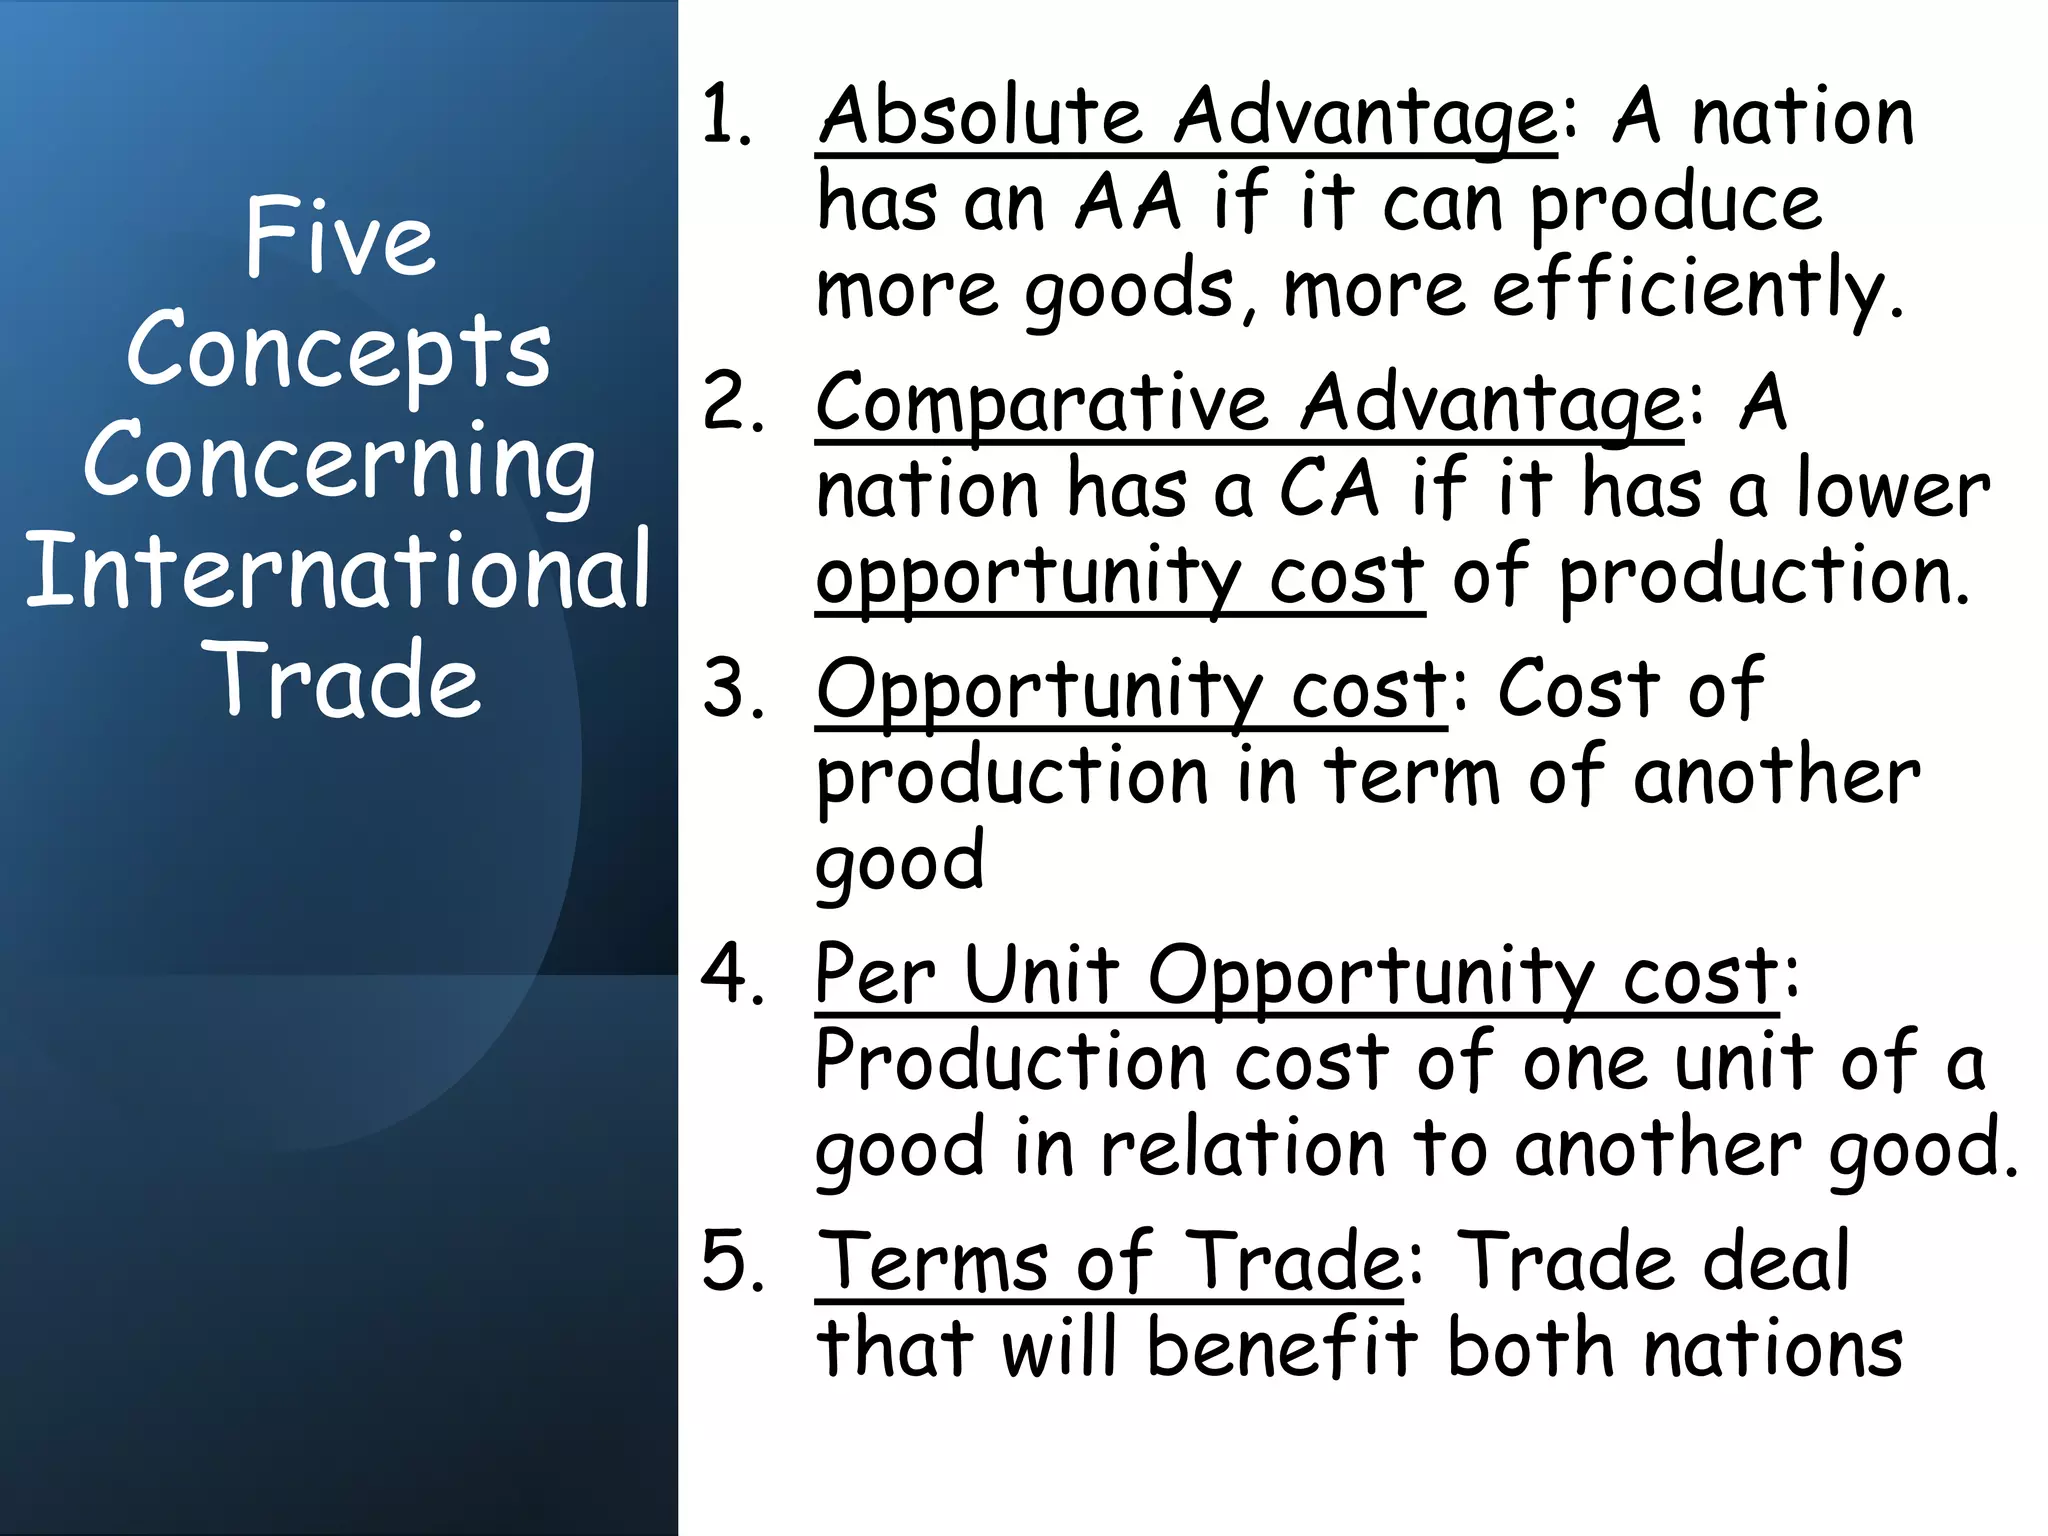
Five
Concepts
Concerning
International
Trade
1. Absolute Advantage:A nation
has an AA if it can produce
more goods, more efficiently.
2. Comparative Advantage: A
nation has a CA if it has a lower
opportunity cost of production.
3. Opportunity cost: Cost of
production in term of another
good
4. Per Unit Opportunity cost:
Production cost of one unit of a
good in relation to another good.
5. Terms of Trade: Trade deal
that will benefit both nations
73.
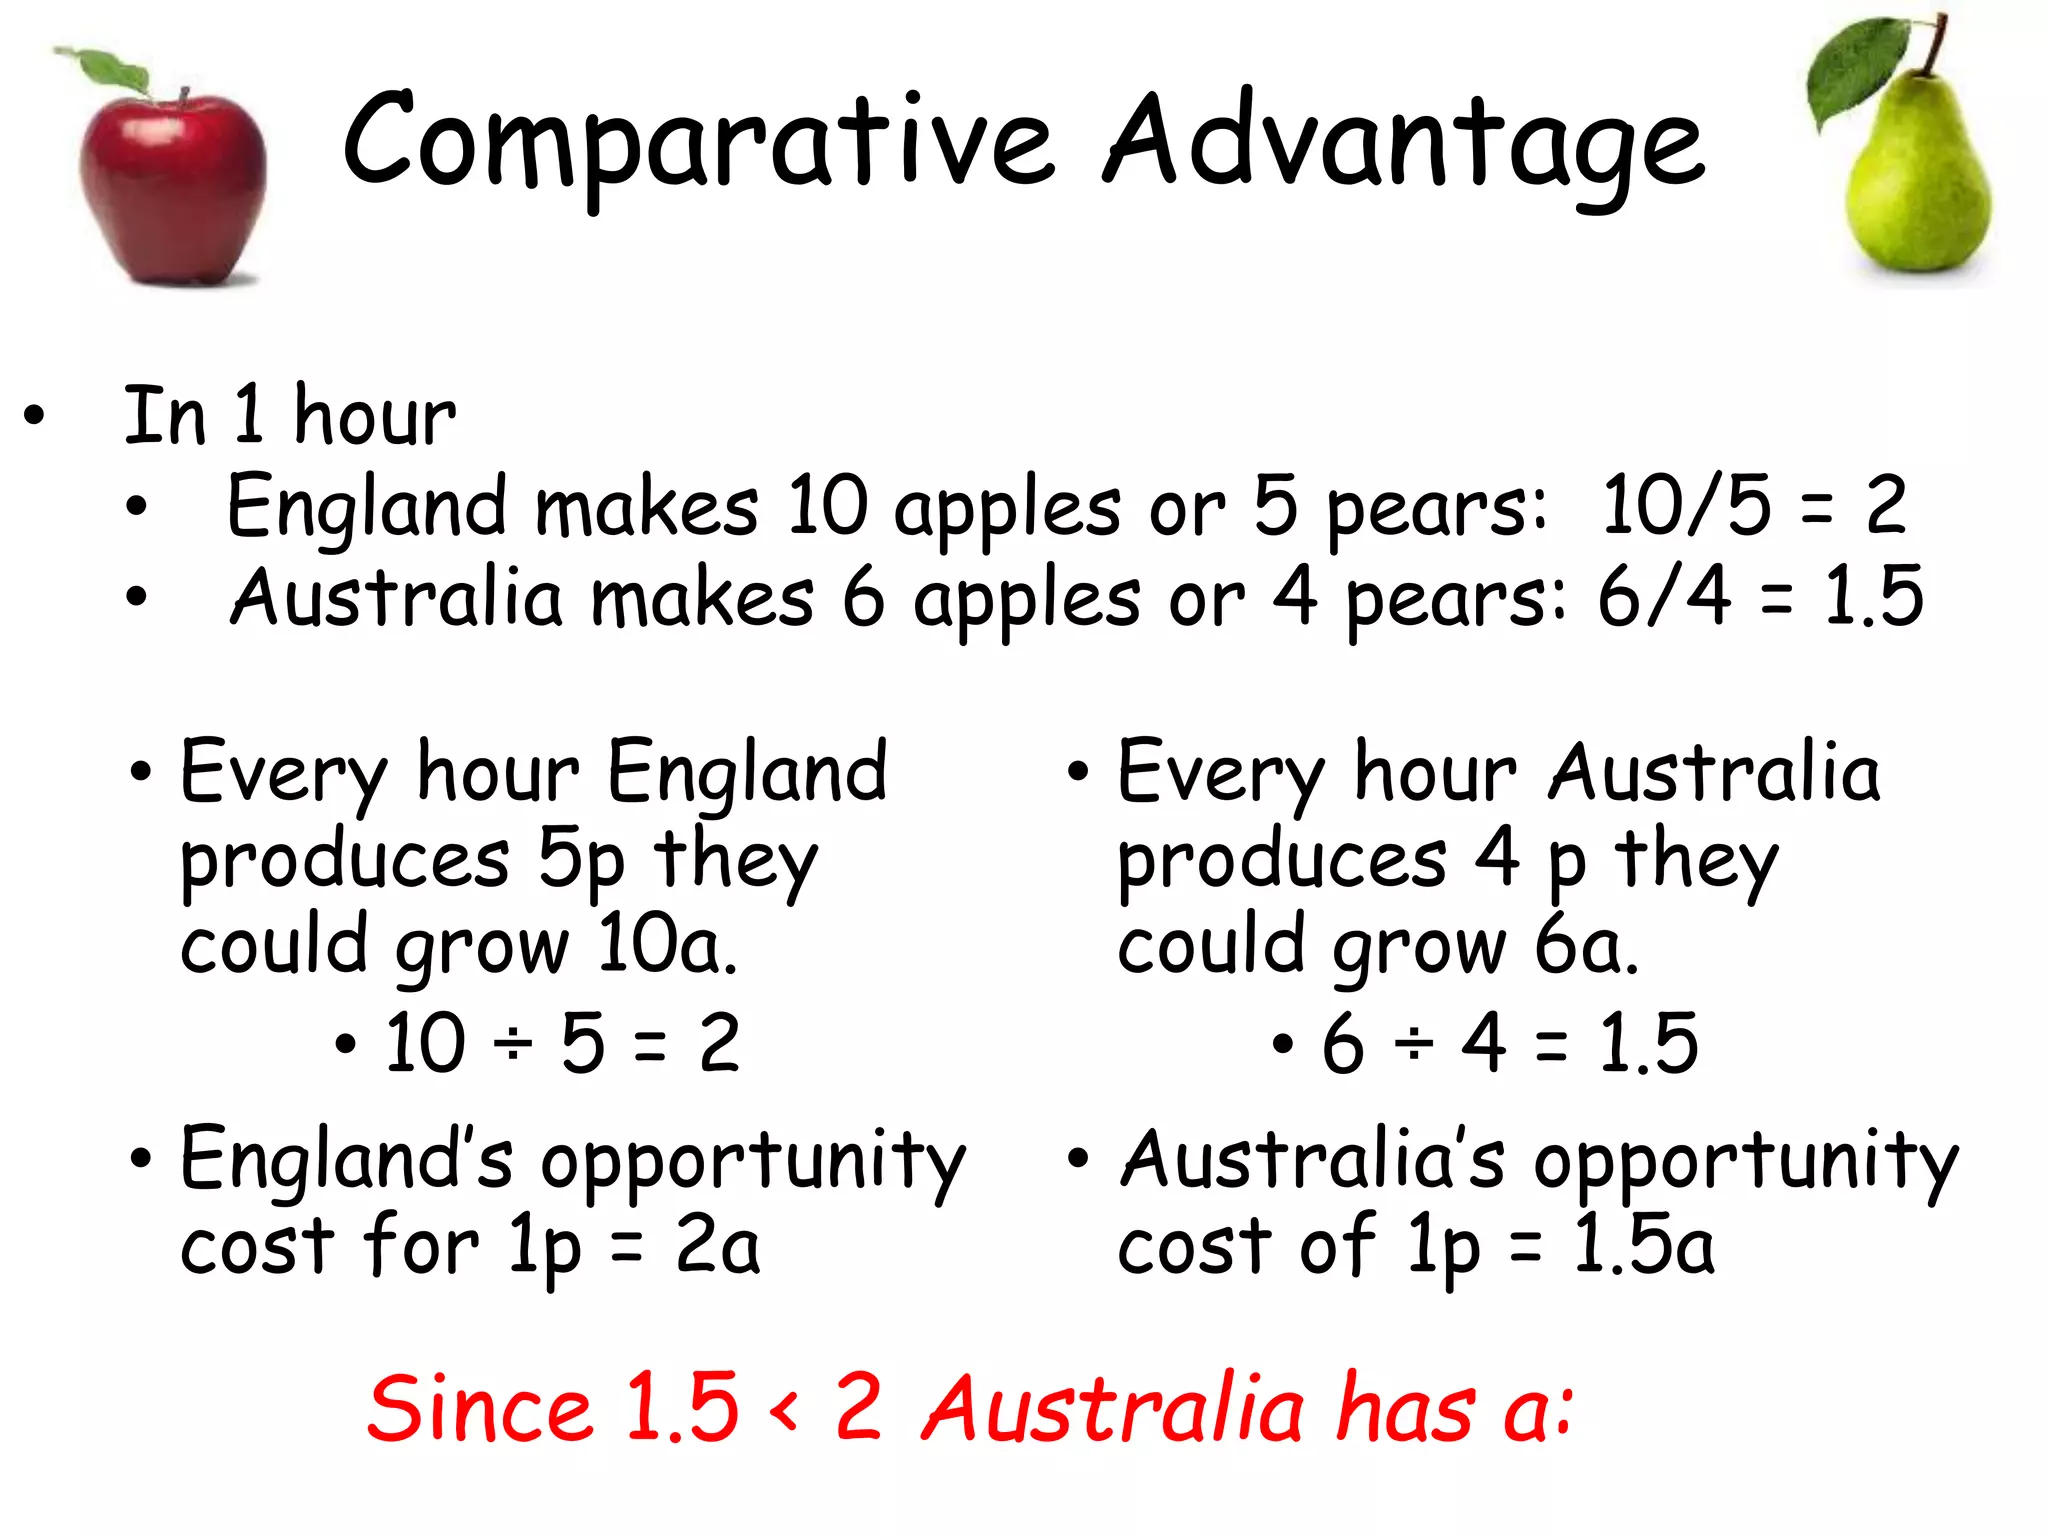
Comparative Advantage
• In1 hour
• England makes 10 apples or 5 pears: 10/5 = 2
• Australia makes 6 apples or 4 pears: 6/4 = 1.5
• Every hour England
produces 5p they
could grow 10a.
• 10 ÷ 5 = 2
• England’s opportunity
cost for 1p = 2a
• Every hour Australia
produces 4 p they
could grow 6a.
• 6 ÷ 4 = 1.5
• Australia’s opportunity
cost of 1p = 1.5a
Since 1.5 < 2 Australia has a:
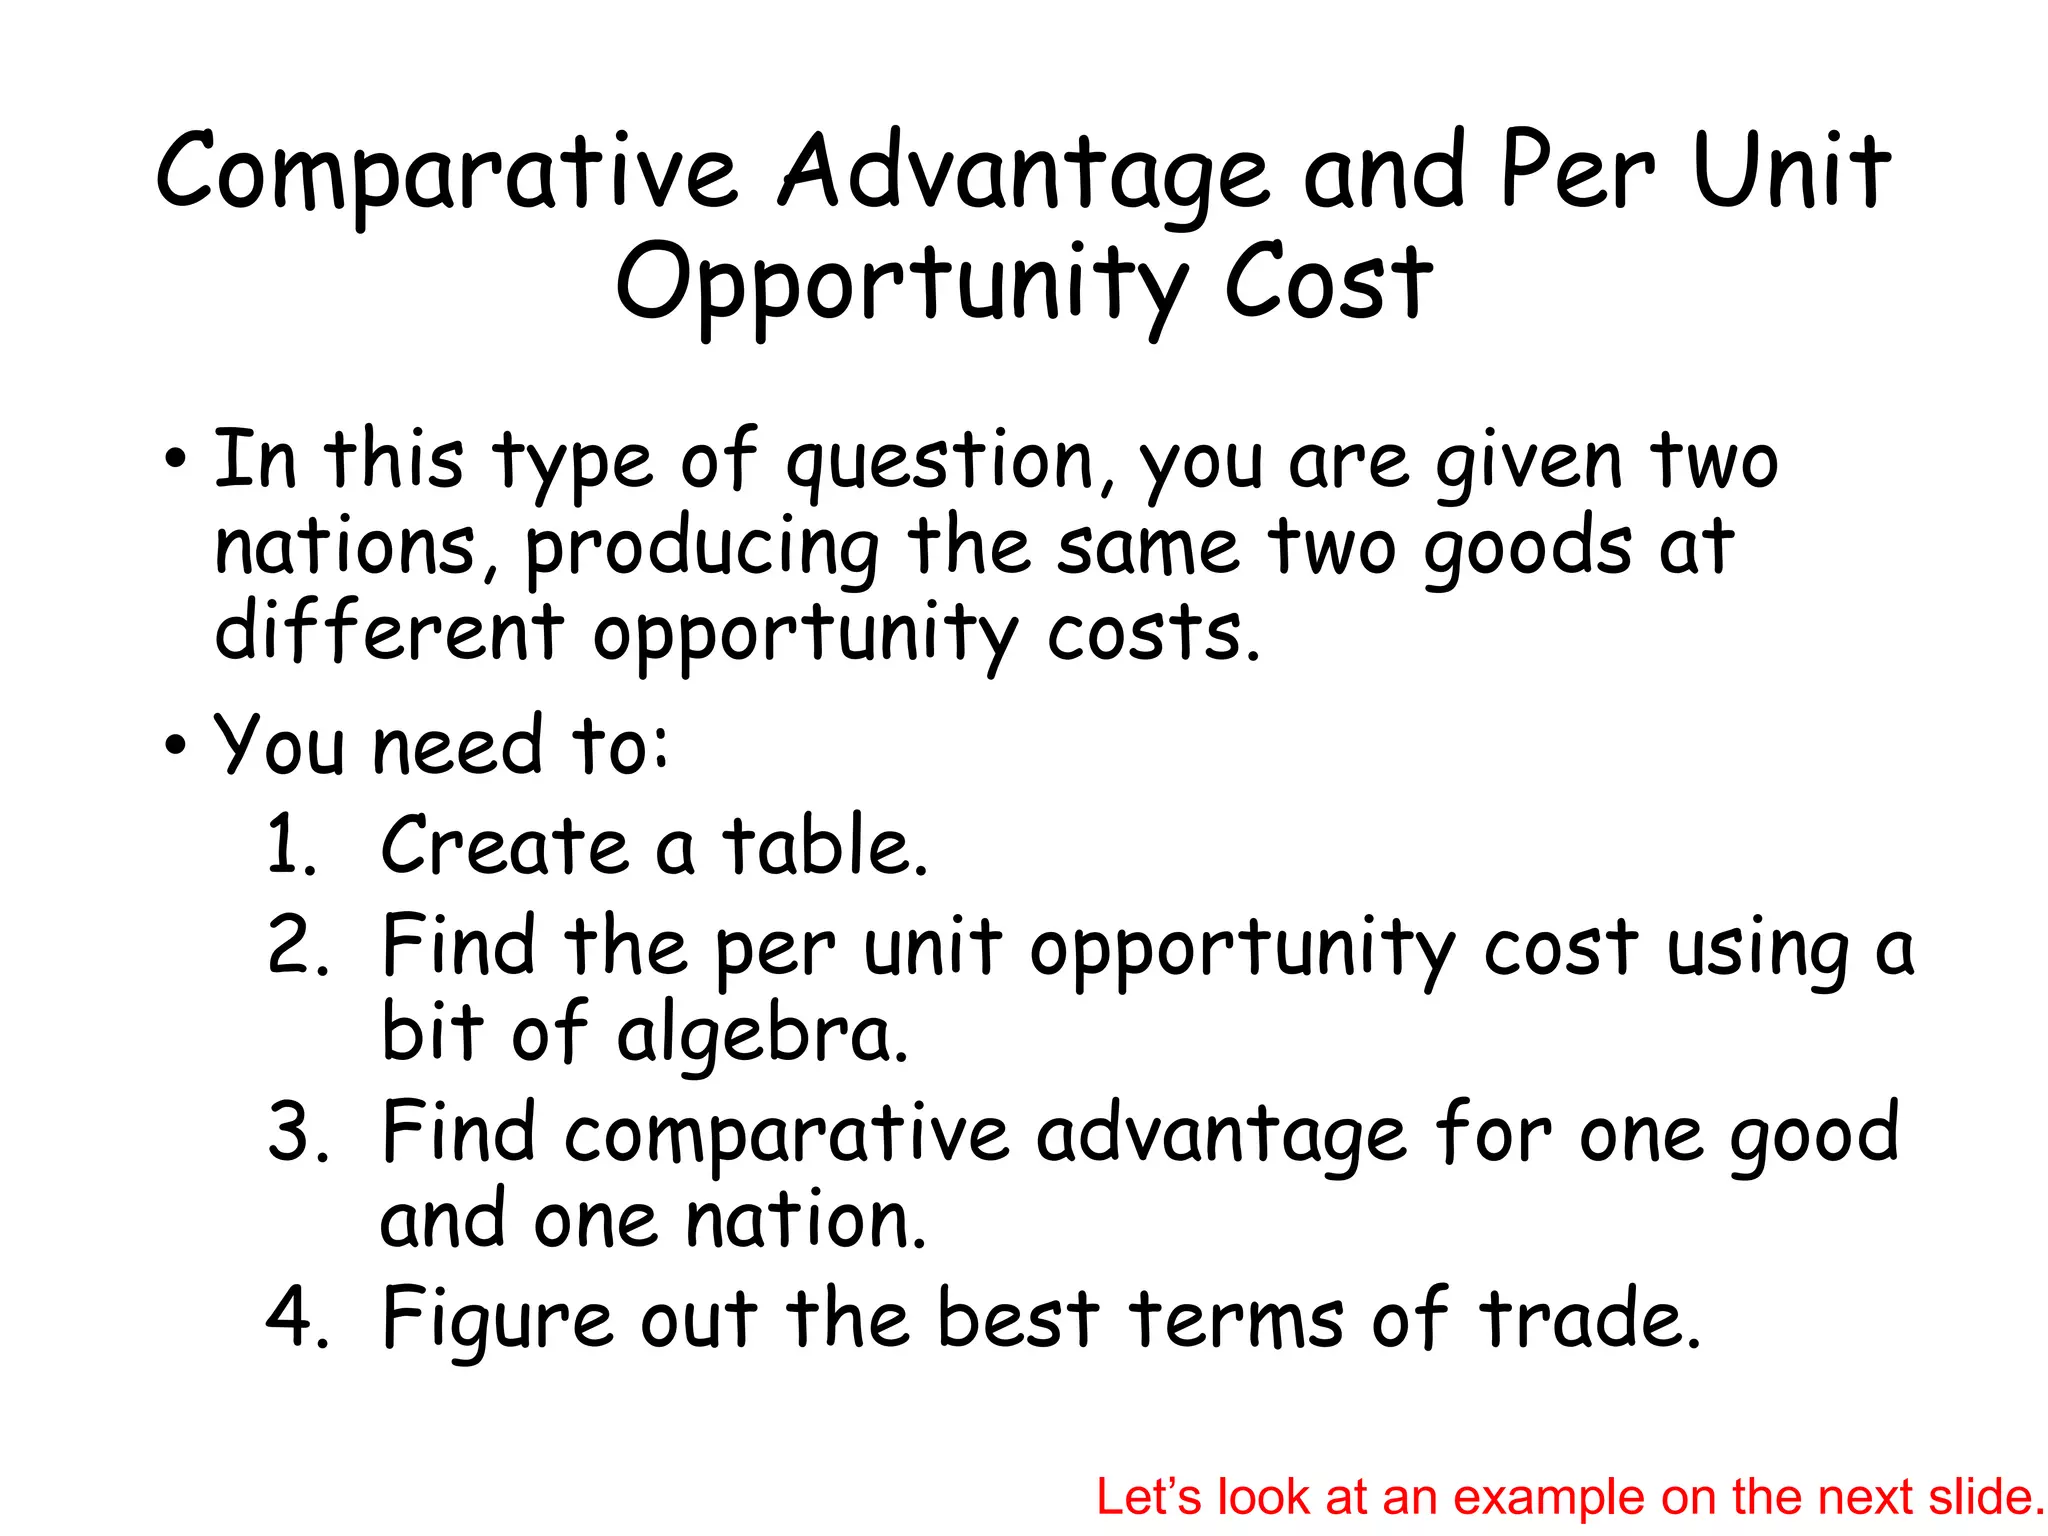
Comparative Advantage andPer Unit
Opportunity Cost
• In this type of question, you are given two
nations, producing the same two goods at
different opportunity costs.
• You need to:
1. Create a table.
2. Find the per unit opportunity cost using a
bit of algebra.
3. Find comparative advantage for one good
and one nation.
4. Figure out the best terms of trade.
Let’s look at an example on the next slide.
77.
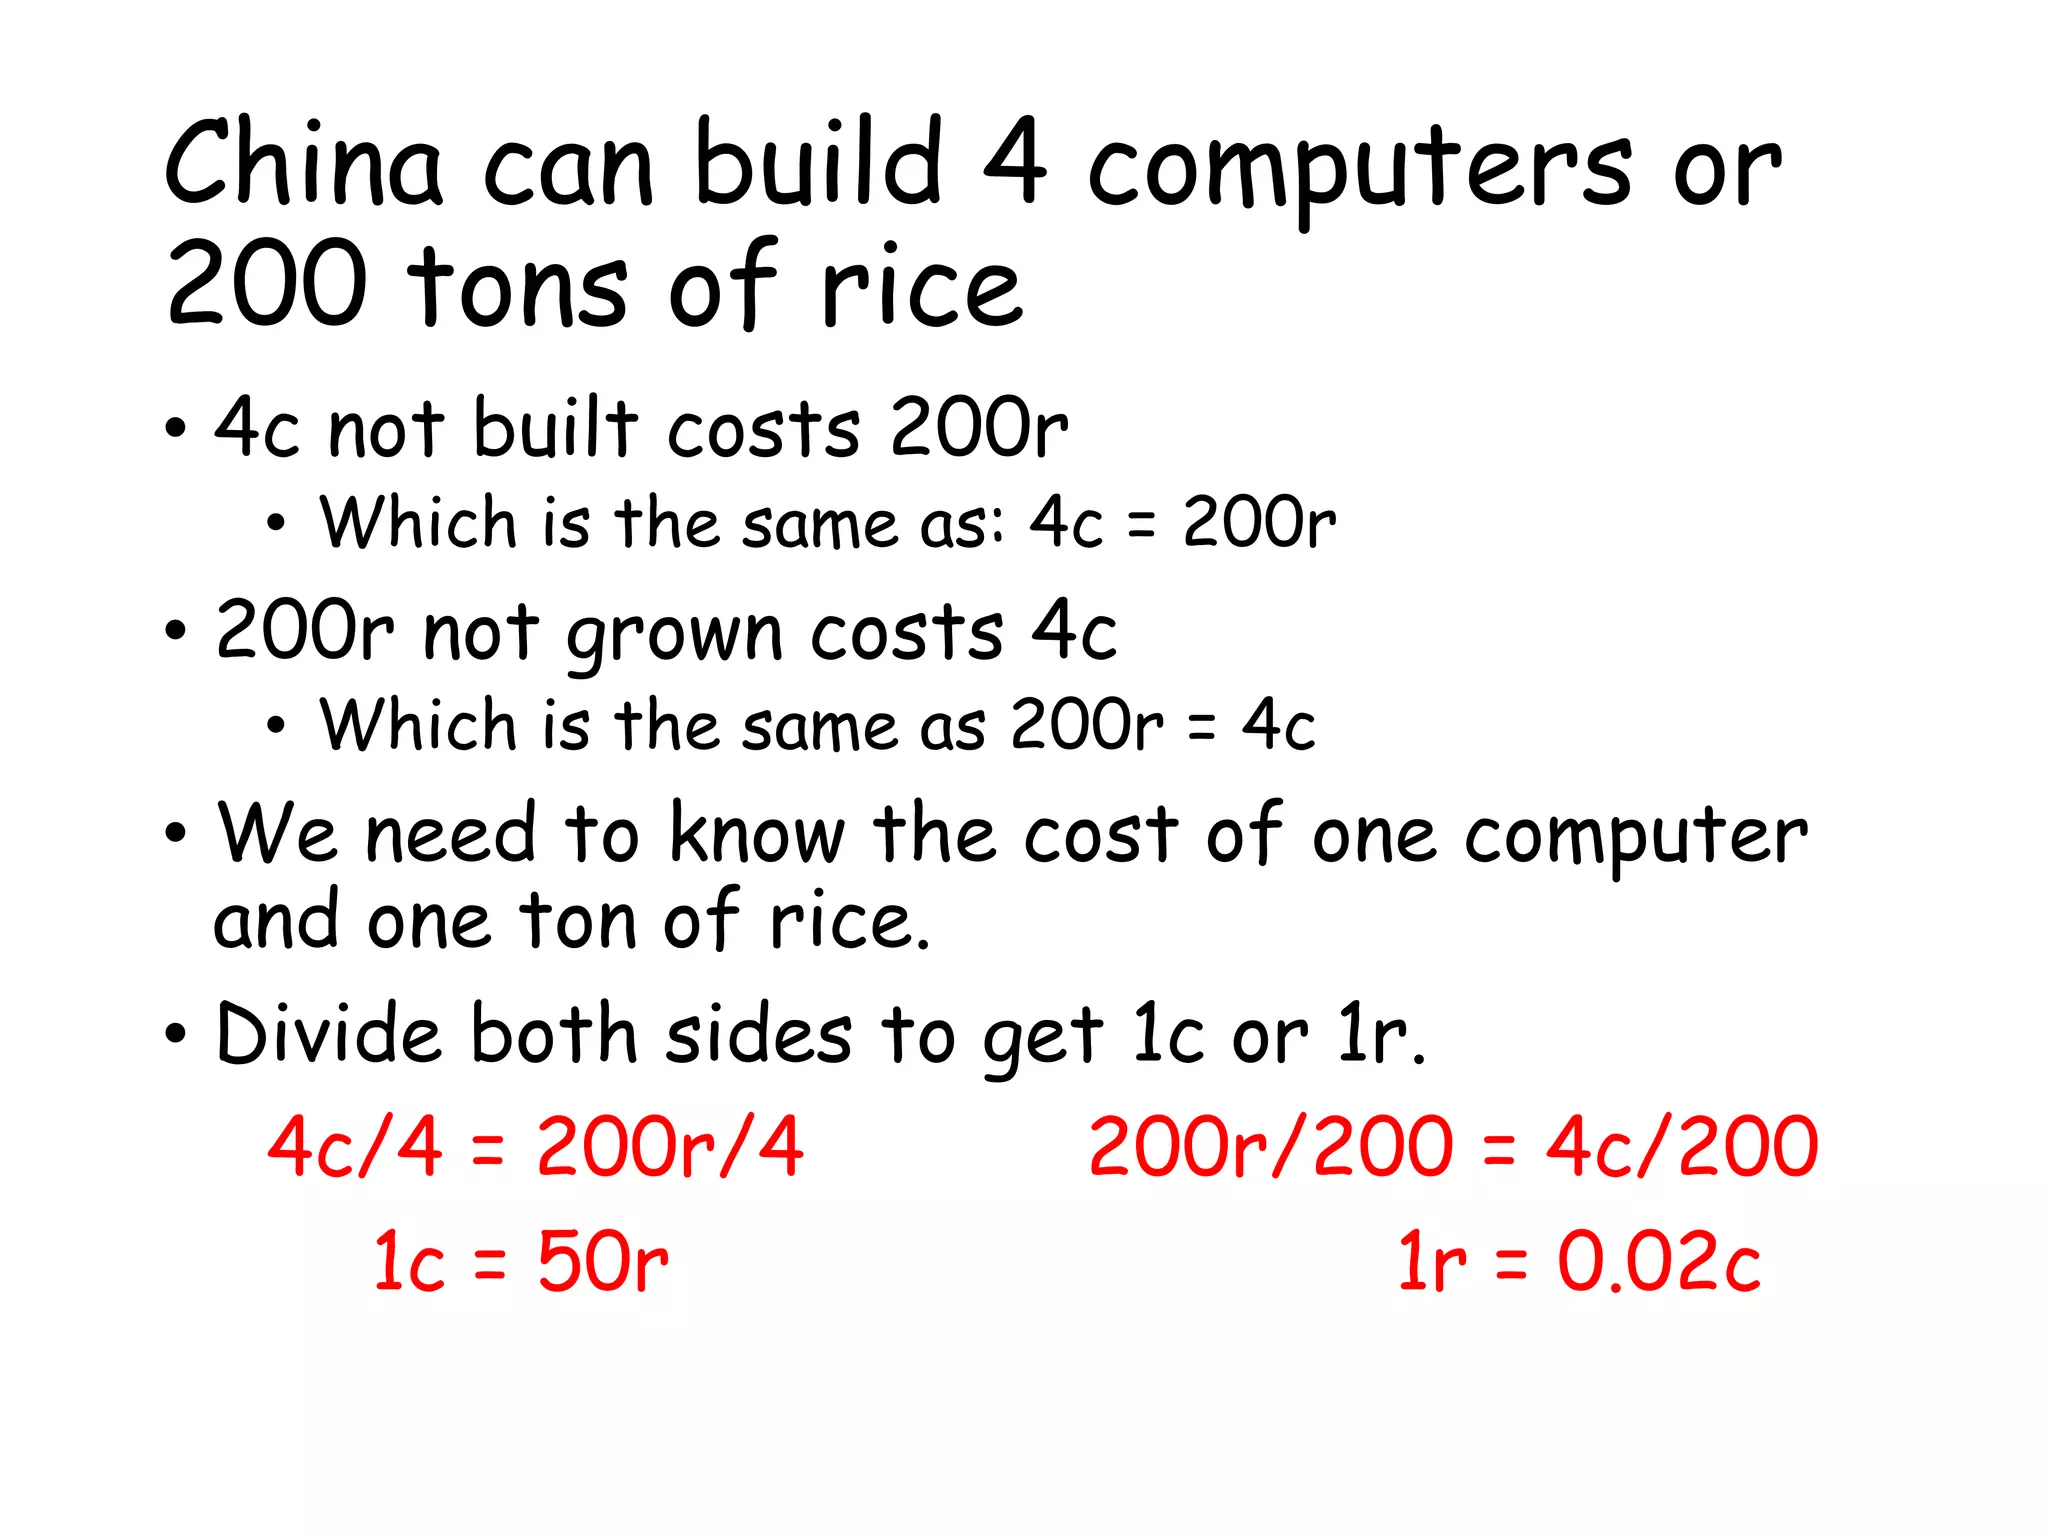
China can build4 computers or
200 tons of rice
• 4c not built costs 200r
• Which is the same as: 4c = 200r
• 200r not grown costs 4c
• Which is the same as 200r = 4c
• We need to know the cost of one computer
and one ton of rice.
• Divide both sides to get 1c or 1r.
4c/4 = 200r/4 200r/200 = 4c/200
1c = 50r 1r = 0.02c
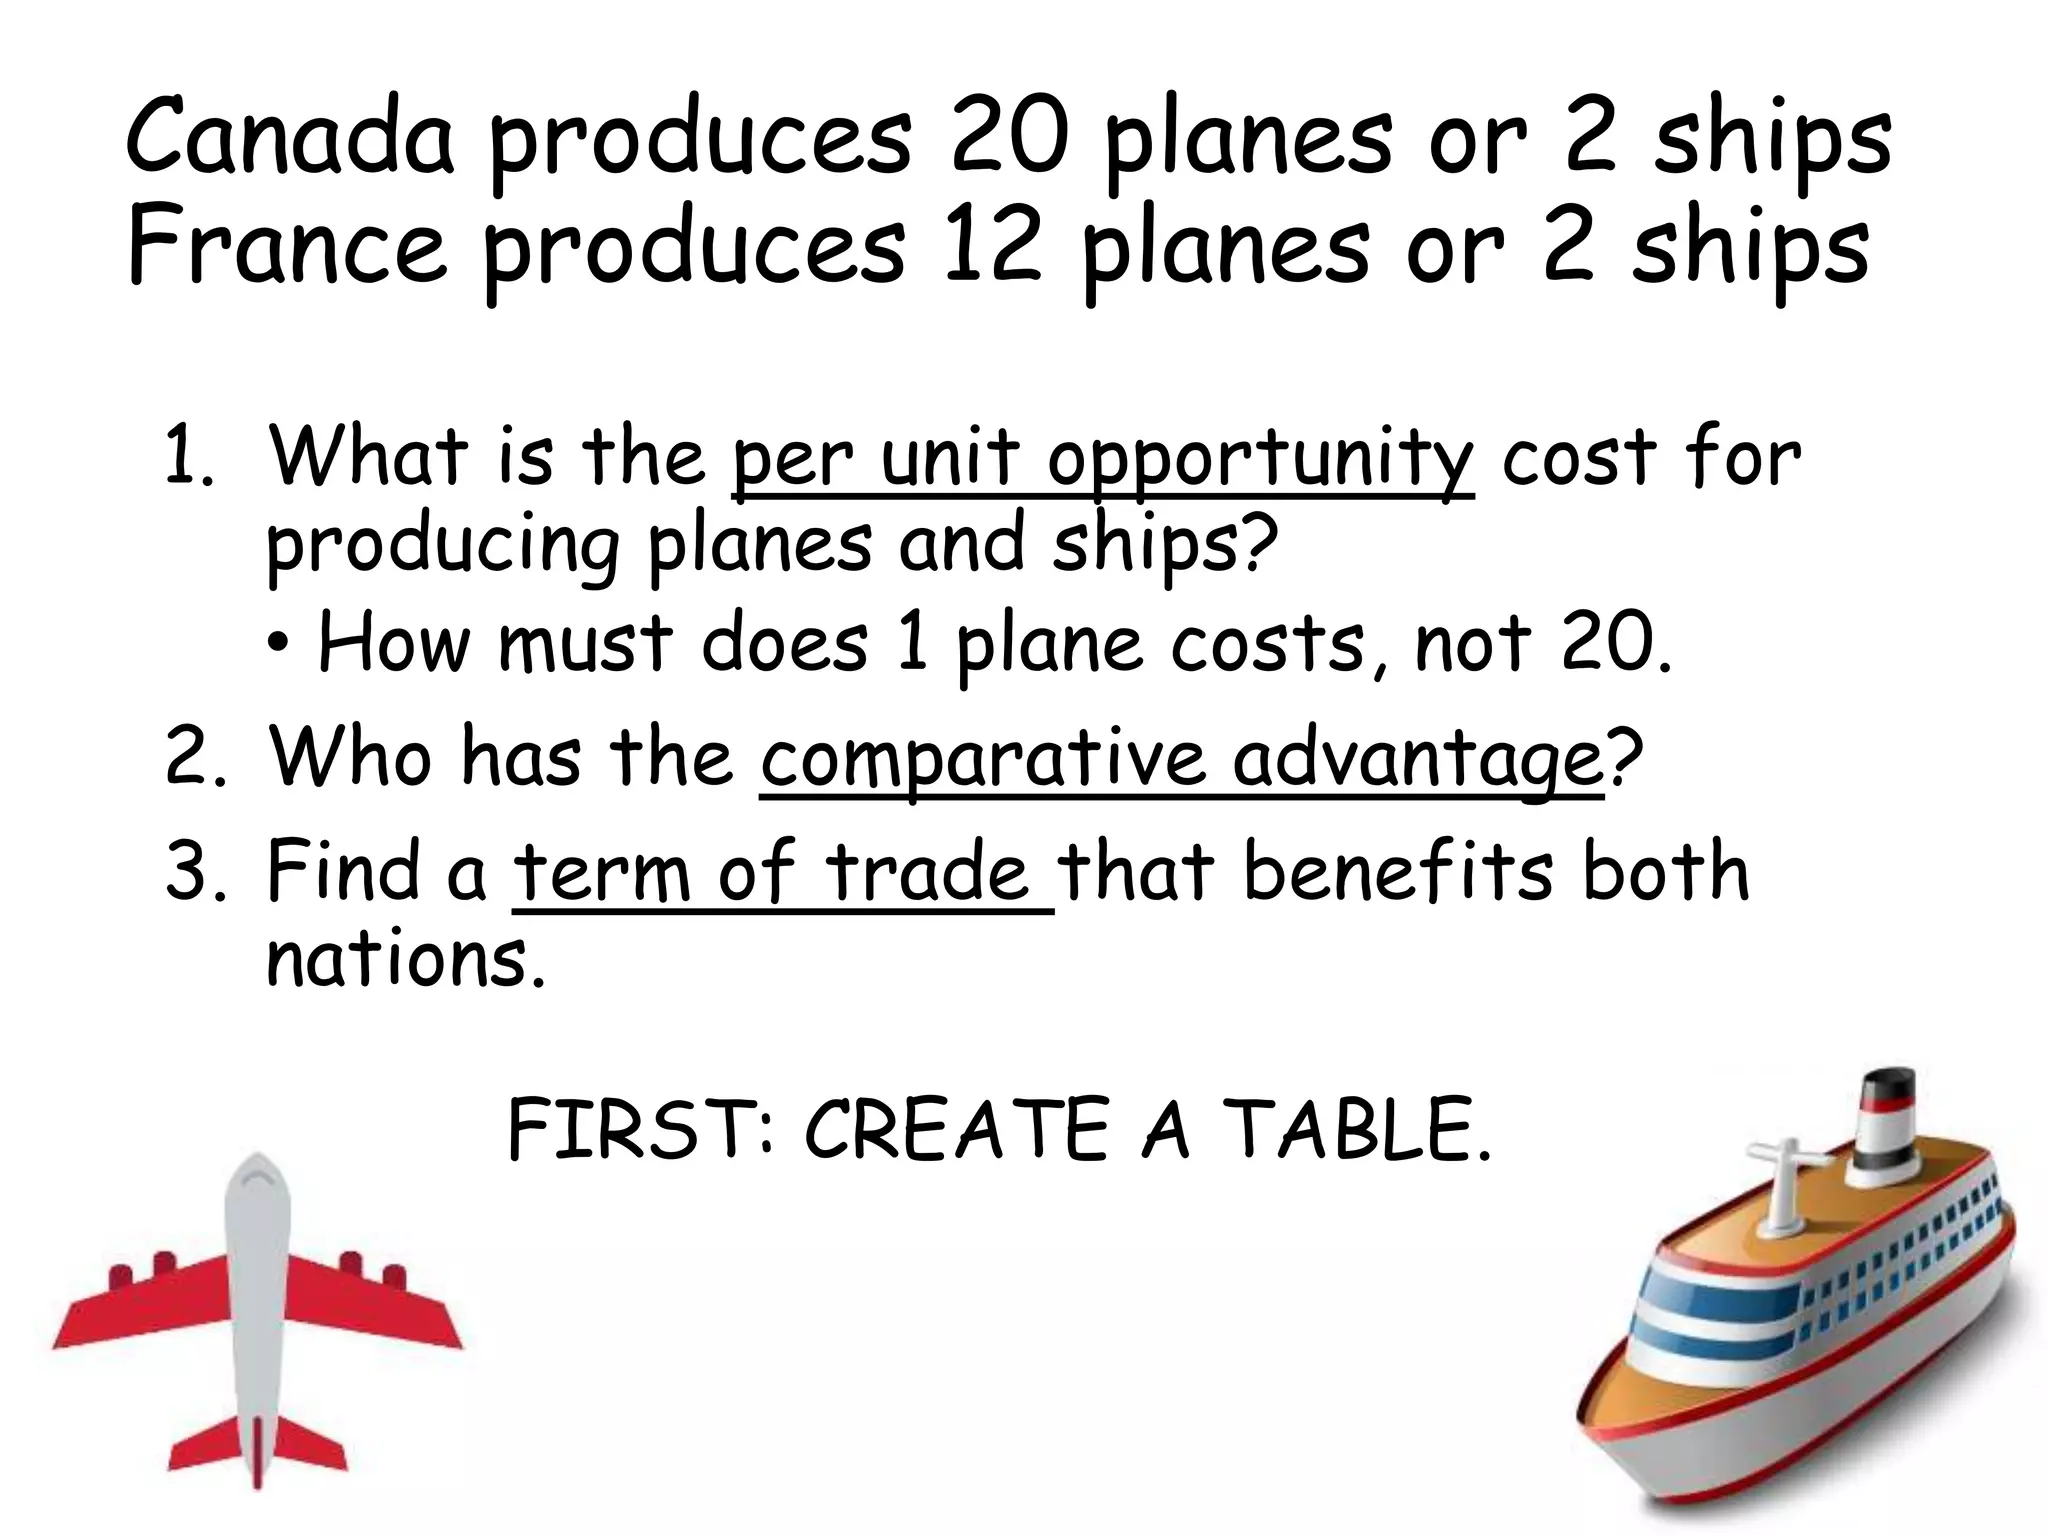
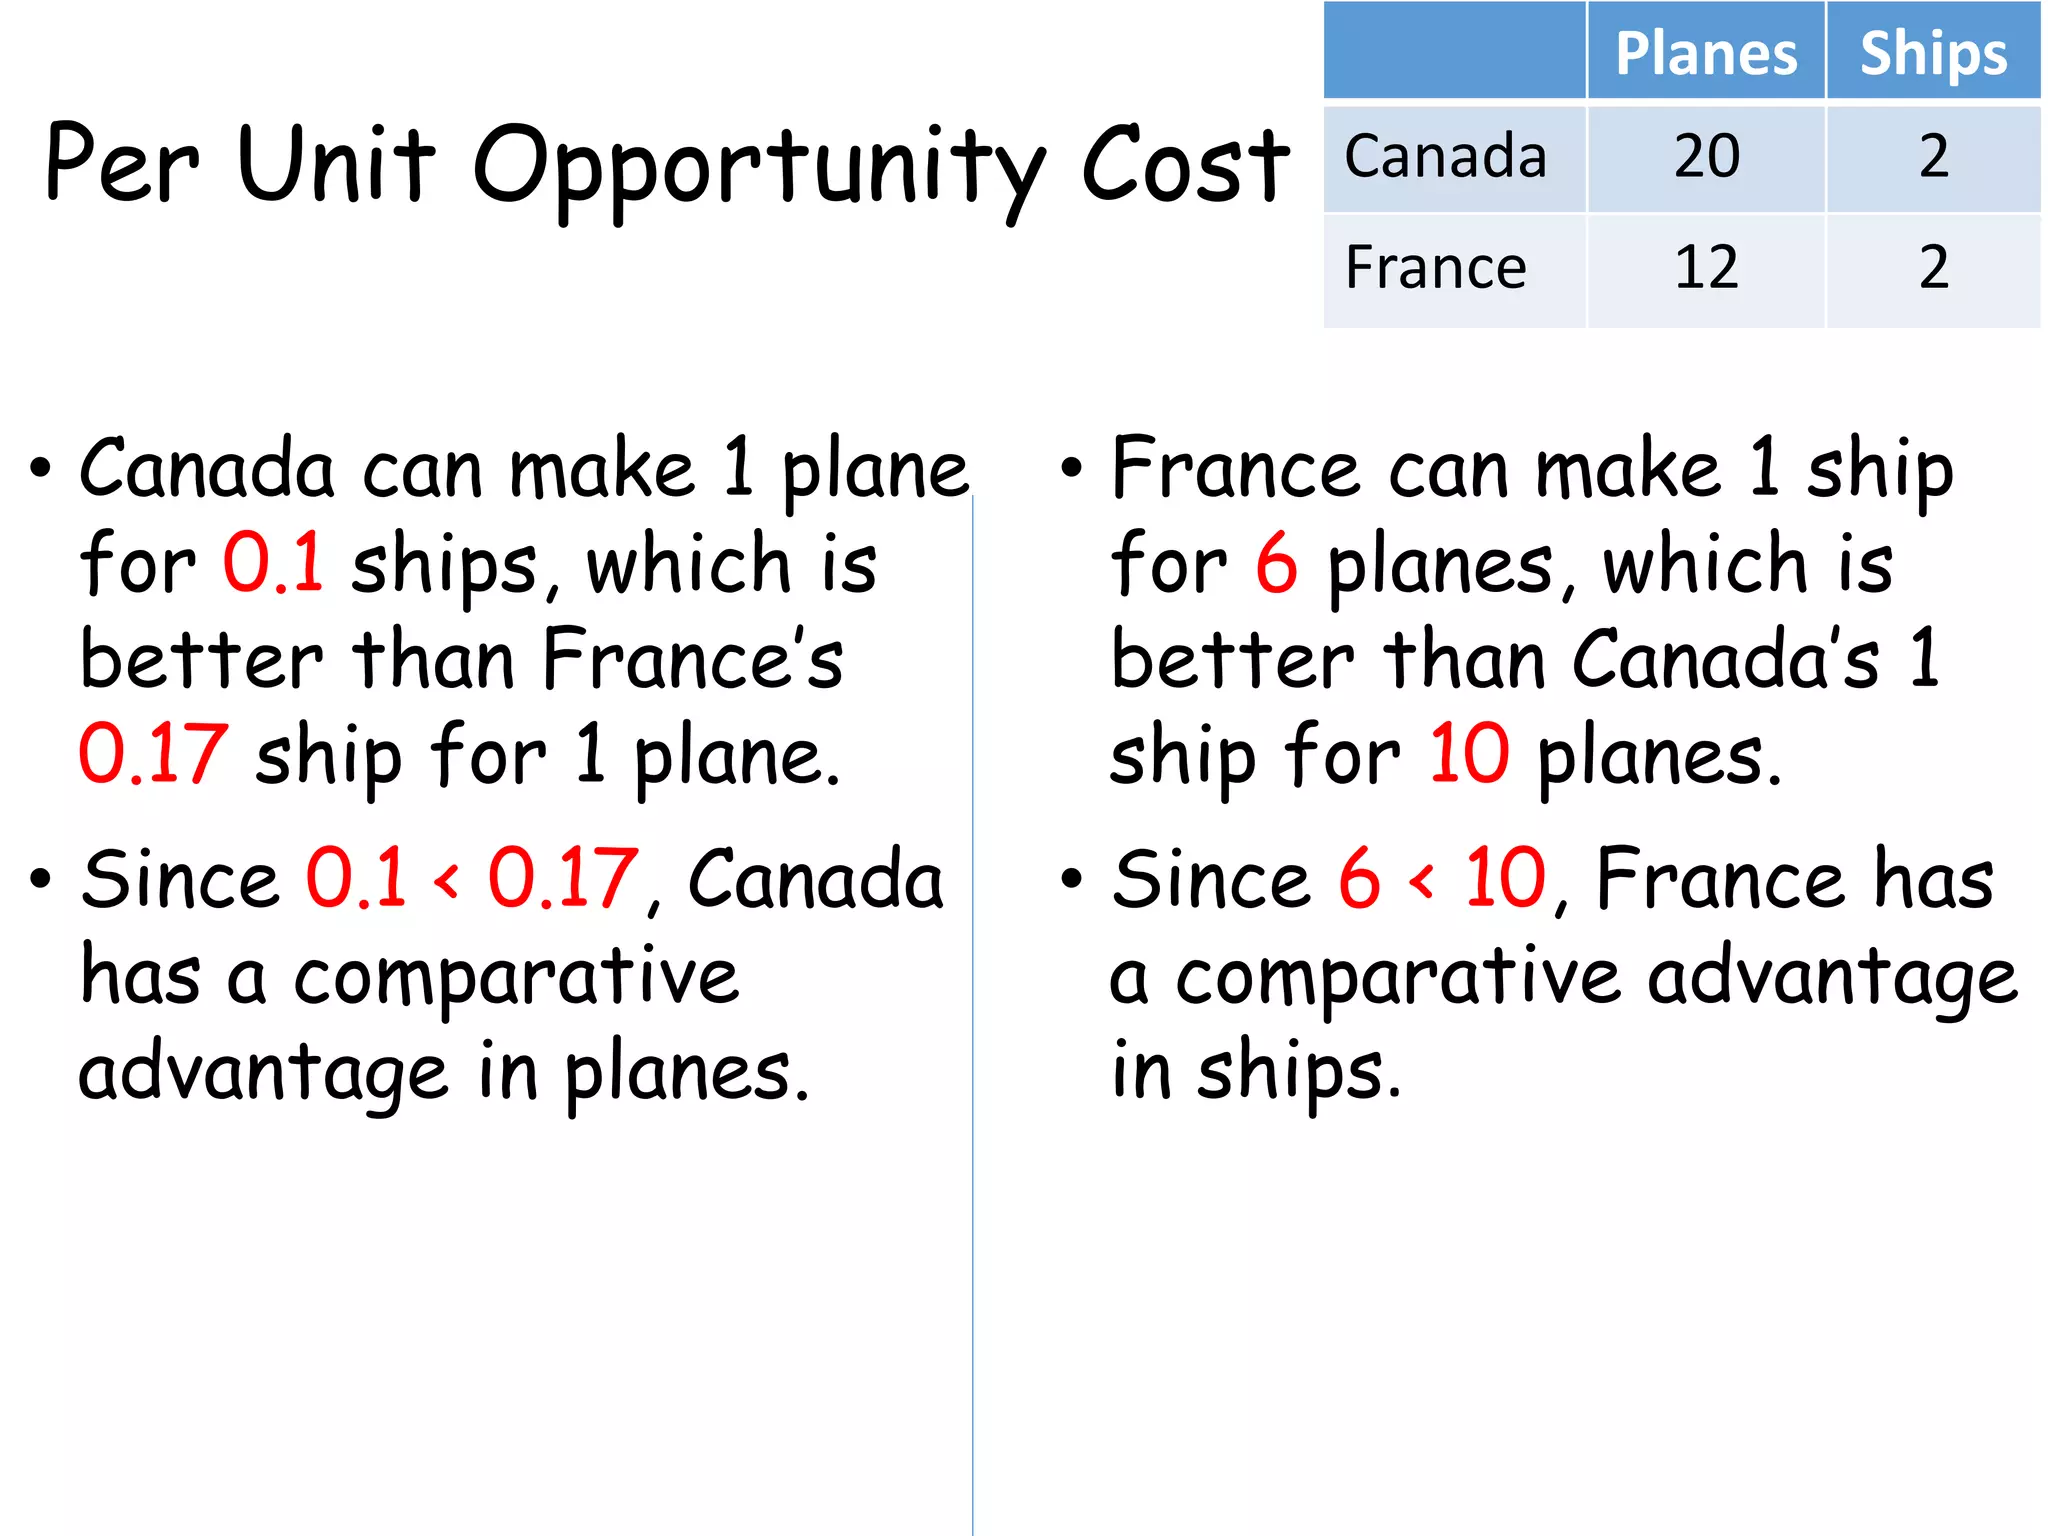
Canada produces 20planes or 2 ships
France produces 12 planes or 2 ships
1. What is the per unit opportunity cost for
producing planes and ships?
• How must does 1 plane costs, not 20.
2. Who has the comparative advantage?
3. Find a term of trade that benefits both
nations.
FIRST: CREATE A TABLE.
80.
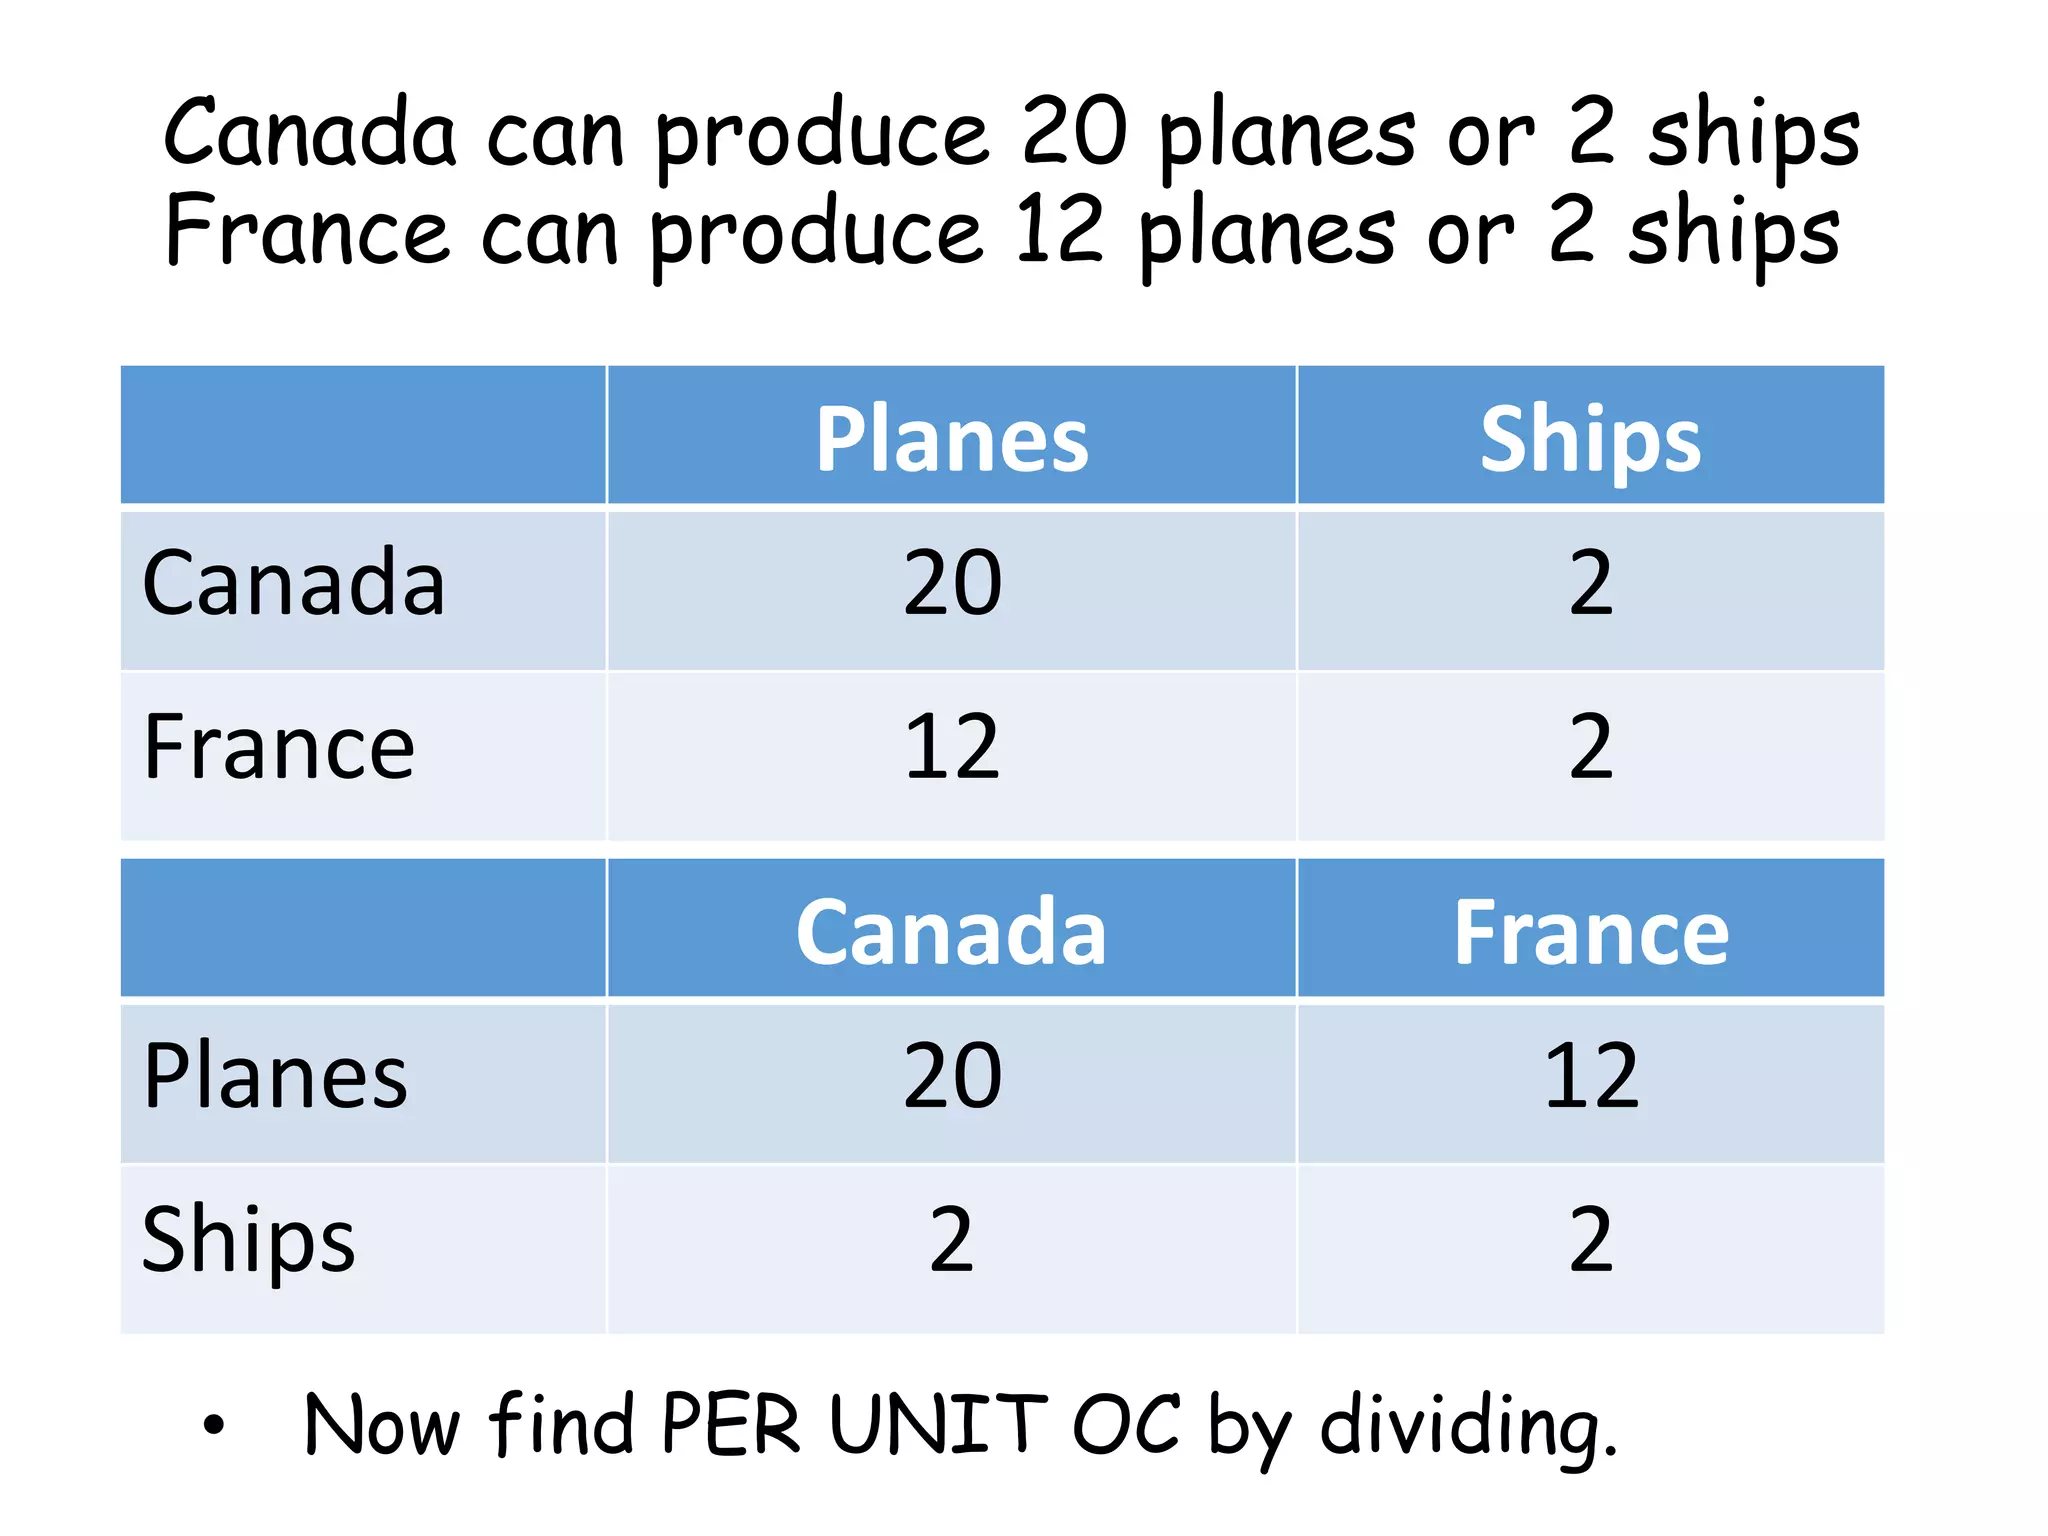
Canada can produce20 planes or 2 ships
France can produce 12 planes or 2 ships
Planes Ships
Canada 20 2
France 12 2
• Now find PER UNIT OC by dividing.
Canada France
Planes 20 12
Ships 2 2
81.
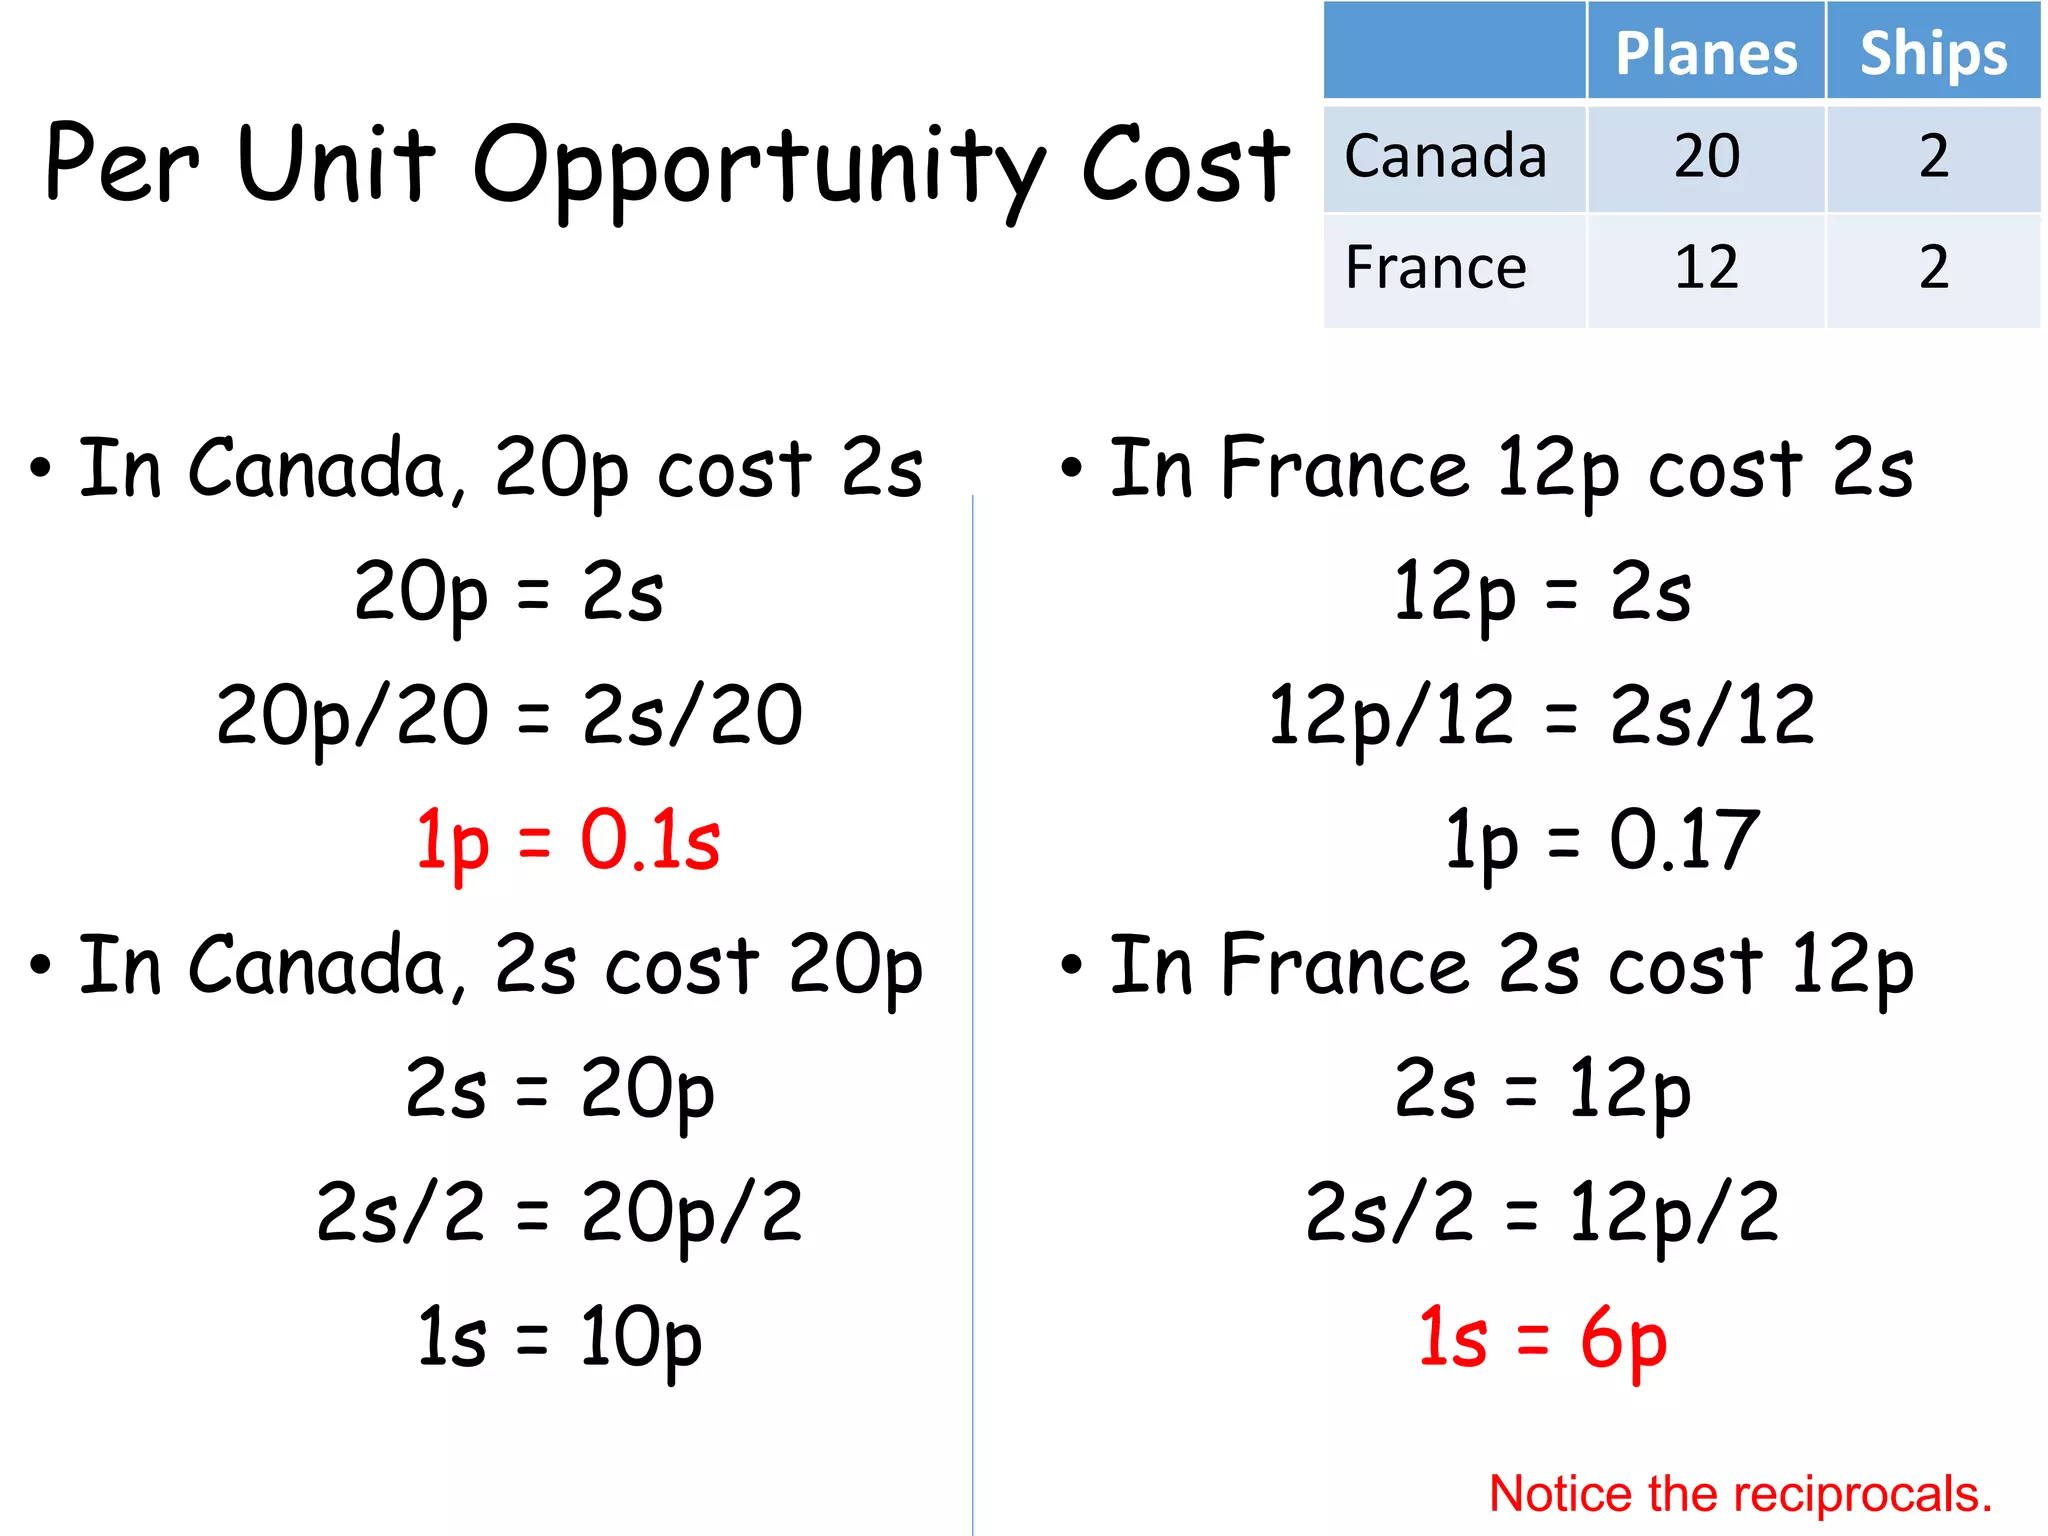
Per Unit OpportunityCost
• In Canada, 20p cost 2s
20p = 2s
20p/20 = 2s/20
1p = 0.1s
• In Canada, 2s cost 20p
2s = 20p
2s/2 = 20p/2
1s = 10p
• In France 12p cost 2s
12p = 2s
12p/12 = 2s/12
1p = 0.17
• In France 2s cost 12p
2s = 12p
2s/2 = 12p/2
1s = 6p
Planes Ships
Canada 20 2
France 12 2
Notice the reciprocals.
82.
Per Unit OpportunityCost
• Canada can make 1 plane
for 0.1 ships, which is
better than France’s
0.17 ship for 1 plane.
• Since 0.1 < 0.17, Canada
has a comparative
advantage in planes.
• France can make 1 ship
for 6 planes, which is
better than Canada’s 1
ship for 10 planes.
• Since 6 < 10, France has
a comparative advantage
in ships.
Planes Ships
Canada 20 2
France 12 2
83.
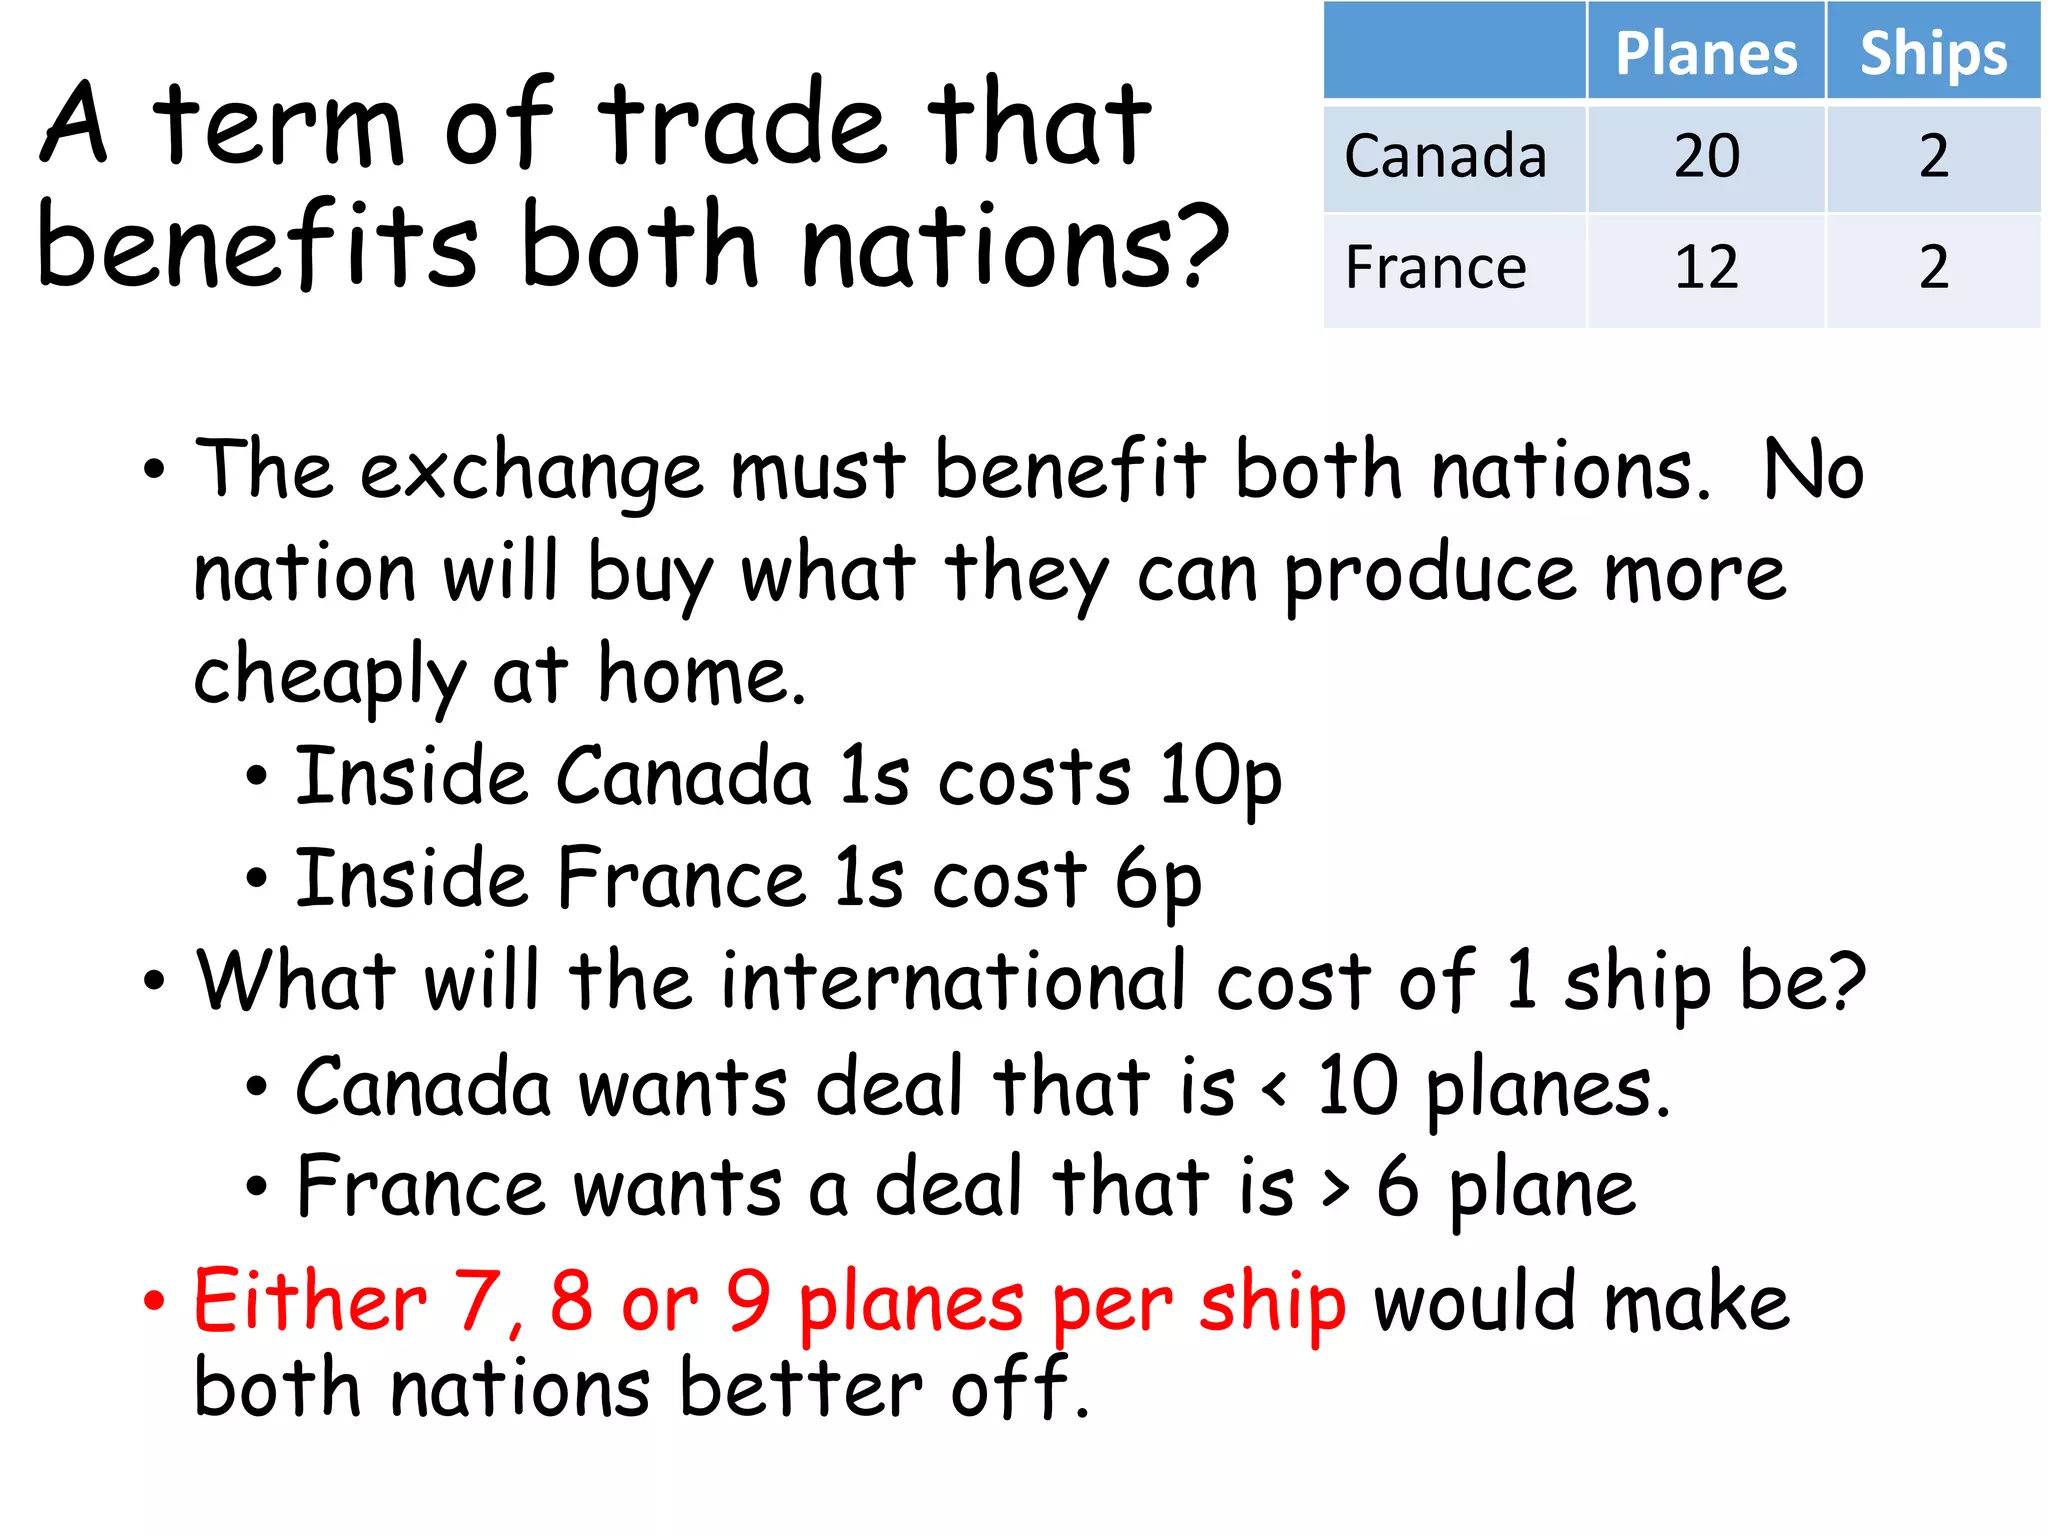
A term oftrade that
benefits both nations?
• The exchange must benefit both nations. No
nation will buy what they can produce more
cheaply at home.
• Inside Canada 1s costs 10p
• Inside France 1s cost 6p
• What will the international cost of 1 ship be?
• Canada wants deal that is < 10 planes.
• France wants a deal that is > 6 plane
• Either 7, 8 or 9 planes per ship would make
both nations better off.
Planes Ships
Canada 20 2
France 12 2
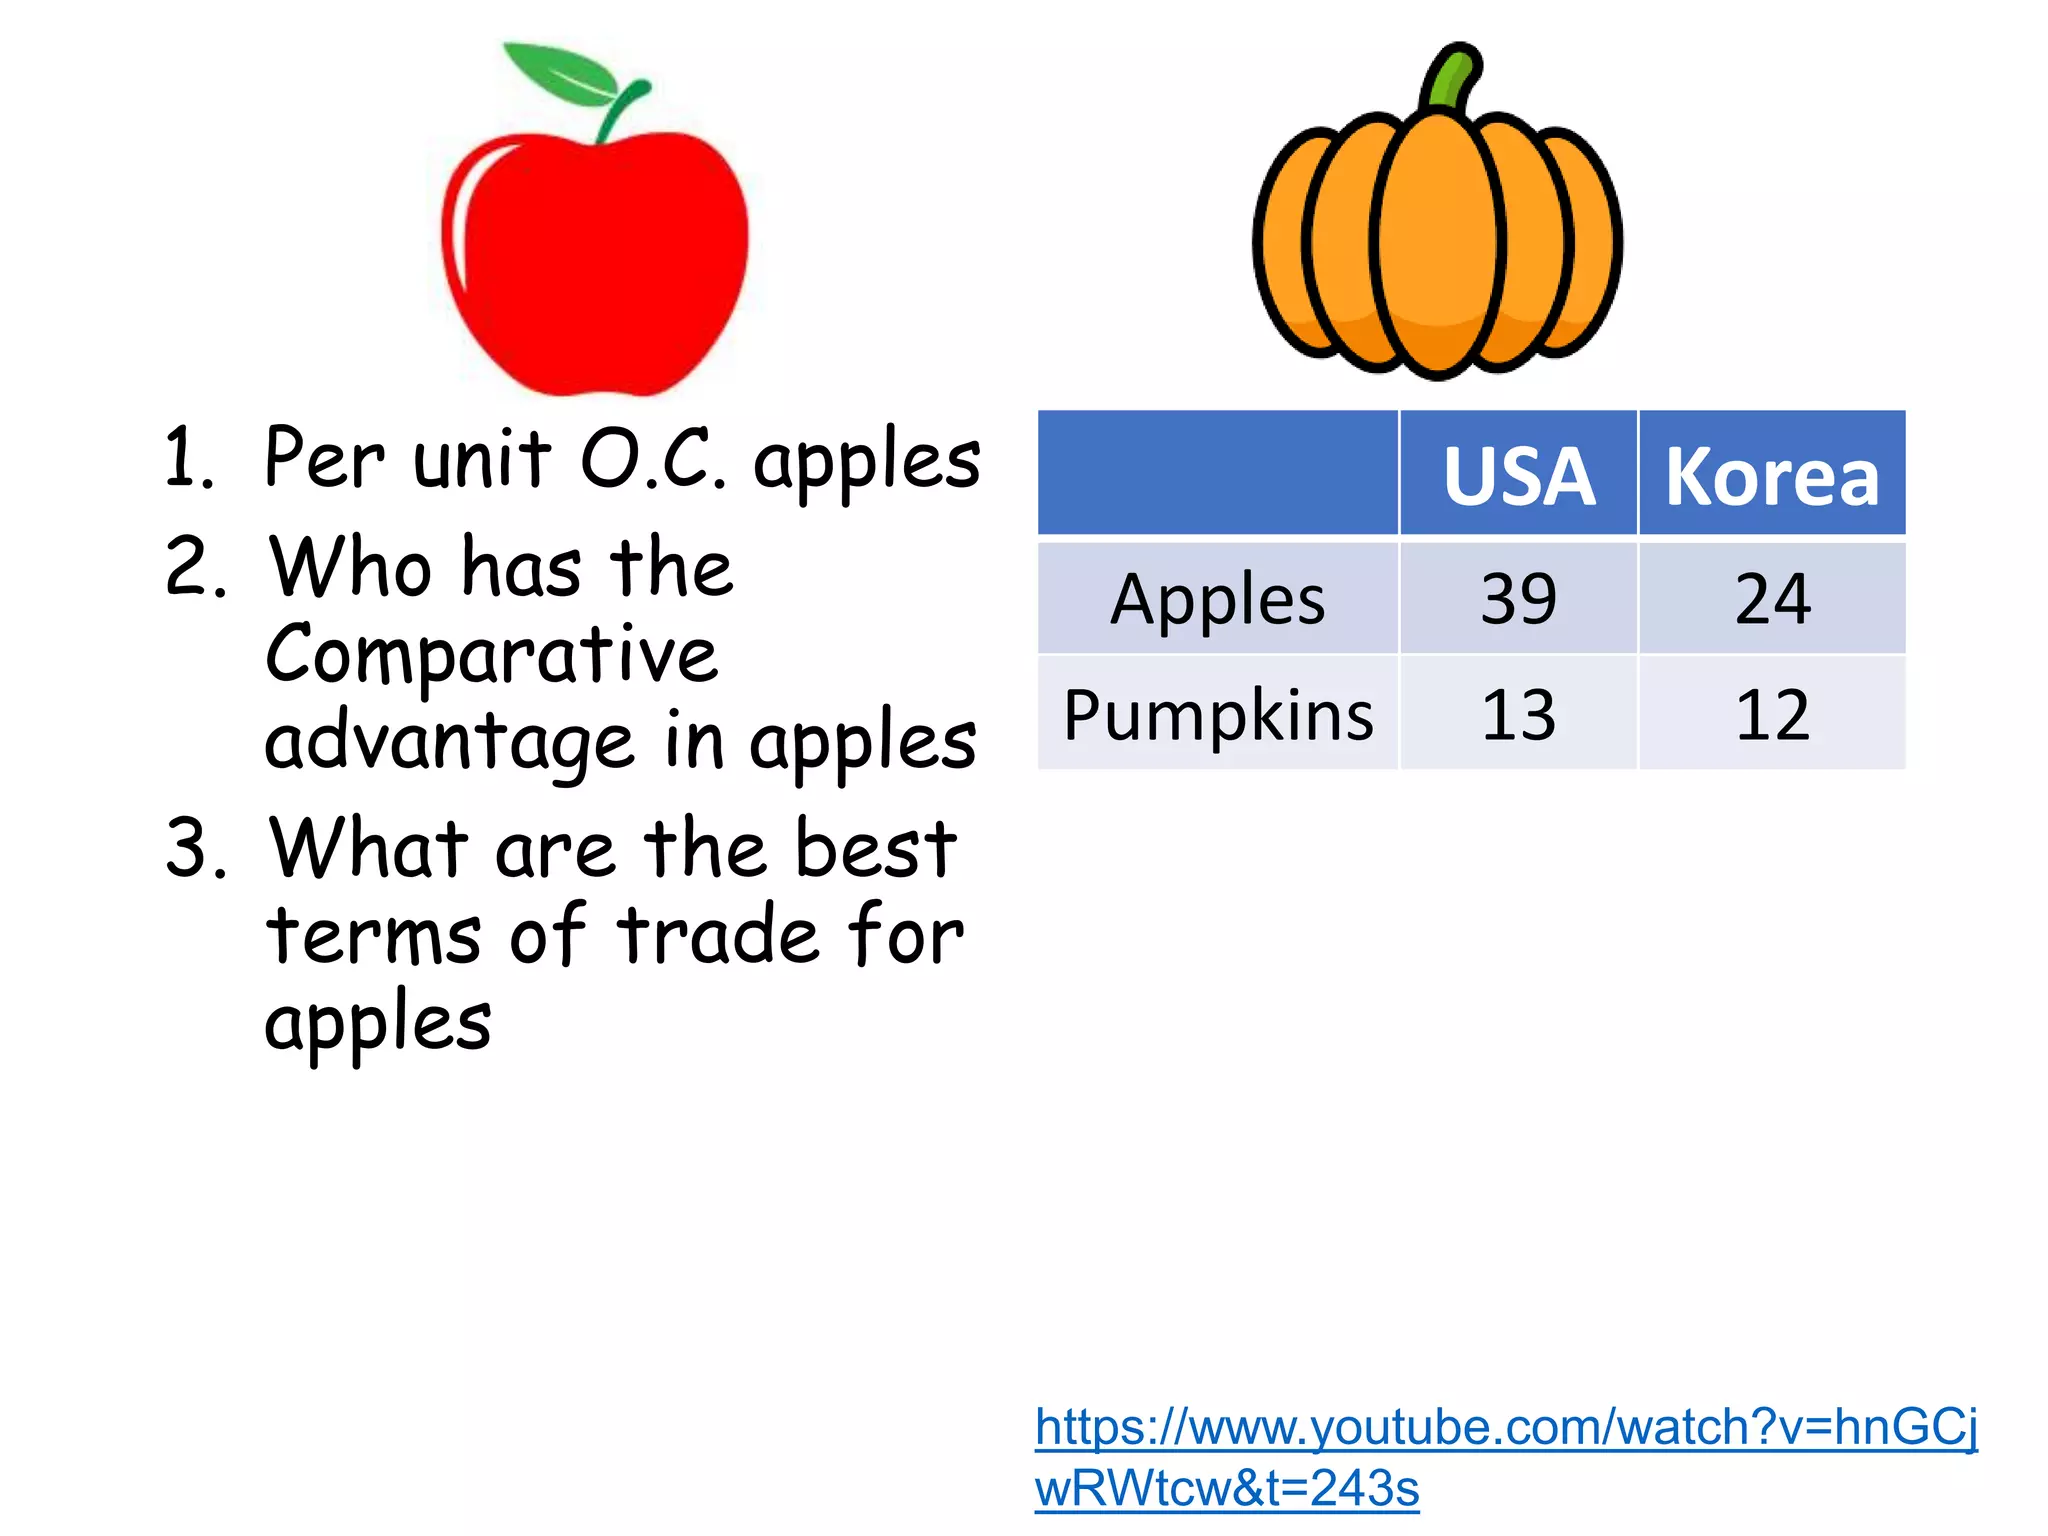
1. Per unitO.C. apples
2. Who has the
Comparative
advantage in apples
3. What are the best
terms of trade for
apples
USA Korea
Apples 39 24
Pumpkins 13 12
https://www.youtube.com/watch?v=hnGCj
wRWtcw&t=243s
86.
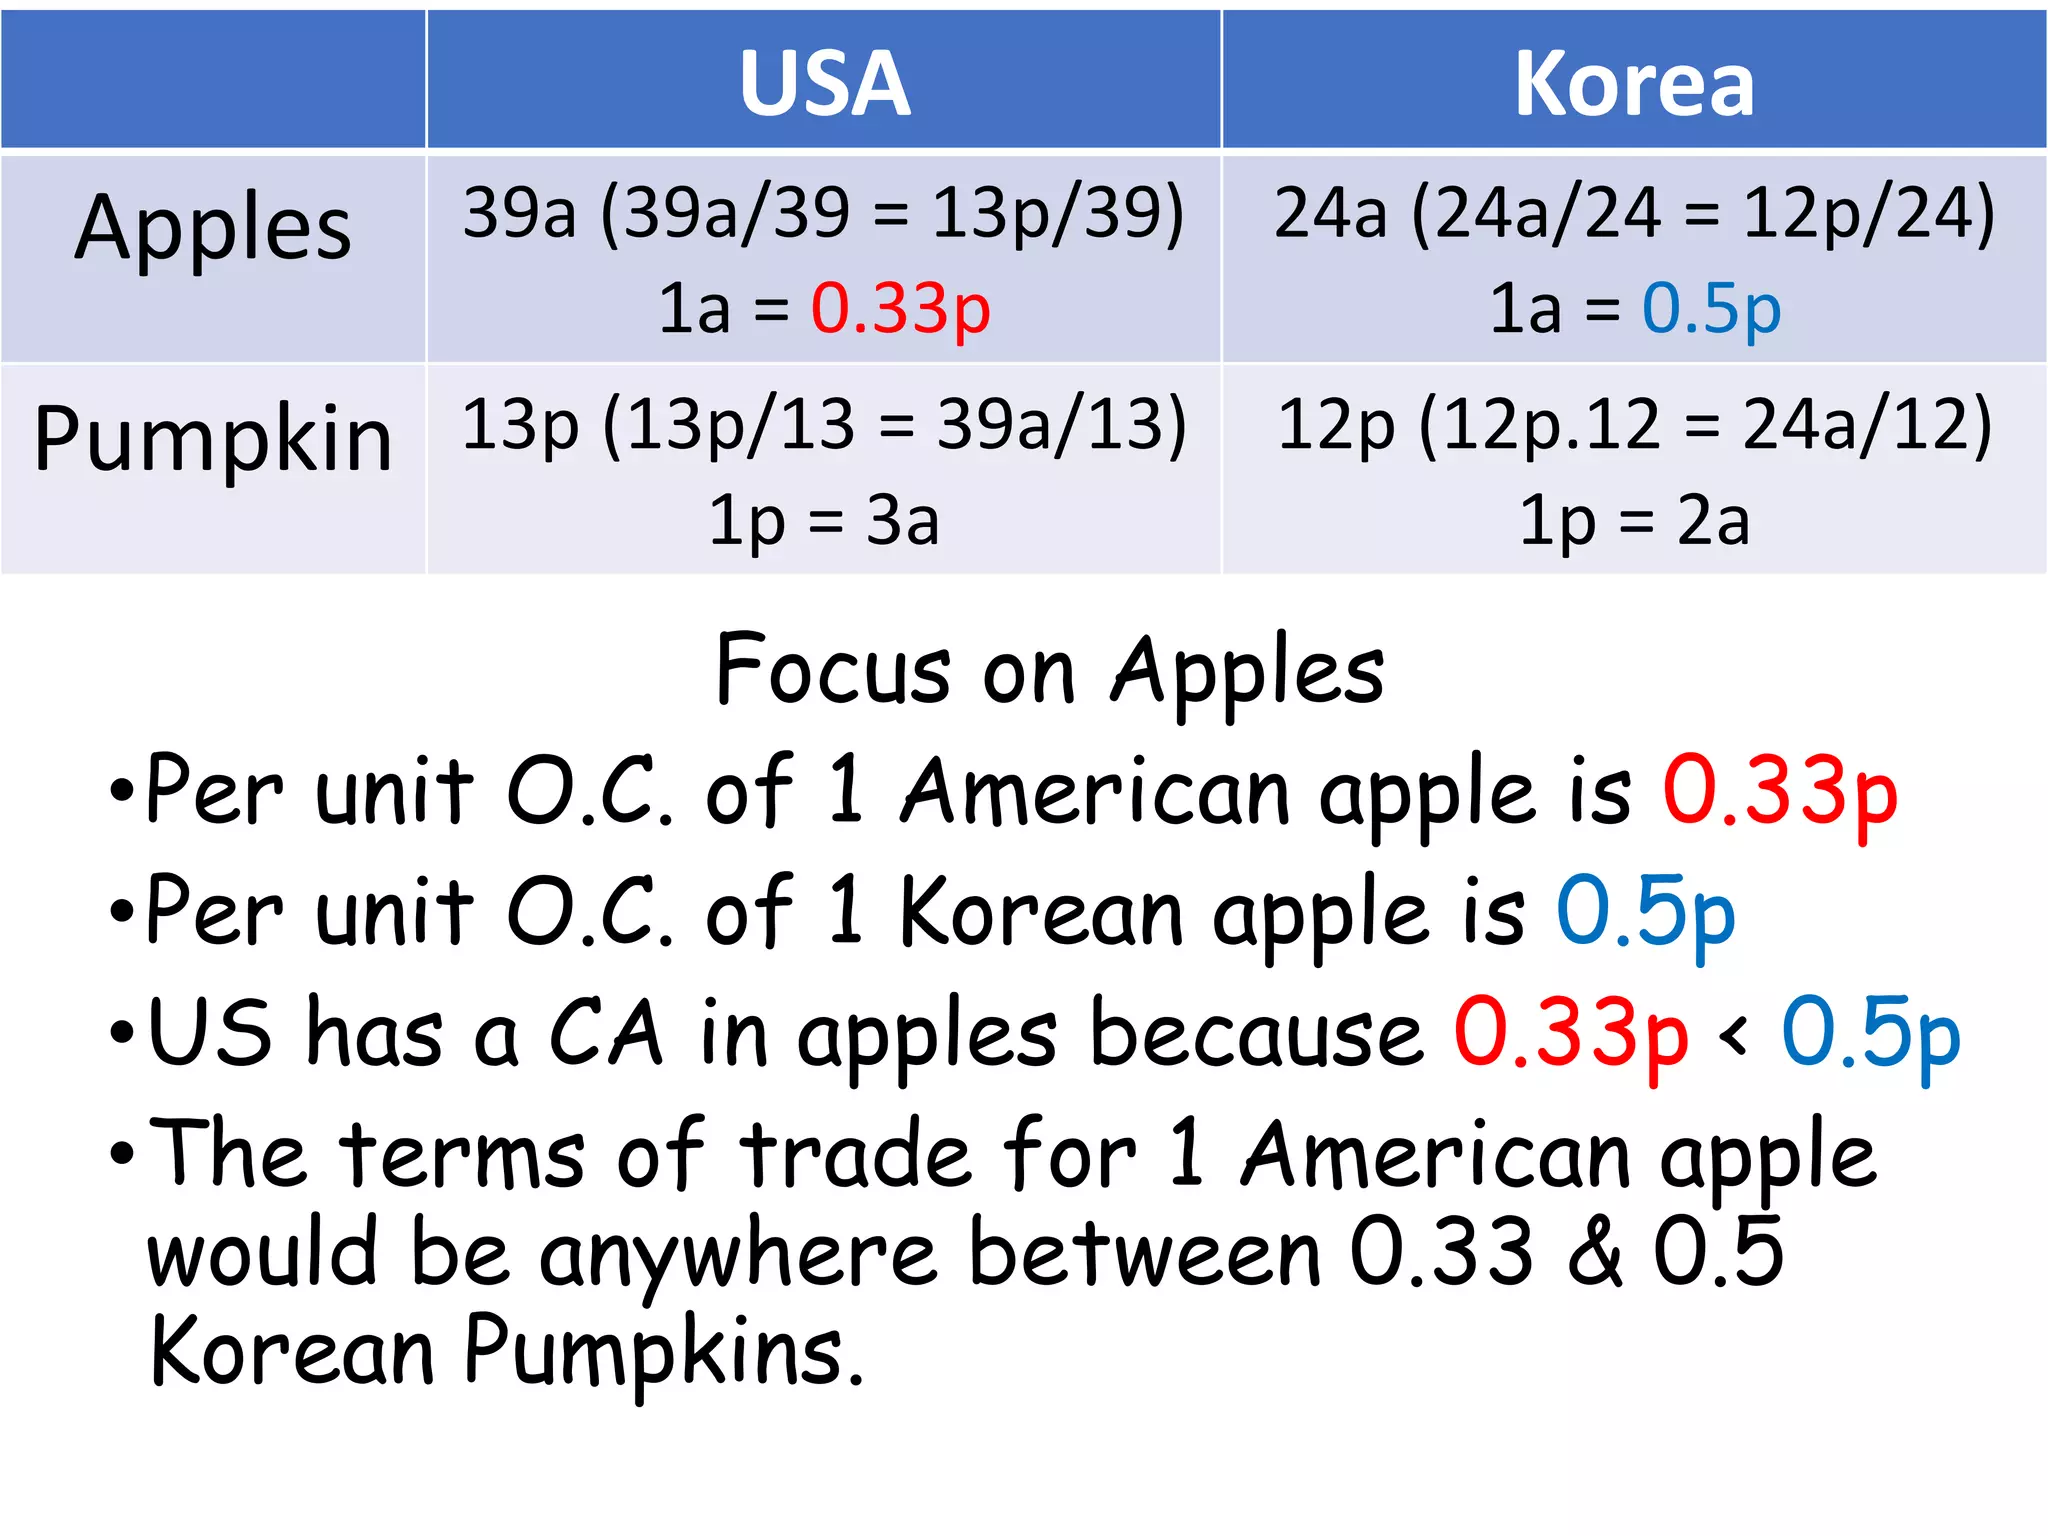
Focus on Apples
•Perunit O.C. of 1 American apple is 0.33p
•Per unit O.C. of 1 Korean apple is 0.5p
•US has a CA in apples because 0.33p < 0.5p
•The terms of trade for 1 American apple
would be anywhere between 0.33 & 0.5
Korean Pumpkins.
USA Korea
Apples 39a (39a/39 = 13p/39)
1a = 0.33p
24a (24a/24 = 12p/24)
1a = 0.5p
Pumpkin 13p (13p/13 = 39a/13)
1p = 3a
12p (12p.12 = 24a/12)
1p = 2a
87.
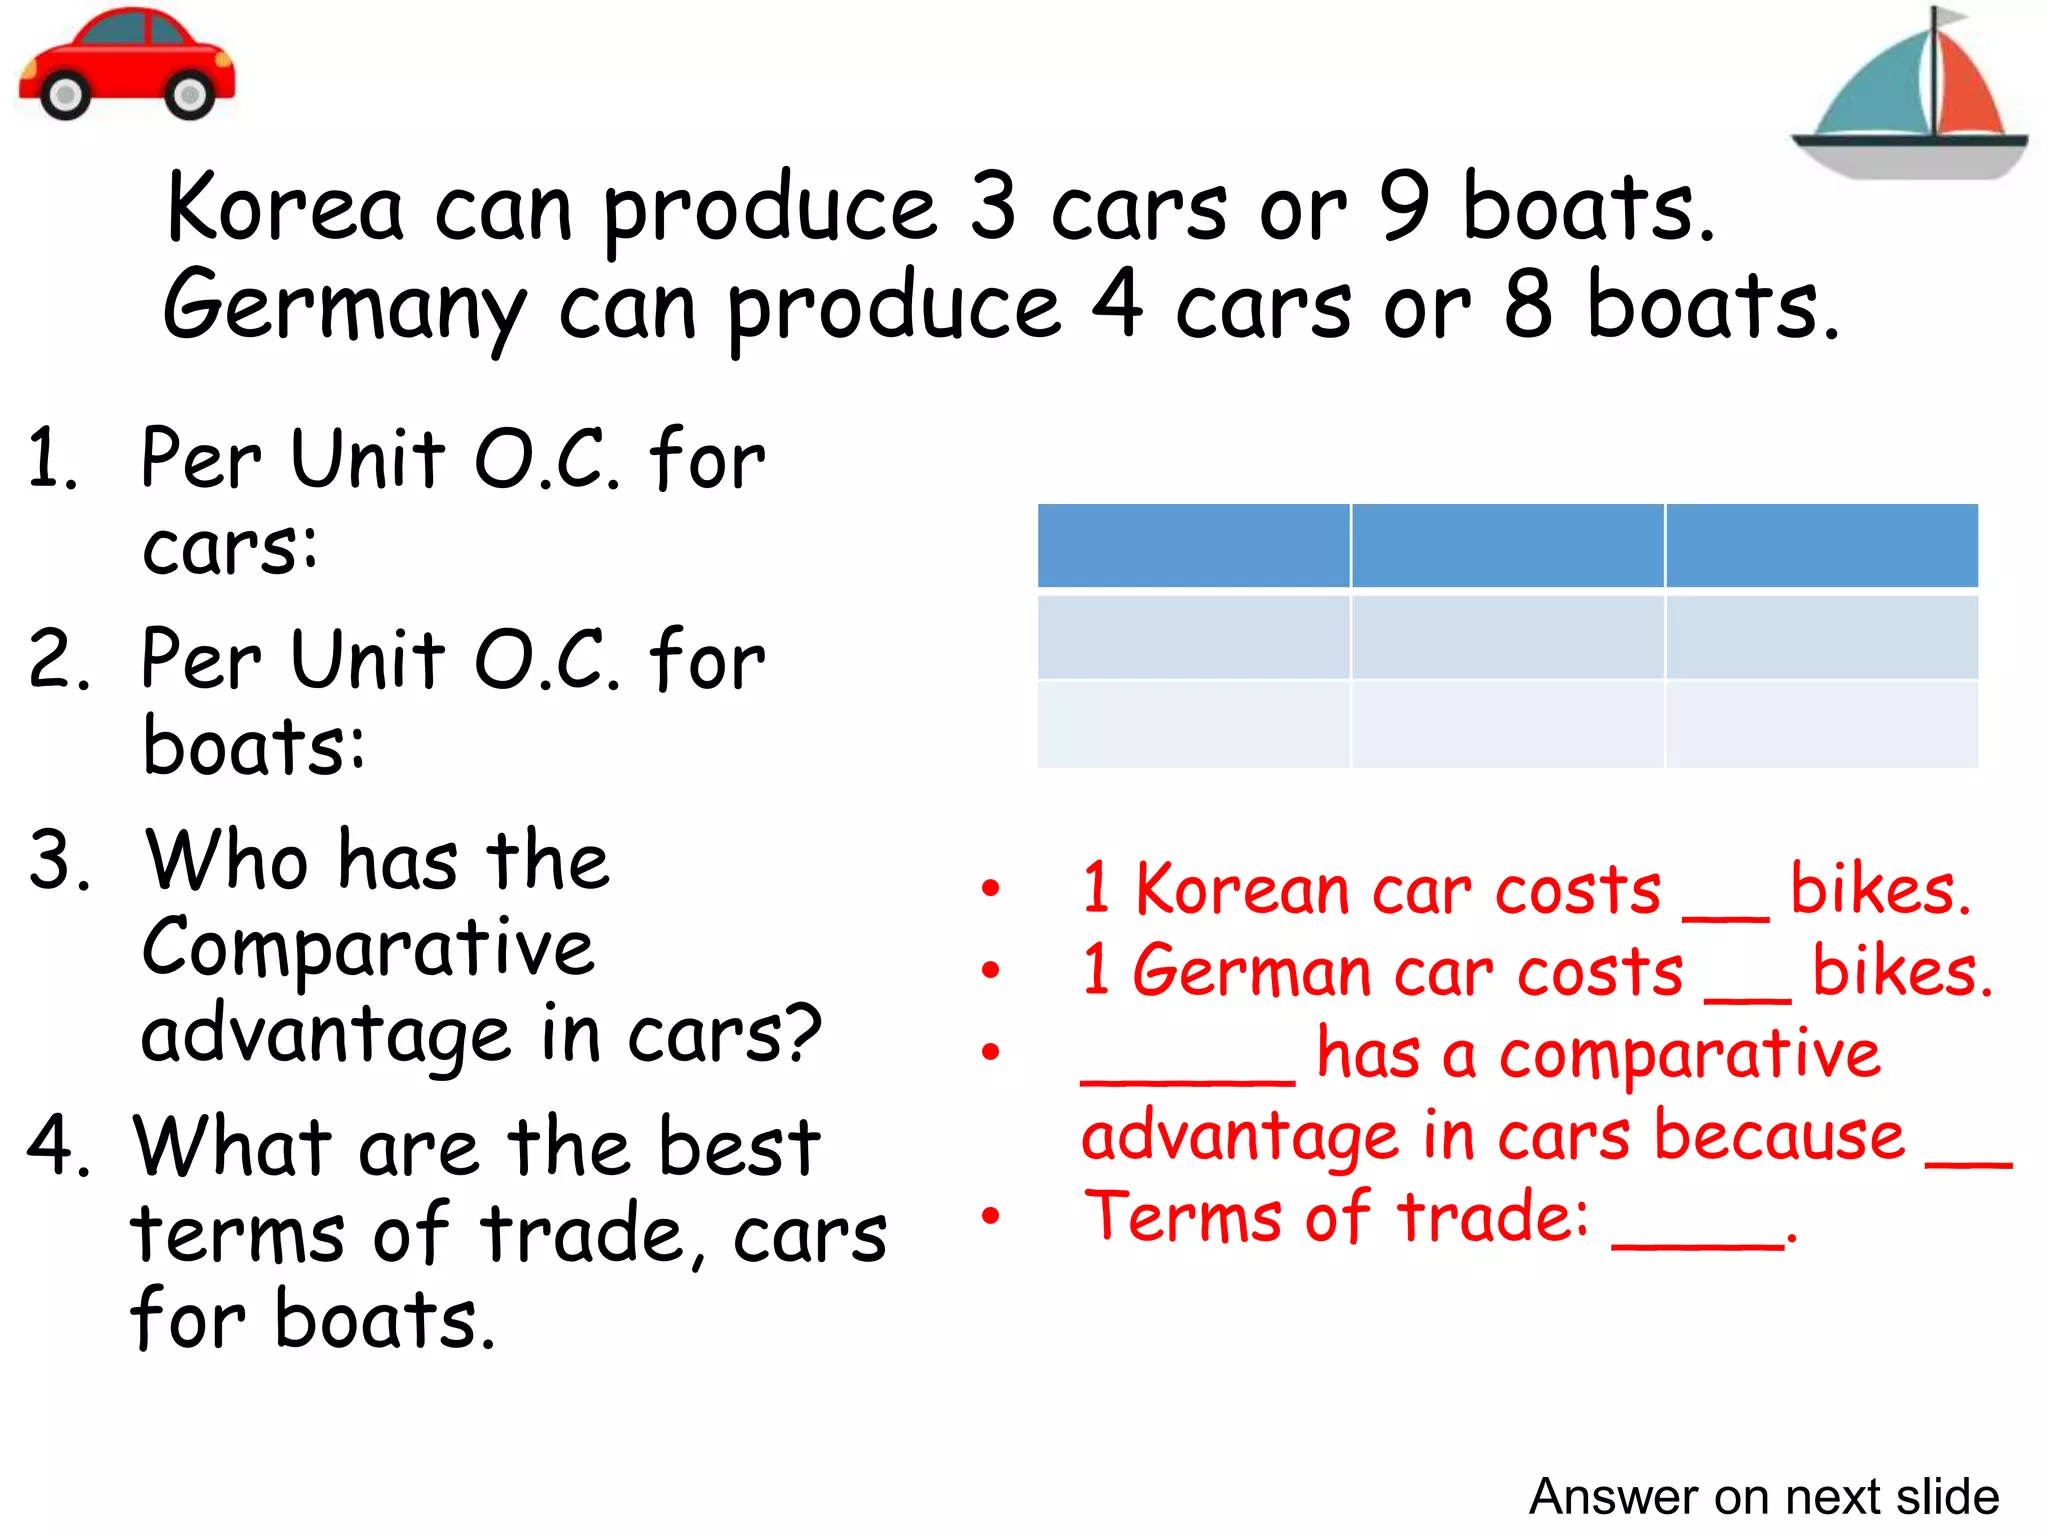
Korea can produce3 cars or 9 boats.
Germany can produce 4 cars or 8 boats.
1. Per Unit O.C. for
cars:
2. Per Unit O.C. for
boats:
3. Who has the
Comparative
advantage in cars?
4. What are the best
terms of trade, cars
for boats.
• 1 Korean car costs __ bikes.
• 1 German car costs __ bikes.
• _____ has a comparative
advantage in cars because __
• Terms of trade: ____.
Answer on next slide
88.
Korea can produce3 cars or 9 bikes.
Germany can produce 4 cars or 8 boats.
1. Per Unit O.C. for
cars:
2. Per Unit O.C. for
boats:
3. Who has the
Comparative
advantage in cars?
4. What are the best
terms of trade, cars
for boats.
Cars Cycles
Korea 3 9
Germany 4 8
• 1 Korean car costs 3 boats.
• 1 German car costs 2 boats.
• Comparative advantage goes to
German cars because 2b < 3b
• Terms of trade: 1 German car
should cost 2 ½ Korean boats.
89.
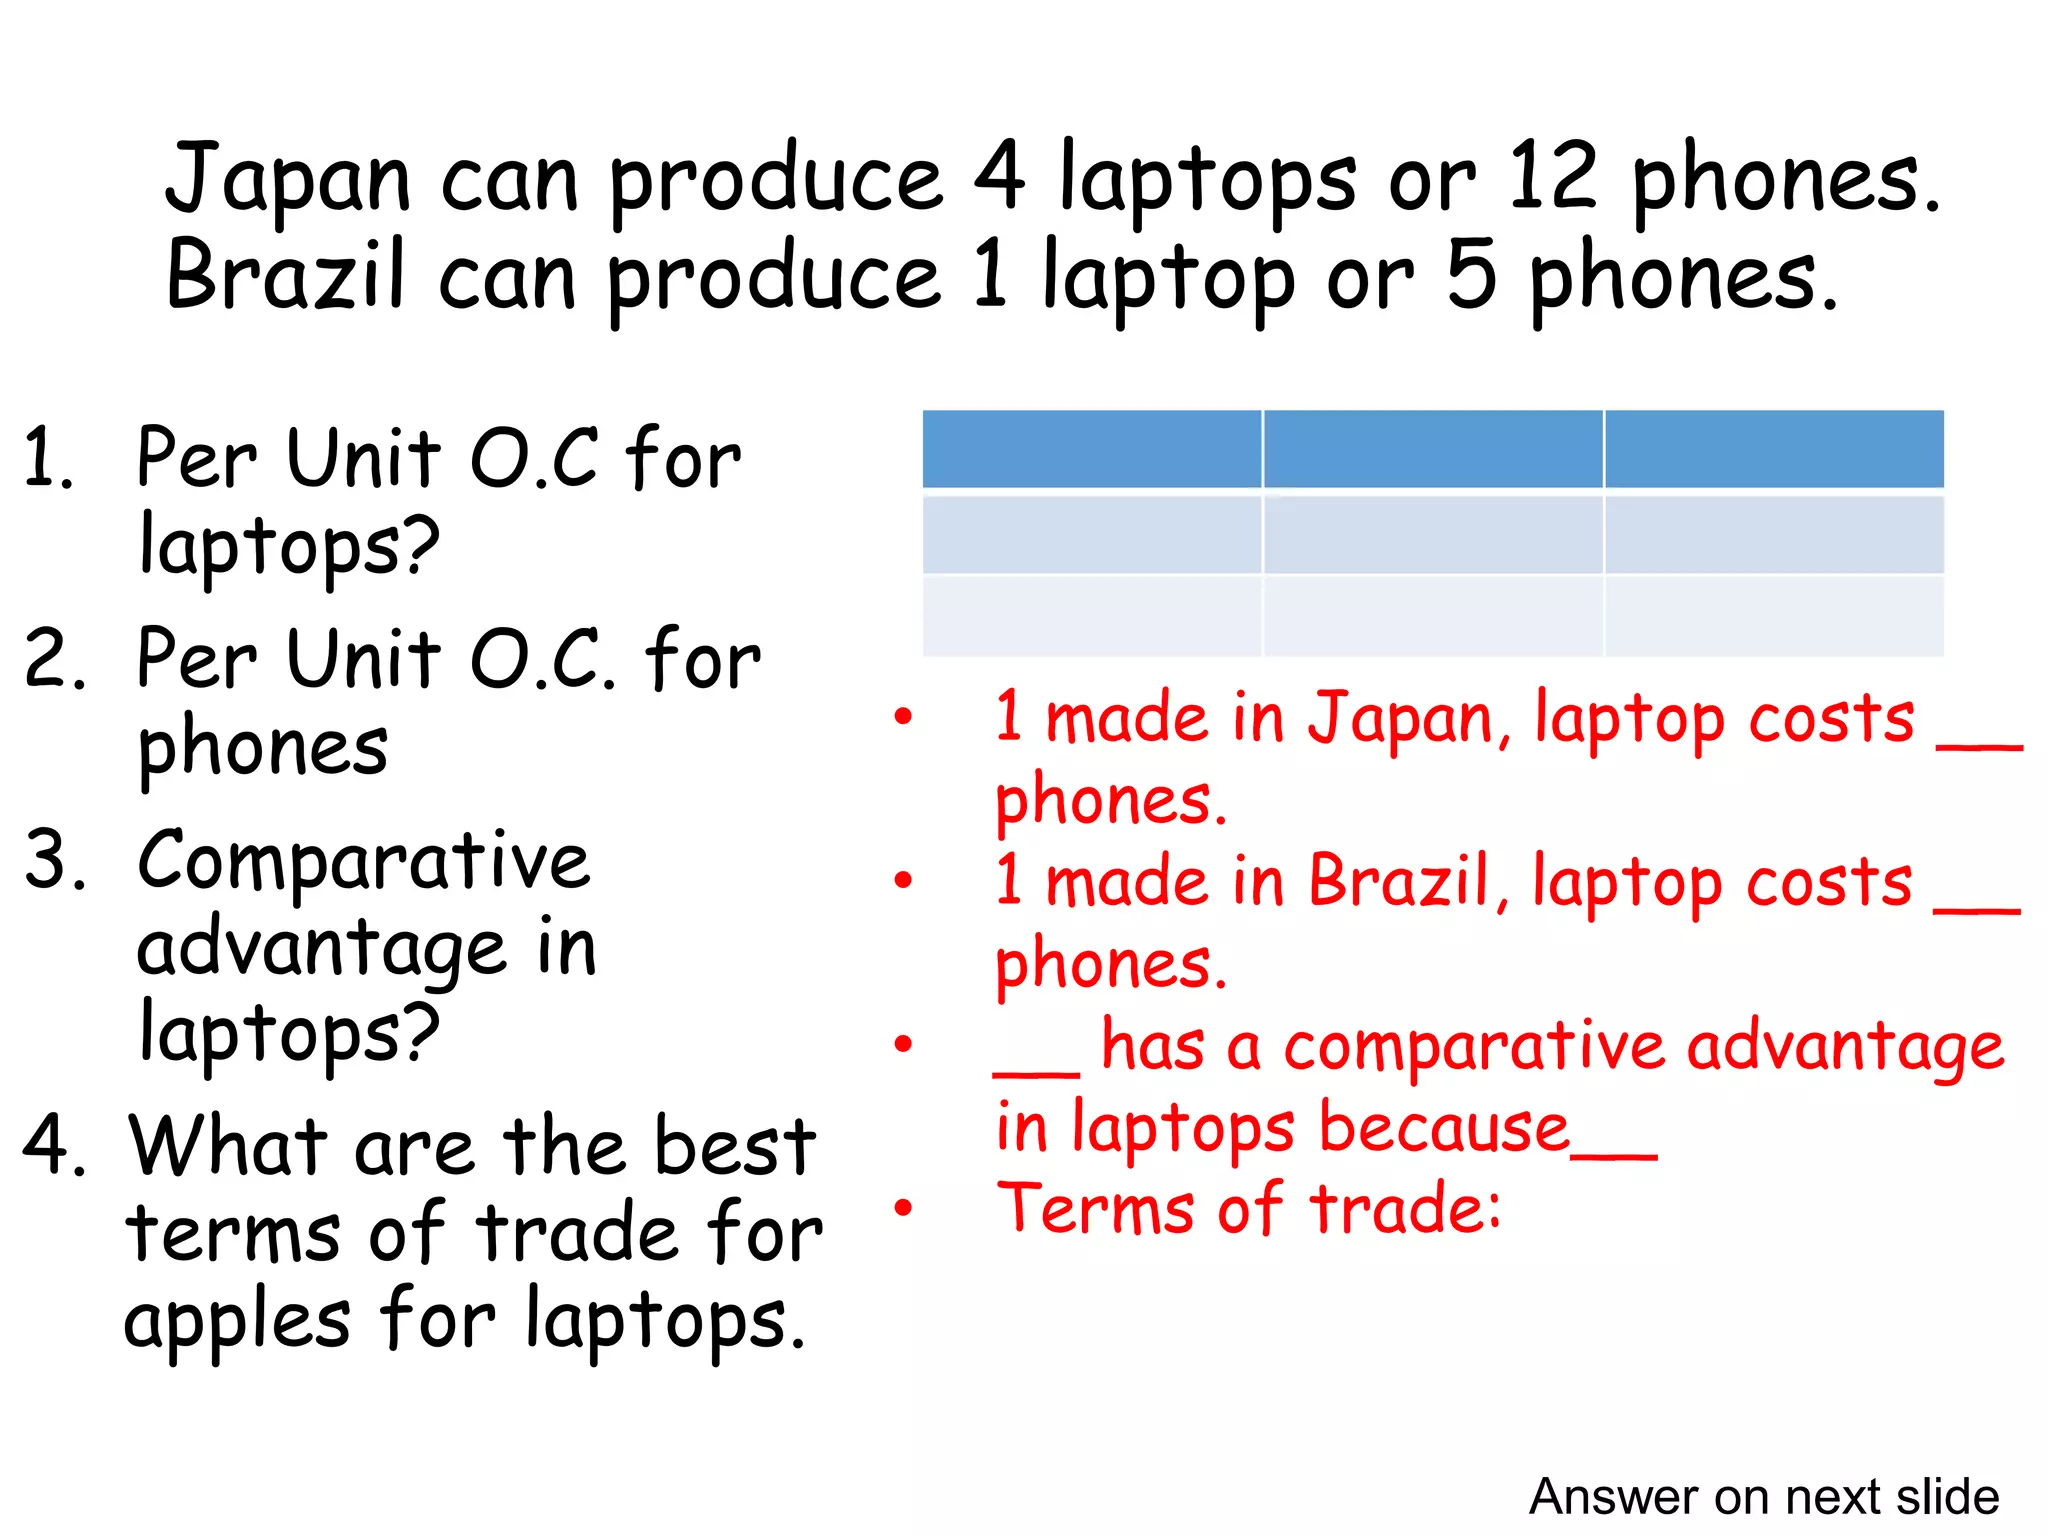
Japan can produce4 laptops or 12 phones.
Brazil can produce 1 laptop or 5 phones.
1. Per Unit O.C for
laptops?
2. Per Unit O.C. for
phones
3. Comparative
advantage in
laptops?
4. What are the best
terms of trade for
apples for laptops.
• 1 made in Japan, laptop costs __
phones.
• 1 made in Brazil, laptop costs __
phones.
• __ has a comparative advantage
in laptops because__
• Terms of trade:
Answer on next slide
90.
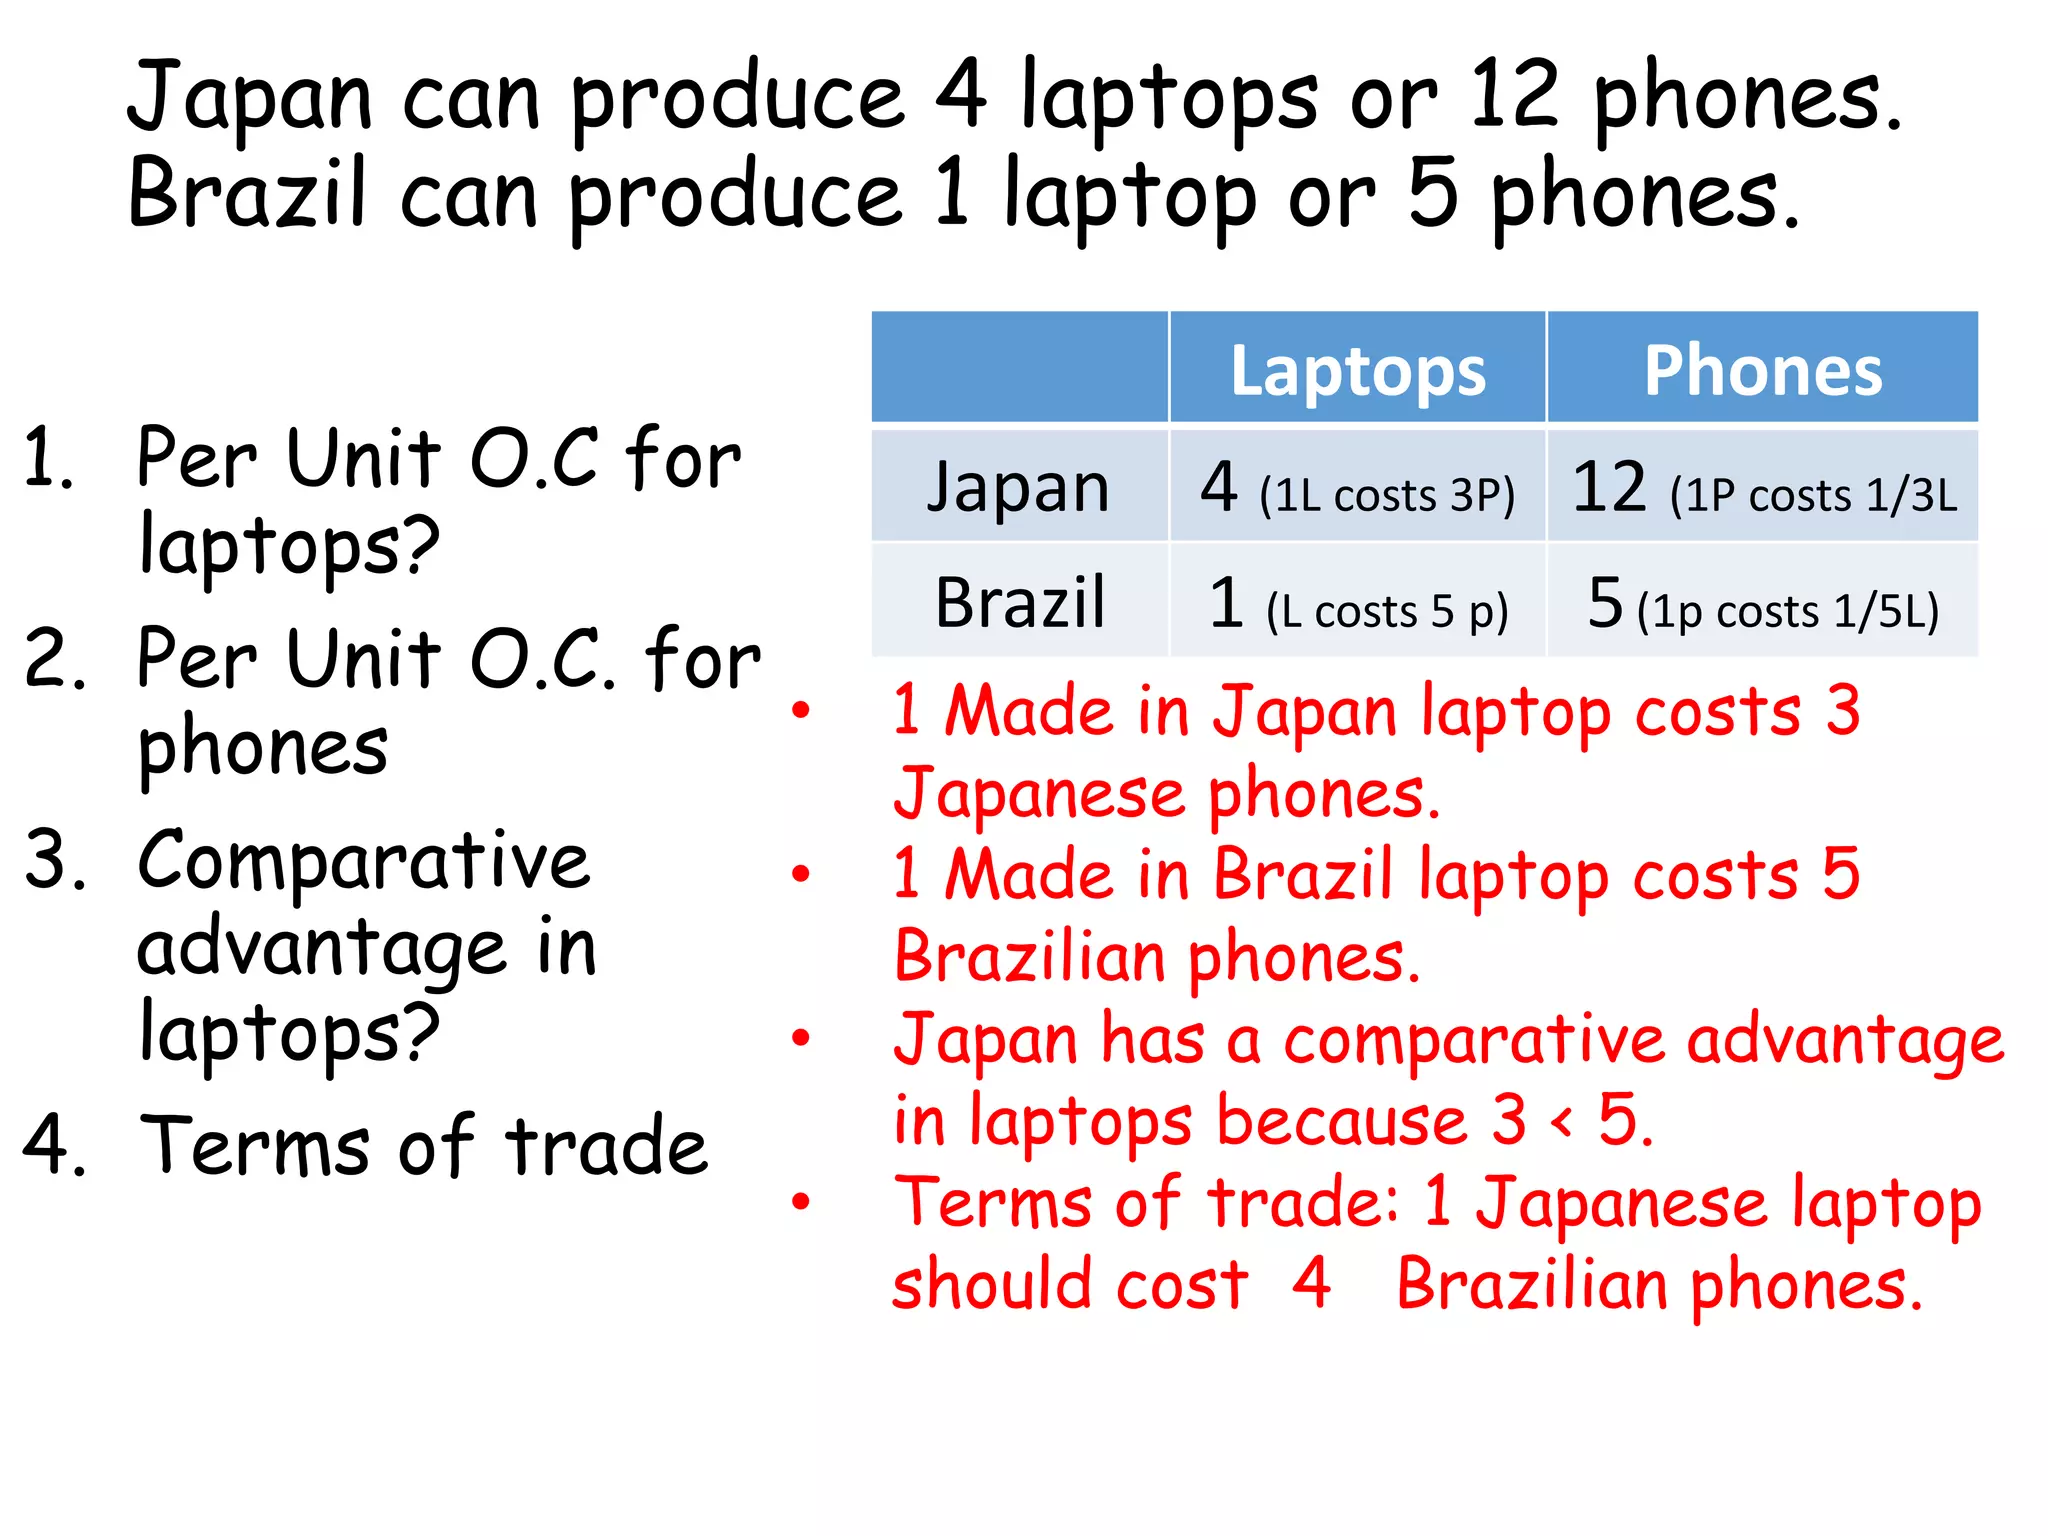
Japan can produce4 laptops or 12 phones.
Brazil can produce 1 laptop or 5 phones.
1. Per Unit O.C for
laptops?
2. Per Unit O.C. for
phones
3. Comparative
advantage in
laptops?
4. Terms of trade
Laptops Phones
Japan 4 (1L costs 3P) 12 (1P costs 1/3L
Brazil 1 (L costs 5 p) 5(1p costs 1/5L)
• 1 Made in Japan laptop costs 3
Japanese phones.
• 1 Made in Brazil laptop costs 5
Brazilian phones.
• Japan has a comparative advantage
in laptops because 3 < 5.
• Terms of trade: 1 Japanese laptop
should cost 4 Brazilian phones.
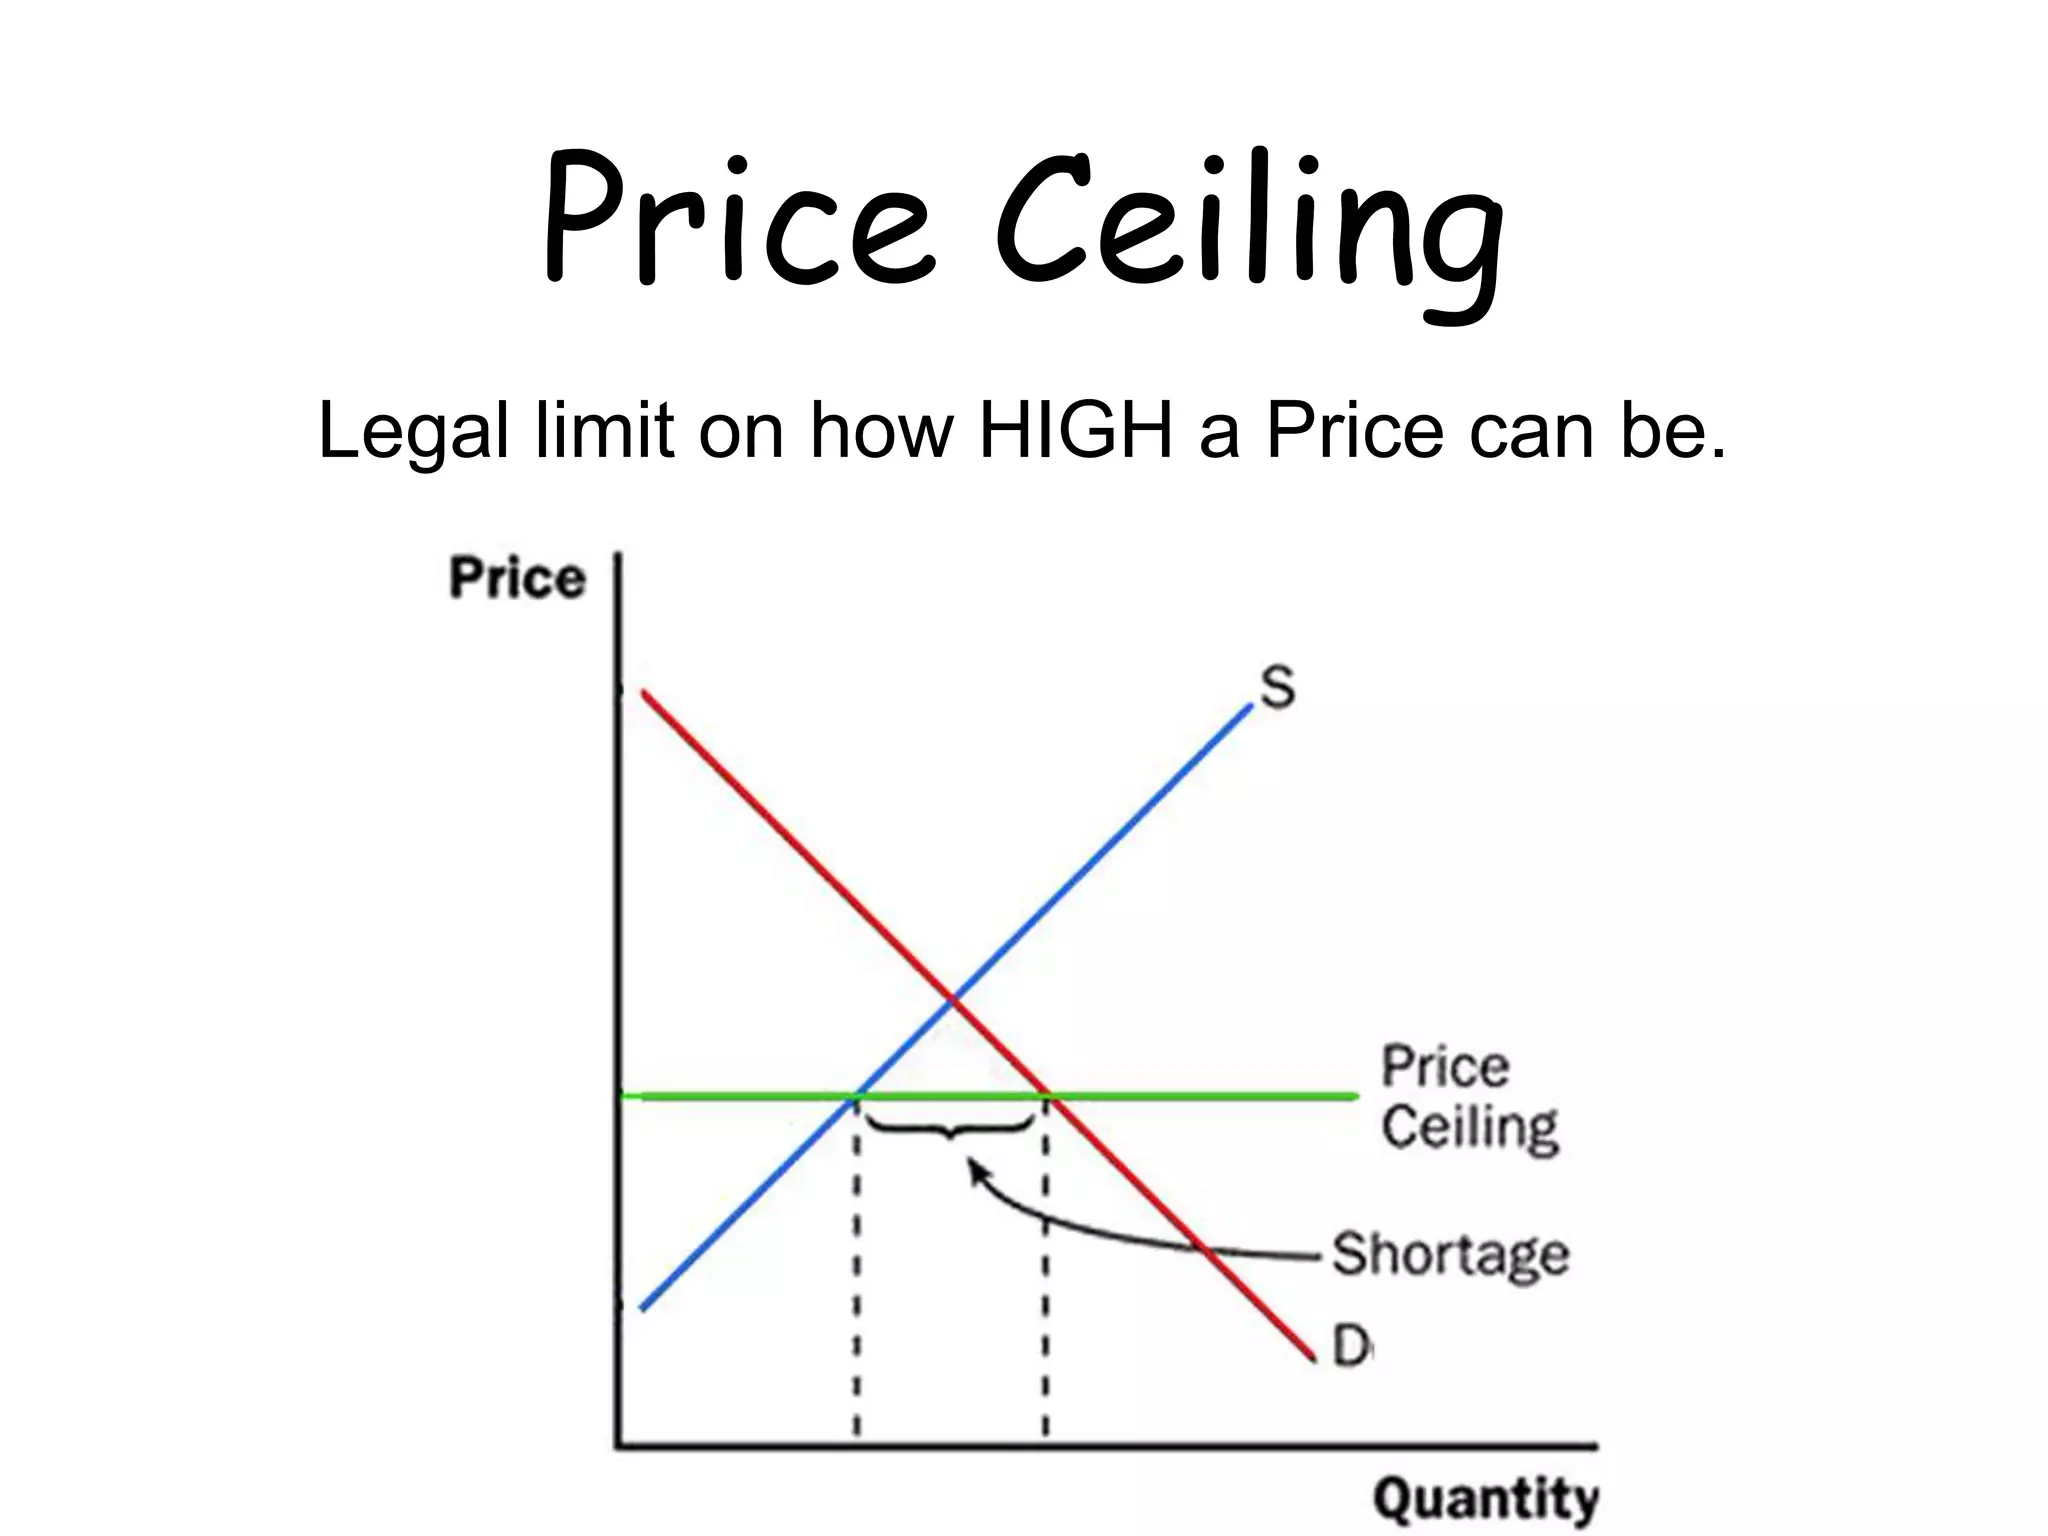
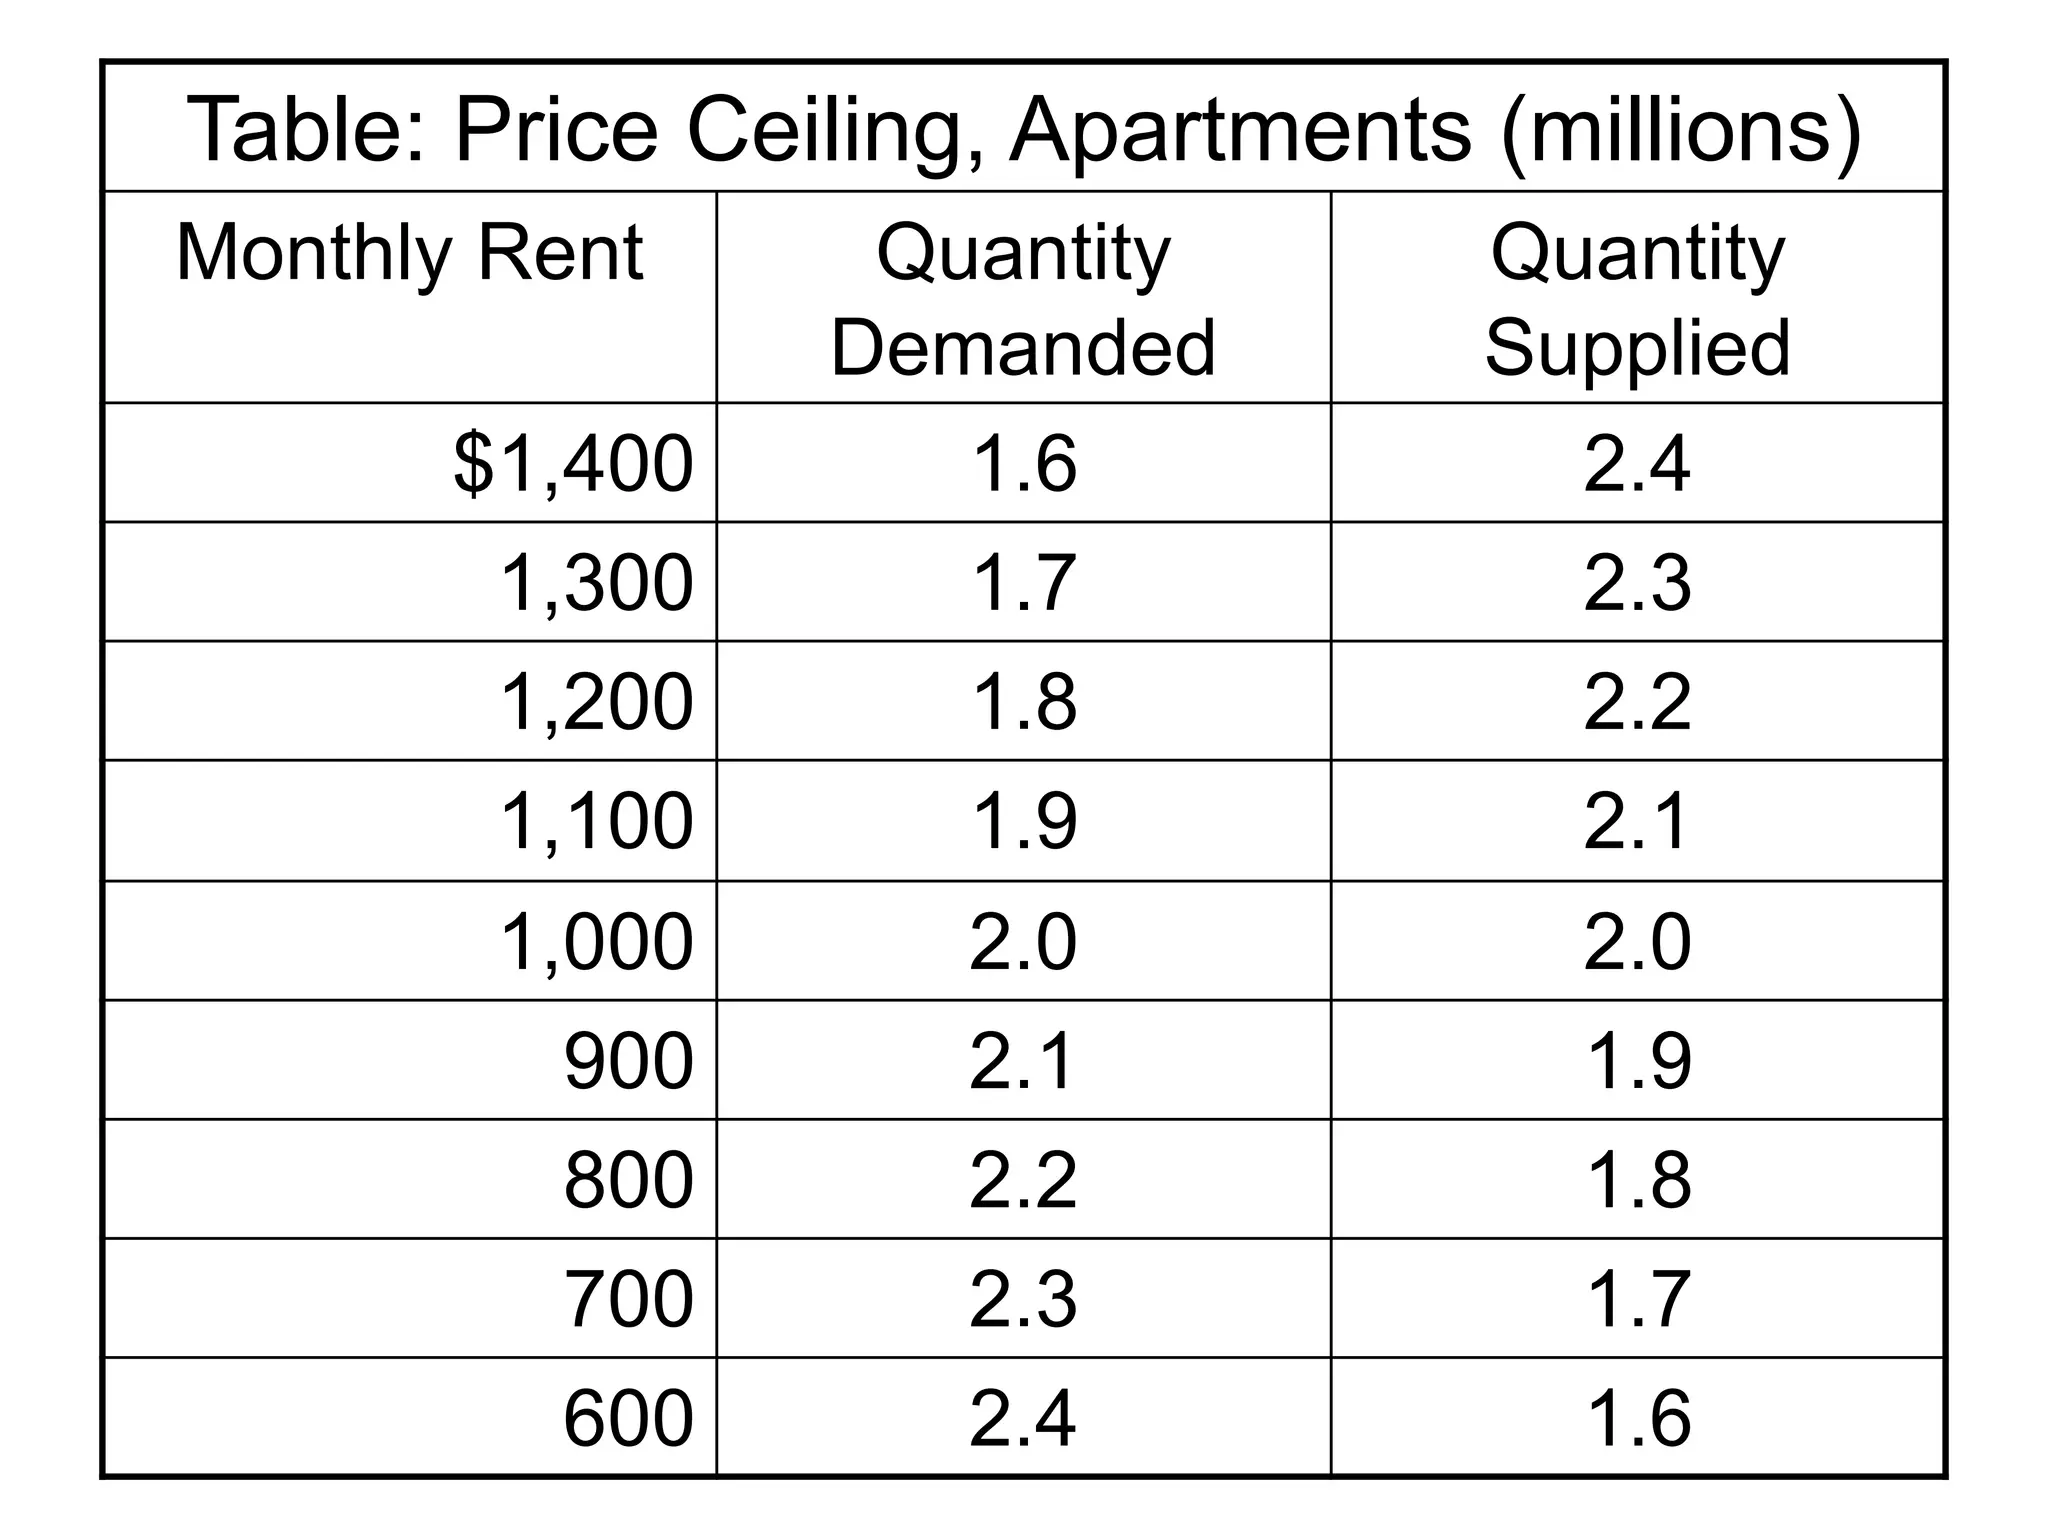
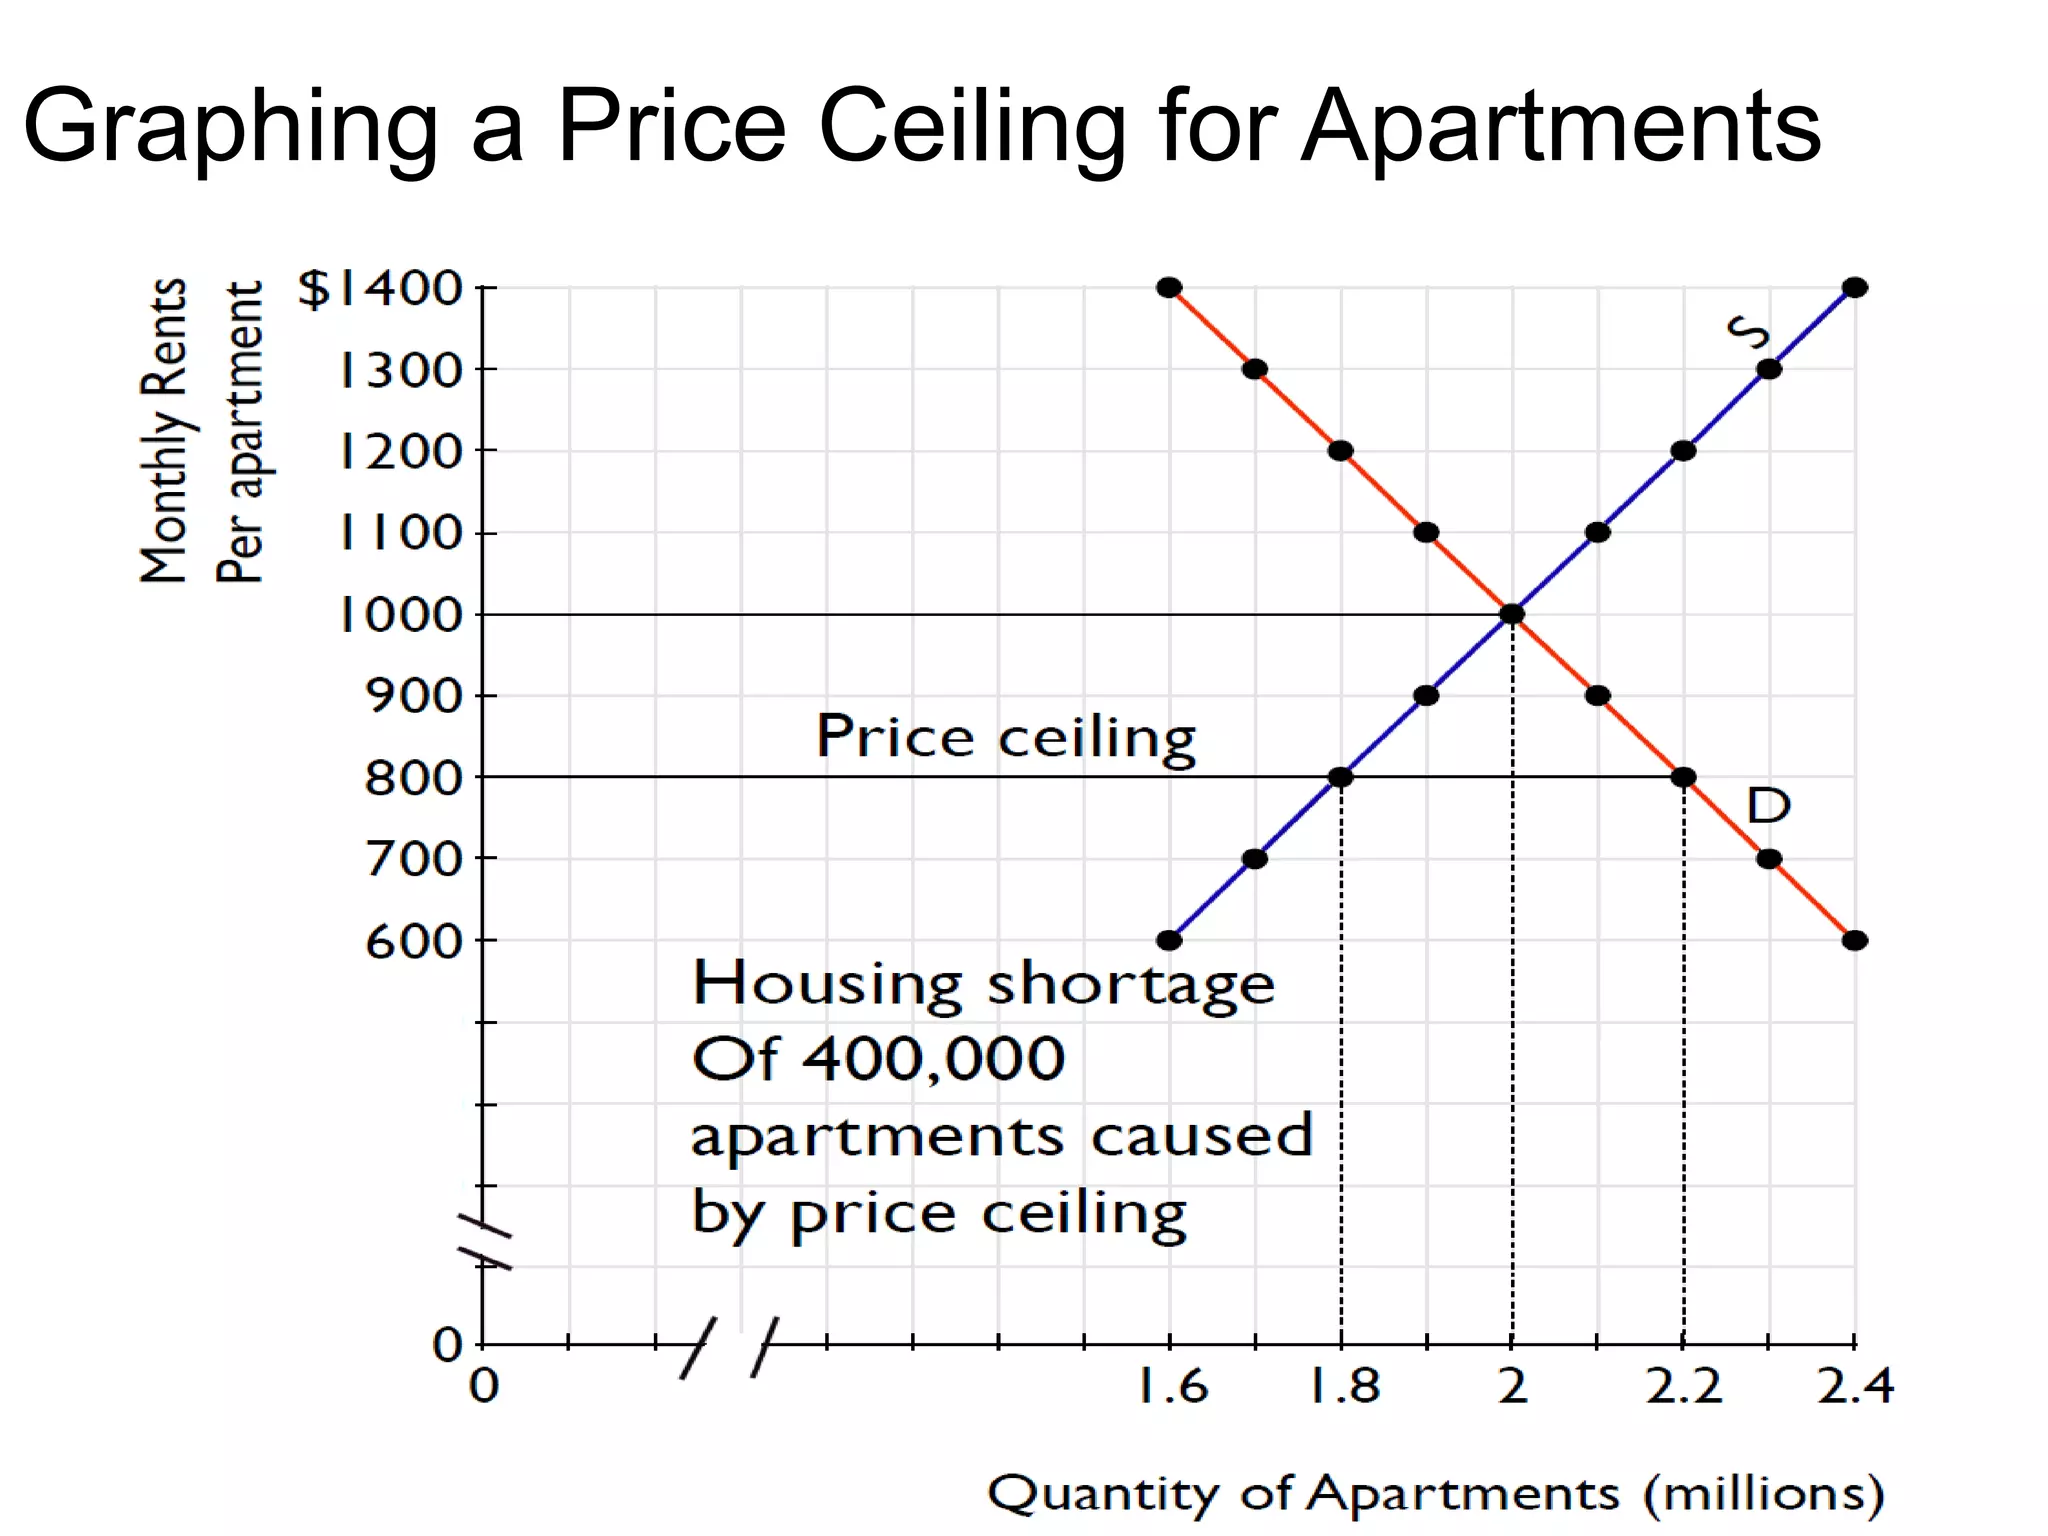
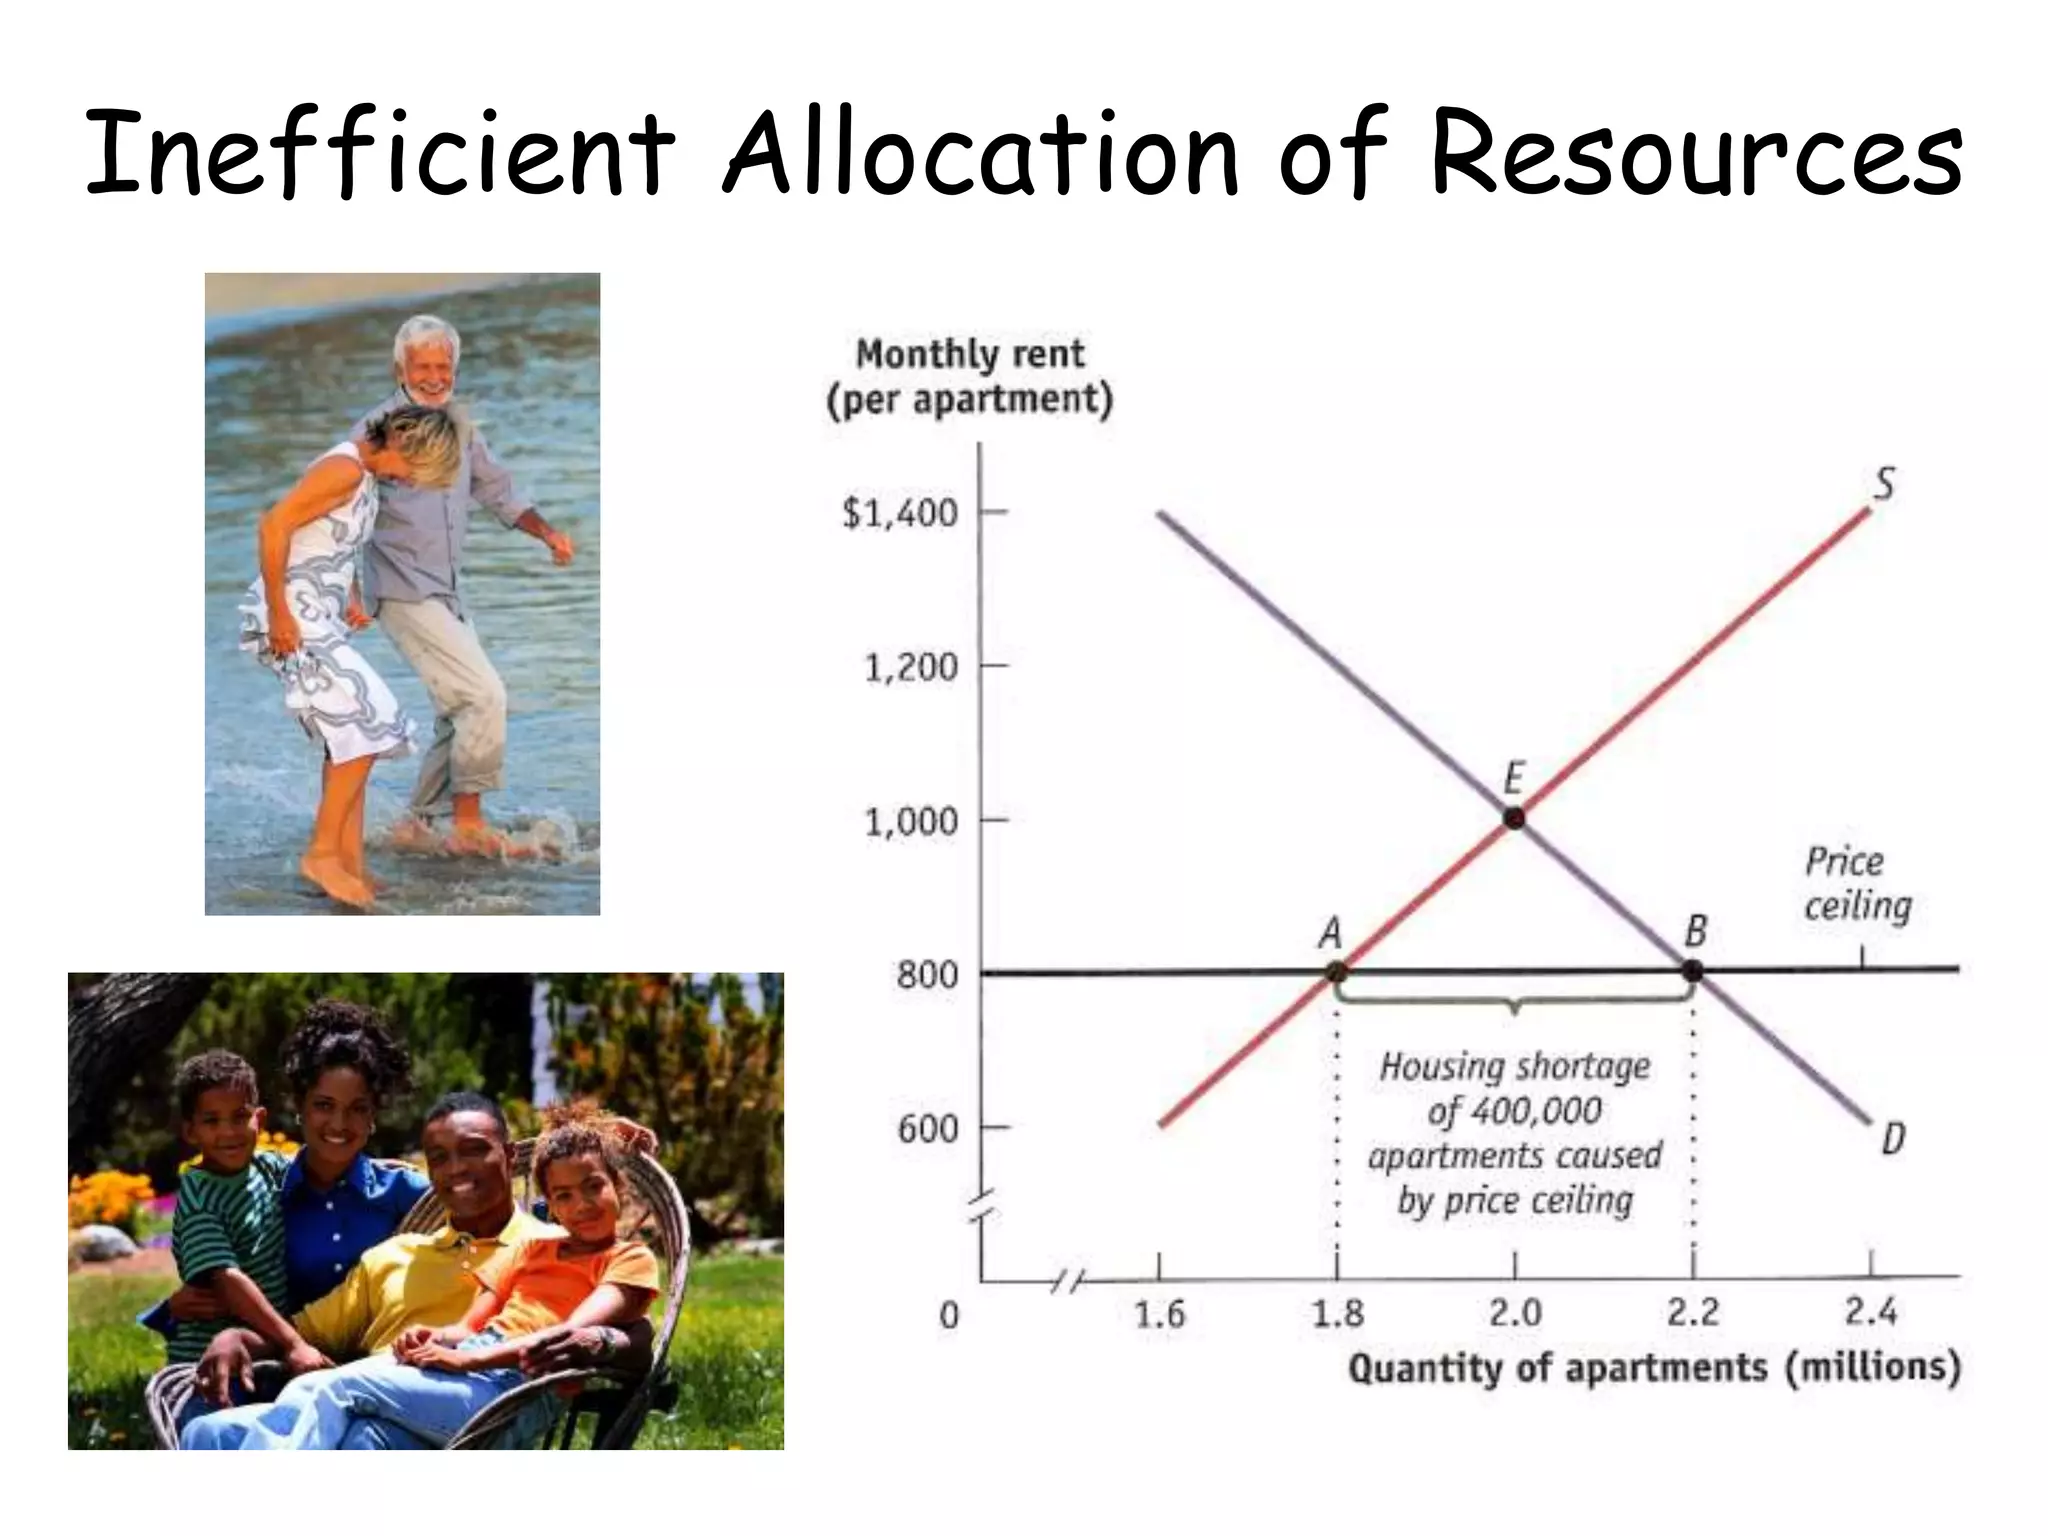
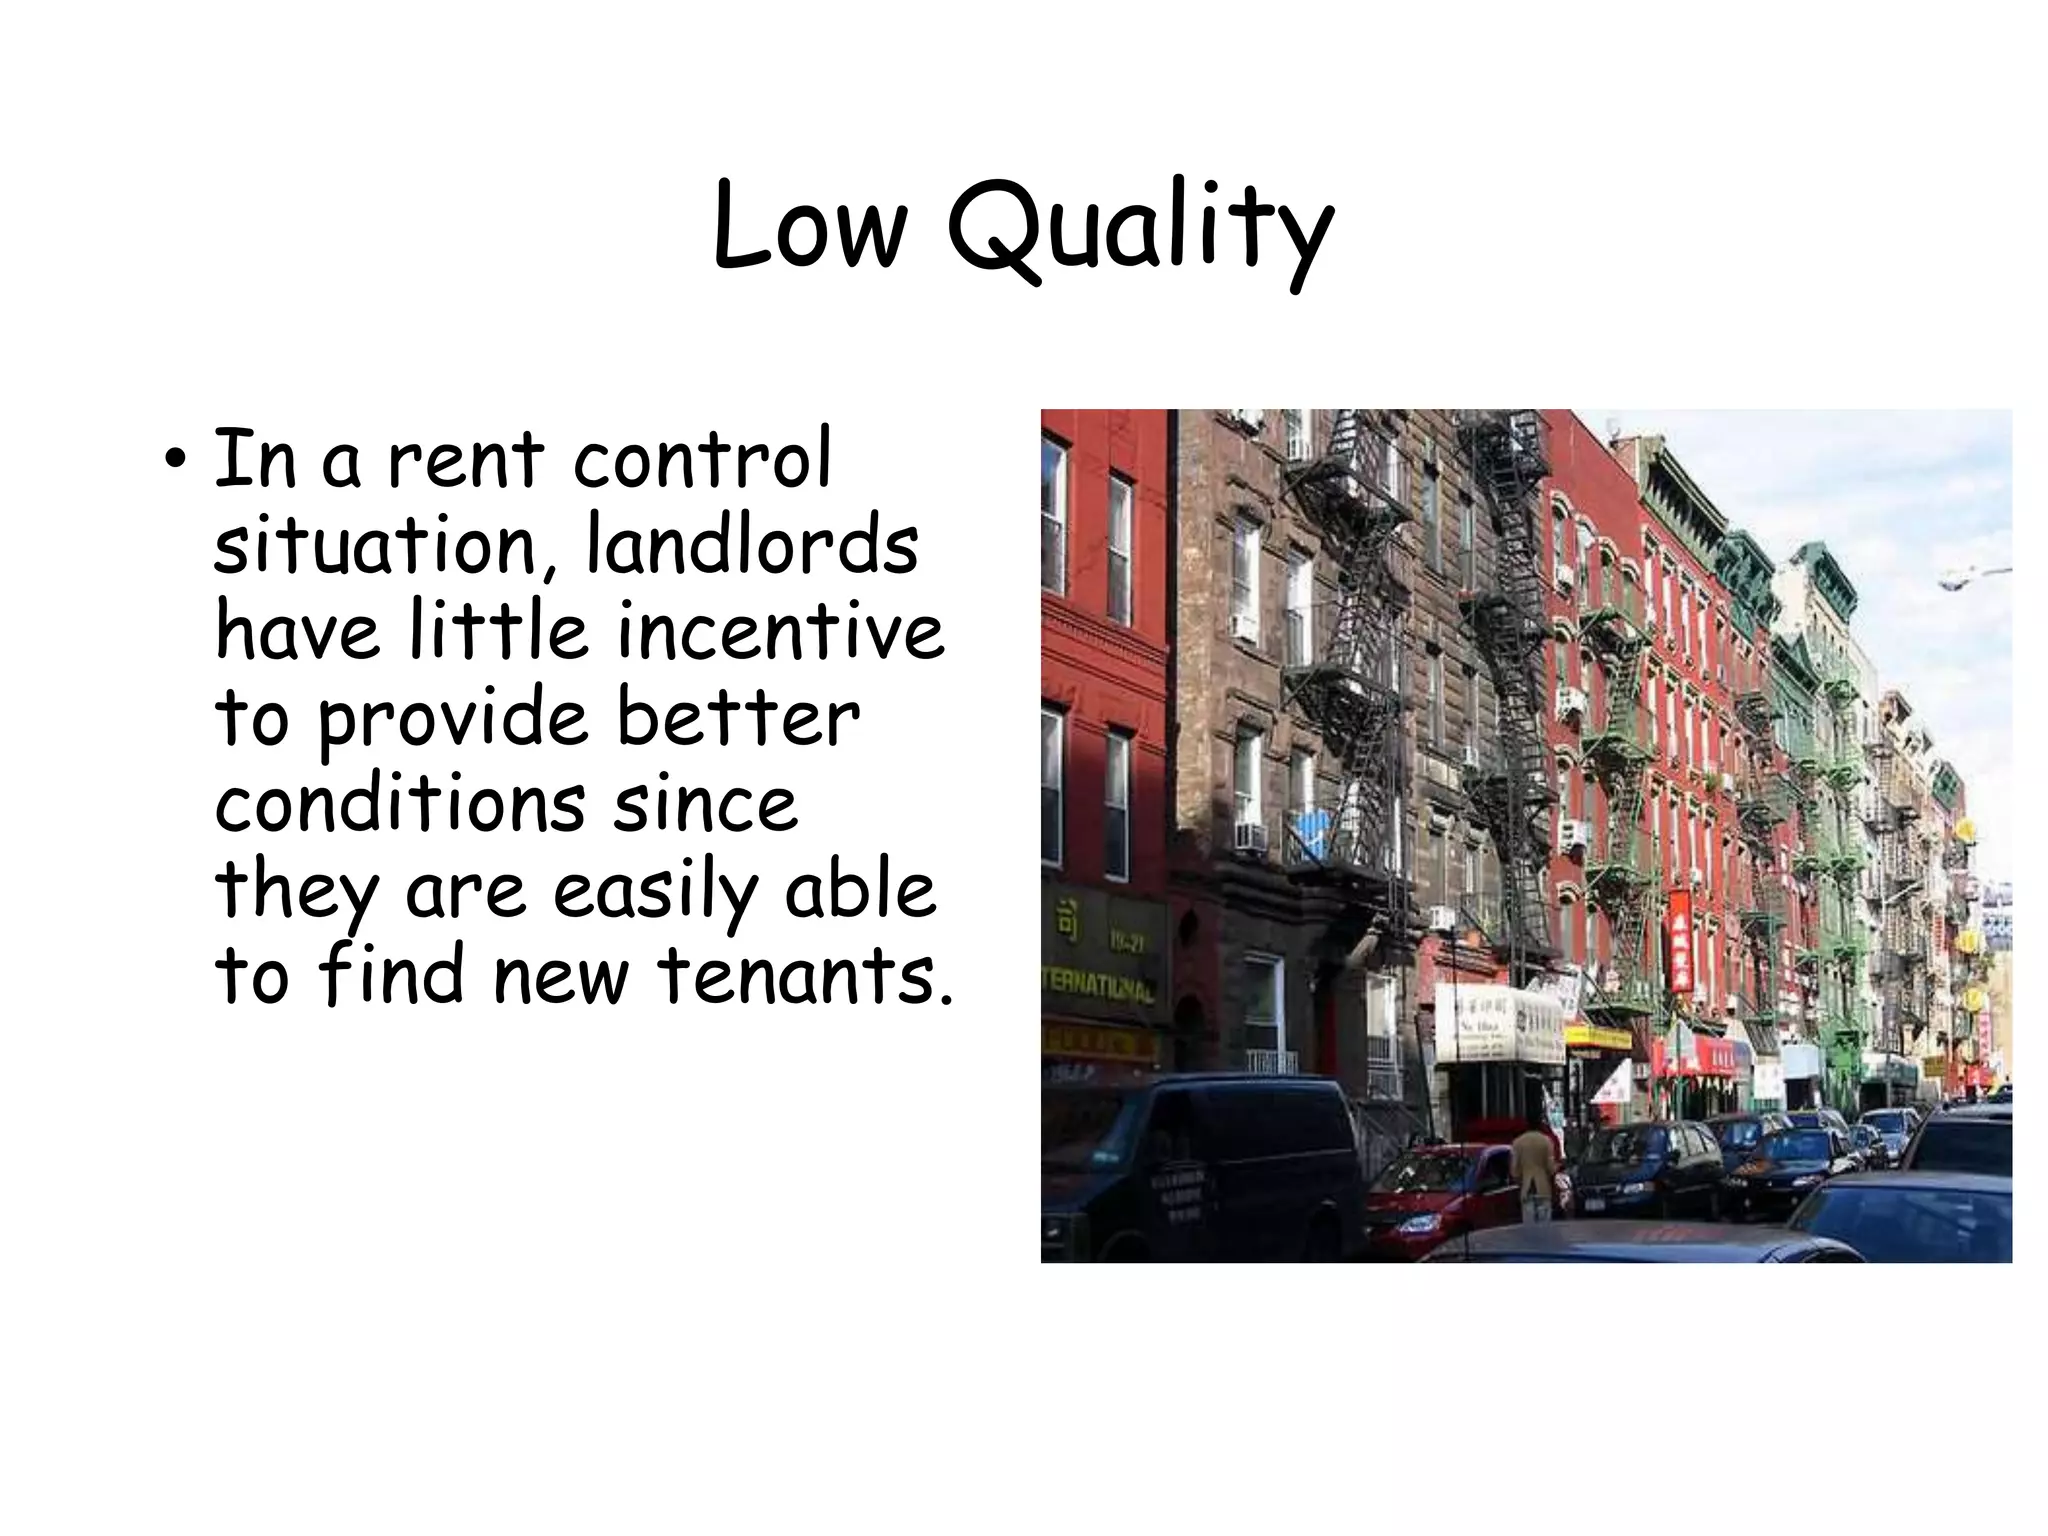
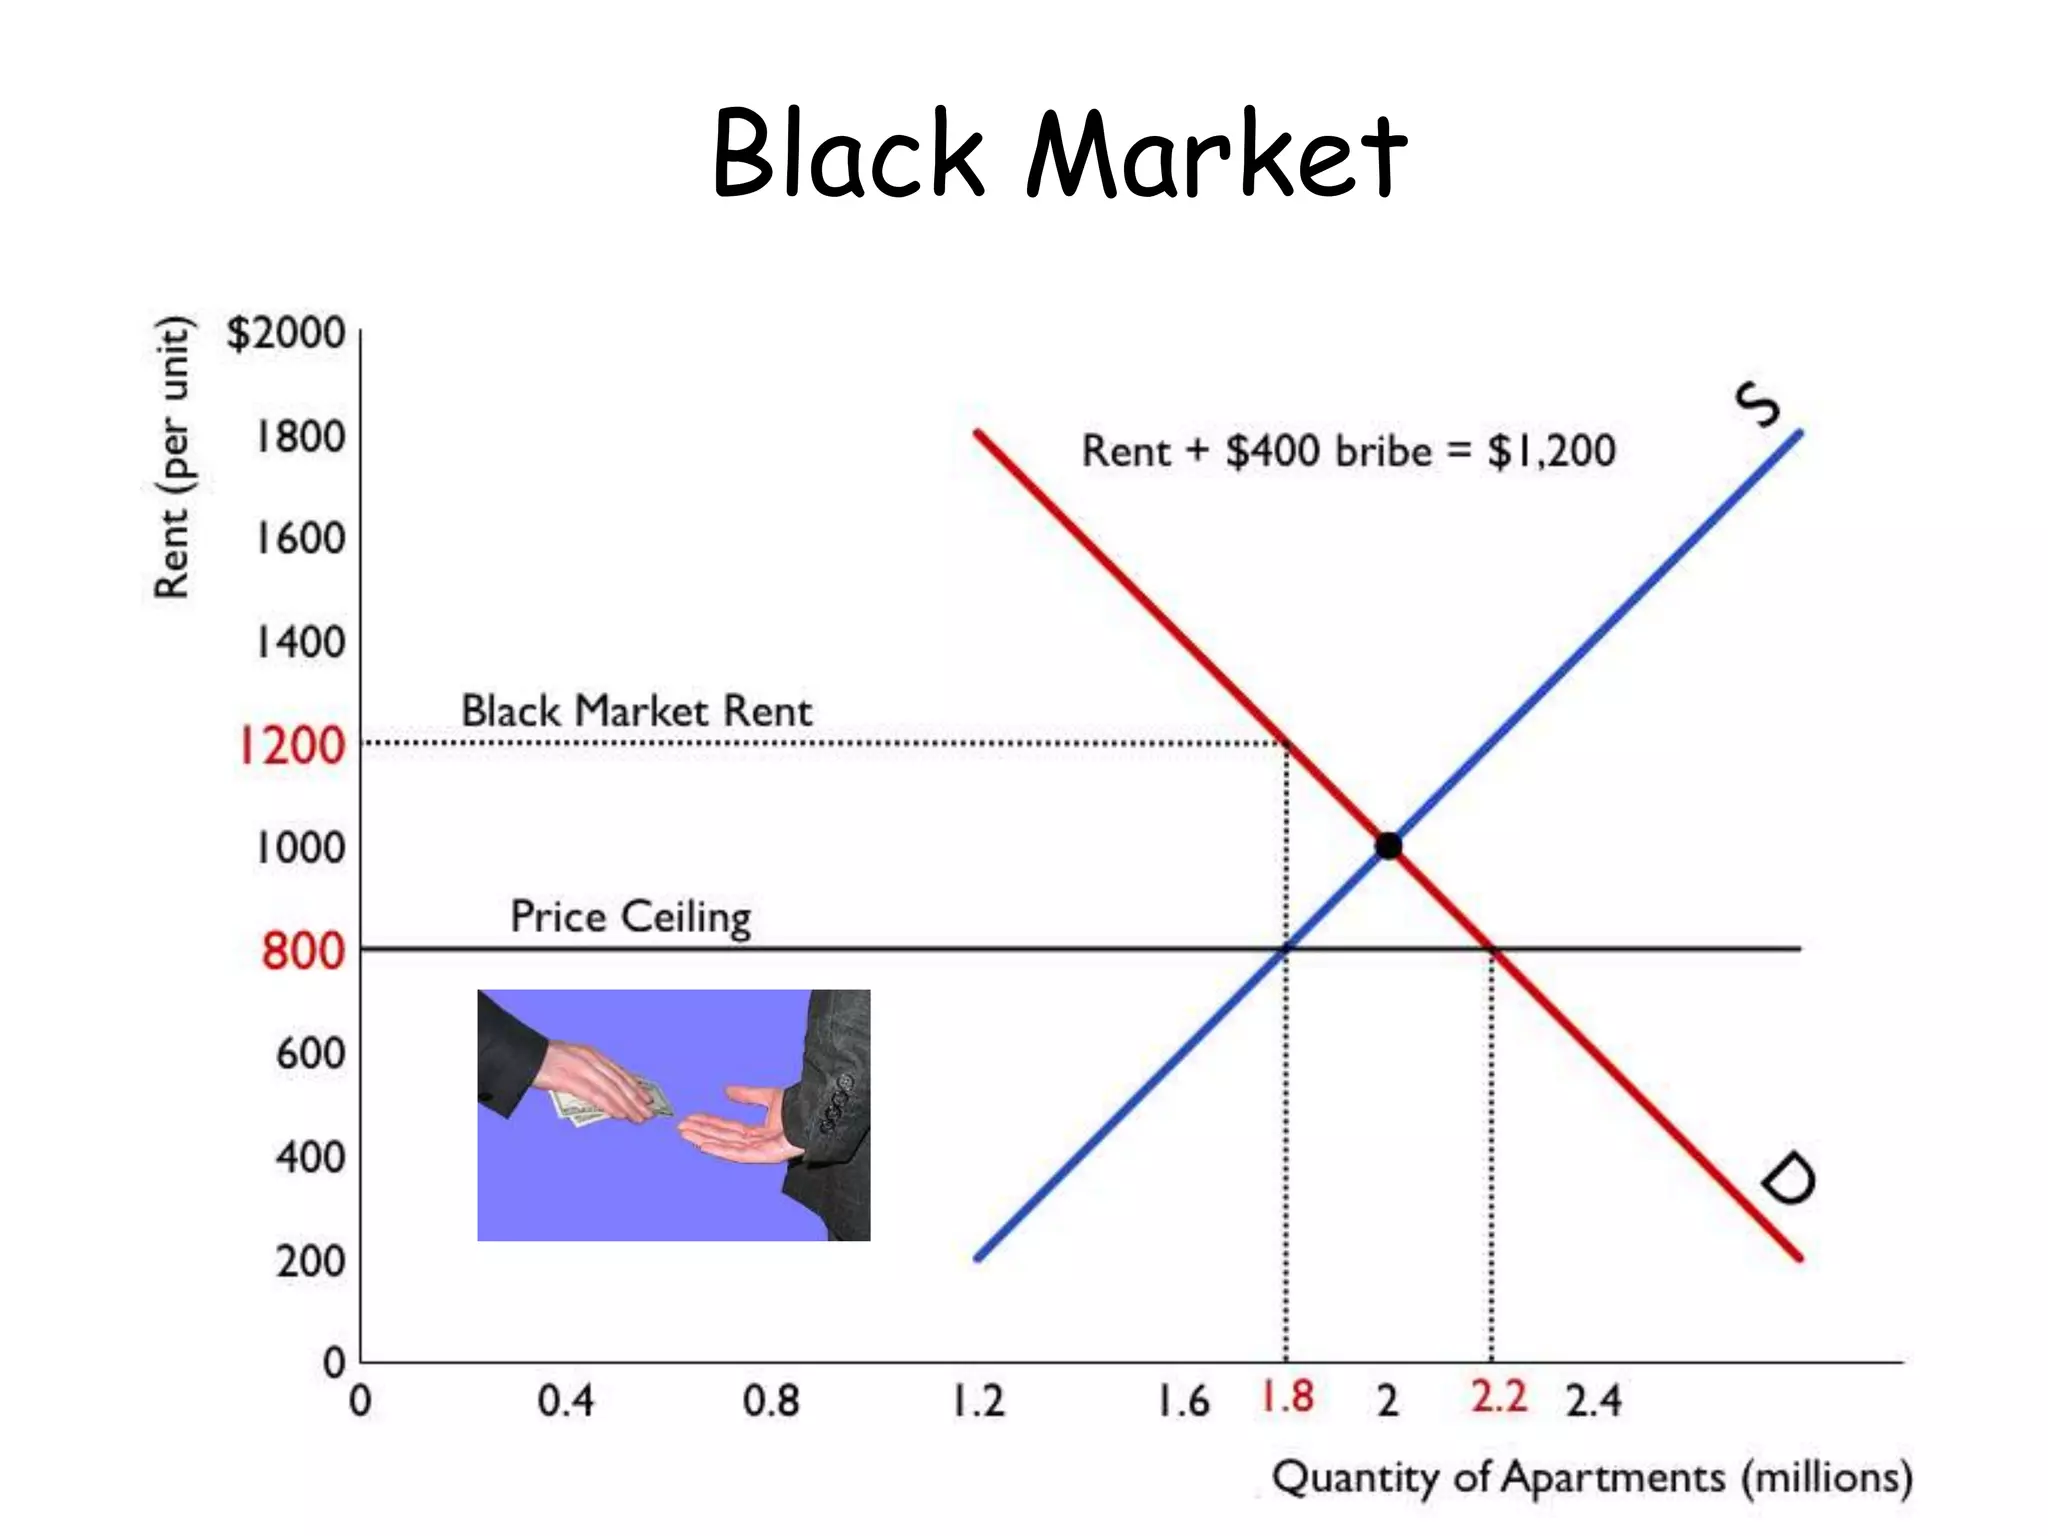
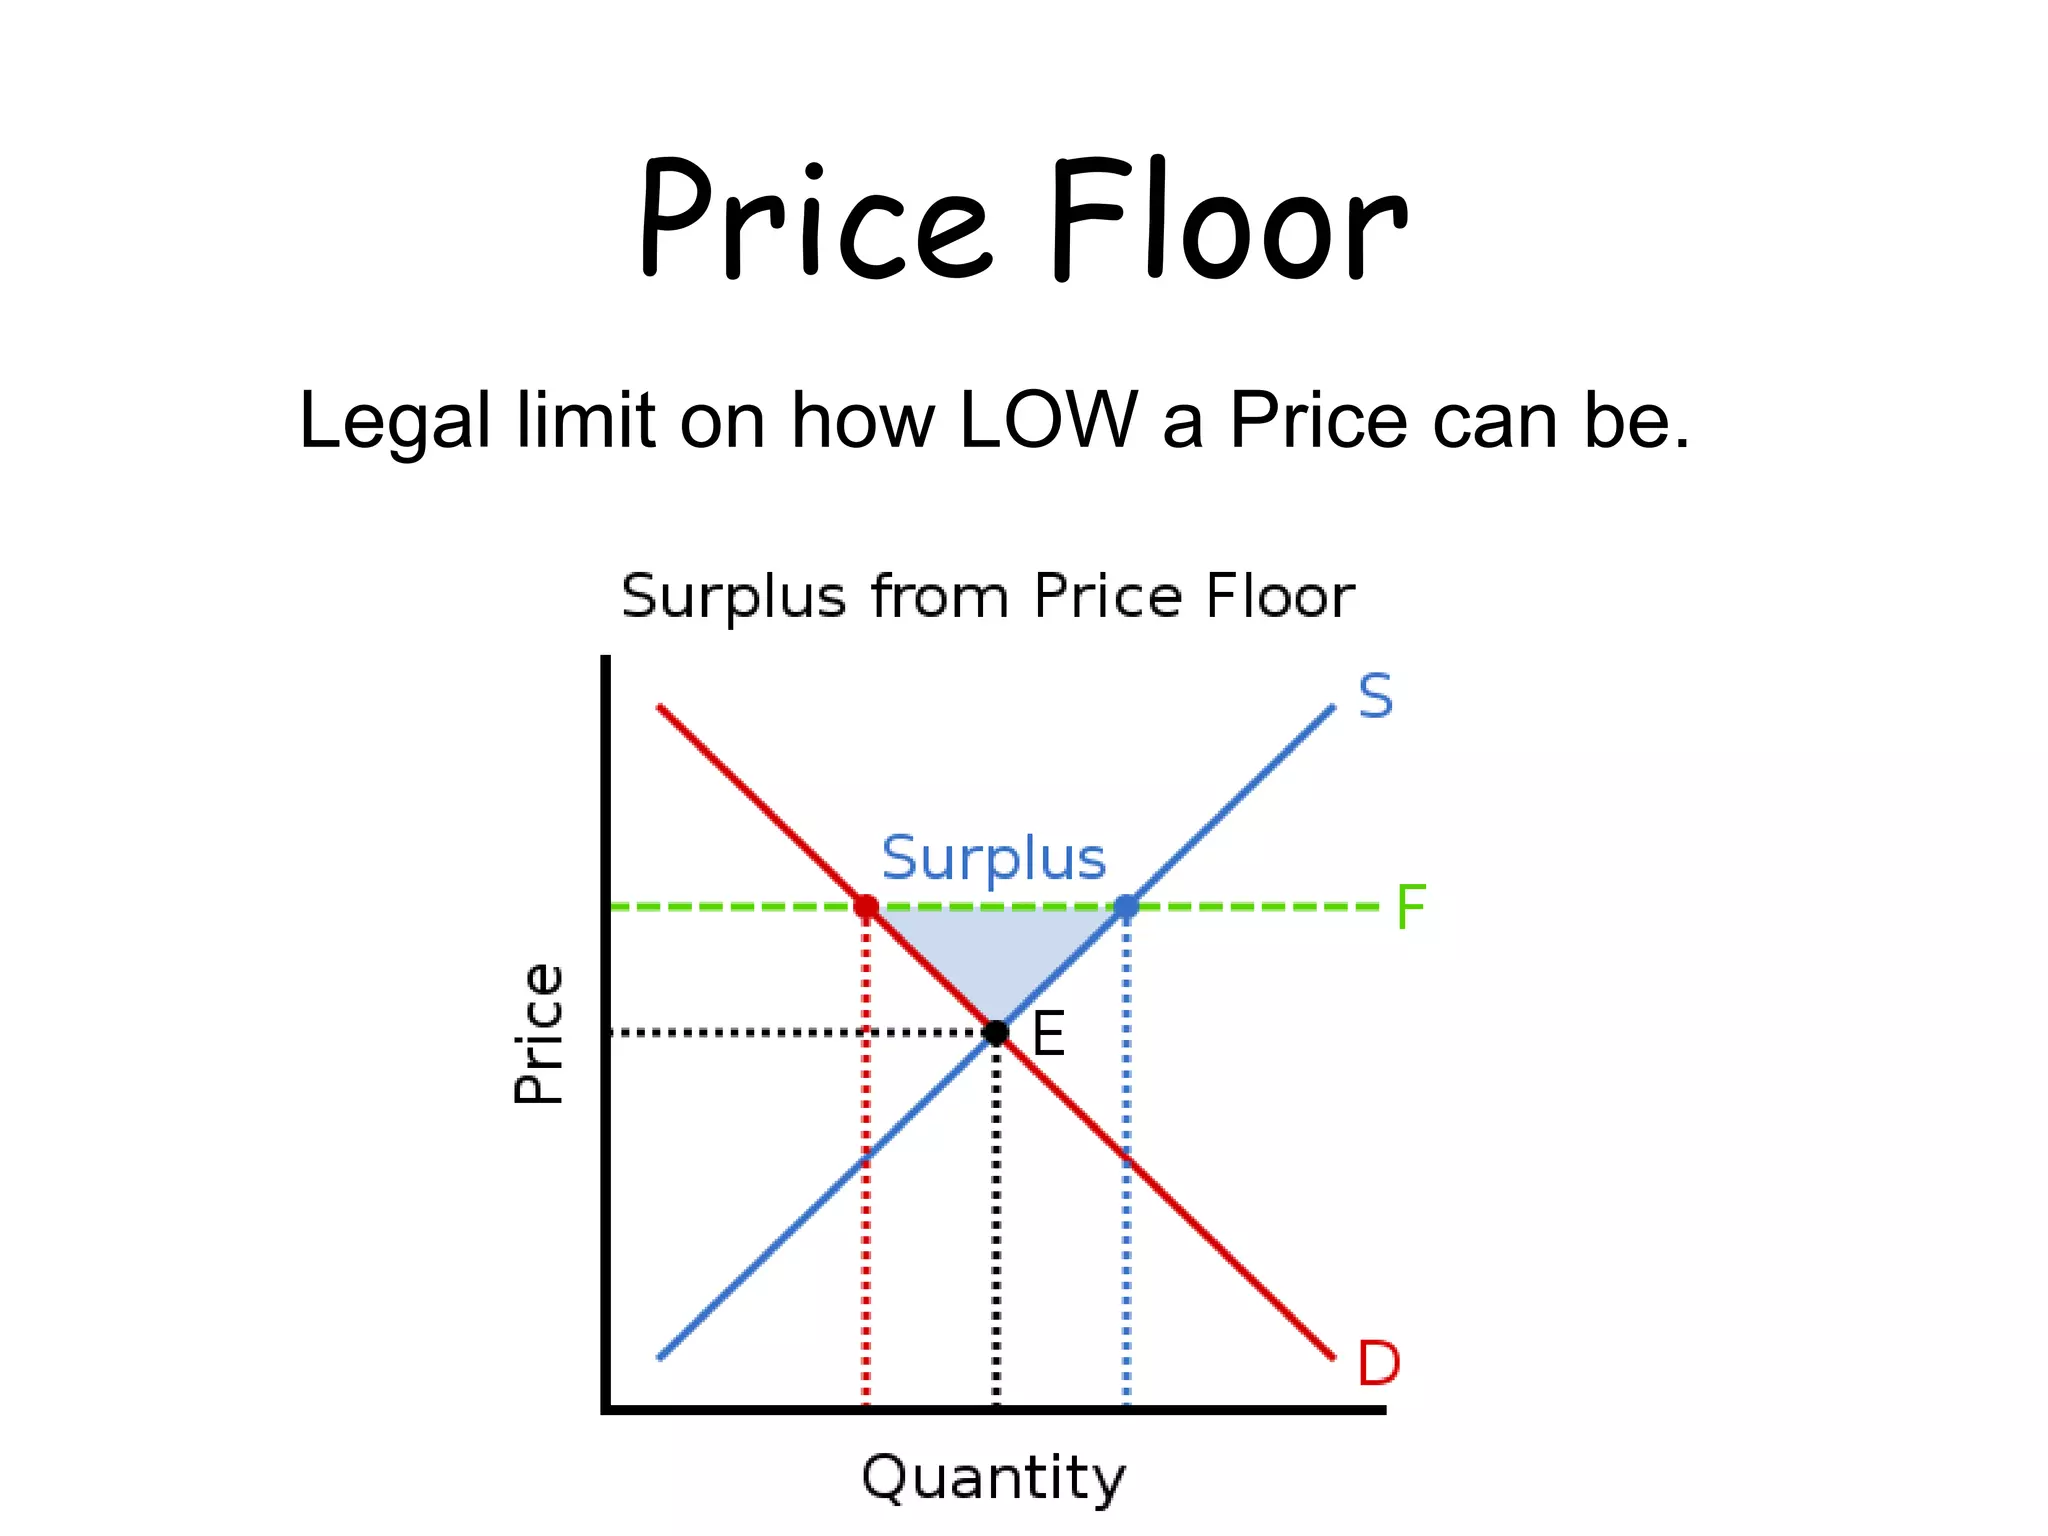
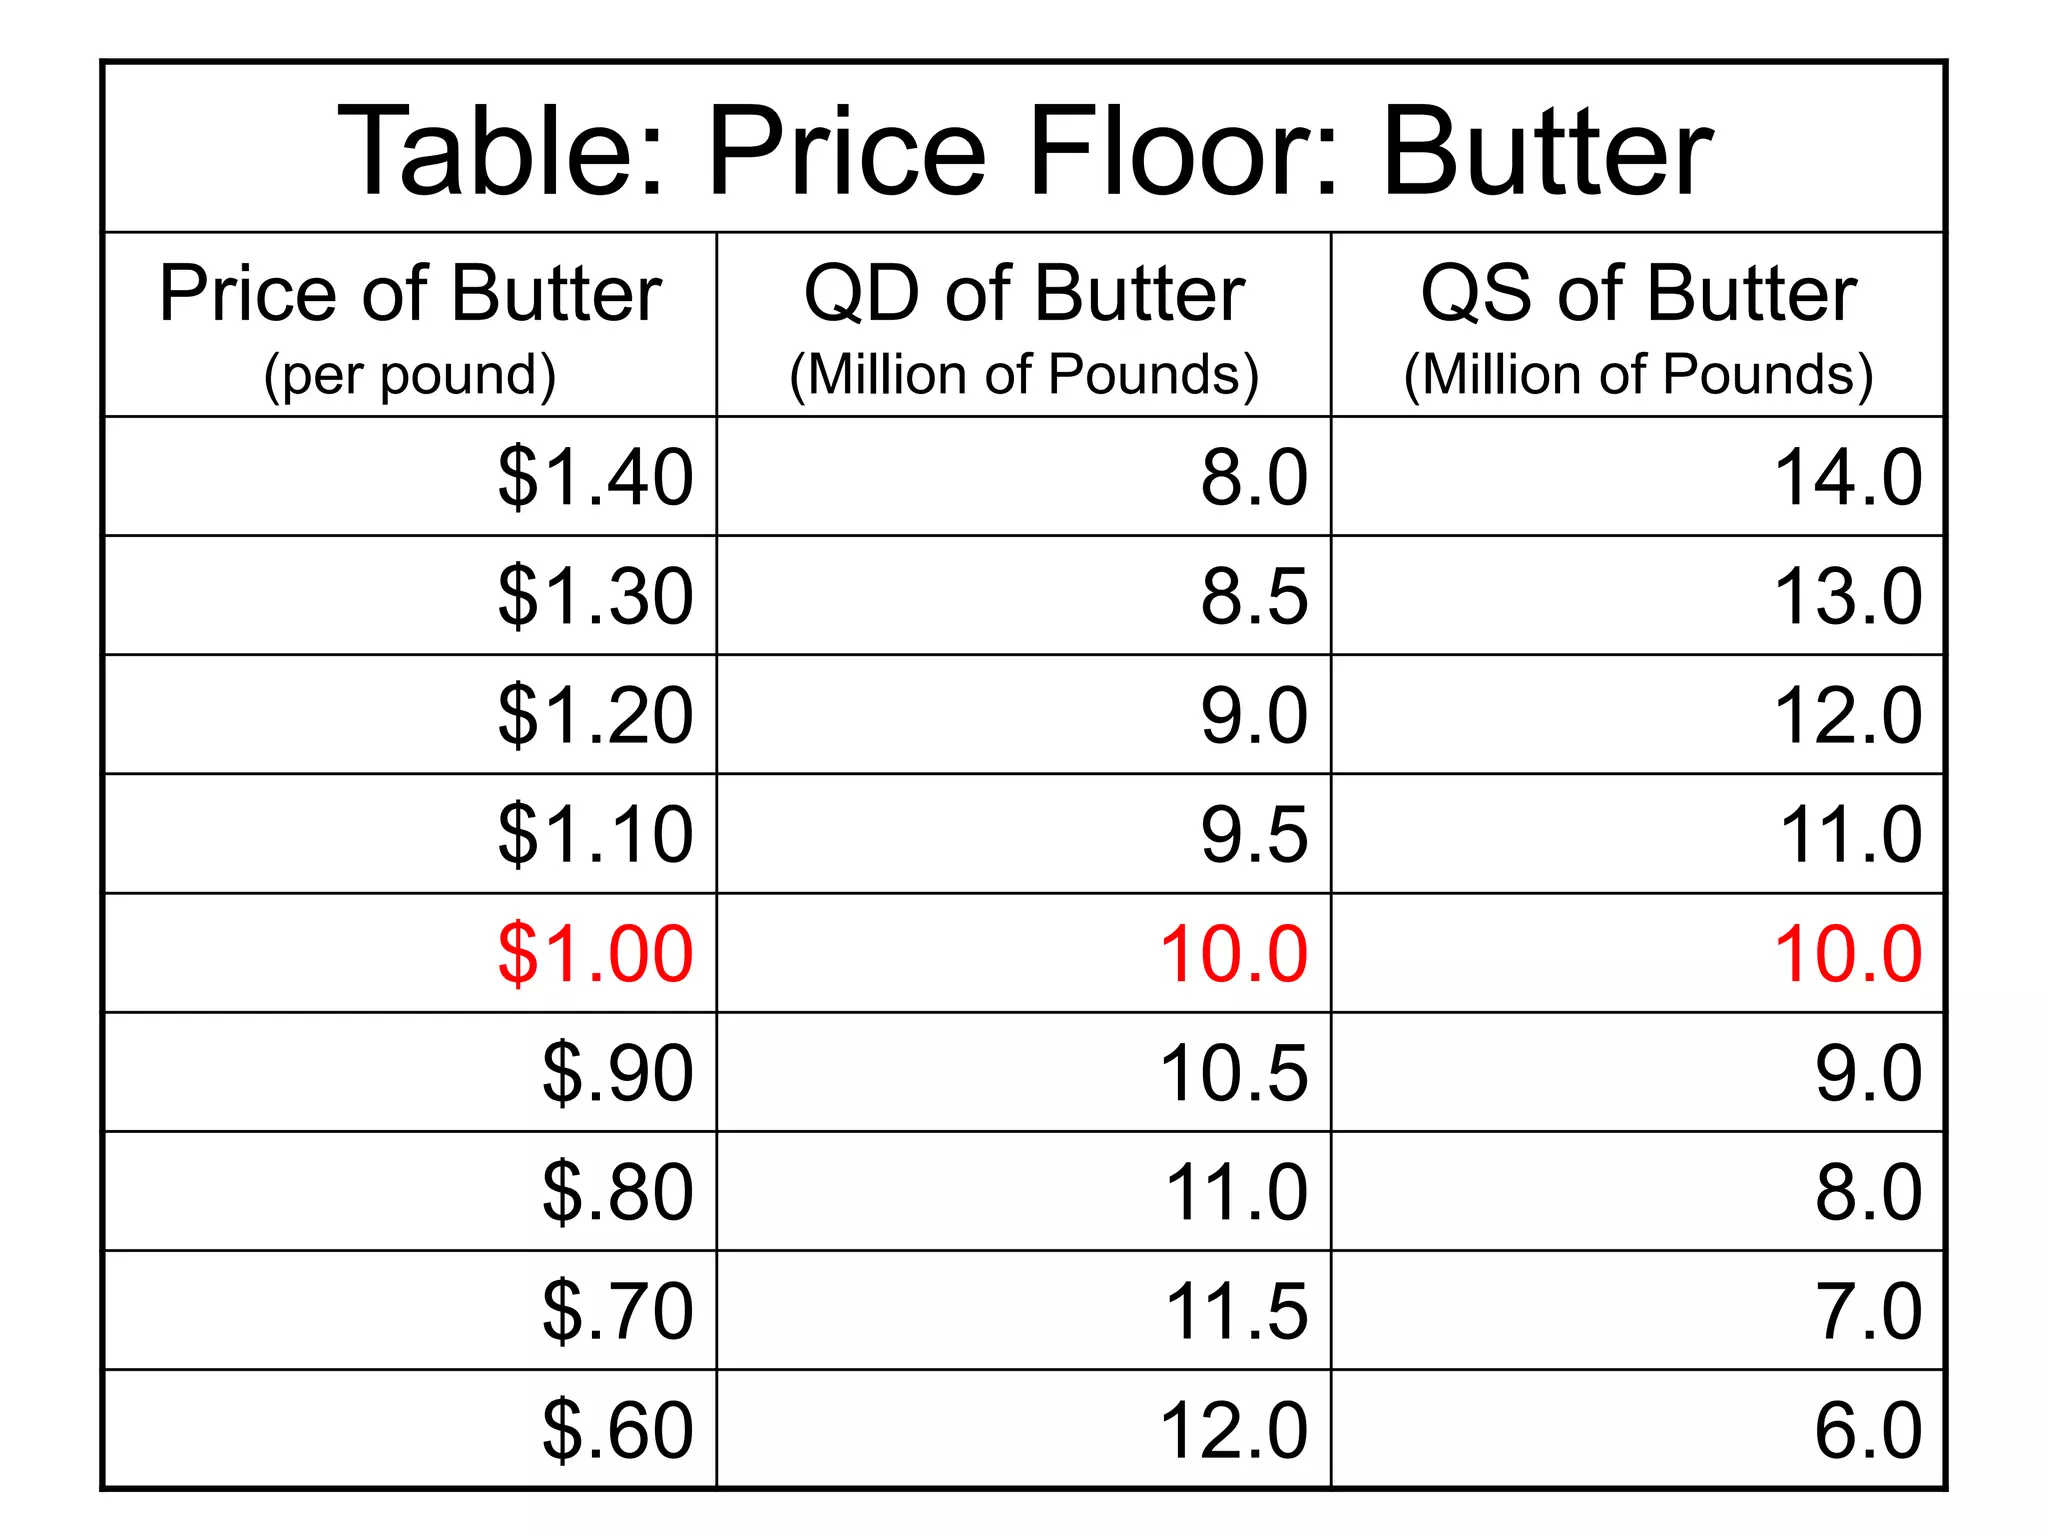
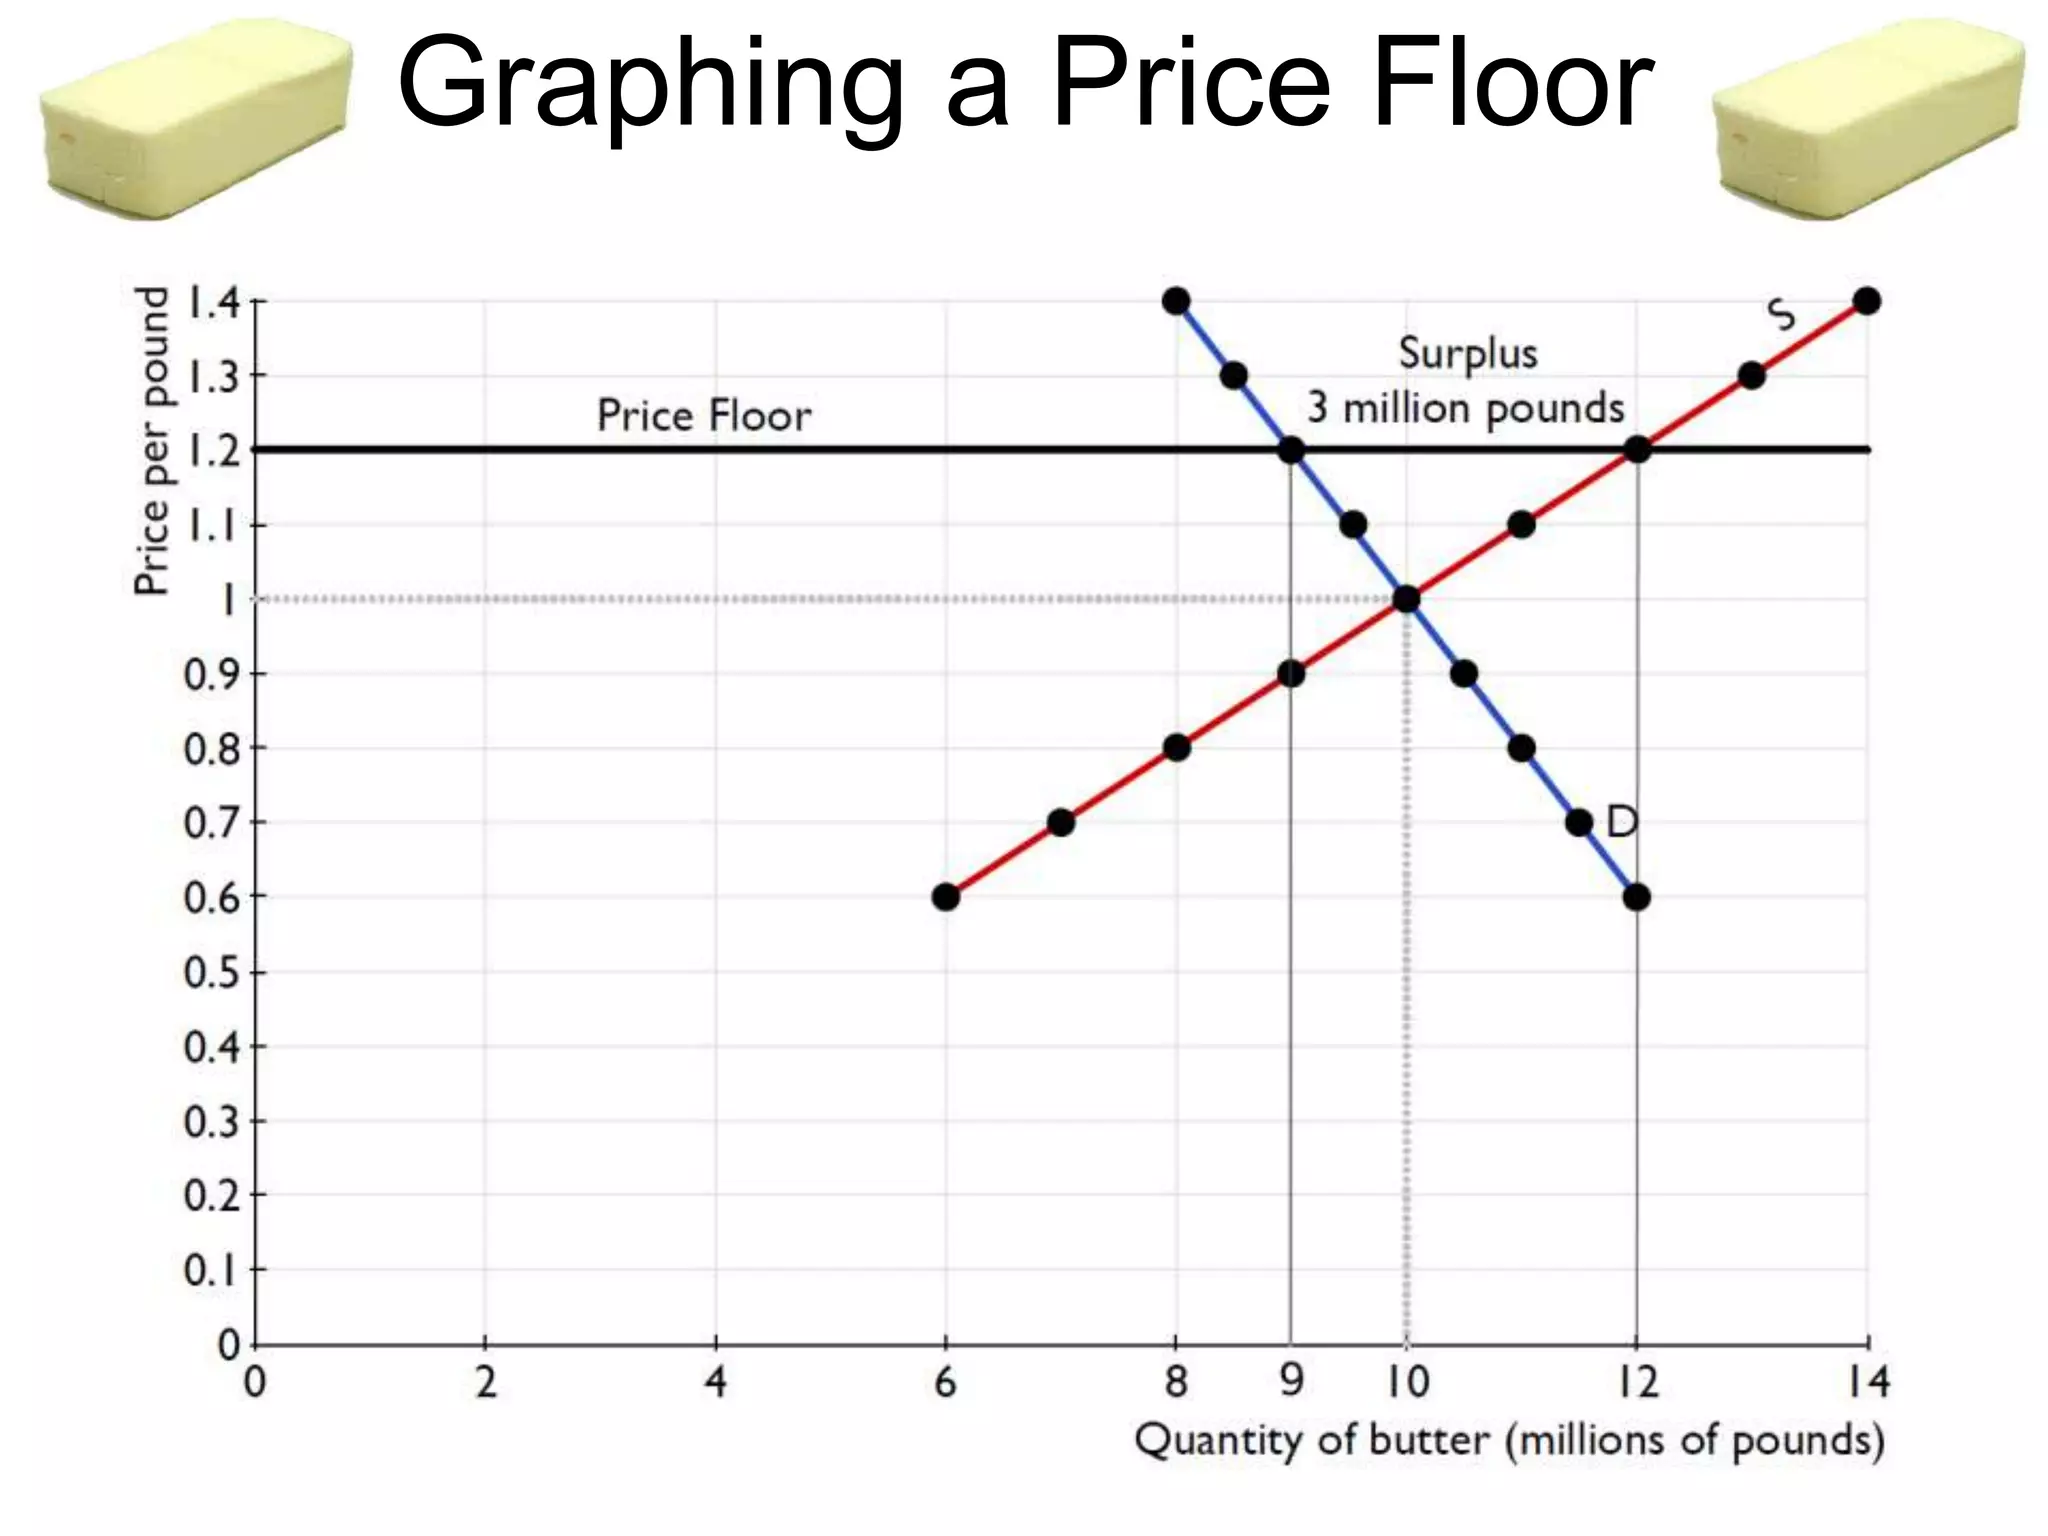
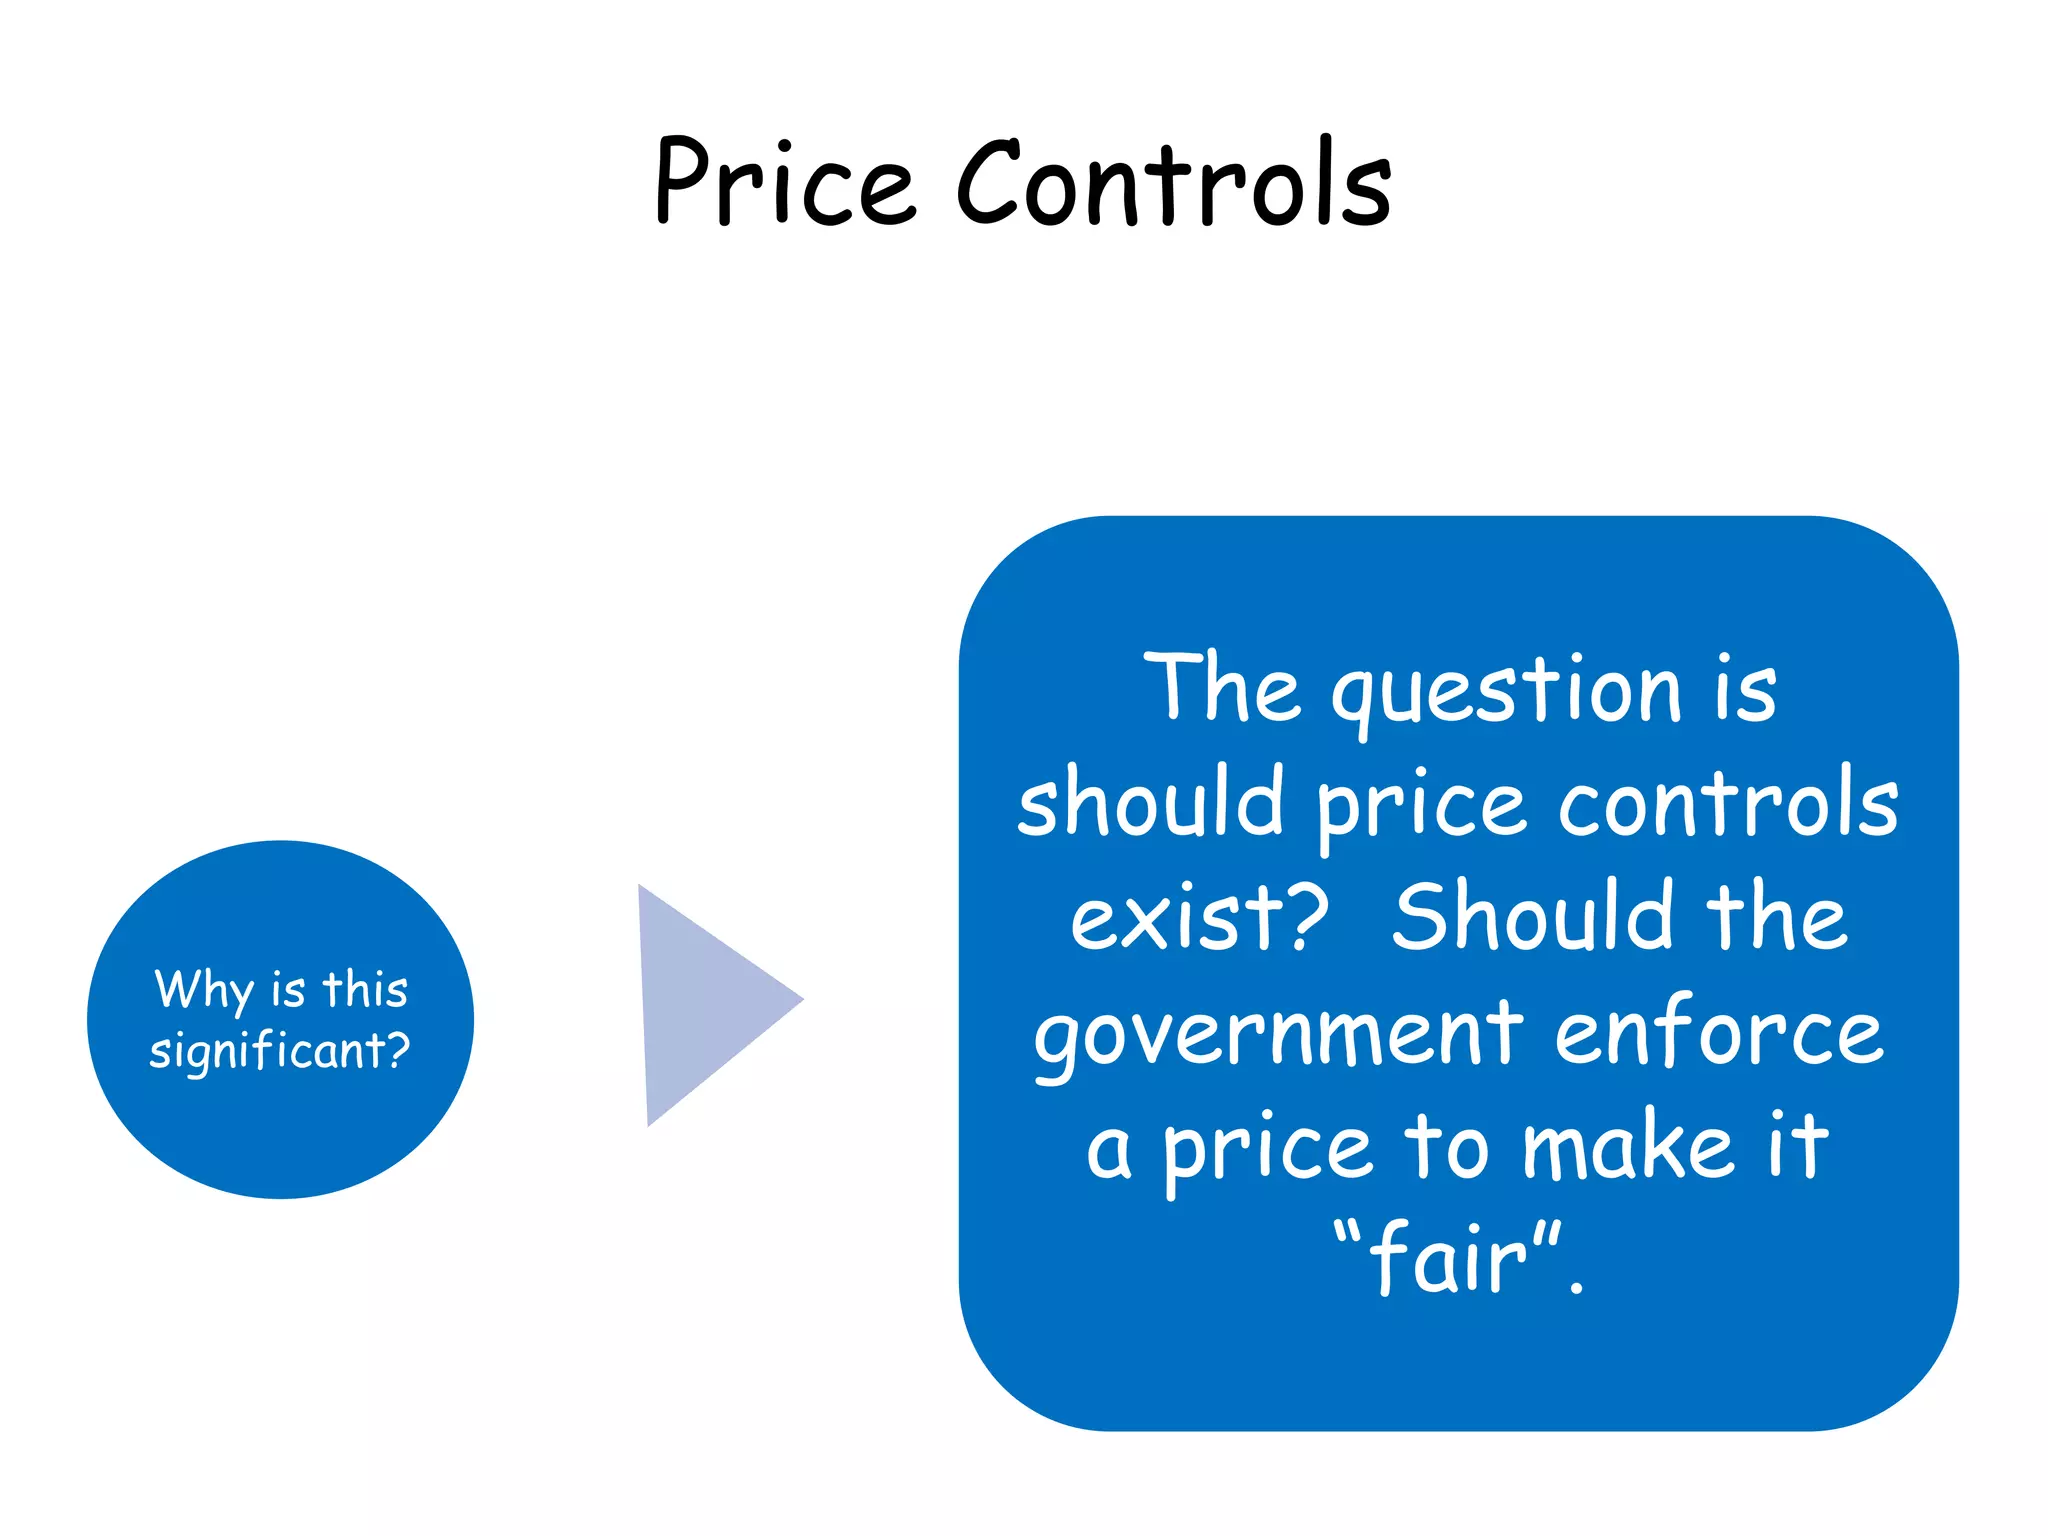
Price Controls
Why isthis
significant?
The question is
should price controls
exist? Should the
government enforce
a price to make it
“fair”.
104.
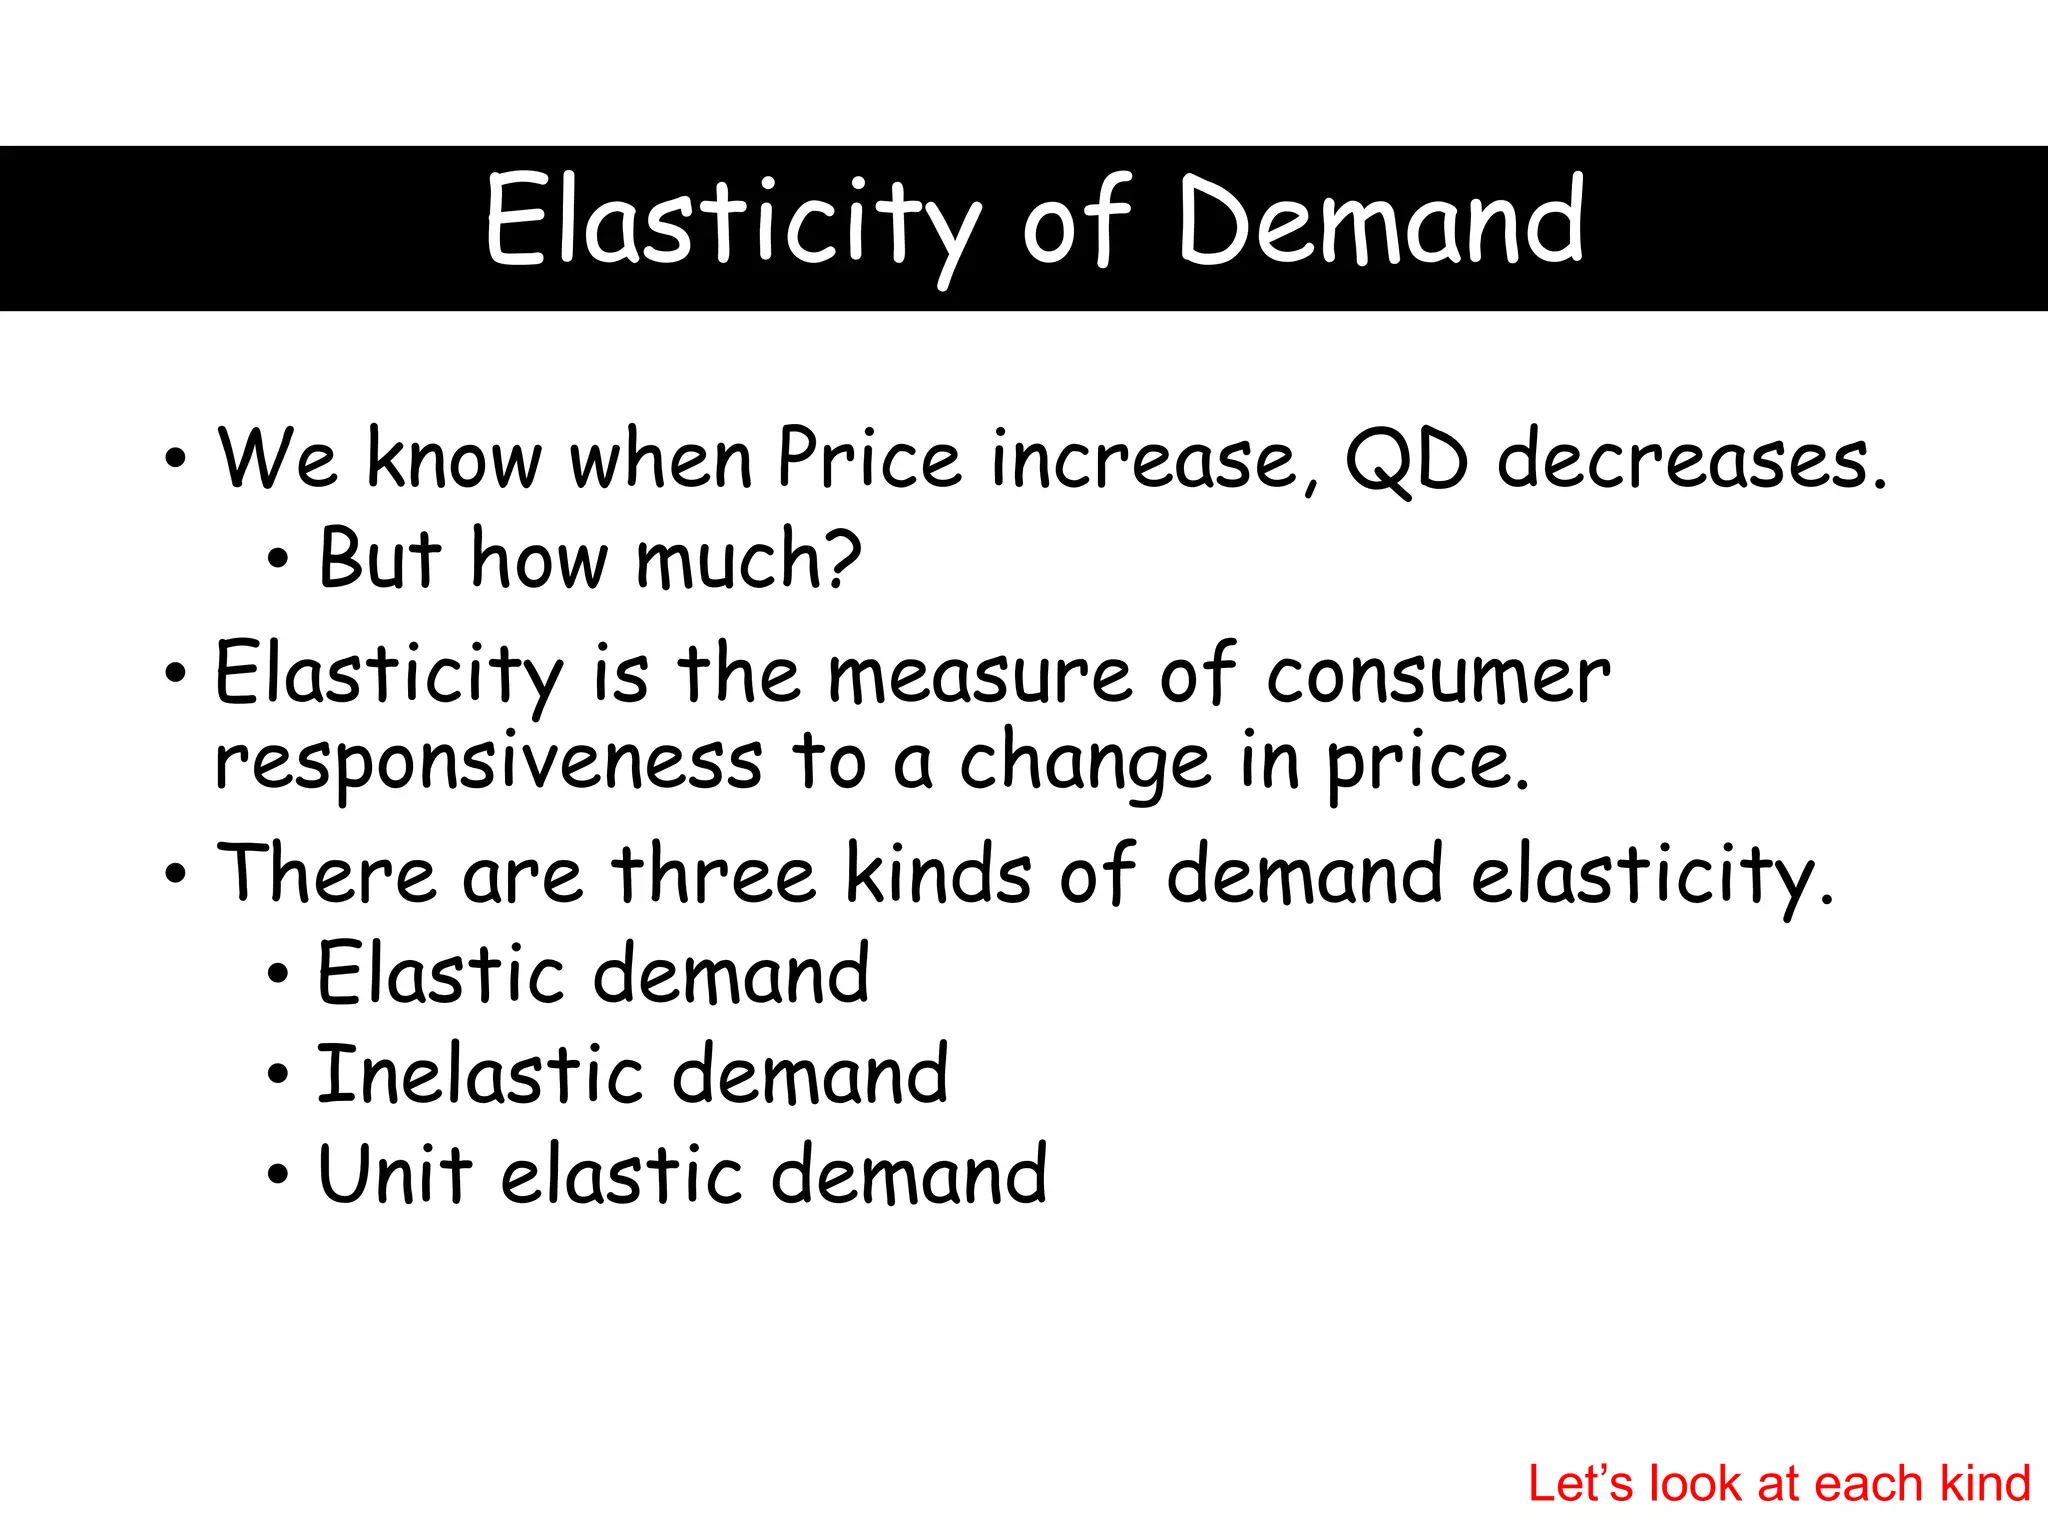
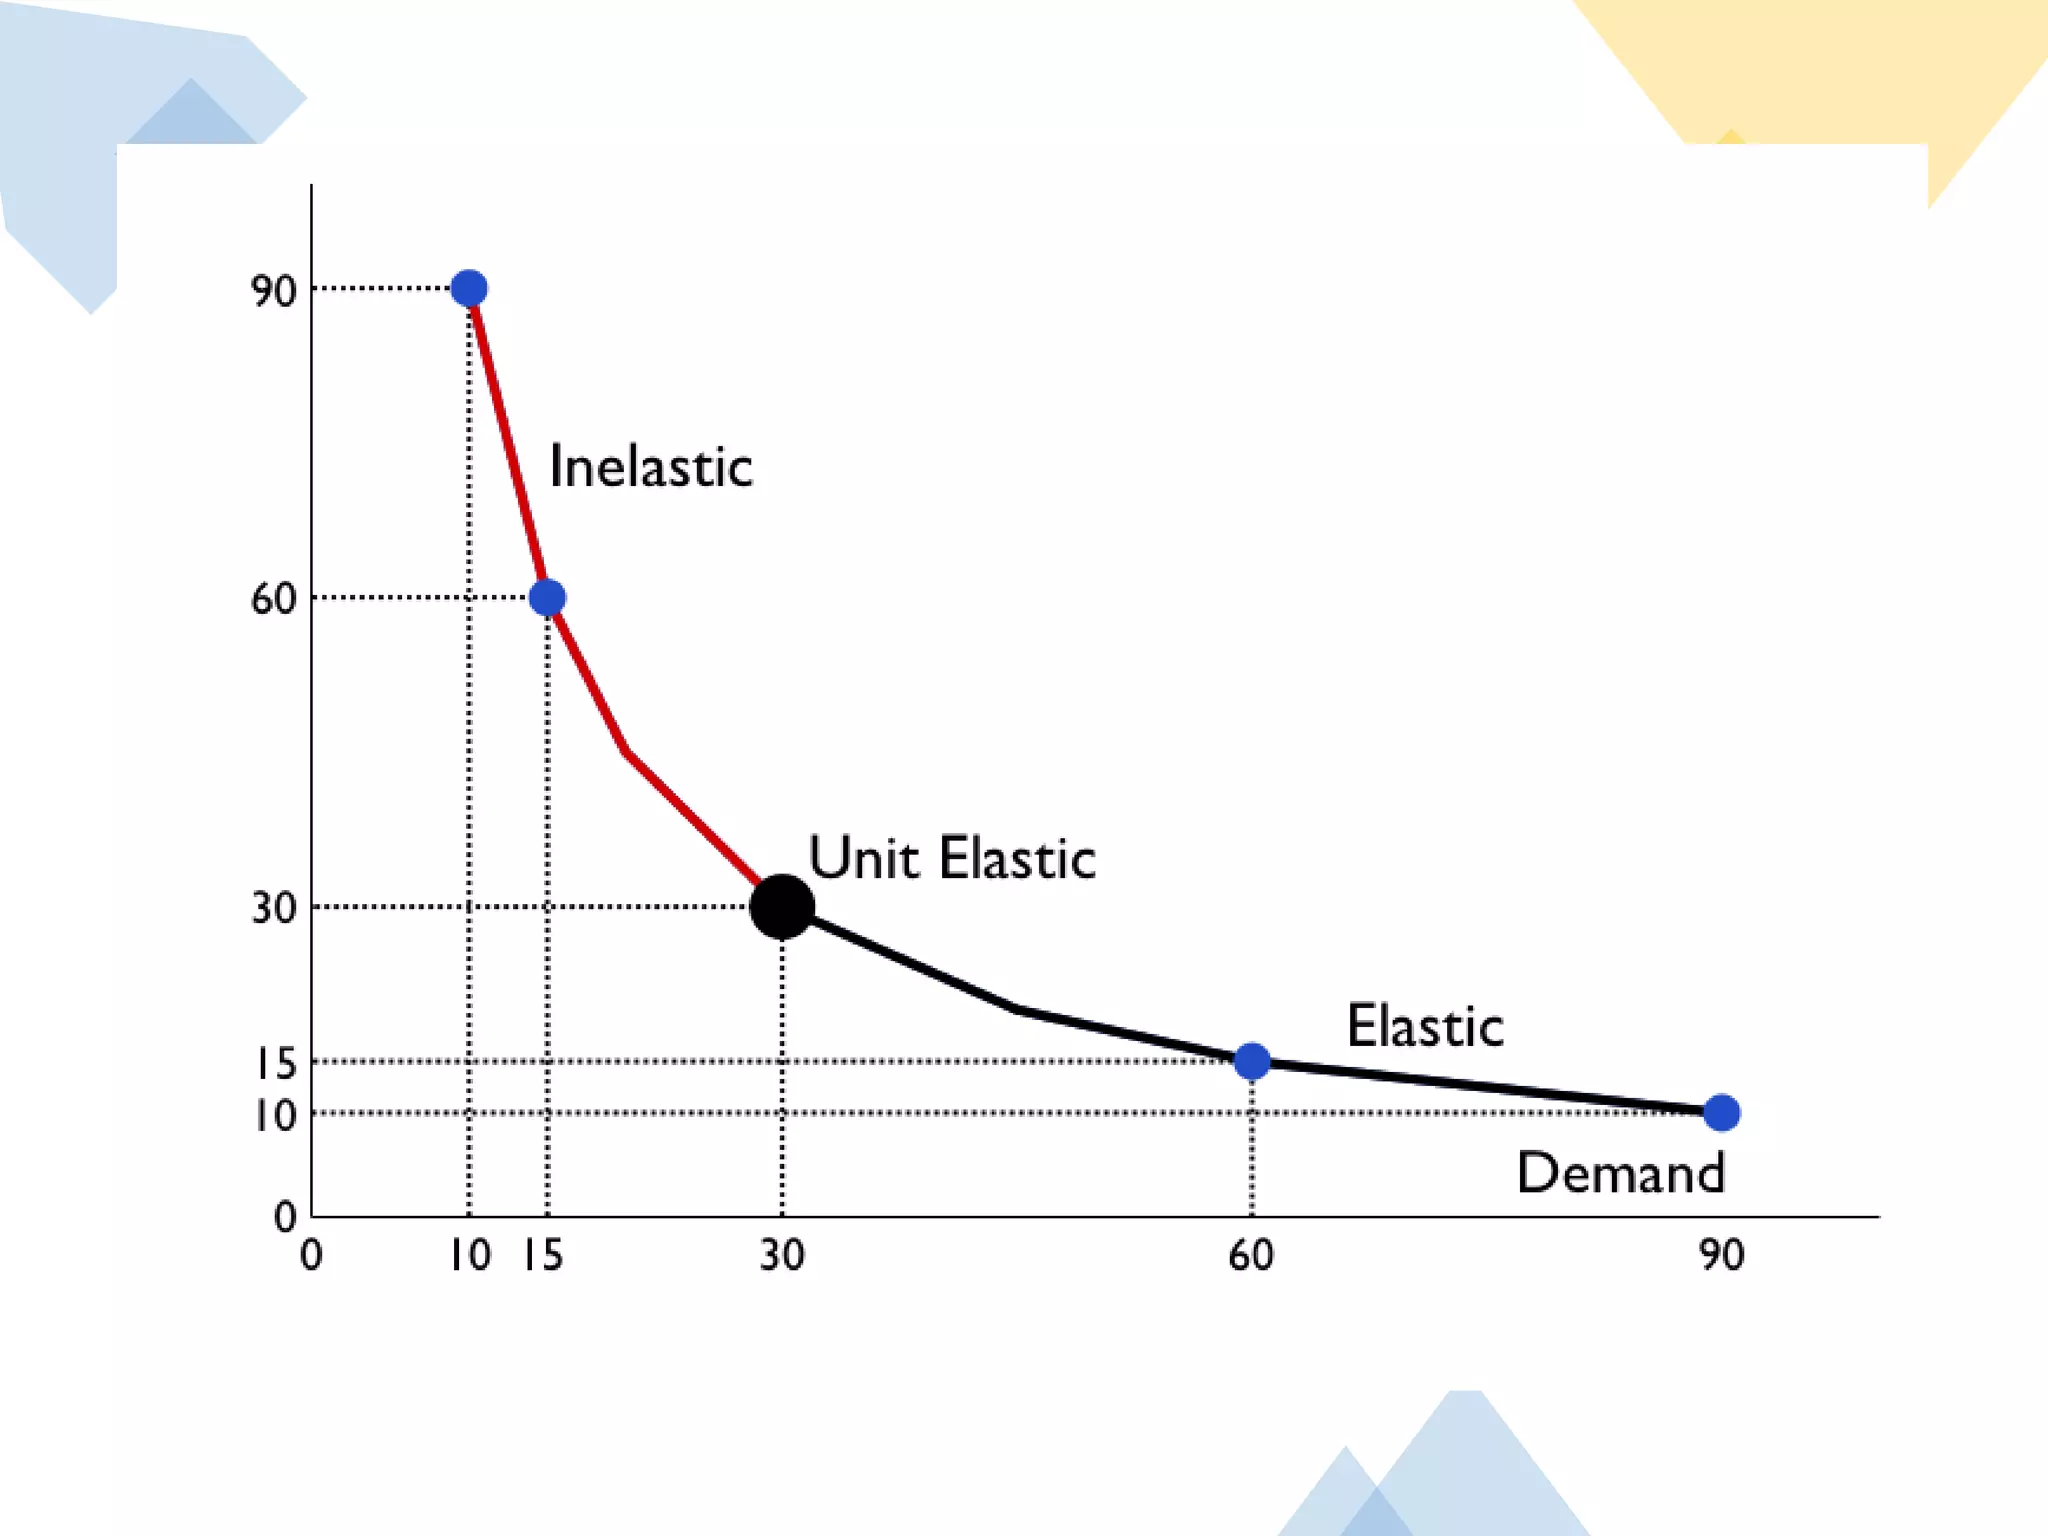
Elasticity of Demand
•We know when Price increase, QD decreases.
• But how much?
• Elasticity is the measure of consumer
responsiveness to a change in price.
• There are three kinds of demand elasticity.
• Elastic demand
• Inelastic demand
• Unit elastic demand
Let’s look at each kind
105.
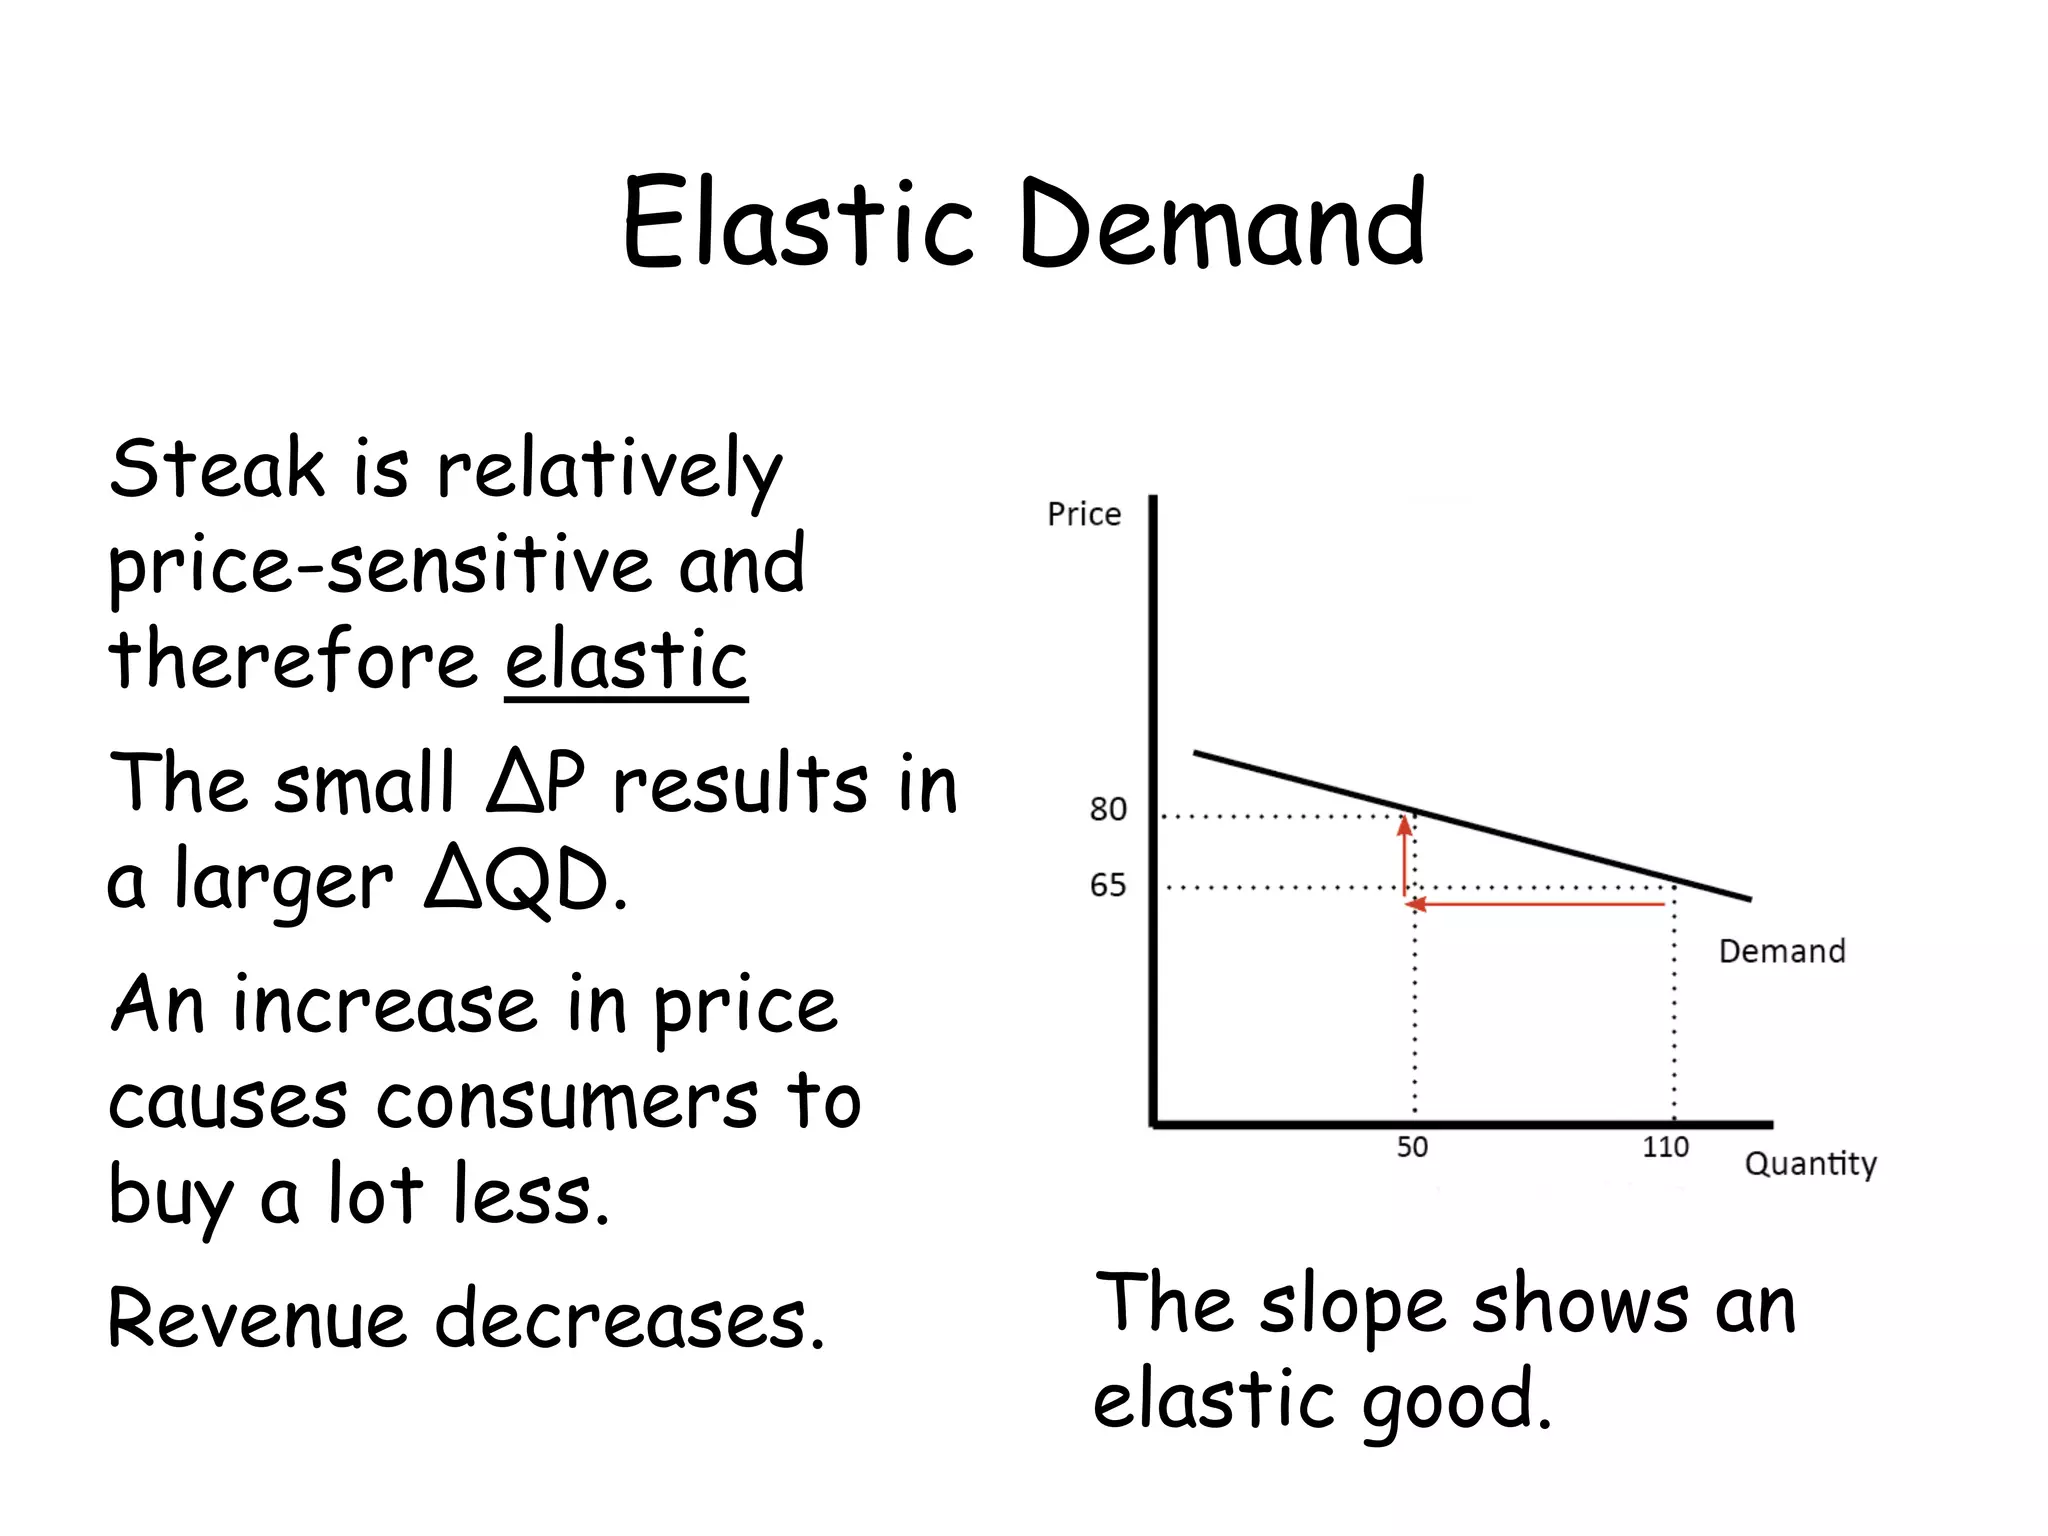
Elastic Demand
Steak isrelatively
price-sensitive and
therefore elastic
The small ∆P results in
a larger ∆QD.
An increase in price
causes consumers to
buy a lot less.
Revenue decreases. The slope shows an
elastic good.
106.
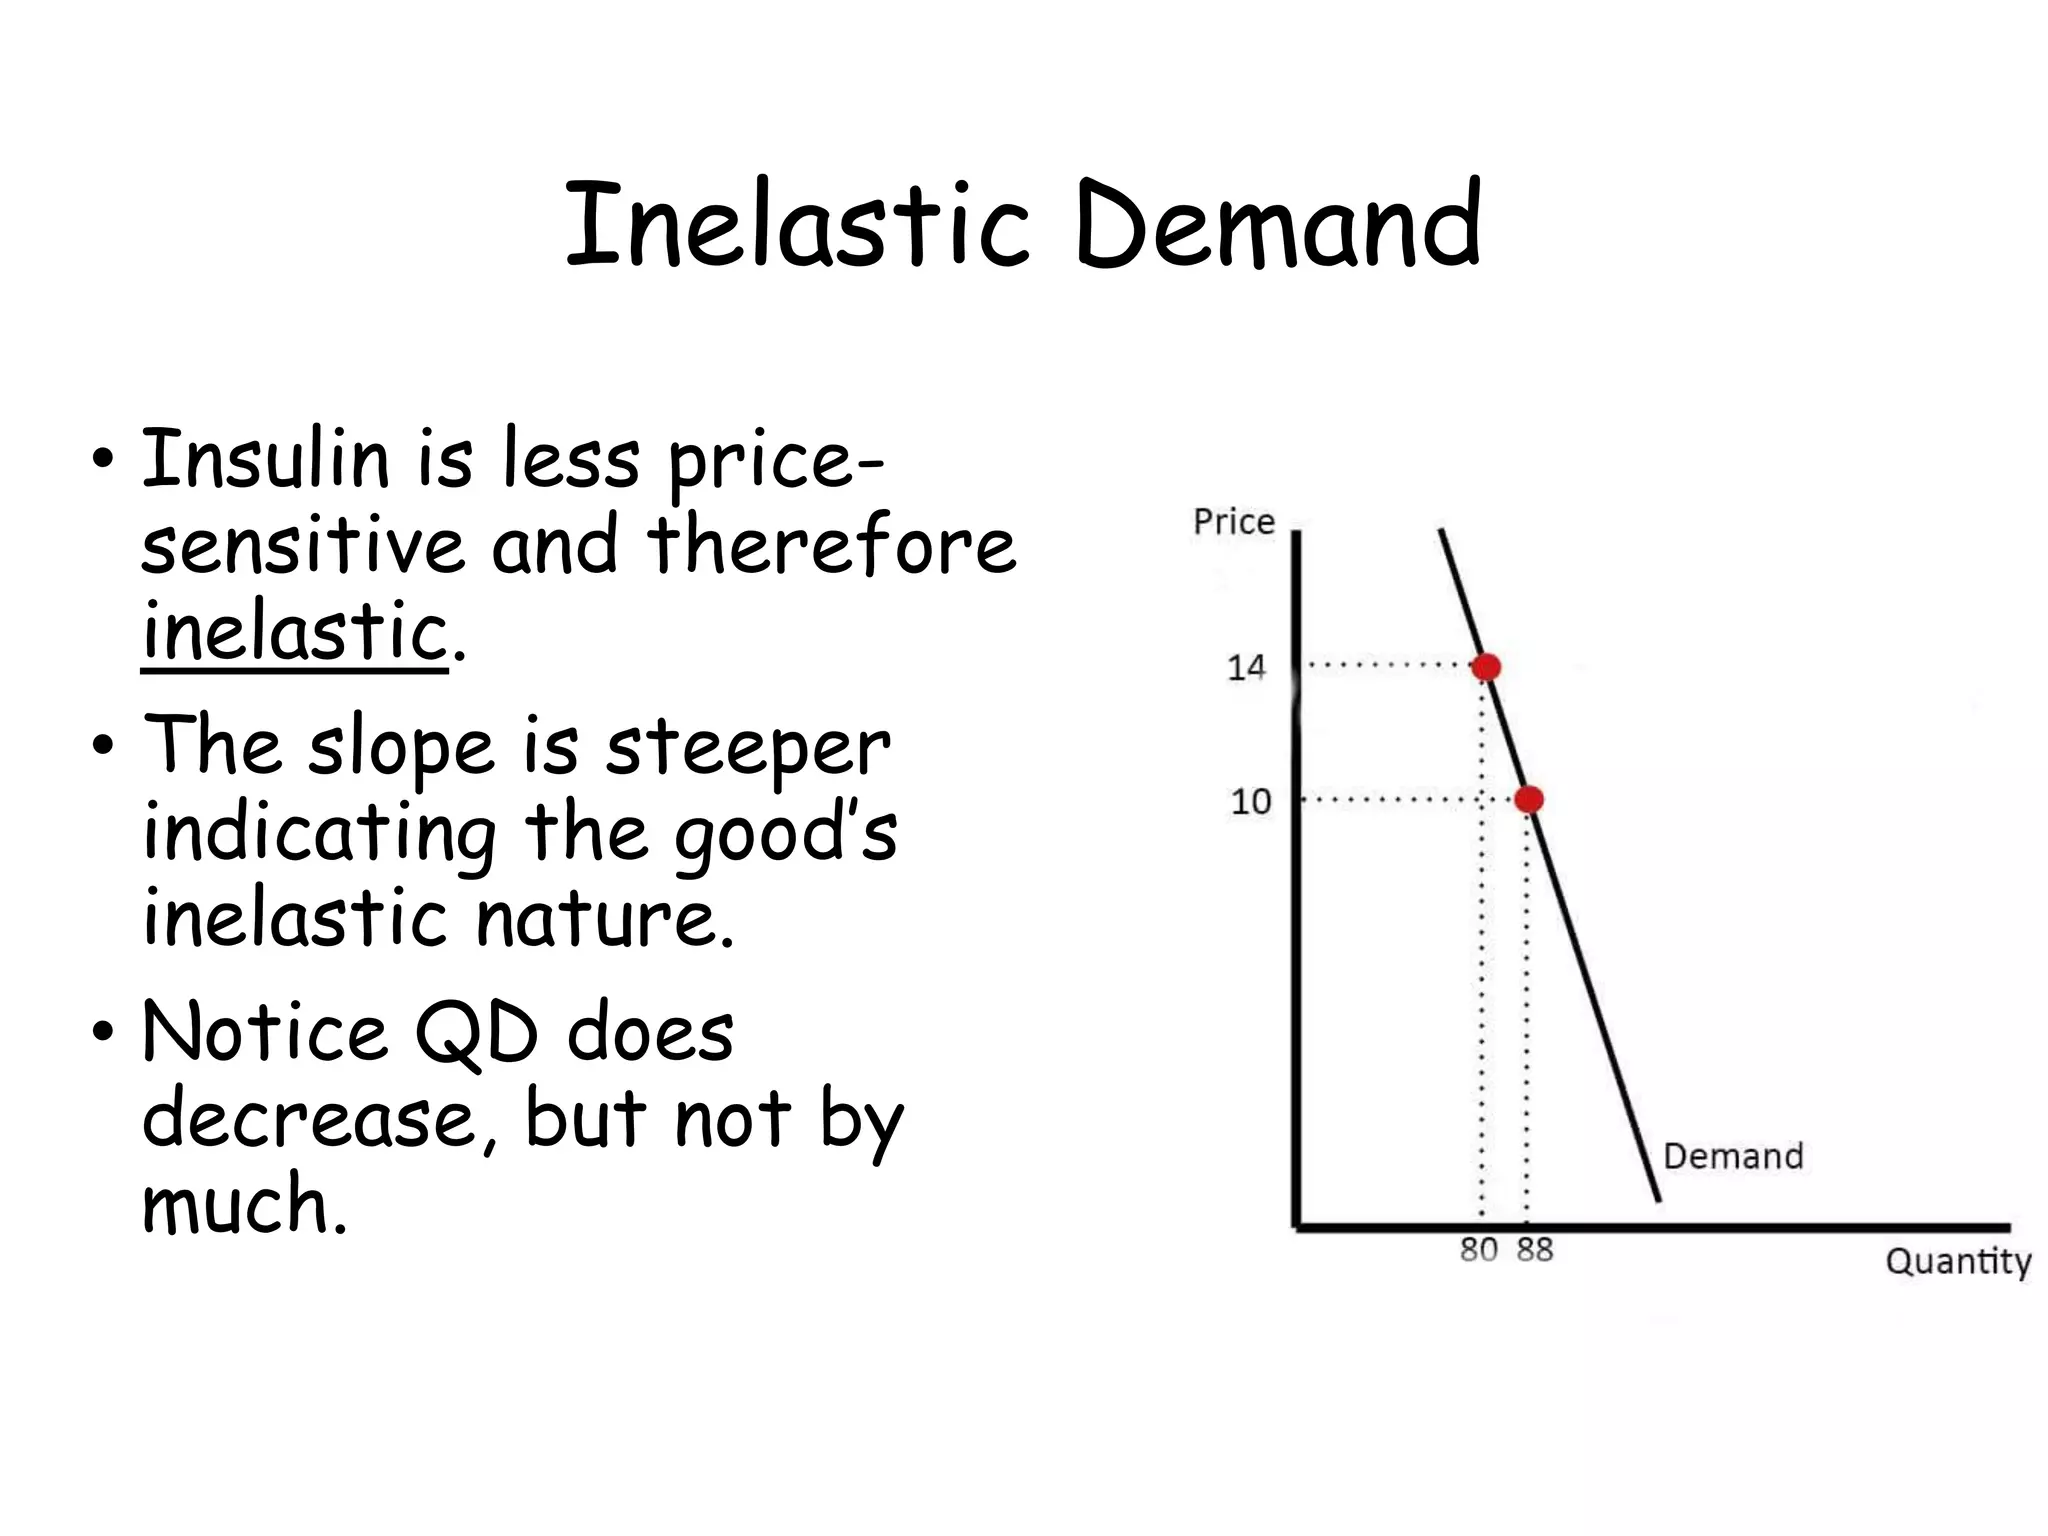
Inelastic Demand
• Insulinis less price-
sensitive and therefore
inelastic.
• The slope is steeper
indicating the good’s
inelastic nature.
• Notice QD does
decrease, but not by
much.
107.
Unit Elastic Demand
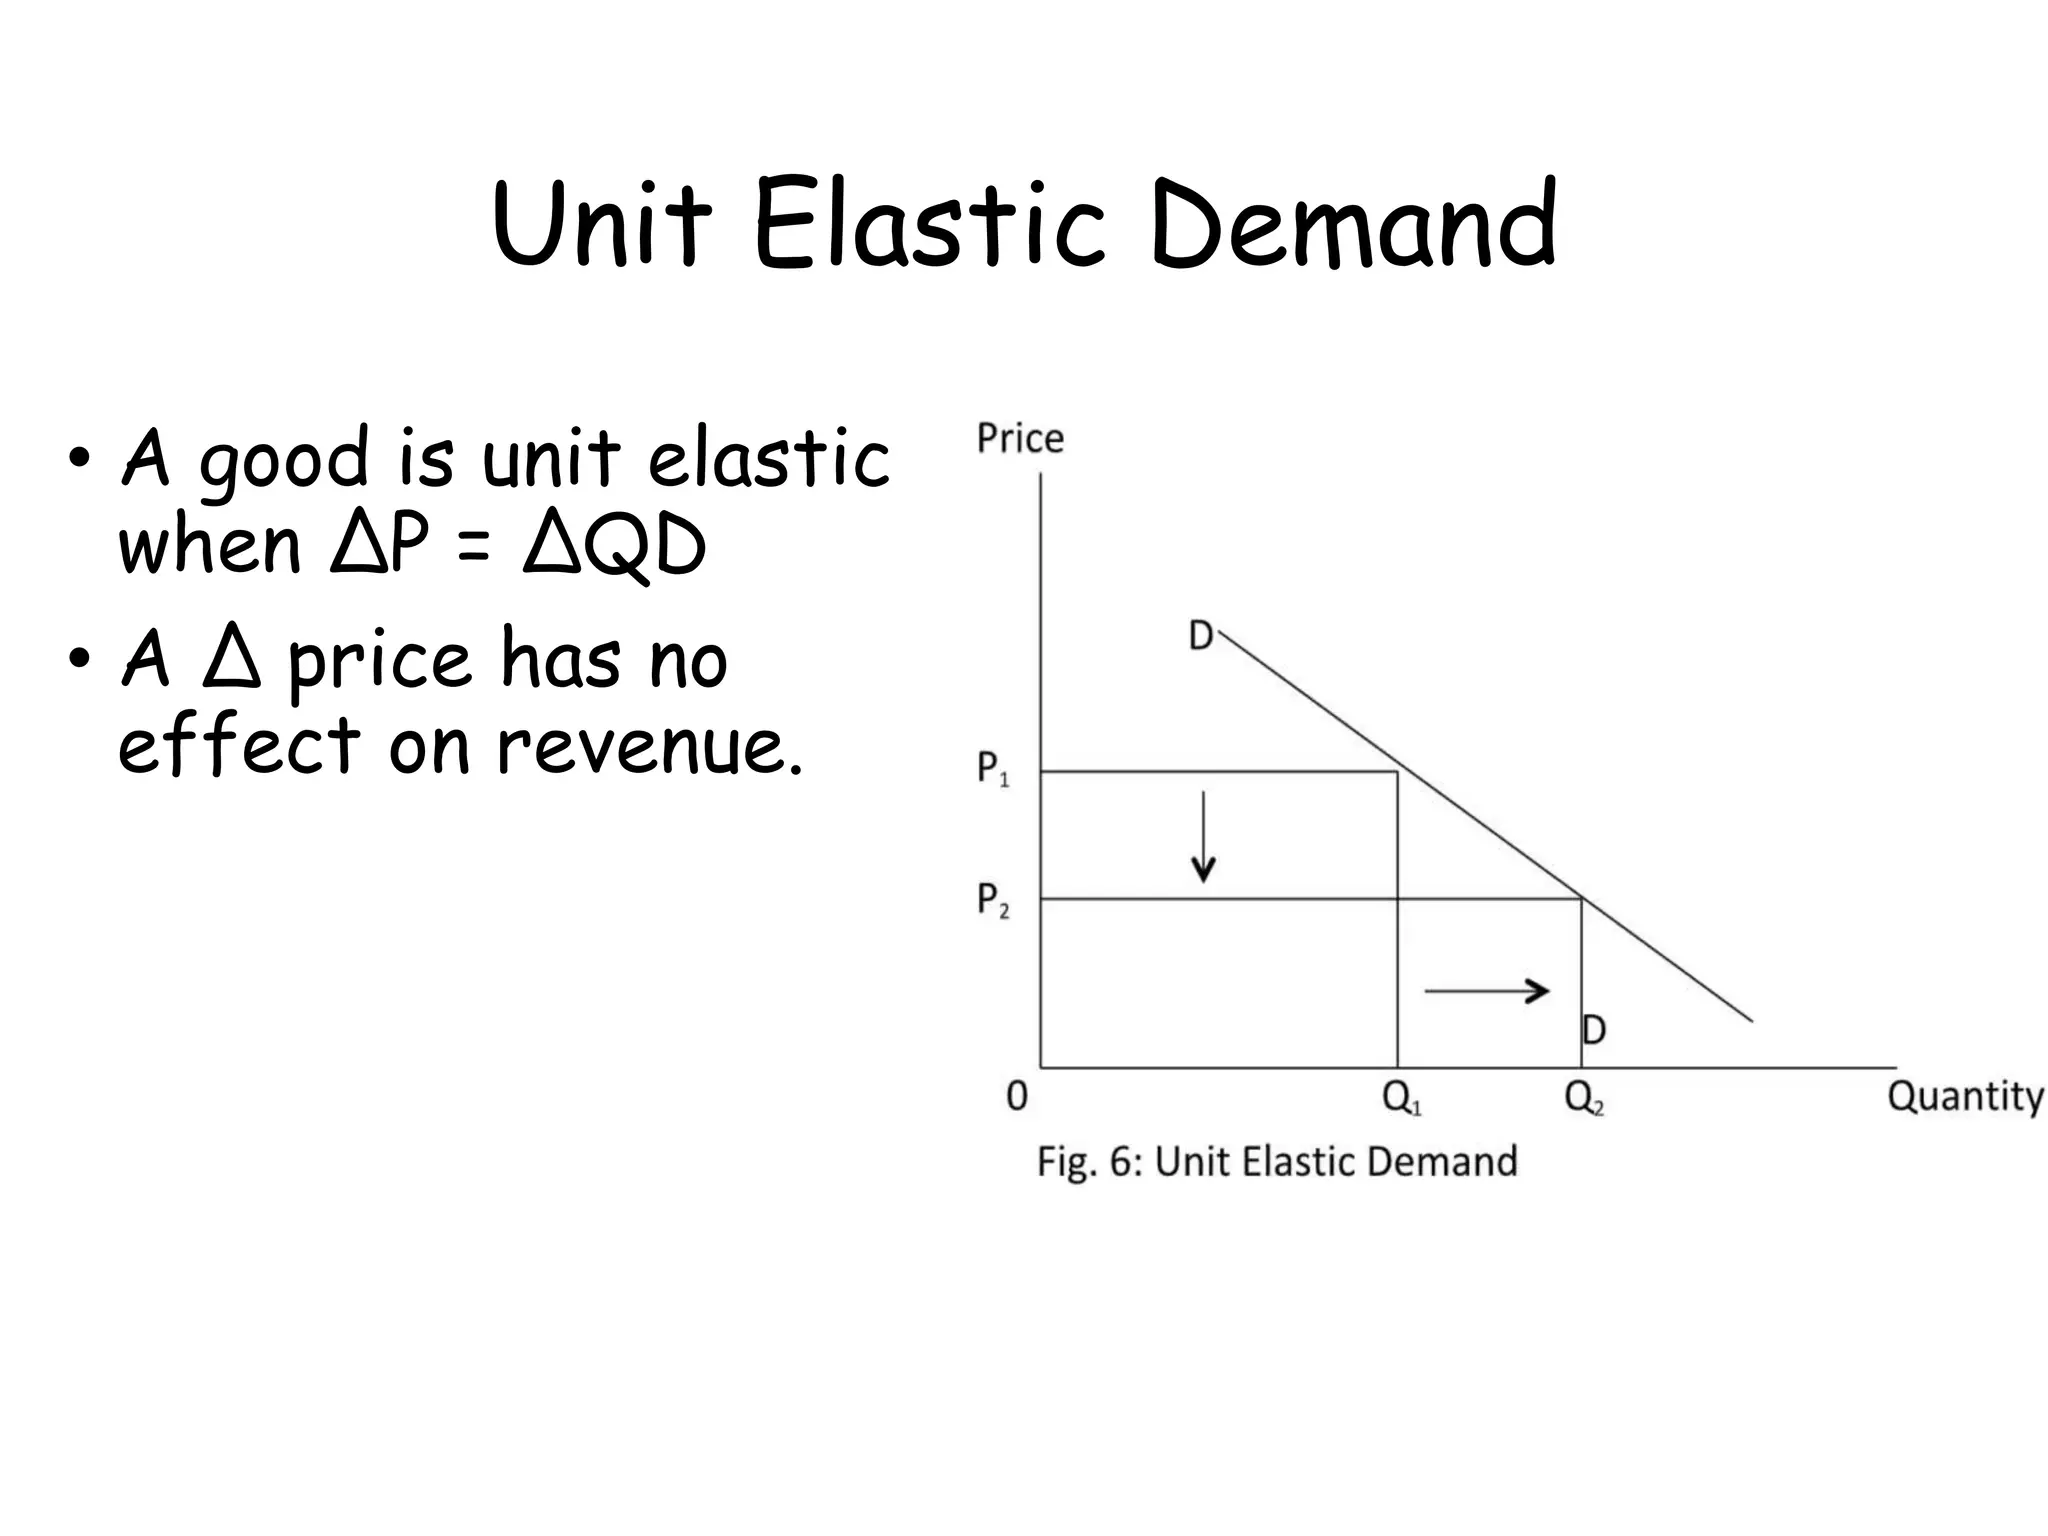
•A good is unit elastic
when ∆P = ∆QD
• A ∆ price has no
effect on revenue.
109.
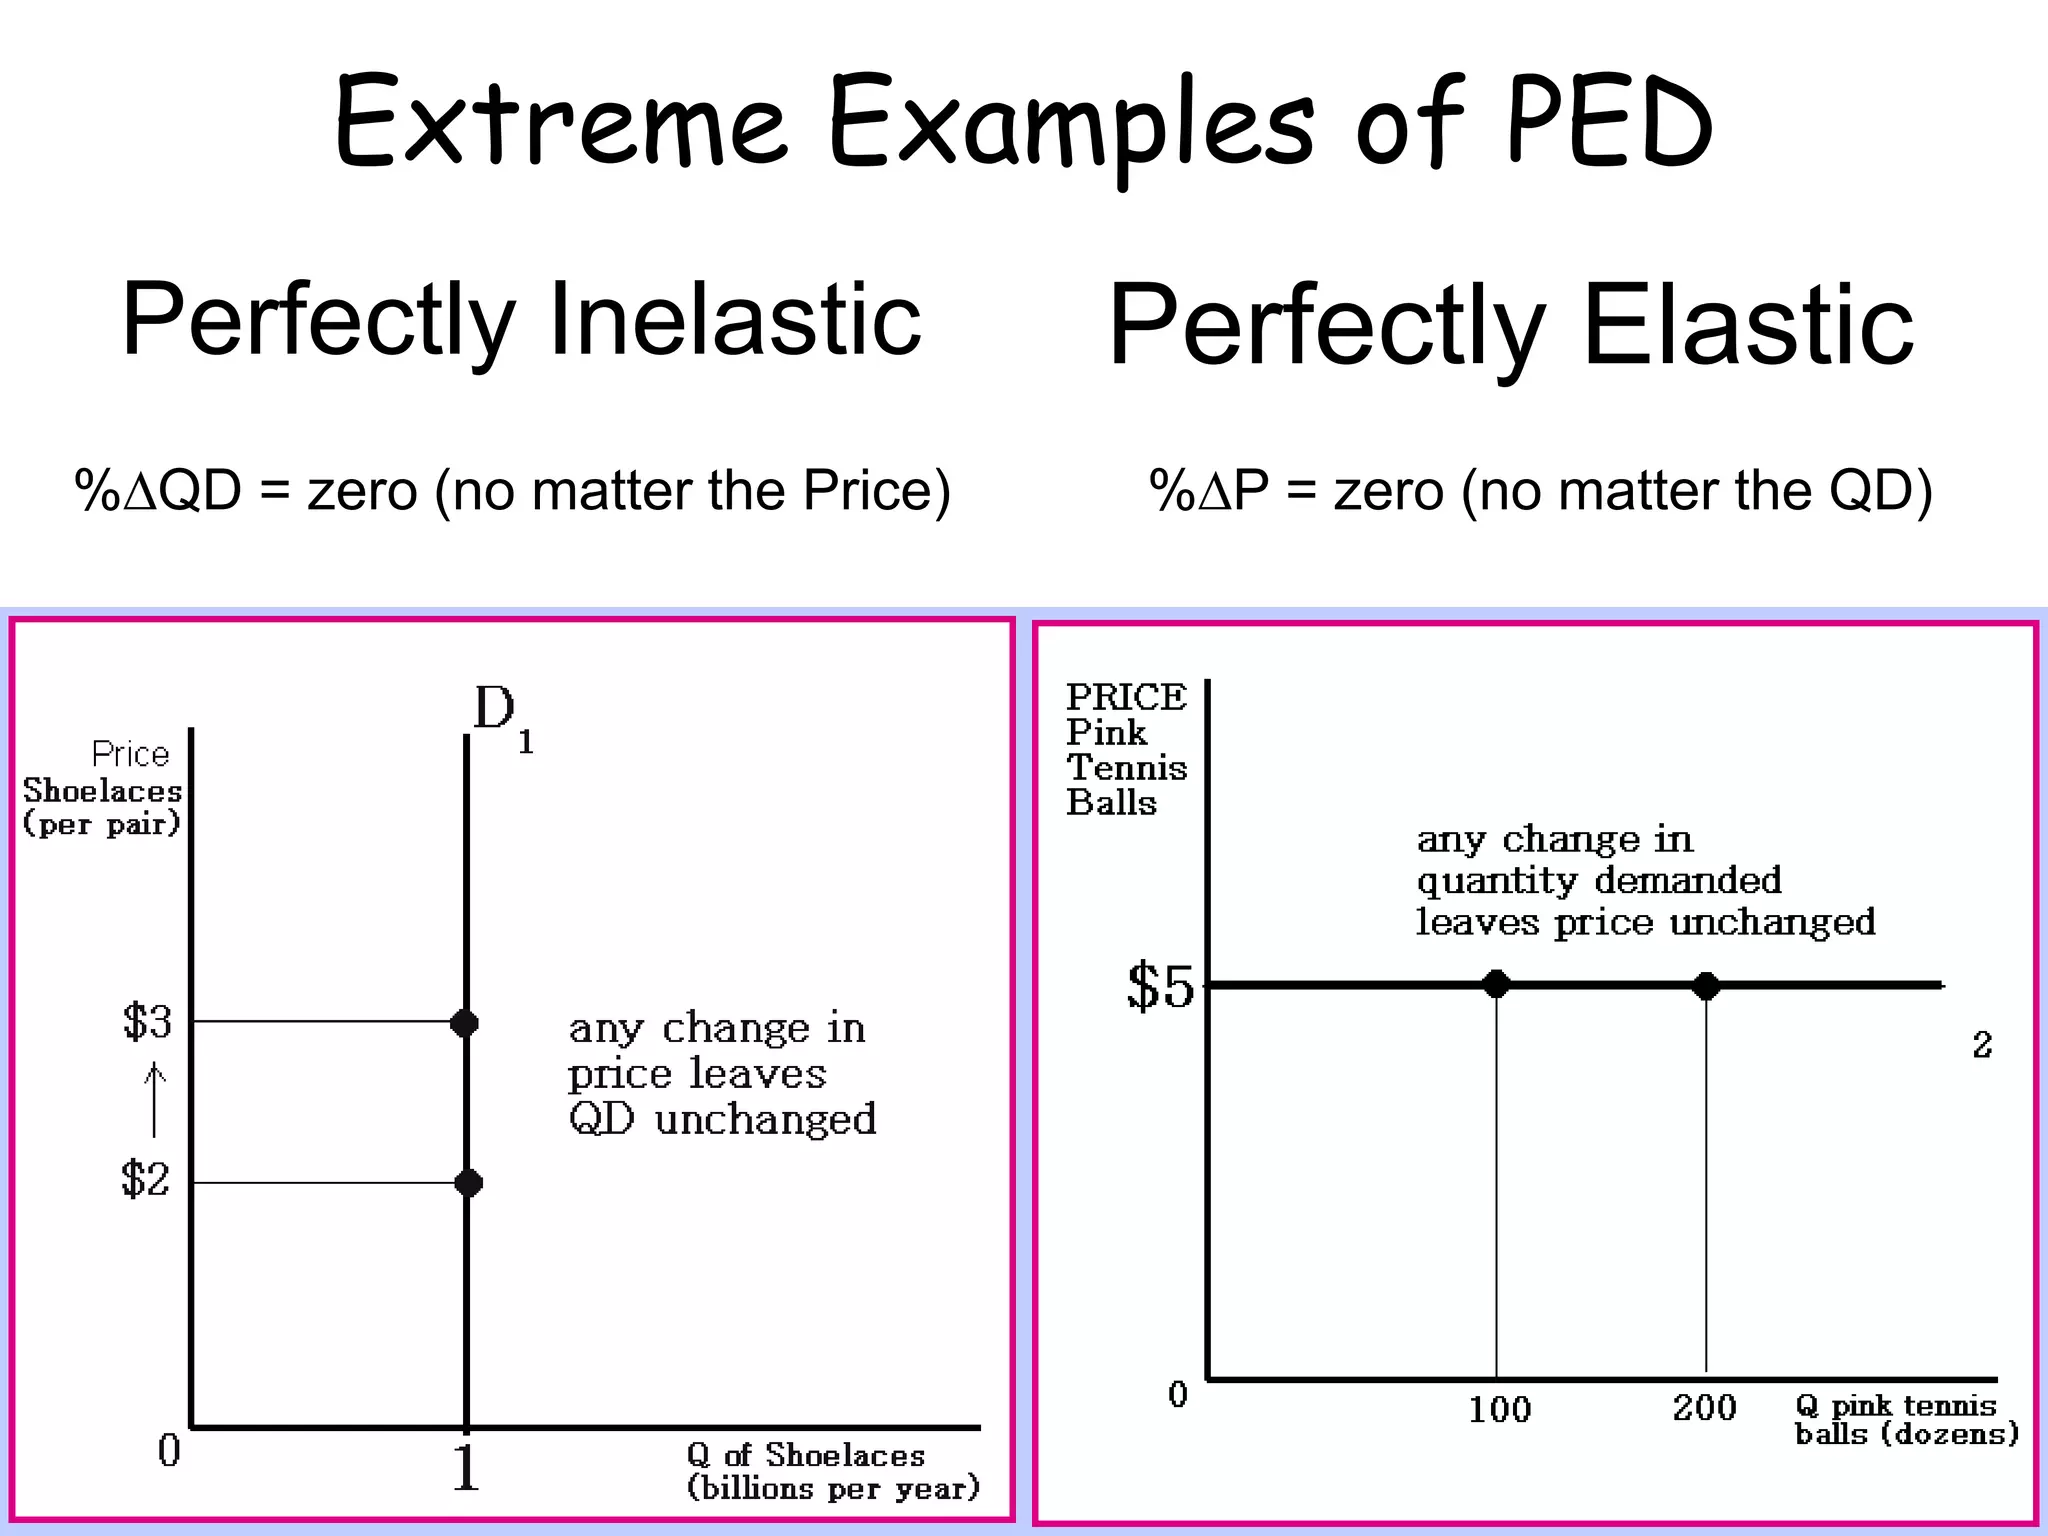
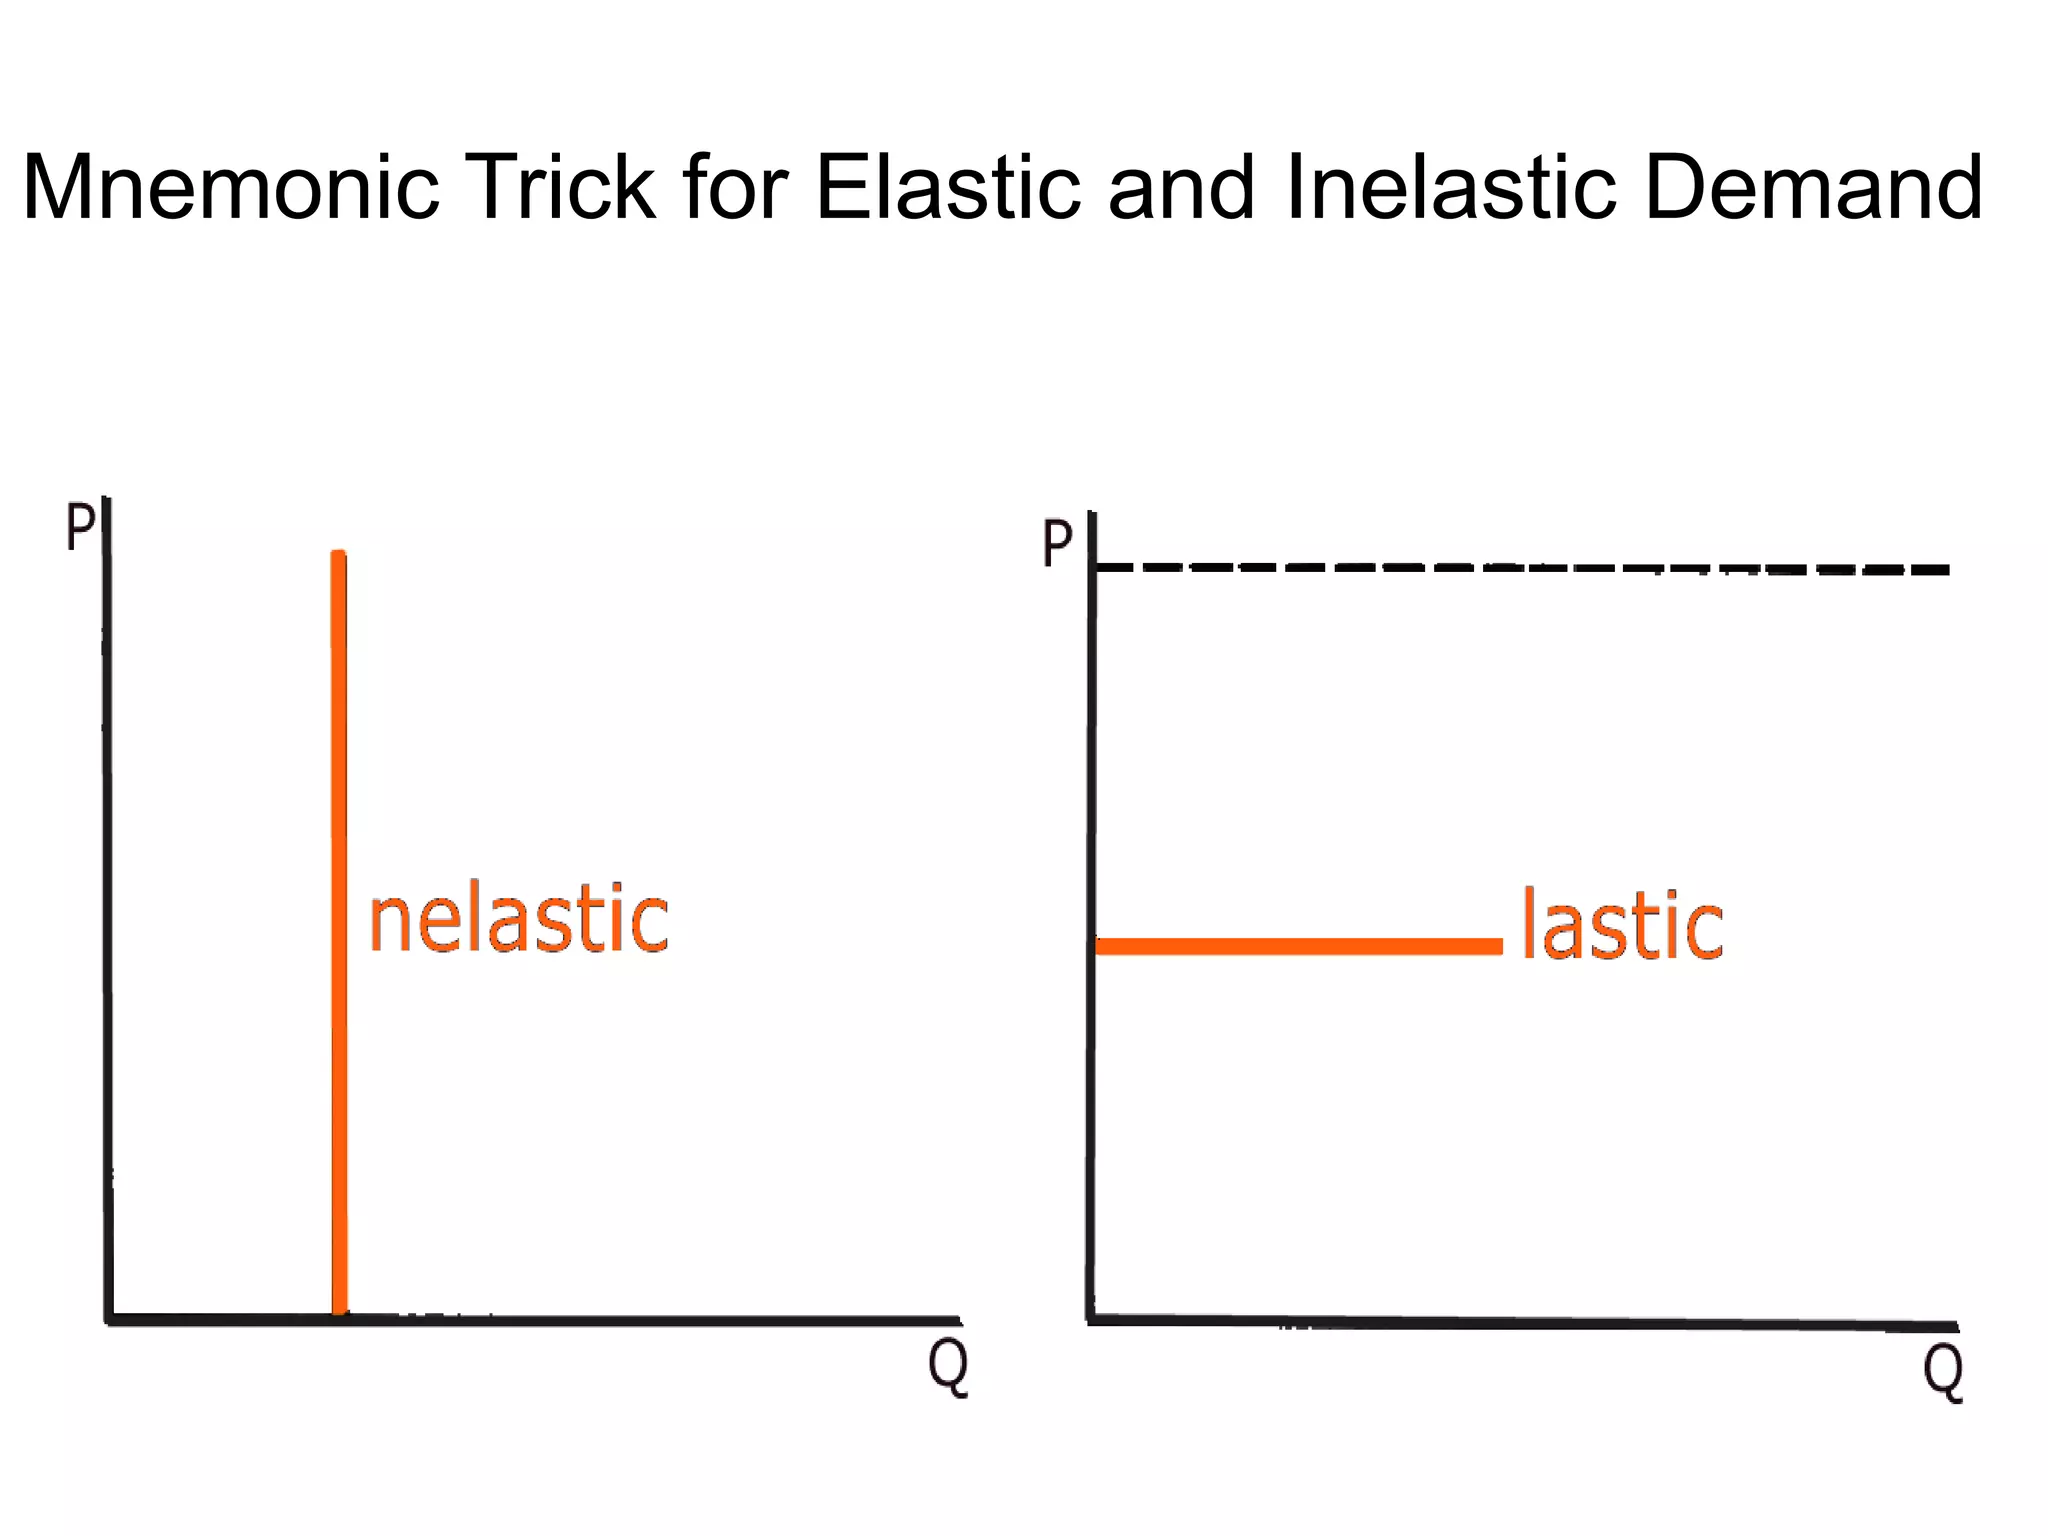
Extreme Examples ofPED
Perfectly Elastic
Perfectly Inelastic
%∆QD = zero (no matter the Price) %∆P = zero (no matter the QD)