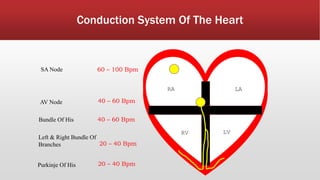
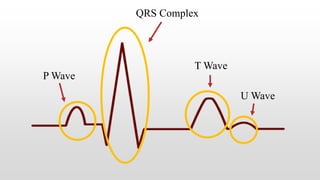
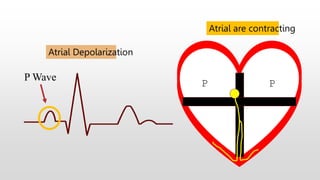
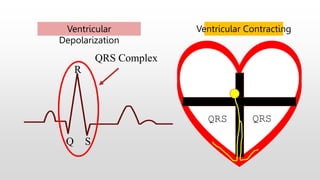
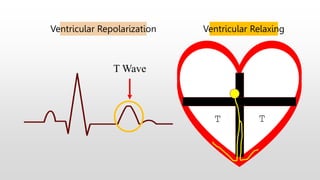
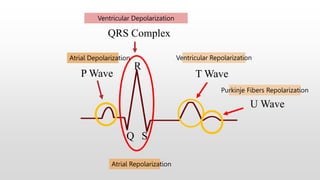
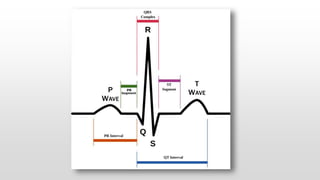
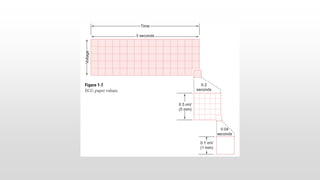
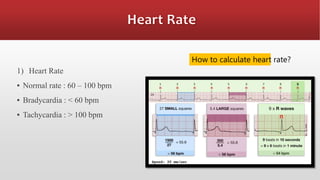
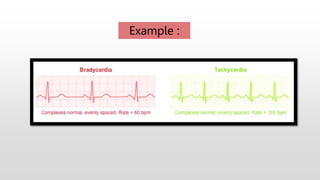
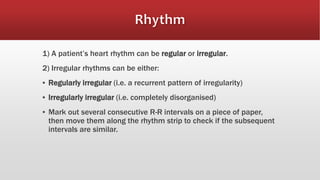
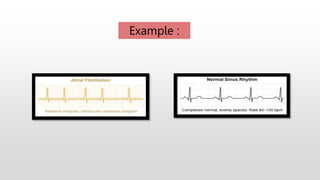
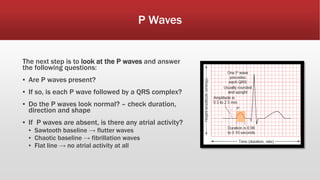
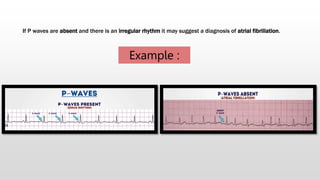
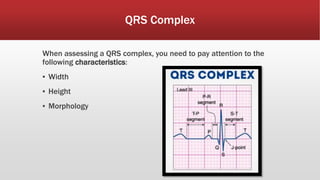
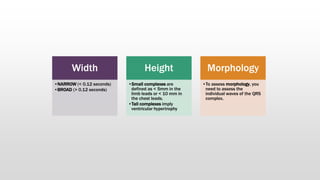
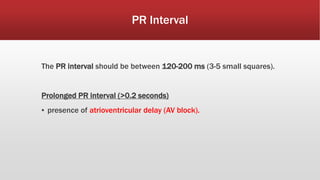
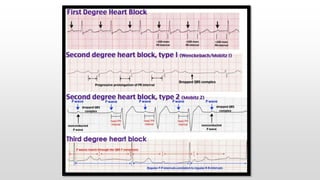
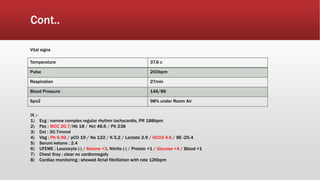
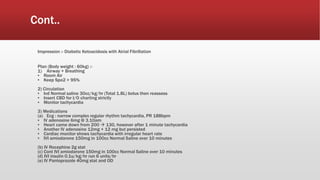
Result
Interpretation
ECG – NORMAL SINUS RYTHM
Conduction System Of The Heart
RA LA
RV LV
SA Node
AV Node
Bundle Of His
Left & Right Bundle Of
Branches
Purkinje Of His
60 – 100 Bpm
40 – 60 Bpm
40 – 60 Bpm
20 – 40 Bpm
20 – 40 Bpm
P Wave
QRS Complex
T Wave
U Wave
P Wave
Atrial Depolarization
P P
Atrial are contracting
Q S
R
Ventricular
Depolarization
QRS
Ventricular Contracting
QRS
QRS Complex
T Wave
T
Ventricular Relaxing
T
Ventricular Repolarization
Where is atrial repolarization?
Q S
R
QRS Complex
P Wave T Wave
Ventricular Repolarization
Ventricular Depolarization
Atrial Depolarization
Atrial Repolarization
U Wave
Purkinje Fibers Repolarization
8 Steps to Interpreting ECG
1) Heart Rate
▪ Normal rate : 60 – 100 bpm
▪ Bradycardia : < 60 bpm
▪ Tachycardia : > 100 bpm
How to calculate heart rate?
Example :
1) A patient’s heart rhythm can be regular or irregular.
2) Irregular rhythms can be either:
▪ Regularly irregular (i.e. a recurrent pattern of irregularity)
▪ Irregularly irregular (i.e. completely disorganised)
▪ Mark out several consecutive R-R intervals on a piece of paper,
then move them along the rhythm strip to check if the subsequent
intervals are similar.
Example :
P Waves
The next step is to look at the P waves and answer
the following questions:
▪ Are P waves present?
▪ If so, is each P wave followed by a QRS complex?
▪ Do the P waves look normal? – check duration,
direction and shape
▪ If P waves are absent, is there any atrial activity?
▪ Sawtooth baseline → flutter waves
▪ Chaotic baseline → fibrillation waves
▪ Flat line → no atrial activity at all
If P waves are absent and there is an irregular rhythm it may suggest a diagnosis of atrial fibrillation.
Example :
QRS Complex
When assessing a QRS complex, you need to pay attention to the
following characteristics:
▪ Width
▪ Height
▪ Morphology
Width
•NARROW (< 0.12 seconds)
•BROAD (> 0.12 seconds)
Height
•Small complexes are
defined as < 5mm in the
limb leads or < 10 mm in
the chest leads.
•Tall complexes imply
ventricular hypertrophy
Morphology
•To assess morphology, you
need to assess the
individual waves of the QRS
complex.
PR Interval
The PR interval should be between 120-200 ms (3-5 small squares).
Prolonged PR interval (>0.2 seconds)
▪ presence of atrioventricular delay (AV block).
Shortened PR interval
If the PR interval is shortened, this can mean one of two things:
• Simply, the P wave is originating from somewhere closer to the AV node so the conduction
takes less time (the SA node is not in a fixed place and some people’s atria are smaller than others).
• The atrial impulse is getting to the ventricle by a faster shortcut instead of conducting slowly across
the atrial wall. This is an accessory pathway and can be associated with a delta wave
(see below which demonstrates an ECG of a patient with Wolff Parkinson White syndrome).
ST Segment
▪ Between the end of the S wave and the start of the T.
▪ In a healthy individual, it should be an isoelectric line (neither elevated nor
depressed).
ST-elevation
• ST-elevation is significant when it is greater than 1 mm (1 small square)
in 2 or more contiguous limb leads or >2mm in 2 or more chest leads.
• It is most commonly caused by acute full-thickness myocardial infarction.
ST depression
ST depression ≥ 0.5 mm in ≥ 2 contiguous leads indicates
myocardial ischaemia.
T Waves
Tall T waves
▪ T waves are considered tall if they are:
▪ > 5mm in the limb leads AND
▪ > 10mm in the chest leads (the same criteria as ‘small’ QRS complexes)
Tall T waves can be associated with:
▪ Hyperkalaemia (“tall tented T waves”)
▪ Hyperacute STEMI
Inverted T waves
T waves are normally inverted in V1 and inversion in lead III is a normal variant.
Inverted T waves in other leads are a nonspecific sign of a wide variety of conditions:
• Ischaemia
• Bundle branch blocks (V4-6 in LBBB and V1-V3 in RBBB)
• Pulmonary embolism
• Left ventricular hypertrophy (in the lateral leads)
• Hypertrophic cardiomyopathy (widespread)
Observe the distribution of the T wave inversion (e.g. anterior/lateral/posterior leads).
Biphasic T waves
Two peaks and can be indicative of ischaemia and hypokalaemia.
Flattened T waves
Are a non-specific sign, that may represent ischaemia or electrolyte imbalance.
U Waves
▪ U waves are not a common finding.
▪ The U wave is a > 0.5mm deflection after the T wave best seen in V2 or V3.
▪ These become larger the slower the bradycardia – classically U waves are seen in various
electrolyte imbalances, hypothermia and secondary to antiarrhythmic therapy (such as
digoxin, procainamide or amiodarone).
Case Study
51 years old, malay, female
U/L :-
1) Diabetic Melitus
▪ On OHA (Metformin)
▪ Not Compliance to medications
C/O :-
1) Fever x3/7
2) Vomitting x1/7
▪ Yesterday 1-2 episodes
Pt claim went to GP in the evening for fever, noted DXT @ GP 30mmol – discharged with OHA.
UPTRIAGE FROM YZ
O/E :-
Appearance : lethargic looking
Airway - patent, speaks in fully sentences
Breathing - spontaneously breathing, tachypnoiec : RR 27/min, equal air entry & chest rise, lungs clear
Circulation - dry looking, crt<2 sec, warm peripheries, good pulse volume, tachycardic : HR 200 bpm
Disability - GCS E4V5M6, pupil 3mm/3mm reactive bilaterally
Exposed - fully exposed and adequately cover
Cont..
Temperature 37.6 c
Pulse 200bpm
Respiration 27min
Blood Pressure 146/86
Spo2 98% under Room Air
Vital signs
IX :-
1) Ecg : narrow complex regular rhythm tachycardia, PR 188bpm
2) Fbc : WCC 20.7/Hb 18 / Hct 48.6 / Plt 238
3) Dxt : 30.7mmol
4) Vbg : Ph 6.99 / pCO 19 / Na 122 / K 5.2 / Lactate 2.9 / HCO3 4.6 / BE -25.4
5) Serum ketone : 2.4
6) UFEME : Leucocyte (-) / Ketone +3, Nitrite (-) / Protein +1 / Glucose +4 / Blood +1
7) Chest Xray : clear no cardiomegaly
8) Cardiac monitoring : showed Atrial fibrillation with rate 126bpm
Cont..
Impression :- Diabetic Ketoacidosis with Atrial Fibrillation
Plan (Body weight : 60kg) :-
1) Airway + Breathing
▪ Room Air
▪ Keep Spo2 > 95%
2) Circulation
▪ Ivd Normal saline 30cc/kg/hr (Total 1.8L) bolus then reassess
▪ Insert CBD for I/O charting strictly
▪ Monitor tachycardia
3) Medications
(a) Ecg : narrow complex regular rhythm tachycardia, PR 188bpm
▪ IV adenosine 6mg @ 3.10am
▪ Heart came down from 200  130, however after 1 minute tachycardia
▪ Another IV adenosine 12mg + 12 mg but persisted
▪ Cardiac monitor shows tachycardia with irregular heart rate
▪ IVI amiodarone 150mg in 100cc Normal Saline over 10 minutes
(b) IV Rocephine 2g stat
(c) Cont IVI amiodarone 150mg in 100cc Normal Saline over 10 minutes
(d) IVI insulin 0.1u/kg/hr run 6 units/hr
(e) IV Pantoprazole 40mg stat and OD
Cont..
4) Investigation
▪ Blood C & S to lab
▪ RP, LFT , CRP to lab
▪ Repeat blood gas after bolus
▪ Repeat ECG after completion of IVI Amiodarone
5) Others
▪ Hourly DXT monitoring
▪ Vital sign monitoring
6) Disposition
▪ Medical
# To transfer out once patient is stabilised.

ECG CME NURUL.pptx

  • 2.
  • 3.
    Conduction System OfThe Heart RA LA RV LV SA Node AV Node Bundle Of His Left & Right Bundle Of Branches Purkinje Of His 60 – 100 Bpm 40 – 60 Bpm 40 – 60 Bpm 20 – 40 Bpm 20 – 40 Bpm
  • 4.
  • 5.
    P Wave Atrial Depolarization PP Atrial are contracting
  • 6.
  • 7.
  • 8.
    Where is atrialrepolarization?
  • 10.
    Q S R QRS Complex PWave T Wave Ventricular Repolarization Ventricular Depolarization Atrial Depolarization Atrial Repolarization U Wave Purkinje Fibers Repolarization
  • 13.
    8 Steps toInterpreting ECG
  • 14.
    1) Heart Rate ▪Normal rate : 60 – 100 bpm ▪ Bradycardia : < 60 bpm ▪ Tachycardia : > 100 bpm How to calculate heart rate?
  • 15.
  • 16.
    1) A patient’sheart rhythm can be regular or irregular. 2) Irregular rhythms can be either: ▪ Regularly irregular (i.e. a recurrent pattern of irregularity) ▪ Irregularly irregular (i.e. completely disorganised) ▪ Mark out several consecutive R-R intervals on a piece of paper, then move them along the rhythm strip to check if the subsequent intervals are similar.
  • 17.
  • 18.
    P Waves The nextstep is to look at the P waves and answer the following questions: ▪ Are P waves present? ▪ If so, is each P wave followed by a QRS complex? ▪ Do the P waves look normal? – check duration, direction and shape ▪ If P waves are absent, is there any atrial activity? ▪ Sawtooth baseline → flutter waves ▪ Chaotic baseline → fibrillation waves ▪ Flat line → no atrial activity at all
  • 19.
    If P wavesare absent and there is an irregular rhythm it may suggest a diagnosis of atrial fibrillation. Example :
  • 20.
    QRS Complex When assessinga QRS complex, you need to pay attention to the following characteristics: ▪ Width ▪ Height ▪ Morphology
  • 21.
    Width •NARROW (< 0.12seconds) •BROAD (> 0.12 seconds) Height •Small complexes are defined as < 5mm in the limb leads or < 10 mm in the chest leads. •Tall complexes imply ventricular hypertrophy Morphology •To assess morphology, you need to assess the individual waves of the QRS complex.
  • 22.
    PR Interval The PRinterval should be between 120-200 ms (3-5 small squares). Prolonged PR interval (>0.2 seconds) ▪ presence of atrioventricular delay (AV block).
  • 24.
    Shortened PR interval Ifthe PR interval is shortened, this can mean one of two things: • Simply, the P wave is originating from somewhere closer to the AV node so the conduction takes less time (the SA node is not in a fixed place and some people’s atria are smaller than others). • The atrial impulse is getting to the ventricle by a faster shortcut instead of conducting slowly across the atrial wall. This is an accessory pathway and can be associated with a delta wave (see below which demonstrates an ECG of a patient with Wolff Parkinson White syndrome).
  • 25.
    ST Segment ▪ Betweenthe end of the S wave and the start of the T. ▪ In a healthy individual, it should be an isoelectric line (neither elevated nor depressed).
  • 26.
    ST-elevation • ST-elevation issignificant when it is greater than 1 mm (1 small square) in 2 or more contiguous limb leads or >2mm in 2 or more chest leads. • It is most commonly caused by acute full-thickness myocardial infarction.
  • 27.
    ST depression ST depression≥ 0.5 mm in ≥ 2 contiguous leads indicates myocardial ischaemia.
  • 28.
    T Waves Tall Twaves ▪ T waves are considered tall if they are: ▪ > 5mm in the limb leads AND ▪ > 10mm in the chest leads (the same criteria as ‘small’ QRS complexes) Tall T waves can be associated with: ▪ Hyperkalaemia (“tall tented T waves”) ▪ Hyperacute STEMI
  • 30.
    Inverted T waves Twaves are normally inverted in V1 and inversion in lead III is a normal variant. Inverted T waves in other leads are a nonspecific sign of a wide variety of conditions: • Ischaemia • Bundle branch blocks (V4-6 in LBBB and V1-V3 in RBBB) • Pulmonary embolism • Left ventricular hypertrophy (in the lateral leads) • Hypertrophic cardiomyopathy (widespread) Observe the distribution of the T wave inversion (e.g. anterior/lateral/posterior leads).
  • 32.
    Biphasic T waves Twopeaks and can be indicative of ischaemia and hypokalaemia.
  • 33.
    Flattened T waves Area non-specific sign, that may represent ischaemia or electrolyte imbalance.
  • 34.
    U Waves ▪ Uwaves are not a common finding. ▪ The U wave is a > 0.5mm deflection after the T wave best seen in V2 or V3. ▪ These become larger the slower the bradycardia – classically U waves are seen in various electrolyte imbalances, hypothermia and secondary to antiarrhythmic therapy (such as digoxin, procainamide or amiodarone).
  • 35.
    Case Study 51 yearsold, malay, female U/L :- 1) Diabetic Melitus ▪ On OHA (Metformin) ▪ Not Compliance to medications C/O :- 1) Fever x3/7 2) Vomitting x1/7 ▪ Yesterday 1-2 episodes Pt claim went to GP in the evening for fever, noted DXT @ GP 30mmol – discharged with OHA. UPTRIAGE FROM YZ O/E :- Appearance : lethargic looking Airway - patent, speaks in fully sentences Breathing - spontaneously breathing, tachypnoiec : RR 27/min, equal air entry & chest rise, lungs clear Circulation - dry looking, crt<2 sec, warm peripheries, good pulse volume, tachycardic : HR 200 bpm Disability - GCS E4V5M6, pupil 3mm/3mm reactive bilaterally Exposed - fully exposed and adequately cover
  • 36.
    Cont.. Temperature 37.6 c Pulse200bpm Respiration 27min Blood Pressure 146/86 Spo2 98% under Room Air Vital signs IX :- 1) Ecg : narrow complex regular rhythm tachycardia, PR 188bpm 2) Fbc : WCC 20.7/Hb 18 / Hct 48.6 / Plt 238 3) Dxt : 30.7mmol 4) Vbg : Ph 6.99 / pCO 19 / Na 122 / K 5.2 / Lactate 2.9 / HCO3 4.6 / BE -25.4 5) Serum ketone : 2.4 6) UFEME : Leucocyte (-) / Ketone +3, Nitrite (-) / Protein +1 / Glucose +4 / Blood +1 7) Chest Xray : clear no cardiomegaly 8) Cardiac monitoring : showed Atrial fibrillation with rate 126bpm
  • 37.
    Cont.. Impression :- DiabeticKetoacidosis with Atrial Fibrillation Plan (Body weight : 60kg) :- 1) Airway + Breathing ▪ Room Air ▪ Keep Spo2 > 95% 2) Circulation ▪ Ivd Normal saline 30cc/kg/hr (Total 1.8L) bolus then reassess ▪ Insert CBD for I/O charting strictly ▪ Monitor tachycardia 3) Medications (a) Ecg : narrow complex regular rhythm tachycardia, PR 188bpm ▪ IV adenosine 6mg @ 3.10am ▪ Heart came down from 200  130, however after 1 minute tachycardia ▪ Another IV adenosine 12mg + 12 mg but persisted ▪ Cardiac monitor shows tachycardia with irregular heart rate ▪ IVI amiodarone 150mg in 100cc Normal Saline over 10 minutes (b) IV Rocephine 2g stat (c) Cont IVI amiodarone 150mg in 100cc Normal Saline over 10 minutes (d) IVI insulin 0.1u/kg/hr run 6 units/hr (e) IV Pantoprazole 40mg stat and OD
  • 38.
    Cont.. 4) Investigation ▪ BloodC & S to lab ▪ RP, LFT , CRP to lab ▪ Repeat blood gas after bolus ▪ Repeat ECG after completion of IVI Amiodarone 5) Others ▪ Hourly DXT monitoring ▪ Vital sign monitoring 6) Disposition ▪ Medical # To transfer out once patient is stabilised.