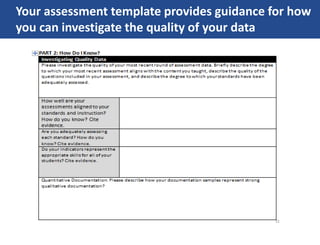
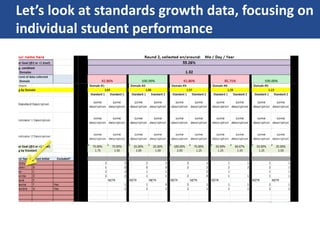
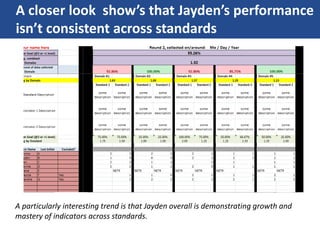
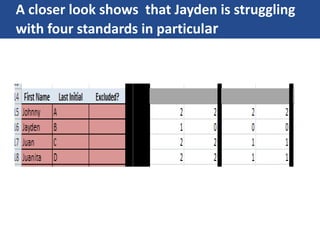
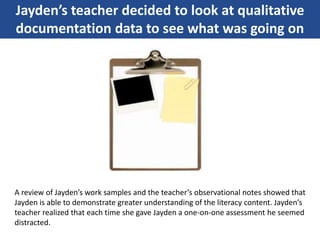
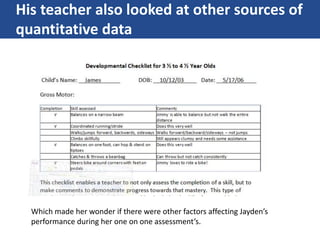
INVESTIGATING MID-YEAR DATA – STANDARDS GROWTH
The numbers in your trackers are more than just
numbers
They represent the
growth and
development of the
children you teach.
They represent people.
As you use these data it is incumbant on you to
think about what those numbers stand for
And as you act
upon those data it
is your obligation
to take ethical and
responsible
actions.
In addition to treating your data with care, mid-year is a great
time to step back and deepen your understanding of your data
How do you know your data are
signaling the right message?
Let’s keep looking at your standards growth data.
But where did these data come from?
To understand your data is to
understand the quality of
your assessment
A data literate early childhood teacher may ask…
How well is my
assessment aligned to
my standards and
instruction?
Only to find that…
Assessment questions
are aligned to the
standard, but not the
specific indicator you
are assessing…
Or
…not to full rigor of
the standard.
A data literate early childhood teacher may ask…
What is the overall
quality of my assessment
and it’s questions?
Only to find that…
A few standards have
been assessed
infrequently and my
children have not had
enough at-bats for a
reliable measure of
learning
A data-literate teacher uses
this information to improve
his future assessments, and
deepen his understanding of
the data in his tracker
Your assessment template provides guidance for how
you can investigate the quality of your data
If we are trying to discern if
our data are signaling the
right message, we probably
also want to look beyond our
trackers and assessments
Let’s look at standards growth data, focusing on
individual student performance
A closer look show’s that Jayden’s performance
isn’t consistent across standards
A particularly interesting trend is that Jayden overall is demonstrating growth and
mastery of indicators across standards.
What could be going on here?
A closer look shows that Jayden is struggling
with four standards in particular
Look’s like Jayden is
specifically struggling with
literacy related standards…
Or does it?
Jayden’s teacher decided to look at qualitative
documentation data to see what was going on
A review of Jayden’s work samples and the teacher’s observational notes showed that
Jayden is able to demonstrate greater understanding of the literacy content. Jayden’s
teacher realized that each time she gave Jayden a one-on-one assessment he seemed
distracted.
His teacher also looked at other sources of
quantitative data
Which made her wonder if there were other factors affecting Jayden’s
performance during her one on one assessment’s.
Jayden’s teacher decided to have a conference
with him the next day
During the conversation she
learned that Jayden didn’t like
literacy testing because he was
missing free play. He is so
worried about making sure that
he got to go to free play that he
answers as quickly as possible
to complete the assessment.
This is what we call triangulating data
Your tracker and formal assessment data are a great
start. However, data literate early childhood teachers
also look to other sources of quantitative and qualitative
data to understand what does the data mean, and to use
those findings to inform instructional responses.
Now that you can answer the
question how do I know? It’s
time to answer our next
question:
What needs to happen to
reach our goals by the end-of-
year?

ECE SGA 202 slideshare_1.3_v1.00

  • 1.
    INVESTIGATING MID-YEAR DATA– STANDARDS GROWTH
  • 2.
    The numbers inyour trackers are more than just numbers They represent the growth and development of the children you teach. They represent people.
  • 3.
    As you usethese data it is incumbant on you to think about what those numbers stand for And as you act upon those data it is your obligation to take ethical and responsible actions.
  • 4.
    In addition totreating your data with care, mid-year is a great time to step back and deepen your understanding of your data
  • 5.
    How do youknow your data are signaling the right message?
  • 6.
    Let’s keep lookingat your standards growth data. But where did these data come from?
  • 7.
    To understand yourdata is to understand the quality of your assessment
  • 8.
    A data literateearly childhood teacher may ask… How well is my assessment aligned to my standards and instruction?
  • 9.
    Only to findthat… Assessment questions are aligned to the standard, but not the specific indicator you are assessing… Or …not to full rigor of the standard.
  • 10.
    A data literateearly childhood teacher may ask… What is the overall quality of my assessment and it’s questions?
  • 11.
    Only to findthat… A few standards have been assessed infrequently and my children have not had enough at-bats for a reliable measure of learning
  • 12.
    A data-literate teacheruses this information to improve his future assessments, and deepen his understanding of the data in his tracker
  • 13.
    Your assessment templateprovides guidance for how you can investigate the quality of your data
  • 14.
    If we aretrying to discern if our data are signaling the right message, we probably also want to look beyond our trackers and assessments
  • 15.
    Let’s look atstandards growth data, focusing on individual student performance
  • 16.
    A closer lookshow’s that Jayden’s performance isn’t consistent across standards A particularly interesting trend is that Jayden overall is demonstrating growth and mastery of indicators across standards.
  • 17.
    What could begoing on here?
  • 18.
    A closer lookshows that Jayden is struggling with four standards in particular
  • 19.
    Look’s like Jaydenis specifically struggling with literacy related standards…
  • 20.
  • 21.
    Jayden’s teacher decidedto look at qualitative documentation data to see what was going on A review of Jayden’s work samples and the teacher’s observational notes showed that Jayden is able to demonstrate greater understanding of the literacy content. Jayden’s teacher realized that each time she gave Jayden a one-on-one assessment he seemed distracted.
  • 22.
    His teacher alsolooked at other sources of quantitative data Which made her wonder if there were other factors affecting Jayden’s performance during her one on one assessment’s.
  • 23.
    Jayden’s teacher decidedto have a conference with him the next day During the conversation she learned that Jayden didn’t like literacy testing because he was missing free play. He is so worried about making sure that he got to go to free play that he answers as quickly as possible to complete the assessment.
  • 24.
    This is whatwe call triangulating data Your tracker and formal assessment data are a great start. However, data literate early childhood teachers also look to other sources of quantitative and qualitative data to understand what does the data mean, and to use those findings to inform instructional responses.
  • 25.
    Now that youcan answer the question how do I know? It’s time to answer our next question: What needs to happen to reach our goals by the end-of- year?