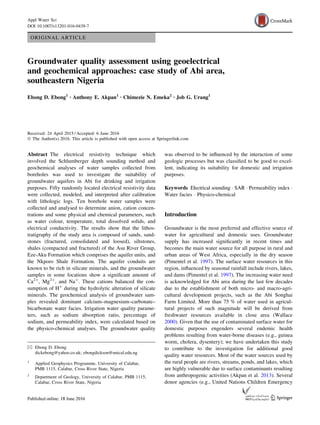
This study assesses the groundwater quality in Abi area, Southeastern Nigeria, using geoelectrical and geochemical methods to ensure its suitability for drinking and irrigation. Analysis reveals that the groundwater is of good to excellent quality, primarily composed of calcium-magnesium-carbonate-bicarbonate water facies, influenced by local geological processes. The findings emphasize the importance of routine groundwater quality assessments due to increasing water needs in the region resulting from agricultural and domestic demands.


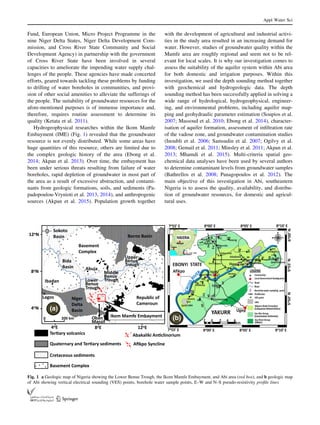

![formations present in the area (Figs. 1b, 6). The various
aquifer horizons and their vadose zone materials are rich in
silicate minerals, thus the groundwater captures the abun-
dant Ca2?
, Mg2?
and Na?
, which probably are fallouts
from calcite and silicate weathering processes (Holland
1978; Hem 1989). The concentration of potassium ion in
groundwater is low, perhaps, due to the resistance of
K-feldspathic-enriched rocks to weathering (Kolahchi and
Jalali 2006). Interactions of carbonate rocks with ground-
water (percolating and water circulating inside aquifers)
alter the chemistry of the groundwater system. Aquifer
water–rock interaction also occurs during other processes,
such as dolomitization, albitization of feldspars, and cation
exchange in clay minerals. Possible sources of such cation
concentrations in groundwater are calcite (CaCO3) and
dolomite (CaMg(CO3)2) in rocks and soils (Younger 2007).
Akpan et al. (2013) and Tijani (2004) have also reported
similar cases of increased concentration of these cations in
the other parts of the Mamfe Embayment and Benue
Trough, respectively. Other causes of elevated cation
concentration in groundwater include indiscriminate dis-
posal of industrial waste water and the application of soil
fertility enhancement chemicals, such as NPK [i.e., nitro-
gen (15 %), phosphorus (30 %), and potassium (55 %)];
composts, pesticides, herbicides, and soil fumigants. Such
chemicals are capable of passing through preferential
pathways in the vadose zone, especially, if the vadose zone
materials lack the capacity to naturally attenuate the ver-
tical flow of such contaminants (Akpan et al. 2014).
Variations in the concentrations of major anions: Cl-
,
HCO3
-
, NO3
2-
, NO2
2-
, SO4
2-
, and PO4
3-
were 0.5–37.5,
58.0–365.4, 0.02–0.49, 0.01–0.45, 13.0–190.0, and
0.1–9.0 mg/l (Table 3). The low concentrations of NO3
were attributed to the influence of denitrification prevalent
in the area (Akpan et al. 2014). Cl-
and HCO3
-
are the
most dominant ions, and their abundance is indicative of
the various salinization sources (Akpan et al. 2013).
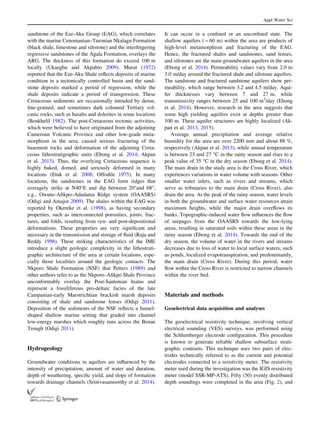
Drinking and irrigation water quality assessment
Water use for drinking and domestic purposes will depend
on hardness (Karanth 1987). Hardness of water could be
temporal due to the presence of carbonate and bicarbonate
and permanent, if sulphates and chlorides of calcium and
magnesium exist (Fig. 4). The high concentrations of cal-
cium and magnesium are traceable to the siltstones and
other calcic and dolomitic components present in the area
(Ebong et al. 2014; Haritash et al. 2008). Schroeder (1960)
reported that hard water can cause some heart diseases and
also requires more detergents to foam. The maximum
permissible limit of total hardness for drinking is 500 mg/l
and the WHO desirable limit is 100 mg/l. The TH classi-
fication based on Sawyer and McCartly (1967) showed that
BH1, BH4, and BH10 which constitute 30 % and BH5,
BH6, and BH8 (30 %) of the water are hard and moder-
ately hard, respectively. BH2, BH3, BH7, and BH9 (i.e.,
40 %) are soft (Table 3).
In general, groundwater considerations for irrigation
purposes depend on the effects of mineral constituents of
soils and plants (Ketata et al. 2011). Presence of excess
dissolved ions in irrigation water affects agricultural soils
and plants both physically and chemically, hence could
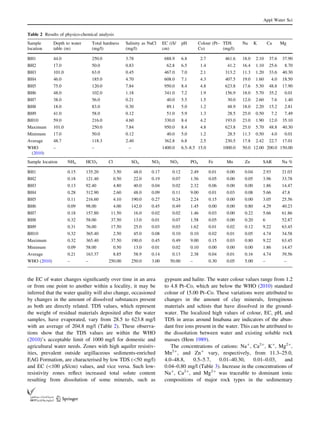
lead to low productivity. The suitability of groundwater
for any purpose will depend on the amount of TDS, which
should be below 500 mg/l (Freeze and Cherry 1979).
Excess sodium concentration in soils can change its
properties, thereby reducing its permeability (Todd and
Mays 2005). The SAR, which indicates the degree to
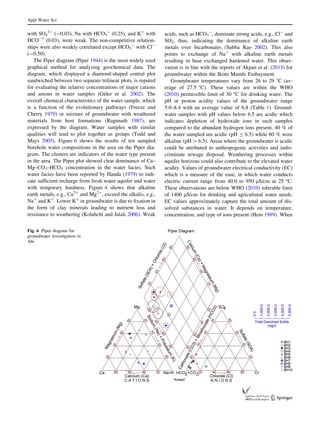
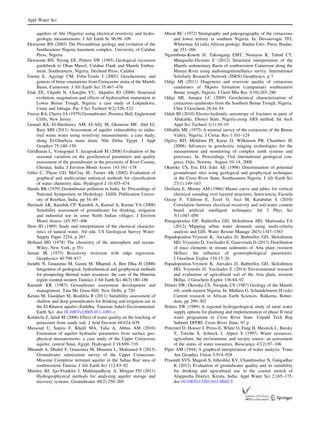
Table 3 Pearson’s correlation matrix of chemical constituents of groundwater in Abi aquifers
Na K Ca Mg NH4 HCO3 Cl SO4 NO2 NO3 PO4 Fe Mn Zn
Na 1.00
K 0.27 1.00
Ca 0.15 0.73 1.00
Mg 0.29 0.11 0.50 1.00
NH4 0.73 -0.13 -0.29 0.21 1.00
HCO3 0.53 0.37 0.17 0.57 0.48 1.00
Cl 0.43 0.28 0.14 0.03 0.63 0.08 1.00
SO4 0.37 0.92 0.80 0.29 -0.13 0.45 0.19 1.00
NO2 0.37 0.86 0.77 0.19 -0.16 0.34 0.13 0.87 1.00
NO3 0.43 0.90 0.67 0.15 -0.04 0.38 0.28 0.87 0.96 1.00
PO4 0.37 0.32 0.23 0.39 0.39 0.60 0.35 0.42 0.39 0.43 1.00
Fe 0.20 0.60 0.71 0.38 0.09 0.39 0.43 0.71 0.47 0.43 0.39 1.00
Mn 0.69 0.08 -0.11 0.31 0.68 0.65 0.35 0.24 0.19 0.27 0.81 0.16 1.00
Zn 0.37 0.74 0.39 -0.04 0.11 0.21 0.49 0.59 0.78 0.87 0.38 0.21 0.30 1.00
Appl Water Sci
123](https://image.slidesharecdn.com/ebonggroundwaterassessmentaws-170425210736/85/Ebong-groundwater-assessment-aws-13-320.jpg)
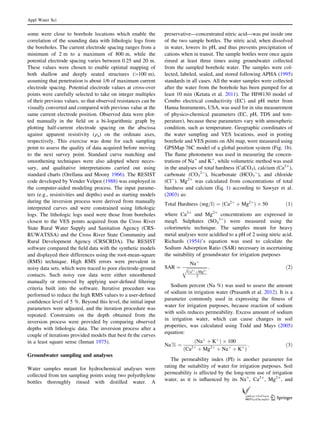
![Aku Group which serves as the aquifer unit having mod-
erate groundwater yields and the Nkporo Shale Formation.
These formations are known to be rich in silicate minerals
and groundwater from such aquifers show dominance in
Ca2?
, Mg2?
, and Na?
, suggested to have resulted from
silicate weathering processes. These cations balanced the
consumption of H?
during the hydrolytic alteration of
silicate minerals. The geochemical analysis of groundwater
samples revealed dominant calcium–magnesium–carbon-
ate–bicarbonate water facies. In general, water facies in the
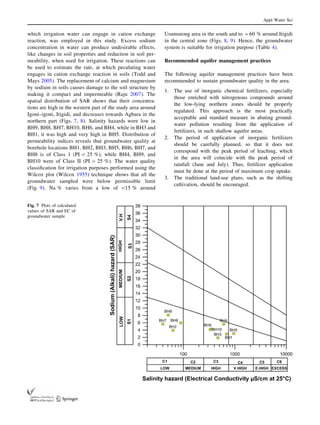
area are influenced by regional geology and showed three
distinct classes with amount of low-sodium (S1) and can be
used for irrigation with no risk of developing harmful
levels of exchangeable Na?
. Based on the salinity value
and the concentration of sodium, waters are classified as
follows: (1) Low salinity (C1) and low-sodium (S1) water
that can be used for irrigating most of the crops on
permeable soils that permits leaching. (2) High salinity
(C3) and low-sodium (S1) water, adequate for moderate
salt tolerance plants on soils with moderate permeability
leaching potentials. (3) Very high salinity (C4) and low-
sodium (S1) water which cannot be used on soils with
restricted drainage. The results of the physico-chemical
analyses of the groundwater when compared with standards
for drinking and agricultural water uses were found to be
good, since the results were below permissible limits. The
groundwater system was observed to be fresh and is,
consequently, suitable for domestic uses, drinking, and
irrigation purposes. Although this approach can provide
reliable results that can serve as the initial guide to the
distribution, availability, and quality of groundwater in the
area, it is limited due to paucity of hydrochemical data.
Acknowledgments The authors are thankful to the Cross River State
Rural Water Supply and Sanitation Agency (CRS-RUWATSSA) and
the Cross River State Community and Rural Development Agency
(CRSCRDA) for freely releasing the borehole data used in this study.
We also thank Dr. Ferid Dhahri and the other anonymous reviewers
for their constructive comments, suggestions and contributions, which
have greatly improved the quality of the original manuscript.
Open Access This article is distributed under the terms of the
Creative Commons Attribution 4.0 International License (http://
creativecommons.org/licenses/by/4.0/), which permits unrestricted
use, distribution, and reproduction in any medium, provided you give
appropriate credit to the original author(s) and the source, provide a
link to the Creative Commons license, and indicate if changes were
made.
References
Akpan AE, Ugbaja AN, George NJ (2013) Integrated geophysical,
geochemical and hydrogeological investigation of shallow
groundwater resources in parts of the Ikom-Mamfe Embayment
and the adjoining areas in Cross River State, Nigeria. J Environ
Earth Sci 70:1435–1456
Akpan AE, Ebong ED, Ekwok SE (2014) Assessment of the state of
soils, shallow sediments and groundwater salinity in Abi, Cross
River State, Nigeria. J Environ Earth Sci. doi:10.1007/s12665-
015-4014-6
Akpan AE, Ebong ED, Emeka CN (2015) Exploratory assessment of
groundwater vulnerability to pollution in Abi, southeastern
Nigeria using geophysical and geological techniques. J Environ
Monit Assess 187(4):4380. doi:10.1007/s10661-015-4380-2
APHA (1995) Standard methods for the examination of water and
waste water, 19th edn. American Public Health Association,
Washington, DC
Bathrellos GD, Skilodimou HD, Kelepertsis A, Alexakis D, Chrisan-
thaki I, Archonti D (2008) Environmental research of ground-
water in the urban and suburban areas of Attica region, Greece.
Environ Geol 56(1):11–18
Benkhelil J (1982) Benue trough and Benue chain. Geol Mag Niger
119:115–168
Douglas EB, Leo WN (1977) Hydrogeochemical relationships using
partial correlation coefficient. Water Resour Bull 13:843–846
Ebong ED, Akpan AE, Onwuegbuche AA (2014) Estimation of
geohydraulic parameters from fractured shales and sandstone
Fig. 9 Wilcox diagram irrigation water classification [After Wilcox
(1948)]
Table 4 Groundwater classification based on total hardness [after
Sawyer and McCartly 1967]
Total hardness
(TH) as
CaCO3 (mg/l)
Type of
water
Sample
numbers
Number
of samples
% of
samples
75 Soft BH2, BH3,
BH7, BH9
4 40
75–150 Moderately
hard
BH5, BH6, BH8 3 30
150–300 Hard BH1, BH4,
BH10
3 30
[300 Very hard – – –
Appl Water Sci
123](https://image.slidesharecdn.com/ebonggroundwaterassessmentaws-170425210736/85/Ebong-groundwater-assessment-aws-16-320.jpg)


![11.[40 51]correlates in groundwater quality parameters and textural classes o...](https://cdn.slidesharecdn.com/ss_thumbnails/11-40-51correlatesingroundwaterqualityparametersandtexturalclassesofsoilsinaperi-industrialdistrictofthenigeriandeltaregion-120512235818-phpapp02-thumbnail.jpg?width=640&height=640&fit=bounds)


