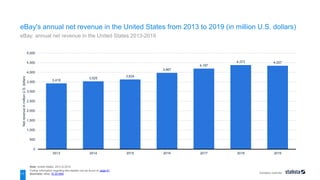
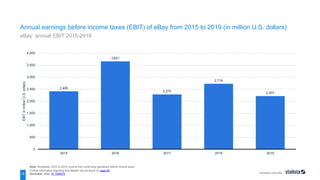
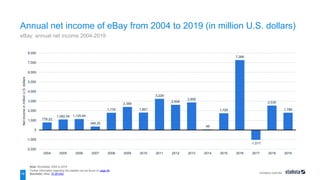
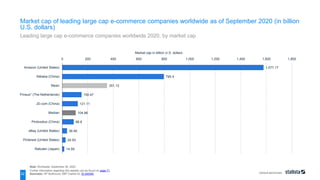
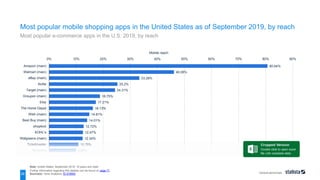
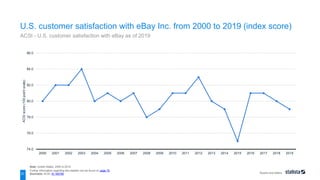
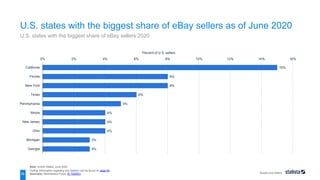
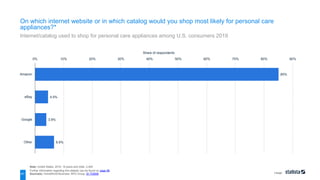
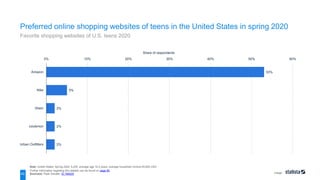
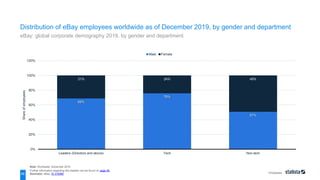
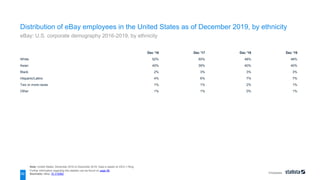
The document provides a comprehensive overview of eBay Inc., including its financial performance, global market positioning, and insights into online marketplace trends from 2013 to 2019. It details eBay's annual and quarterly revenues, gross merchandise volume, and user satisfaction metrics, highlighting its competitive landscape among leading online marketplaces. Additionally, it presents demographic information on eBay's workforce and customer preferences within the e-commerce sector.


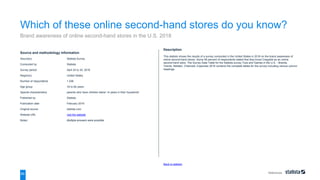
![Company overview
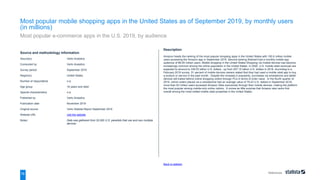
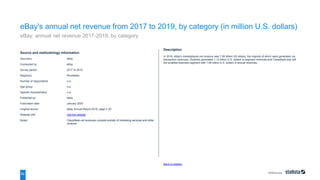
2017 2018 2019
Marketplace - net transaction revenues 6,809 7,416 7,578
Marketplace - marketing services and other revenues 1,192 1,225 1,060
[TOTAL] Marketplace 8,001 8,641 8,638
StubHub - net transaction revenues 1,011 1,068 1,057
StubHub - marketing services and other revenues 18 15 64
[TOTAL] StubHub 1,029 1,083 1,121
[TOTAL] Classifieds 897 1,022 1,061
Note: Worldwide; 2017 to 2019
Further information regarding this statistic can be found on page 62.
Source(s): eBay; ID 266196
12
eBay's annual net revenue from 2017 to 2019, by category (in million U.S. dollars)
eBay: annual net revenue 2017-2019, by category](https://image.slidesharecdn.com/studyid10988ebay-inc-statista-dossier-210202172535/85/ebay-inc-statistics-18-320.jpg)


![References
68
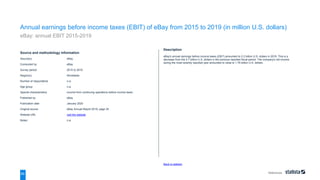
Source and methodology information
Source(s) eBay
Conducted by eBay
Survey period 2007 to 2019
Region(s) Worldwide
Number of respondents n.a.
Age group n.a.
Special characteristics n.a.
Published by eBay
Publication date January 2020
Original source eBay Annual Report 2019, page 41
Website URL visit the website
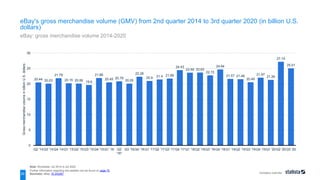
Notes: *Up until and including 2014, GMV excluded vehicle sales. As of 2016,
GMV includes "vehicles classifieds listings on Marketplace platforms".
During the first quarter of 2014, eBay revised their definition of GMV for
certain transactions to align more closely with their operating metrics.
2013 amount [...] For more information visit our Website
Back to statistic
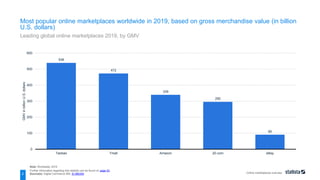
Description
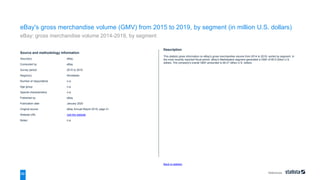
This statistic gives information on eBay's total gross merchandise volume from 2007 to 2019. In the most
recently reported fiscal year, the auction site's gross merchandising volume (GMV) amounted 90.21 billion U.S.
dollars, down from 94.58 billion U.S. dollars in the preceding year. The majority of GMV was generated via the
company's Marketplace segment.
eBay's gross merchandise volume (GMV) from 2007 to 2019 (in billion U.S. dollars)
eBay: gross merchandise volume 2007-2019](https://image.slidesharecdn.com/studyid10988ebay-inc-statista-dossier-210202172535/85/ebay-inc-statistics-74-320.jpg)