This document is the introduction to the 14th edition of the Global Innovation Index (GII) for 2021. It provides an overview of some of the key findings from this year's report, which analyzes global innovation performance and rankings for over 130 economies during the COVID-19 pandemic. While the pandemic has severely disrupted many economies, the innovative sectors have remained strong with continued growth in areas like R&D expenditures, scientific publications, intellectual property filings, and venture capital deals in 2020. The GII aims to help policymakers better understand how to create innovation-enabling policies and ecosystems to support translating new ideas into solutions to overcome challenges like the pandemic and build stronger economies. It has supported countries in improving their innovation over the


![11
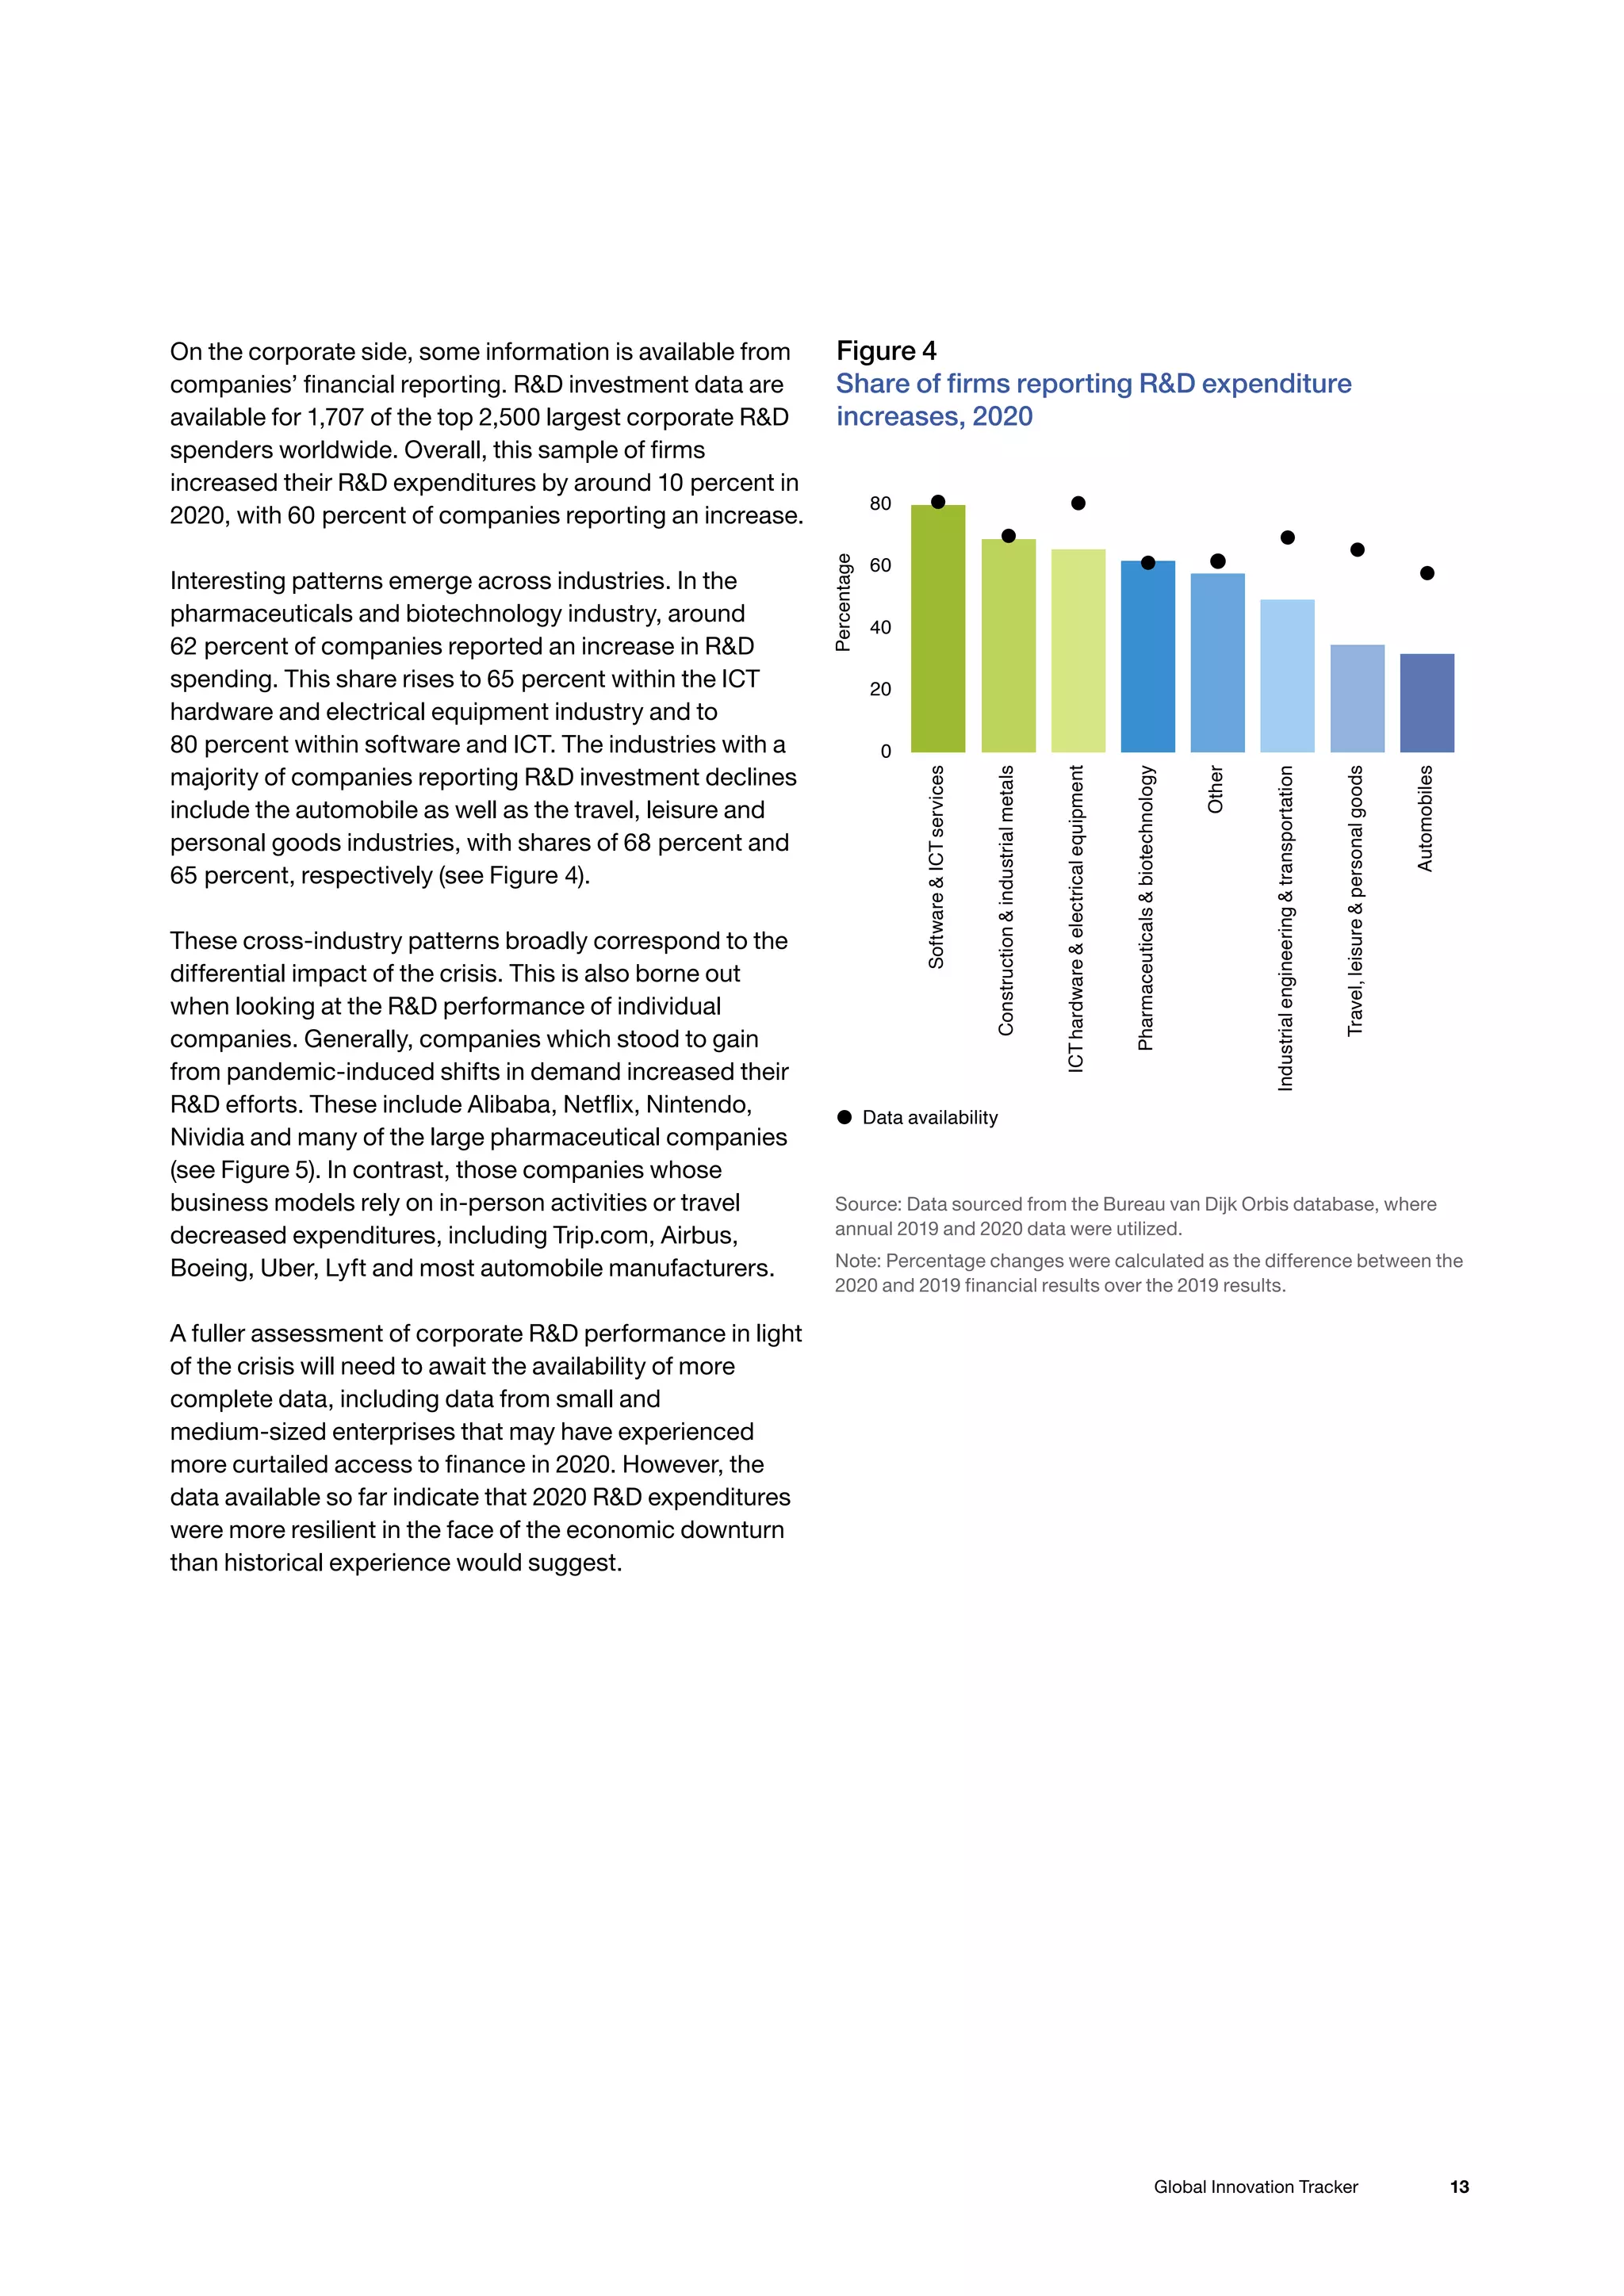
Global Innovation Tracker
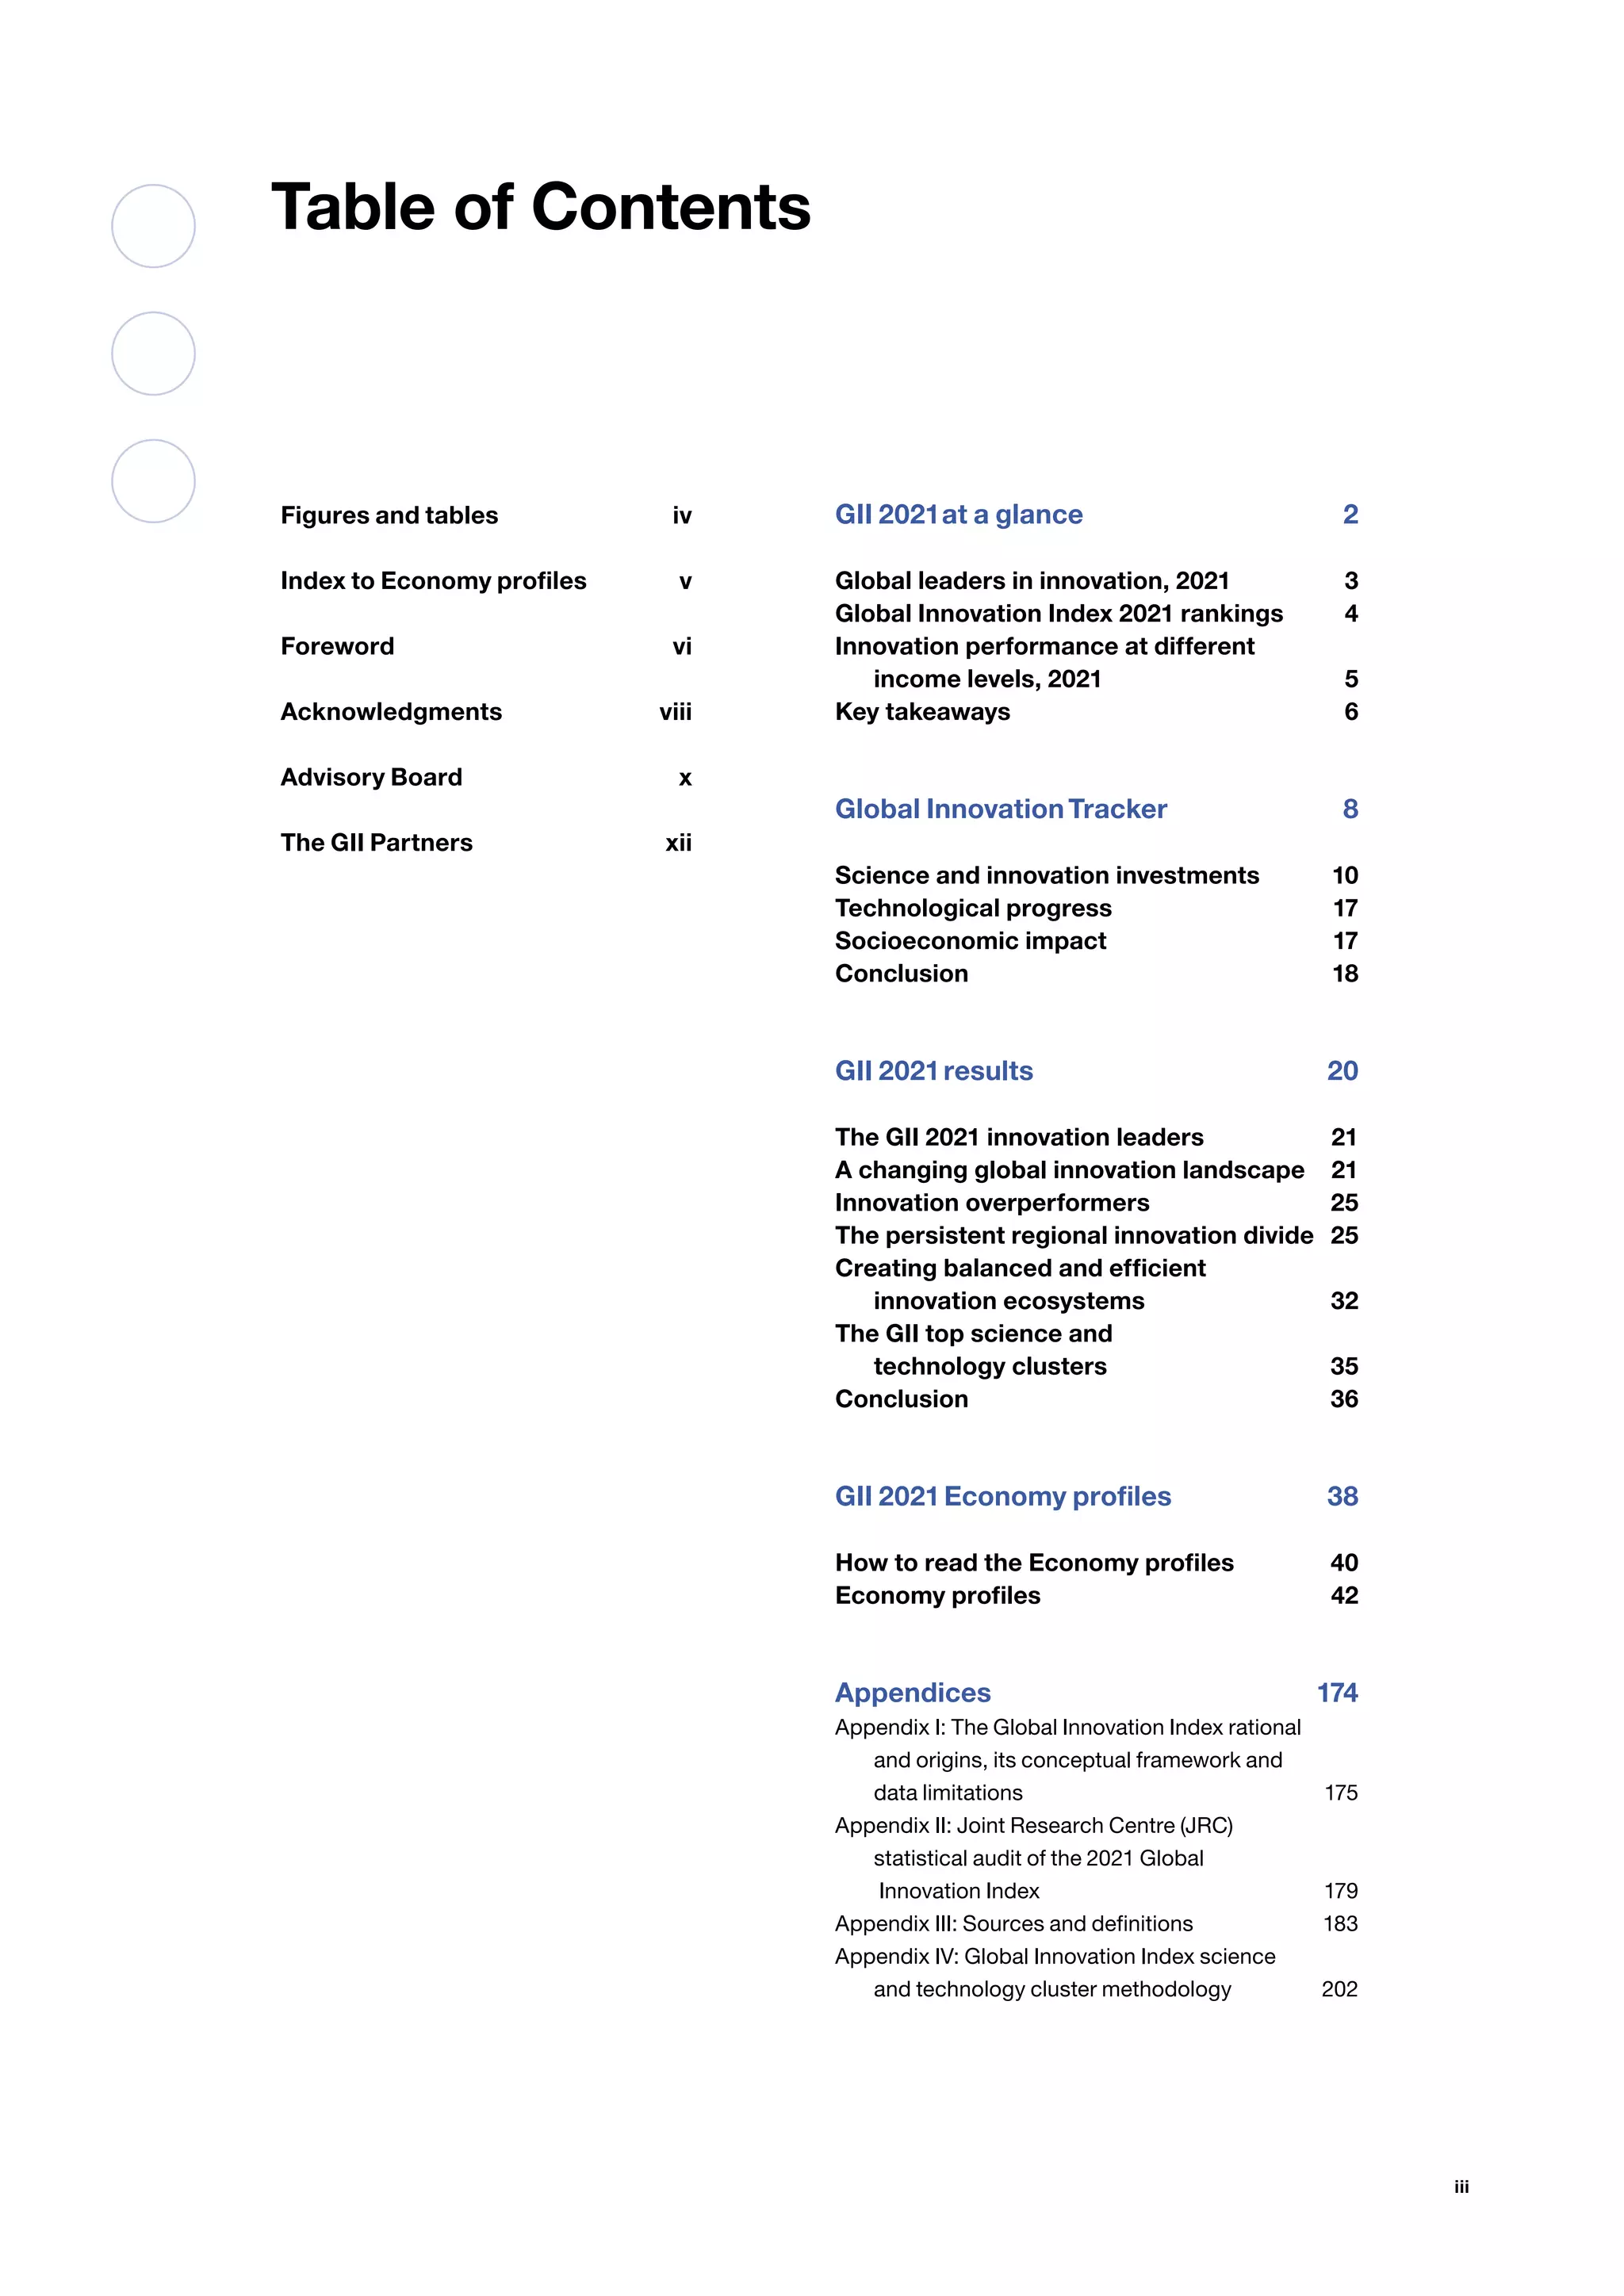
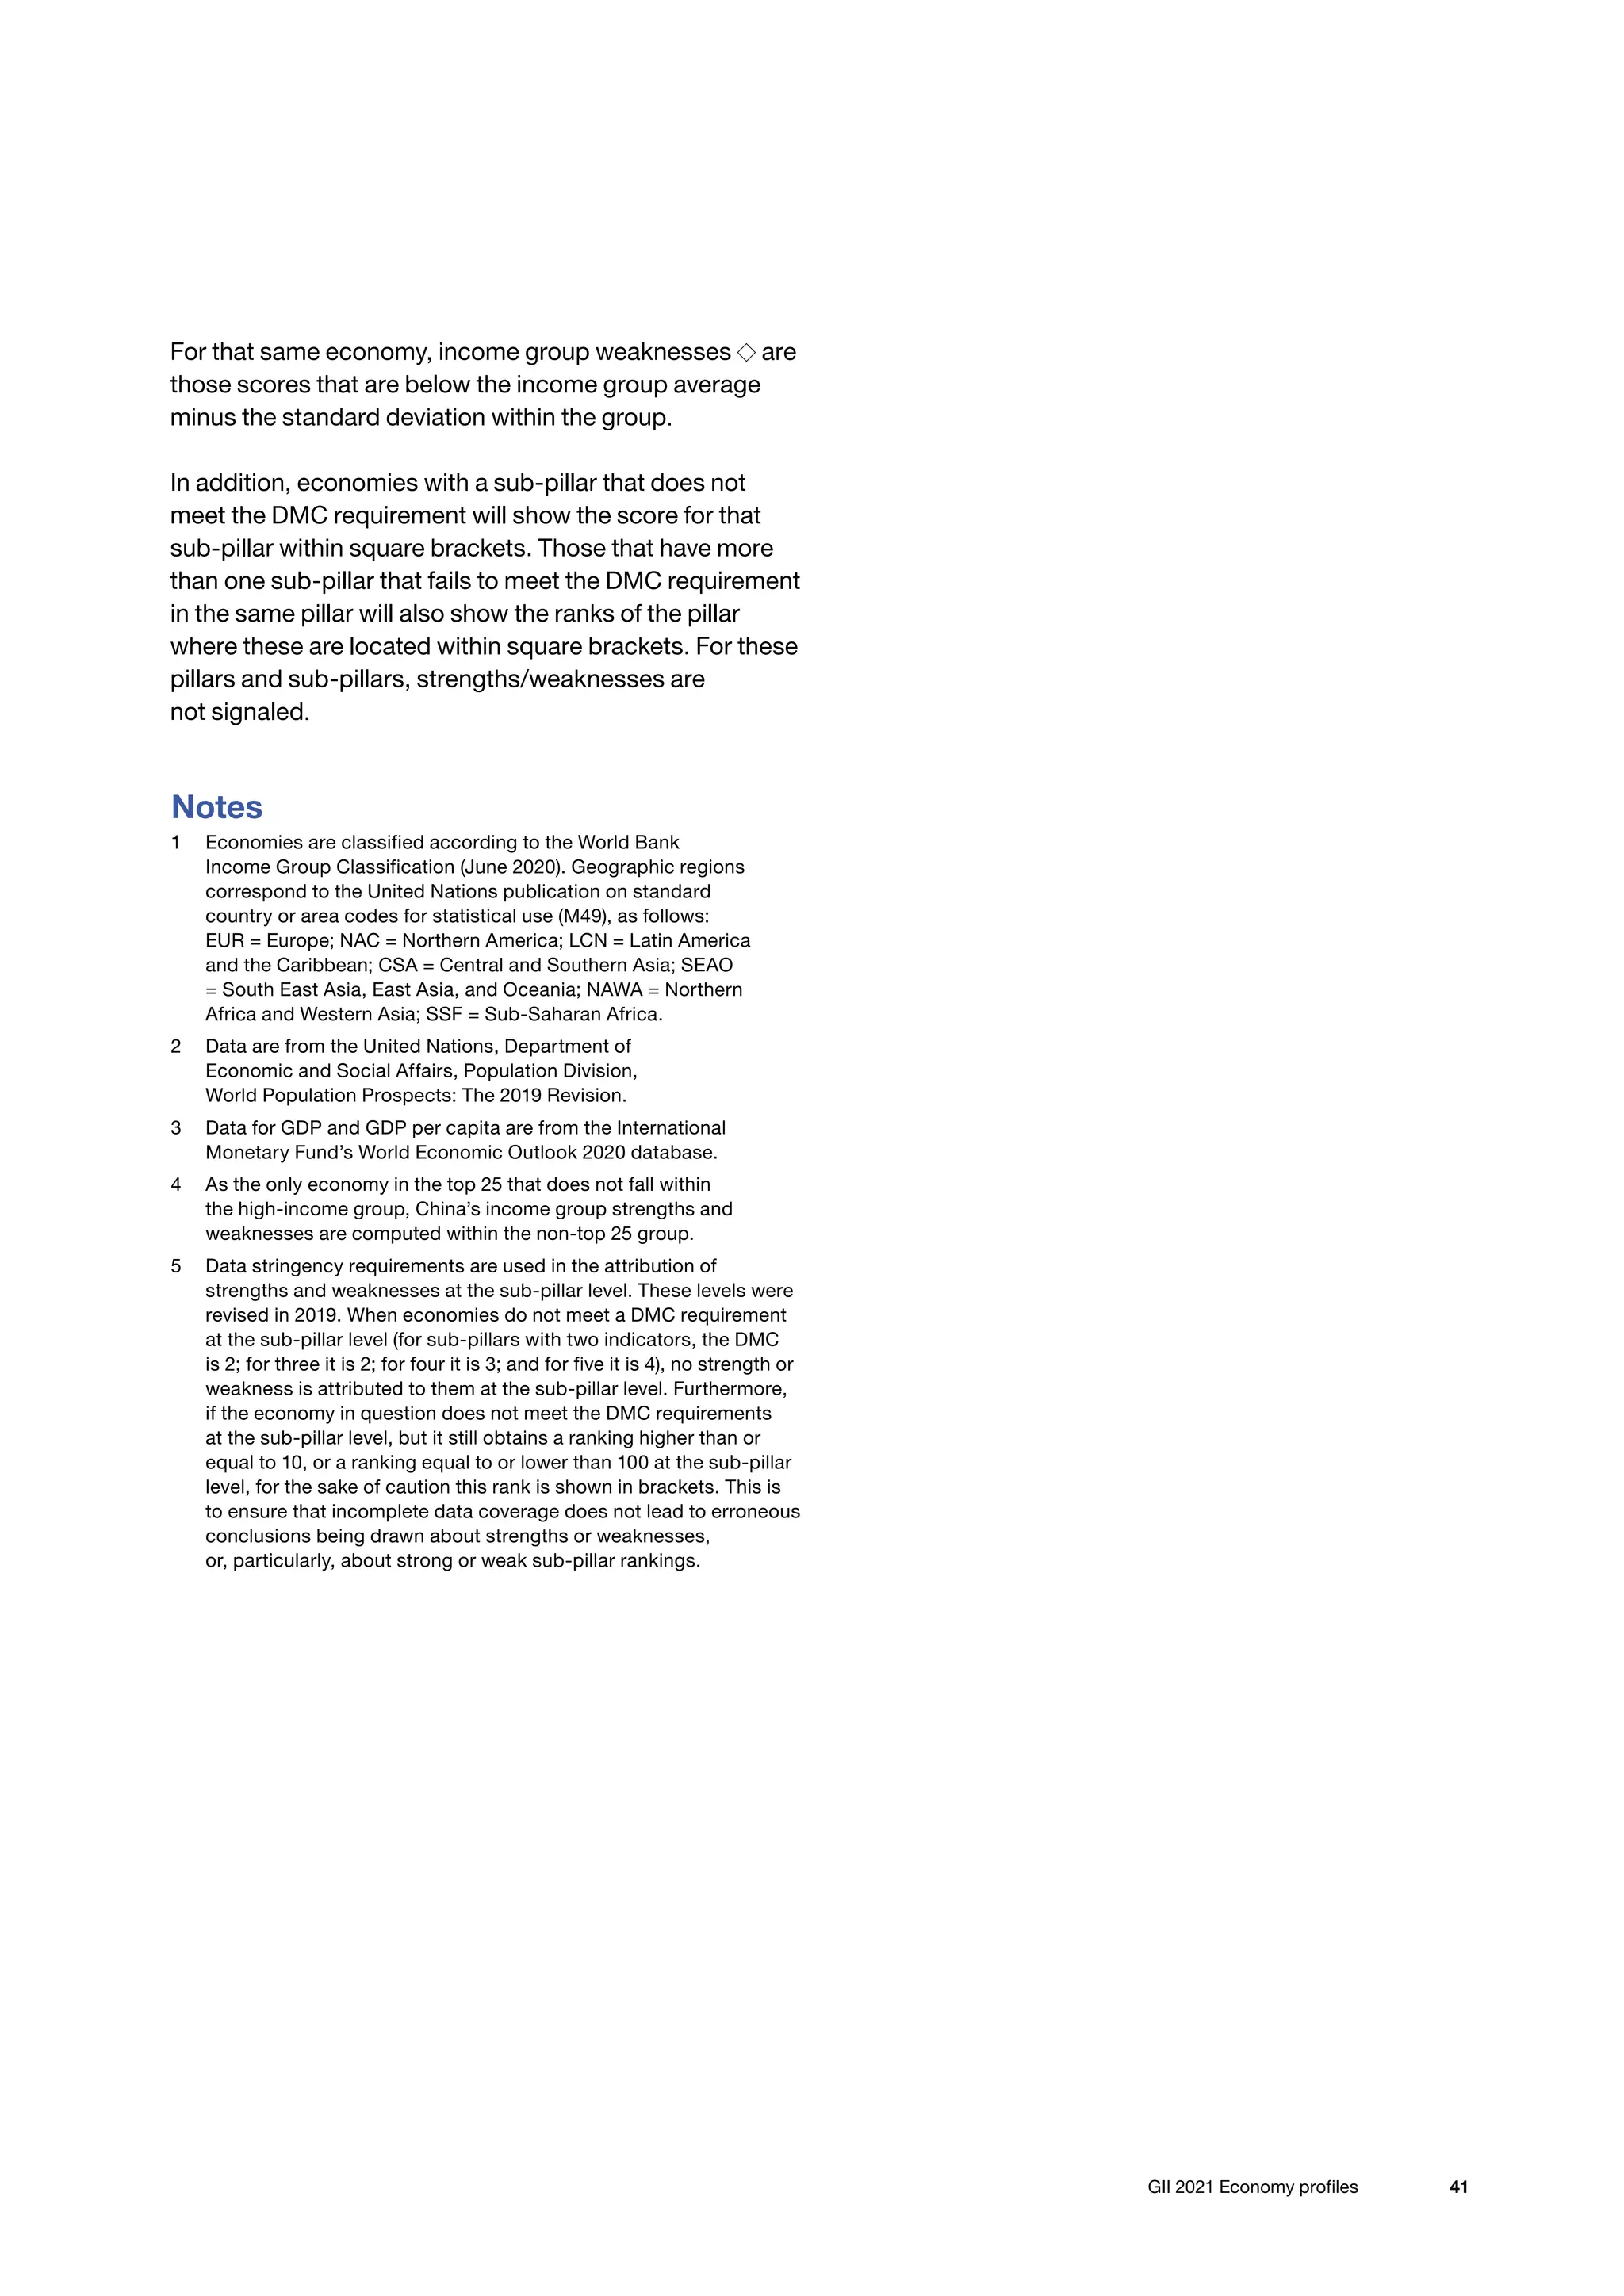
Figure 1
Fastest growing significant research fields by
number of publications, 2020
0
5
10
15
20
25
30
Growth
rate
(%)
20
40
60
80
100
Scientific
and
technical
articles
(th)
Green
and
sustainable
science
and
technology
Computer
science,
artificial
intelligence
Engineering,
multidisciplinary
Environmental
sciences
Engineering,
civil
Engineering,
environmental
Public,
environmental
and
occupational
health
Environmental
studies
Microbiology
Geosciences,
multidisciplinary
Articles
Growth 2019 to 2020
CAGR
Source: Web of Science (Clarivate) (WoS) articles published in the Social
Sciences Citation Index (SSCI) and Science Citation Index Expanded
(SCIE), restricted to science and technology fields and fields with more
than 20,000 publications in 2020 (so all the fields in the top 30 percent).
Fields represent the WoS categories [accessed on April 16, 2021].
Notes: CAGR values are computed using 2010 as the base year. If an
article is published in more than one field (i.e., under more than one WoS
category), then the article is counted once in each field. Hence, summing
all fields would result in some double counting.](https://image.slidesharecdn.com/e-220805033615-e8521670/75/E-INDEX-2021-pdf-31-2048.jpg)


![40 Global Innovation Index 2021
How to read the Economy profiles
The following tables provide detailed profiles for each of
the 132 economies in the Global Innovation Index 2021.
They are composed of four sections.
1 | The top section provides the overall Global
Innovation Index (GII) rank for each economy.
2 | The next section provides eight key metrics at the
beginning of each profile that are intended to put
the economy into context. They present the
Innovation Output Sub-Index rank, Innovation Input
Sub-Index rank, the income group to
which the economy belongs, its
geographical region,1
population in
millions,2
GDP in billion US$ PPP, and
GDP per capita in US$ PPP.3
The last
metric provides the GII 2020 rank for
the economy.
Because economies may drop out of
or enter the GII, and due to
adjustments made to the GII
framework every year and other
technical factors not directly related
to actual performance (missing data,
updates of data, etc.), the GII rankings
are not directly comparable from one
year to the next. Please refer to
Appendix I for details.
The Innovation Input Sub-Index rank
is computed based on the simple average of the scores in
the first five pillars, while the Innovation Output Sub-Index
rank is computed based on the simple average of the
scores in the last two pillars. Scores are normalized values
to fall within the 0–100 range.
3 | Pillars are identified by an illustrative icon,
sub-pillars by two-digit numbers and indicators by
three-digit numbers. For example, indicator 1.3.1,
ease of starting a business appears under sub-pillar 1.3,
Business environment, which in turn appears under the
pillar, Institutions .
The 2021 GII includes 81 indicators and three types of
data. Composite (or index) indicators are identified with an
asterisk (*), survey questions are identified with a dagger
(†), and the remaining indicators are all hard data series.
As far as possible, we provide the original value of the
indicators (frequently scaled in our index). This has been
achievable for all hard data (with the exception of
indicators in sub-pillar 7.3, for which the raw data were
provided on condition that only the normalized scores
were published), meaning that 56 indicators are reported
as values. Normalized scores in the 0–100 range are
provided for the 25 other indicators (which often consist of
survey data or indices) as well as for the overall index,
sub-pillars and pillars.
When data are either not available or out of date, “n/a” is
used with a cutoff year of 2011, with a few exceptions. To
the right of the indicator name, a clock symbol is used to
indicate that the economy’s data for that indicator are
older than the base year. For information on data
exceptions and limitations and a detailed explanation of
the GII framework, see Appendix I.
For further details on the indicators’
sources and definitions, see
Appendix III.
4 | On the far right-hand side of
each column, strengths of
the economy in question are
indicated by a solid circle ● and
weaknesses by a hollow circle ○.
Strengths within the economy’s
income group are indicated by a
solid diamond ◆ and weaknesses by
a hollow diamond ◇. The only
exceptions to the income group
strengths and weaknesses are the
top 25 high-income economies,
whose strengths and weaknesses
are computed within the top
25 group.4
All rankings of 1, 2 and 3 are highlighted as strengths,
except in particular instances at the sub-pillar level where
strengths and weaknesses are not signaled when the
desired data minimum coverage (DMC) is not met for that
sub-pillar.5
For the remaining indicators, strengths and
weaknesses of a particular economy are based on the
percentage of economies with scores that fall above or
below its own score (i.e., percent ranks).
For a given economy, strengths ● are those scores with
percent ranks greater than the 10th
largest percent rank
among the 81 indicators in that economy.
For that same economy, weaknesses ○ are those scores
with percent ranks lower than the 10th
smallest percent
rank among the 81 indicators in that economy.
Similarly, for a given economy, income group strengths ◆
are those scores that are above the income group average
plus the standard deviation within the group.
30 The Global Innovation Index 2021
30 The Global Innovation Index 2021
Albania GII 2021 rank
84
Output rank Input rank Income Region Population (mn) GDP, PPP$ (bn) GDP per capita, PPP$ GII 2020 rank
92 71 Upper middle EUR 2.9 39.1 13,651 83
Score/
Value Rank
Business sophistication 25.0 68
5.1 Knowledge workers 40.3 [42]
5.1.1 Knowledge-intensive employment, % 18.4 85
5.1.2 Firms offering formal training, % 46.2 22 ●
5.1.3 GERD performed by business, % GDP n/a n/a
5.1.4 GERD financed by business, % n/a n/a
5.1.5 Females employed w/advanced degrees, % 12.9 55
5.2 Innovation linkages 16.4 101
5.2.1 University-industry RD collaboration†
49.0 41
5.2.2 State of cluster development and depth†
25.9 127 ○ ◇
5.2.3 GERD financed by abroad, % GDP n/a n/a
5.2.4 Joint venture/strategic alliance deals/bn PPP$ GDP 0.0 67
5.2.5 Patent families/bn PPP$ GDP 0.0 100 ○ ◇
5.3 Knowledge absorption 18.3 100
5.3.1 Intellectual property payments, % total trade 0.4 73
5.3.2 High-tech imports, % total trade 2.0 130 ○ ◇
5.3.3 ICT services imports, % total trade 1.4 52
5.3.4 FDI net inflows, % GDP 7.9 11 ● ◆
5.3.5 Research talent, % in businesses n/a n/a
Knowledge and technology outputs 12.0 103
6.1 Knowledge creation 3.4 120
6.1.1 Patents by origin/bn PPP$ GDP 0.1 106
6.1.2 PCT patents by origin/bn PPP$ GDP 0.0 86
6.1.3 Utility models by origin/bn PPP$ GDP 0.0 66
6.1.4 Scientific and technical articles/bn PPP$ GDP 7.2 100
6.1.5 Citable documents H-index 2.9 123 ○
6.2 Knowledge impact 19.8 106
6.2.1 Labor productivity growth, % −1.2 89
6.2.2 New businesses/th pop. 15–64 1.5 66
6.2.3 Software spending, % GDP 0.1 86
6.2.4 ISO 9001 quality certificates/bn PPP$ GDP 8.9 30 ●
6.2.5 High-tech manufacturing, % 4.1 103 ○ ◇
6.3 Knowledge diffusion 12.7 79
6.3.1 Intellectual property receipts, % total trade 0.3 35 ◆
6.3.2 Production and export complexity 36.5 75
6.3.3 High-tech exports, % total trade 0.0 130 ○
6.3.4 ICT services exports, % total trade 1.9 59
Creative outputs 20.3 81
7.1 Intangible assets 19.5 103
7.1.1 Trademarks by origin/bn PPP$ GDP 34.5 65
7.1.2 Global brand value, top 5,000, % GDP 0.0 80 ○ ◇
7.1.3 Industrial designs by origin/bn PPP$ GDP 0.5 87
7.1.4 ICTs and organizational model creation†
39.5 114 ◇
7.2 Creative goods and services 19.5 57
7.2.1 Cultural and creative services exports, % total trade 1.2 21 ●
7.2.2 National feature films/mn pop. 15–69 3.3 56
7.2.3 Entertainment and media market/th pop. 15–69 n/a n/a
7.2.4 Printing and other media, % manufacturing 2.5 8 ● ◆
7.2.5 Creative goods exports, % total trade 0.2 83
7.3 Online creativity 22.5 53
7.3.1 Generic top-level domains (TLDs)/th pop. 15–69 6.8 48
7.3.2 Country-code TLDs/th pop. 15–69 3.3 61
7.3.3 Wikipedia edits/mn pop. 15–69 56.6 56
7.3.4 Mobile app creation/bn PPP$ GDP n/a n/a
Score/
Value Rank
Institutions 64.9 60
1.1 Political environment 56.1 71
1.1.1 Political and operational stability* 69.6 60
1.1.2 Government effectiveness* 49.3 76
1.2 Regulatory environment 58.9 82
1.2.1 Regulatory quality* 50.7 58
1.2.2 Rule of law* 35.9 85
1.2.3 Cost of redundancy dismissal 20.8 90
1.3 Business environment 79.7 34 ● ◆
1.3.1 Ease of starting a business* 91.8 47
1.3.2 Ease of resolving insolvency* 67.7 36 ●
Human capital and research 22.7 90
2.1 Education 39.8 95
2.1.1 Expenditure on education, % GDP 3.6 79
2.1.2 Government funding/pupil, secondary, % GDP/cap 8.0 96 ○ ◇
2.1.3 School life expectancy, years 14.8 57
2.1.4 PISA scales in reading, maths and science 419.8 56
2.1.5 Pupil-teacher ratio, secondary 10.7 36
2.2 Tertiary education 28.3 79
2.2.1 Tertiary enrolment, % gross 59.8 51
2.2.2 Graduates in science and engineering, % 18.8 81
2.2.3 Tertiary inbound mobility, % 1.6 81
2.3 Research and development (RD) 0.0 [123]
2.3.1 Researchers, FTE/mn pop. n/a n/a
2.3.2 Gross expenditure on RD, % GDP n/a n/a
2.3.3 Global corporate RD investors, top 3, mn US$ 0.0 41 ○ ◇
2.3.4 QS university ranking, top 3* 0.0 74 ○ ◇
Infrastructure 43.0 62
3.1 Informationandcommunicationtechnologies(ICTs) 66.6 66
3.1.1 ICT access* 45.4 98 ◇
3.1.2 ICT use* 52.3 77
3.1.3 Government’s online service* 84.1 31 ●
3.1.4 E-participation* 84.5 36
3.2 General infrastructure 23.4 91
3.2.1 Electricity output, GWh/mn pop. 2,984.3 66
3.2.2 Logistics performance* 28.5 86
3.2.3 Gross capital formation, % GDP 22.6 61
3.3 Ecological sustainability 38.9 38
3.3.1 GDP/unit of energy use 16.1 16 ● ◆
3.3.2 Environmental performance* 49.0 59
3.3.3 ISO 14001 environmental certificates/bn PPP$ GDP 3.6 25 ●
Market sophistication 44.1 79
4.1 Credit 34.6 89
4.1.1 Ease of getting credit* 70.0 44
4.1.2 Domestic credit to private sector, % GDP 34.4 90
4.1.3 Microfinance gross loans, % GDP 0.5 37
4.2 Investment 27.2 [75]
4.2.1 Ease of protecting minority investors* 46.0 97
4.2.2 Market capitalization, % GDP n/a n/a
4.2.3 Venture capital investors, deals/bn PPP$ GDP n/a n/a
4.2.4 Venture capital recipients, deals/bn PPP$ GDP 0.0 51
4.3 Trade, diversification, and market scale 70.6 61
4.3.1 Applied tariff rate, weighted avg., % 1.0 12 ●
4.3.2 Domestic industry diversification 93.7 36
4.3.3 Domestic market scale, bn PPP$ 39.1 112 ◇
NOTES: ● indicates a strength; ○ a weakness; ◆ an income group strength; ◇ an income group weakness; * an index; †
a survey question. indicates that
the economy’s data are older than the base year; see appendices for details, including the year of the data, at http://globalinnovationindex.org. Square
brackets [ ] indicate that the data minimum coverage (DMC) requirements were not met at the sub-pillar or pillar level.](https://image.slidesharecdn.com/e-220805033615-e8521670/75/E-INDEX-2021-pdf-60-2048.jpg)
![42 Global Innovation Index 2021
Albania GII 2021 rank
84
Output rank Input rank Income Region Population (mn) GDP, PPP$ (bn) GDP per capita, PPP$ GII 2020 rank
92 71 Upper middle EUR 2.9 39.1 13,651 83
Score/
Value Rank
Business sophistication 25.0 68
5.1 Knowledge workers 40.3 [42]
5.1.1 Knowledge-intensive employment, % 18.4 85
5.1.2 Firms offering formal training, % 46.2 22 ●
5.1.3 GERD performed by business, % GDP n/a n/a
5.1.4 GERD financed by business, % n/a n/a
5.1.5 Females employed w/advanced degrees, % 12.9 55
5.2 Innovation linkages 16.4 101
5.2.1 University-industry RD collaboration†
49.0 41
5.2.2 State of cluster development and depth†
25.9 127 ○ ◇
5.2.3 GERD financed by abroad, % GDP n/a n/a
5.2.4 Joint venture/strategic alliance deals/bn PPP$ GDP 0.0 67
5.2.5 Patent families/bn PPP$ GDP 0.0 100 ○ ◇
5.3 Knowledge absorption 18.3 100
5.3.1 Intellectual property payments, % total trade 0.4 73
5.3.2 High-tech imports, % total trade 2.0 130 ○ ◇
5.3.3 ICT services imports, % total trade 1.4 52
5.3.4 FDI net inflows, % GDP 7.9 11 ● ◆
5.3.5 Research talent, % in businesses n/a n/a
Knowledge and technology outputs 12.0 103
6.1 Knowledge creation 3.4 120
6.1.1 Patents by origin/bn PPP$ GDP 0.1 106
6.1.2 PCT patents by origin/bn PPP$ GDP 0.0 86
6.1.3 Utility models by origin/bn PPP$ GDP 0.0 66
6.1.4 Scientific and technical articles/bn PPP$ GDP 7.2 100
6.1.5 Citable documents H-index 2.9 123 ○
6.2 Knowledge impact 19.8 106
6.2.1 Labor productivity growth, % −1.2 89
6.2.2 New businesses/th pop. 15–64 1.5 66
6.2.3 Software spending, % GDP 0.1 86
6.2.4 ISO 9001 quality certificates/bn PPP$ GDP 8.9 30 ●
6.2.5 High-tech manufacturing, % 4.1 103 ○ ◇
6.3 Knowledge diffusion 12.7 79
6.3.1 Intellectual property receipts, % total trade 0.3 35 ◆
6.3.2 Production and export complexity 36.5 75
6.3.3 High-tech exports, % total trade 0.0 130 ○
6.3.4 ICT services exports, % total trade 1.9 59
Creative outputs 20.3 81
7.1 Intangible assets 19.5 103
7.1.1 Trademarks by origin/bn PPP$ GDP 34.5 65
7.1.2 Global brand value, top 5,000, % GDP 0.0 80 ○ ◇
7.1.3 Industrial designs by origin/bn PPP$ GDP 0.5 87
7.1.4 ICTs and organizational model creation†
39.5 114 ◇
7.2 Creative goods and services 19.5 57
7.2.1 Cultural and creative services exports, % total trade 1.2 21 ●
7.2.2 National feature films/mn pop. 15–69 3.3 56
7.2.3 Entertainment and media market/th pop. 15–69 n/a n/a
7.2.4 Printing and other media, % manufacturing 2.5 8 ● ◆
7.2.5 Creative goods exports, % total trade 0.2 83
7.3 Online creativity 22.5 53
7.3.1 Generic top-level domains (TLDs)/th pop. 15–69 6.8 48
7.3.2 Country-code TLDs/th pop. 15–69 3.3 61
7.3.3 Wikipedia edits/mn pop. 15–69 56.6 56
7.3.4 Mobile app creation/bn PPP$ GDP n/a n/a
Score/
Value Rank
Institutions 64.9 60
1.1 Political environment 56.1 71
1.1.1 Political and operational stability* 69.6 60
1.1.2 Government effectiveness* 49.3 76
1.2 Regulatory environment 58.9 82
1.2.1 Regulatory quality* 50.7 58
1.2.2 Rule of law* 35.9 85
1.2.3 Cost of redundancy dismissal 20.8 90
1.3 Business environment 79.7 34 ● ◆
1.3.1 Ease of starting a business* 91.8 47
1.3.2 Ease of resolving insolvency* 67.7 36 ●
Human capital and research 22.7 90
2.1 Education 39.8 95
2.1.1 Expenditure on education, % GDP 3.6 79
2.1.2 Government funding/pupil, secondary, % GDP/cap 8.0 96 ○ ◇
2.1.3 School life expectancy, years 14.8 57
2.1.4 PISA scales in reading, maths and science 419.8 56
2.1.5 Pupil-teacher ratio, secondary 10.7 36
2.2 Tertiary education 28.3 79
2.2.1 Tertiary enrolment, % gross 59.8 51
2.2.2 Graduates in science and engineering, % 18.8 81
2.2.3 Tertiary inbound mobility, % 1.6 81
2.3 Research and development (RD) 0.0 [123]
2.3.1 Researchers, FTE/mn pop. n/a n/a
2.3.2 Gross expenditure on RD, % GDP n/a n/a
2.3.3 Global corporate RD investors, top 3, mn US$ 0.0 41 ○ ◇
2.3.4 QS university ranking, top 3* 0.0 74 ○ ◇
Infrastructure 43.0 62
3.1 Informationandcommunicationtechnologies(ICTs) 66.6 66
3.1.1 ICT access* 45.4 98 ◇
3.1.2 ICT use* 52.3 77
3.1.3 Government’s online service* 84.1 31 ●
3.1.4 E-participation* 84.5 36
3.2 General infrastructure 23.4 91
3.2.1 Electricity output, GWh/mn pop. 2,984.3 66
3.2.2 Logistics performance* 28.5 86
3.2.3 Gross capital formation, % GDP 22.6 61
3.3 Ecological sustainability 38.9 38
3.3.1 GDP/unit of energy use 16.1 16 ● ◆
3.3.2 Environmental performance* 49.0 59
3.3.3 ISO 14001 environmental certificates/bn PPP$ GDP 3.6 25 ●
Market sophistication 44.1 79
4.1 Credit 34.6 89
4.1.1 Ease of getting credit* 70.0 44
4.1.2 Domestic credit to private sector, % GDP 34.4 90
4.1.3 Microfinance gross loans, % GDP 0.5 37
4.2 Investment 27.2 [75]
4.2.1 Ease of protecting minority investors* 46.0 97
4.2.2 Market capitalization, % GDP n/a n/a
4.2.3 Venture capital investors, deals/bn PPP$ GDP n/a n/a
4.2.4 Venture capital recipients, deals/bn PPP$ GDP 0.0 51
4.3 Trade, diversification, and market scale 70.6 61
4.3.1 Applied tariff rate, weighted avg., % 1.0 12 ●
4.3.2 Domestic industry diversification 93.7 36
4.3.3 Domestic market scale, bn PPP$ 39.1 112 ◇
NOTES: ● indicates a strength; ○ a weakness; ◆ an income group strength; ◇ an income group weakness; * an index; †
a survey question. indicates that
the
economy’s data are older than the base year; see appendices for details, including the year of the data, at http://globalinnovationindex.org. Square
brackets [ ] indicate
that the data minimum coverage (DMC) requirements were not met at the sub-pillar or pillar level.
Economy profiles](https://image.slidesharecdn.com/e-220805033615-e8521670/75/E-INDEX-2021-pdf-62-2048.jpg)
![43
GII 2021 Economy profiles
Algeria GII 2021 rank
120
Output rank Input rank Income Region Population (mn) GDP, PPP$ (bn) GDP per capita, PPP$ GII 2020 rank
128 109 Lower middle NAWA 43.9 488.3 11,041 121
Score/
Value Rank
Business sophistication 14.7 124 ◇
5.1 Knowledge workers 13.3 116 ◇
5.1.1 Knowledge-intensive employment, % 17.9 88
5.1.2 Firms offering formal training, % n/a n/a
5.1.3 GERD performed by business, % GDP 0.0 78
5.1.4 GERD financed by business, % 6.7 82
5.1.5 Females employed w/advanced degrees, % 8.1 78
5.2 Innovation linkages 15.2 107
5.2.1 University-industry RD collaboration†
37.1 93
5.2.2 State of cluster development and depth†
48.3 57 ●
5.2.3 GERD financed by abroad, % GDP 0.0 101 ○
5.2.4 Joint venture/strategic alliance deals/bn PPP$ GDP 0.0 119
5.2.5 Patent families/bn PPP$ GDP 0.0 100 ○ ◇
5.3 Knowledge absorption 15.6 115
5.3.1 Intellectual property payments, % total trade 0.3 85
5.3.2 High-tech imports, % total trade 8.9 49 ●
5.3.3 ICT services imports, % total trade 0.6 97
5.3.4 FDI net inflows, % GDP 0.8 112
5.3.5 Research talent, % in businesses 0.5 82
Knowledge and technology outputs 8.1 125
6.1 Knowledge creation 7.4 94
6.1.1 Patents by origin/bn PPP$ GDP 0.2 96
6.1.2 PCT patents by origin/bn PPP$ GDP 0.0 83
6.1.3 Utility models by origin/bn PPP$ GDP n/a n/a
6.1.4 Scientific and technical articles/bn PPP$ GDP 9.3 89
6.1.5 Citable documents H-index 10.2 76
6.2 Knowledge impact 13.7 119
6.2.1 Labor productivity growth, % −0.6 76
6.2.2 New businesses/th pop. 15–64 0.4 105
6.2.3 Software spending, % GDP 0.0 123 ◇
6.2.4 ISO 9001 quality certificates/bn PPP$ GDP 1.2 103
6.2.5 High-tech manufacturing, % 4.1 104 ◇
6.3 Knowledge diffusion 3.3 125
6.3.1 Intellectual property receipts, % total trade 0.0 112
6.3.2 Production and export complexity 13.6 115 ◇
6.3.3 High-tech exports, % total trade 0.0 129 ○
6.3.4 ICT services exports, % total trade 0.4 106
Creative outputs 10.3 118
7.1 Intangible assets 16.6 113
7.1.1 Trademarks by origin/bn PPP$ GDP 14.3 101
7.1.2 Global brand value, top 5,000, % GDP 0.0 80 ○ ◇
7.1.3 Industrial designs by origin/bn PPP$ GDP 2.7 40 ●
7.1.4 ICTs and organizational model creation†
41.3 111
7.2 Creative goods and services 1.0 128 ◇
7.2.1 Cultural and creative services exports, % total trade 0.0 104
7.2.2 National feature films/mn pop. 15–69 0.4 99
7.2.3 Entertainment and media market/th pop. 15–69 1.3 56
7.2.4 Printing and other media, % manufacturing 0.3 99
7.2.5 Creative goods exports, % total trade 0.0 124
7.3 Online creativity 7.1 114
7.3.1 Generic top-level domains (TLDs)/th pop. 15–69 0.5 108
7.3.2 Country-code TLDs/th pop. 15–69 0.1 116
7.3.3 Wikipedia edits/mn pop. 15–69 30.4 103
7.3.4 Mobile app creation/bn PPP$ GDP 0.0 100
Score/
Value Rank
Institutions 52.5 104
1.1 Political environment 44.6 106
1.1.1 Political and operational stability* 55.4 112
1.1.2 Government effectiveness* 39.2 100
1.2 Regulatory environment 49.4 108
1.2.1 Regulatory quality* 9.4 129 ◇
1.2.2 Rule of law* 25.2 113
1.2.3 Cost of redundancy dismissal 17.3 69
1.3 Business environment 63.6 92
1.3.1 Ease of starting a business* 78.0 114
1.3.2 Ease of resolving insolvency* 49.2 73
Human capital and research 29.8 74
2.1 Education 41.2 [91]
2.1.1 Expenditure on education, % GDP n/a n/a
2.1.2 Government funding/pupil, secondary, % GDP/cap n/a n/a
2.1.3 School life expectancy, years 14.3 64 ◆
2.1.4 PISA scales in reading, maths and science 361.7 77
2.1.5 Pupil-teacher ratio, secondary n/a n/a
2.2 Tertiary education 43.2 31 ● ◆
2.2.1 Tertiary enrolment, % gross 52.6 59 ● ◆
2.2.2 Graduates in science and engineering, % 34.2 8 ● ◆
2.2.3 Tertiary inbound mobility, % 0.5 95
2.3 Research and development (RD) 5.1 76
2.3.1 Researchers, FTE/mn pop. 819.3 54 ●
2.3.2 Gross expenditure on RD, % GDP 0.5 62 ●
2.3.3 Global corporate RD investors, top 3, mn US$ 0.0 41 ○ ◇
2.3.4 QS university ranking, top 3* 0.0 74 ○ ◇
Infrastructure 31.8 96
3.1 Informationandcommunicationtechnologies(ICTs) 39.1 112
3.1.1 ICT access* 60.2 75 ◆
3.1.2 ICT use* 53.0 76 ◆
3.1.3 Government’s online service* 27.6 127 ◇
3.1.4 E-participation* 15.5 131 ○ ◇
3.2 General infrastructure 32.4 50 ●
3.2.1 Electricity output, GWh/mn pop. 1,815.5 86
3.2.2 Logistics performance* 18.6 109
3.2.3 Gross capital formation, % GDP 37.5 10 ● ◆
3.3 Ecological sustainability 24.1 83
3.3.1 GDP/unit of energy use 10.2 64 ●
3.3.2 Environmental performance* 44.8 74 ◆
3.3.3 ISO 14001 environmental certificates/bn PPP$ GDP 0.3 99
Market sophistication 23.7 132 ○ ◇
4.1 Credit 9.4 129 ◇
4.1.1 Ease of getting credit* 10.0 129 ○ ◇
4.1.2 Domestic credit to private sector, % GDP 25.9 102
4.1.3 Microfinance gross loans, % GDP n/a n/a
4.2 Investment 10.0 [131]
4.2.1 Ease of protecting minority investors* 20.0 130 ○ ◇
4.2.2 Market capitalization, % GDP 0.2 75 ○ ◇
4.2.3 Venture capital investors, deals/bn PPP$ GDP n/a n/a
4.2.4 Venture capital recipients, deals/bn PPP$ GDP n/a n/a
4.3 Trade, diversification, and market scale 51.7 115
4.3.1 Applied tariff rate, weighted avg., % 10.0 117
4.3.2 Domestic industry diversification 45.8 108 ◇
4.3.3 Domestic market scale, bn PPP$ 488.3 42 ●
NOTES: ● indicates a strength; ○ a weakness; ◆ an income group strength; ◇ an income group weakness; * an index; †
a survey question. indicates that
the
economy’s data are older than the base year; see appendices for details, including the year of the data, at http://globalinnovationindex.org. Square
brackets [ ] indicate
that the data minimum coverage (DMC) requirements were not met at the sub-pillar or pillar level.](https://image.slidesharecdn.com/e-220805033615-e8521670/75/E-INDEX-2021-pdf-63-2048.jpg)
![44 Global Innovation Index 2021
Angola GII 2021 rank
132
Output rank Input rank Income Region Population (mn) GDP, PPP$ (bn) GDP per capita, PPP$ GII 2020 rank
131 131 Lower middle SSF 32.9 216.6 6,978 n/a
Score/
Value Rank
Business sophistication 13.1 130 ◇
5.1 Knowledge workers 15.9 [109]
5.1.1 Knowledge-intensive employment, % 11.1 107
5.1.2 Firms offering formal training, % 23.5 66 ●
5.1.3 GERD performed by business, % GDP n/a n/a
5.1.4 GERD financed by business, % n/a n/a
5.1.5 Females employed w/advanced degrees, % 1.6 108
5.2 Innovation linkages 11.0 127 ◇
5.2.1 University-industry RD collaboration†
17.4 126 ○ ◇
5.2.2 State of cluster development and depth†
27.1 125 ◇
5.2.3 GERD financed by abroad, % GDP n/a n/a
5.2.4 Joint venture/strategic alliance deals/bn PPP$ GDP 0.0 106
5.2.5 Patent families/bn PPP$ GDP 0.0 100 ○ ◇
5.3 Knowledge absorption 12.5 129 ◇
5.3.1 Intellectual property payments, % total trade 0.6 62 ●
5.3.2 High-tech imports, % total trade 2.9 125 ◇
5.3.3 ICT services imports, % total trade 0.5 103
5.3.4 FDI net inflows, % GDP −5.7 128 ◇
5.3.5 Research talent, % in businesses n/a n/a
Knowledge and technology outputs 4.7 129 ◇
6.1 Knowledge creation 0.4 132 ○ ◇
6.1.1 Patents by origin/bn PPP$ GDP 0.0 127
6.1.2 PCT patents by origin/bn PPP$ GDP 0.0 98 ○ ◇
6.1.3 Utility models by origin/bn PPP$ GDP 0.0 71
6.1.4 Scientific and technical articles/bn PPP$ GDP 0.4 131 ○ ◇
6.1.5 Citable documents H-index 1.3 130 ◇
6.2 Knowledge impact 12.4 [121]
6.2.1 Labor productivity growth, % −4.1 116 ◇
6.2.2 New businesses/th pop. 15–64 n/a n/a
6.2.3 Software spending, % GDP n/a n/a
6.2.4 ISO 9001 quality certificates/bn PPP$ GDP 0.4 127
6.2.5 High-tech manufacturing, % 3.4 105 ◇
6.3 Knowledge diffusion 1.3 130
6.3.1 Intellectual property receipts, % total trade 0.0 83 ●
6.3.2 Production and export complexity 4.4 120 ◇
6.3.3 High-tech exports, % total trade 0.2 108
6.3.4 ICT services exports, % total trade 0.1 127
Creative outputs 8.1[130]
7.1 Intangible assets 8.1 [131]
7.1.1 Trademarks by origin/bn PPP$ GDP 11.7 108
7.1.2 Global brand value, top 5,000, % GDP n/a n/a
7.1.3 Industrial designs by origin/bn PPP$ GDP n/a n/a
7.1.4 ICTs and organizational model creation†
n/a n/a
7.2 Creative goods and services 11.4 [75]
7.2.1 Cultural and creative services exports, % total trade n/a n/a
7.2.2 National feature films/mn pop. 15–69 0.3 103
7.2.3 Entertainment and media market/th pop. 15–69 n/a n/a
7.2.4 Printing and other media, % manufacturing 2.3 10 ● ◆
7.2.5 Creative goods exports, % total trade 0.0 127
7.3 Online creativity 5.1 124
7.3.1 Generic top-level domains (TLDs)/th pop. 15–69 0.0 132 ○ ◇
7.3.2 Country-code TLDs/th pop. 15–69 0.0 128
7.3.3 Wikipedia edits/mn pop. 15–69 19.5 124
7.3.4 Mobile app creation/bn PPP$ GDP n/a n/a
Score/
Value Rank
Institutions 42.2 128 ◇
1.1 Political environment 36.9 126 ◇
1.1.1 Political and operational stability* 58.9 100
1.1.2 Government effectiveness* 25.8 128 ◇
1.2 Regulatory environment 50.0 105
1.2.1 Regulatory quality* 20.1 124
1.2.2 Rule of law* 18.9 125 ◇
1.2.3 Cost of redundancy dismissal 17.9 75 ●
1.3 Business environment 39.7 131 ○ ◇
1.3.1 Ease of starting a business* 79.4 111
1.3.2 Ease of resolving insolvency* 0.0 129 ○ ◇
Human capital and research 12.3 119 ◇
2.1 Education 29.9 [113]
2.1.1 Expenditure on education, % GDP 3.4 88 ●
2.1.2 Government funding/pupil, secondary, % GDP/cap n/a n/a
2.1.3 School life expectancy, years 9.6 109 ◇
2.1.4 PISA scales in reading, maths and science n/a n/a
2.1.5 Pupil-teacher ratio, secondary 26.8 111 ◇
2.2 Tertiary education 6.7 119 ◇
2.2.1 Tertiary enrolment, % gross 9.3 116
2.2.2 Graduates in science and engineering, % 12.0 103 ◇
2.2.3 Tertiary inbound mobility, % n/a n/a
2.3 Research and development (RD) 0.1 119
2.3.1 Researchers, FTE/mn pop. 18.8 106
2.3.2 Gross expenditure on RD, % GDP 0.0 113 ◇
2.3.3 Global corporate RD investors, top 3, mn US$ 0.0 41 ○ ◇
2.3.4 QS university ranking, top 3* 0.0 74 ○ ◇
Infrastructure 22.3 125 ◇
3.1 Informationandcommunicationtechnologies(ICTs) 33.0 121 ◇
3.1.1 ICT access* 26.1 125 ◇
3.1.2 ICT use* 12.0 126 ◇
3.1.3 Government’s online service* 48.8 109
3.1.4 E-participation* 45.2 108
3.2 General infrastructure 13.0 123 ◇
3.2.1 Electricity output, GWh/mn pop. 380.9 113
3.2.2 Logistics performance* 0.0 125 ○ ◇
3.2.3 Gross capital formation, % GDP 21.5 74 ●
3.3 Ecological sustainability 20.9 94 ●
3.3.1 GDP/unit of energy use 12.2 47 ●
3.3.2 Environmental performance* 29.7 121
3.3.3 ISO 14001 environmental certificates/bn PPP$ GDP 0.1 129
Market sophistication 27.6 127 ◇
4.1 Credit 3.5 131 ○ ◇
4.1.1 Ease of getting credit* 5.0 131 ○ ◇
4.1.2 Domestic credit to private sector, % GDP 14.4 120
4.1.3 Microfinance gross loans, % GDP 0.0 72
4.2 Investment 32.0 [63]
4.2.1 Ease of protecting minority investors* 32.0 120 ◇
4.2.2 Market capitalization, % GDP n/a n/a
4.2.3 Venture capital investors, deals/bn PPP$ GDP n/a n/a
4.2.4 Venture capital recipients, deals/bn PPP$ GDP n/a n/a
4.3 Trade, diversification, and market scale 47.3 119
4.3.1 Applied tariff rate, weighted avg., % 6.5 96 ●
4.3.2 Domestic industry diversification 33.3 110 ◇
4.3.3 Domestic market scale, bn PPP$ 216.6 62 ●
NOTES: ● indicates a strength; ○ a weakness; ◆ an income group strength; ◇ an income group weakness; * an index; †
a survey question. indicates that
the
economy’s data are older than the base year; see appendices for details, including the year of the data, at http://globalinnovationindex.org. Square
brackets [ ] indicate
that the data minimum coverage (DMC) requirements were not met at the sub-pillar or pillar level.](https://image.slidesharecdn.com/e-220805033615-e8521670/75/E-INDEX-2021-pdf-64-2048.jpg)
![45
GII 2021 Economy profiles
Argentina GII 2021 rank
73
Output rank Input rank Income Region Population (mn) GDP, PPP$ (bn) GDP per capita, PPP$ GII 2020 rank
71 77 Upper middle LCN 45.2 924.5 20,370 80
Score/
Value Rank
Business sophistication 26.7 57
5.1 Knowledge workers 29.4 71
5.1.1 Knowledge-intensive employment, % 24.6 60
5.1.2 Firms offering formal training, % 40.2 28
5.1.3 GERD performed by business, % GDP 0.2 57
5.1.4 GERD financed by business, % 17.8 69
5.1.5 Females employed w/advanced degrees, % 15.2 49
5.2 Innovation linkages 15.7 105
5.2.1 University-industry RD collaboration†
37.6 91
5.2.2 State of cluster development and depth†
41.0 98
5.2.3 GERD financed by abroad, % GDP 0.1 52
5.2.4 Joint venture/strategic alliance deals/bn PPP$ GDP 0.0 109 ○
5.2.5 Patent families/bn PPP$ GDP 0.1 63
5.3 Knowledge absorption 35.1 41
5.3.1 Intellectual property payments, % total trade 2.6 9 ● ◆
5.3.2 High-tech imports, % total trade 9.0 45
5.3.3 ICT services imports, % total trade 1.8 38 ◆
5.3.4 FDI net inflows, % GDP 1.9 82
5.3.5 Research talent, % in businesses 9.7 63
Knowledge and technology outputs 18.7 73
6.1 Knowledge creation 12.7 70
6.1.1 Patents by origin/bn PPP$ GDP 0.4 82
6.1.2 PCT patents by origin/bn PPP$ GDP n/a n/a
6.1.3 Utility models by origin/bn PPP$ GDP 0.1 52
6.1.4 Scientific and technical articles/bn PPP$ GDP 11.2 76
6.1.5 Citable documents H-index 27.5 36
6.2 Knowledge impact 26.1 82
6.2.1 Labor productivity growth, % −2.2 105 ○
6.2.2 New businesses/th pop. 15–64 0.2 111 ○
6.2.3 Software spending, % GDP 0.2 63
6.2.4 ISO 9001 quality certificates/bn PPP$ GDP 6.4 44
6.2.5 High-tech manufacturing, % 28.1 45
6.3 Knowledge diffusion 17.2 65
6.3.1 Intellectual property receipts, % total trade 0.4 28 ● ◆
6.3.2 Production and export complexity 39.0 72
6.3.3 High-tech exports, % total trade 0.8 80
6.3.4 ICT services exports, % total trade 2.7 42
Creative outputs 21.9 73
7.1 Intangible assets 27.4 76
7.1.1 Trademarks by origin/bn PPP$ GDP 47.5 47
7.1.2 Global brand value, top 5,000, % GDP 12.3 56
7.1.3 Industrial designs by origin/bn PPP$ GDP 1.0 68
7.1.4 ICTs and organizational model creation†
50.6 80
7.2 Creative goods and services 14.2 66
7.2.1 Cultural and creative services exports, % total trade 1.2 22 ●
7.2.2 National feature films/mn pop. 15–69 7.4 26 ● ◆
7.2.3 Entertainment and media market/th pop. 15–69 5.2 46
7.2.4 Printing and other media, % manufacturing n/a n/a
7.2.5 Creative goods exports, % total trade 0.3 72
7.3 Online creativity 18.5 63
7.3.1 Generic top-level domains (TLDs)/th pop. 15–69 3.0 62
7.3.2 Country-code TLDs/th pop. 15–69 6.3 46
7.3.3 Wikipedia edits/mn pop. 15–69 55.6 57
7.3.4 Mobile app creation/bn PPP$ GDP 8.4 52
Score/
Value Rank
Institutions 52.8 102 ◇
1.1 Political environment 53.9 81
1.1.1 Political and operational stability* 64.3 80
1.1.2 Government effectiveness* 48.7 79
1.2 Regulatory environment 44.4 117 ○ ◇
1.2.1 Regulatory quality* 30.6 103 ◇
1.2.2 Rule of law* 35.4 89
1.2.3 Cost of redundancy dismissal 30.3 119 ○ ◇
1.3 Business environment 60.2 106
1.3.1 Ease of starting a business* 80.4 109
1.3.2 Ease of resolving insolvency* 40.0 97
Human capital and research 37.0 50
2.1 Education 48.3 71
2.1.1 Expenditure on education, % GDP 4.9 43
2.1.2 Government funding/pupil, secondary, % GDP/cap 17.5 63
2.1.3 School life expectancy, years 17.7 14 ● ◆
2.1.4 PISA scales in reading, maths and science 395.0 69 ○
2.1.5 Pupil-teacher ratio, secondary n/a n/a
2.2 Tertiary education 34.8 62
2.2.1 Tertiary enrolment, % gross 91.6 6 ● ◆
2.2.2 Graduates in science and engineering, % 16.0 94
2.2.3 Tertiary inbound mobility, % 2.8 68
2.3 Research and development (RD) 28.0 39 ◆
2.3.1 Researchers, FTE/mn pop. 1,210.5 49
2.3.2 Gross expenditure on RD, % GDP 0.6 61
2.3.3 Global corporate RD investors, top 3, mn US$ 44.0 36 ◆
2.3.4 QS university ranking, top 3* 42.8 29 ● ◆
Infrastructure 42.5 64
3.1 Informationandcommunicationtechnologies(ICTs) 75.8 46
3.1.1 ICT access* 70.3 60
3.1.2 ICT use* 62.6 59
3.1.3 Government’s online service* 84.7 30 ●
3.1.4 E-participation* 85.7 29 ●
3.2 General infrastructure 21.7 100
3.2.1 Electricity output, GWh/mn pop. 3,096.3 65
3.2.2 Logistics performance* 39.0 60
3.2.3 Gross capital formation, % GDP 17.3 102
3.3 Ecological sustainability 29.9 60
3.3.1 GDP/unit of energy use 10.8 62
3.3.2 Environmental performance* 52.2 52
3.3.3 ISO 14001 environmental certificates/bn PPP$ GDP 1.5 56
Market sophistication 37.5 110 ◇
4.1 Credit 21.8 121 ○ ◇
4.1.1 Ease of getting credit* 50.0 94 ◇
4.1.2 Domestic credit to private sector, % GDP 16.0 117 ○ ◇
4.1.3 Microfinance gross loans, % GDP 0.0 75 ○
4.2 Investment 17.1 124 ○ ◇
4.2.1 Ease of protecting minority investors* 62.0 60
4.2.2 Market capitalization, % GDP 11.5 67 ○
4.2.3 Venture capital investors, deals/bn PPP$ GDP 0.0 82 ○
4.2.4 Venture capital recipients, deals/bn PPP$ GDP 0.0 86 ○
4.3 Trade, diversification, and market scale 73.6 50
4.3.1 Applied tariff rate, weighted avg., % 7.3 99
4.3.2 Domestic industry diversification 86.6 64
4.3.3 Domestic market scale, bn PPP$ 924.5 28 ●
NOTES: ● indicates a strength; ○ a weakness; ◆ an income group strength; ◇ an income group weakness; * an index; †
a survey question. indicates that
the
economy’s data are older than the base year; see appendices for details, including the year of the data, at http://globalinnovationindex.org. Square
brackets [ ] indicate
that the data minimum coverage (DMC) requirements were not met at the sub-pillar or pillar level.](https://image.slidesharecdn.com/e-220805033615-e8521670/75/E-INDEX-2021-pdf-65-2048.jpg)
![46 Global Innovation Index 2021
Armenia GII 2021 rank
69
Output rank Input rank Income Region Population (mn) GDP, PPP$ (bn) GDP per capita, PPP$ GII 2020 rank
56 85 Upper middle NAWA 3.0 40.8 13,735 61
Score/
Value Rank
Business sophistication 19.9 98
5.1 Knowledge workers 30.1 69
5.1.1 Knowledge-intensive employment, % 29.5 51
5.1.2 Firms offering formal training, % 27.5 56
5.1.3 GERD performed by business, % GDP n/a n/a
5.1.4 GERD financed by business, % 16.7 71
5.1.5 Females employed w/advanced degrees, % 6.3 86 ◇
5.2 Innovation linkages 14.9 109
5.2.1 University-industry RD collaboration†
35.7 96
5.2.2 State of cluster development and depth†
43.6 82
5.2.3 GERD financed by abroad, % GDP 0.0 78
5.2.4 Joint venture/strategic alliance deals/bn PPP$ GDP 0.0 100
5.2.5 Patent families/bn PPP$ GDP 0.1 62
5.3 Knowledge absorption 14.7 119 ○ ◇
5.3.1 Intellectual property payments, % total trade 0.0 123 ○ ◇
5.3.2 High-tech imports, % total trade 5.9 98
5.3.3 ICT services imports, % total trade 0.6 100
5.3.4 FDI net inflows, % GDP 2.0 77
5.3.5 Research talent, % in businesses n/a n/a
Knowledge and technology outputs 21.4 64
6.1 Knowledge creation 19.6 53
6.1.1 Patents by origin/bn PPP$ GDP 2.8 28 ●
6.1.2 PCT patents by origin/bn PPP$ GDP 0.1 64
6.1.3 Utility models by origin/bn PPP$ GDP 0.9 25 ●
6.1.4 Scientific and technical articles/bn PPP$ GDP 21.3 43
6.1.5 Citable documents H-index 11.0 70
6.2 Knowledge impact 22.0 94
6.2.1 Labor productivity growth, % 3.1 15 ● ◆
6.2.2 New businesses/th pop. 15–64 3.1 47
6.2.3 Software spending, % GDP 0.1 82
6.2.4 ISO 9001 quality certificates/bn PPP$ GDP 0.8 114 ○
6.2.5 High-tech manufacturing, % 4.7 102 ○ ◇
6.3 Knowledge diffusion 22.6 50
6.3.1 Intellectual property receipts, % total trade n/a n/a
6.3.2 Production and export complexity 34.8 78
6.3.3 High-tech exports, % total trade 0.8 81
6.3.4 ICT services exports, % total trade 4.2 21 ● ◆
Creative outputs 30.6 49
7.1 Intangible assets 37.9 44
7.1.1 Trademarks by origin/bn PPP$ GDP 92.9 11 ● ◆
7.1.2 Global brand value, top 5,000, % GDP 0.0 80 ○ ◇
7.1.3 Industrial designs by origin/bn PPP$ GDP 0.9 73
7.1.4 ICTs and organizational model creation†
52.8 67
7.2 Creative goods and services 19.9 54
7.2.1 Cultural and creative services exports, % total trade 0.4 55
7.2.2 National feature films/mn pop. 15–69 13.2 12 ● ◆
7.2.3 Entertainment and media market/th pop. 15–69 n/a n/a
7.2.4 Printing and other media, % manufacturing 1.4 29 ●
7.2.5 Creative goods exports, % total trade 0.8 53
7.3 Online creativity 26.7 44
7.3.1 Generic top-level domains (TLDs)/th pop. 15–69 3.0 63
7.3.2 Country-code TLDs/th pop. 15–69 5.2 54
7.3.3 Wikipedia edits/mn pop. 15–69 88.9 2 ● ◆
7.3.4 Mobile app creation/bn PPP$ GDP 4.4 58
Score/
Value Rank
Institutions 64.1 65
1.1 Political environment 53.6 82
1.1.1 Political and operational stability* 62.5 89
1.1.2 Government effectiveness* 49.2 77
1.2 Regulatory environment 68.4 56
1.2.1 Regulatory quality* 50.0 59
1.2.2 Rule of law* 43.3 70
1.2.3 Cost of redundancy dismissal 13.0 40
1.3 Business environment 70.3 70
1.3.1 Ease of starting a business* 96.1 10 ● ◆
1.3.2 Ease of resolving insolvency* 44.6 86
Human capital and research 21.7 94
2.1 Education 37.6 98
2.1.1 Expenditure on education, % GDP 2.7 104 ○ ◇
2.1.2 Government funding/pupil, secondary, % GDP/cap 14.6 78
2.1.3 School life expectancy, years 13.1 81
2.1.4 PISA scales in reading, maths and science n/a n/a
2.1.5 Pupil-teacher ratio, secondary 9.9 27 ●
2.2 Tertiary education 26.2 82
2.2.1 Tertiary enrolment, % gross 51.5 61
2.2.2 Graduates in science and engineering, % 17.1 89
2.2.3 Tertiary inbound mobility, % 5.5 42
2.3 Research and development (RD) 1.2 103
2.3.1 Researchers, FTE/mn pop. n/a n/a
2.3.2 Gross expenditure on RD, % GDP 0.2 92
2.3.3 Global corporate RD investors, top 3, mn US$ 0.0 41 ○ ◇
2.3.4 QS university ranking, top 3* 0.0 74 ○ ◇
Infrastructure 38.1 80
3.1 Informationandcommunicationtechnologies(ICTs) 68.0 63
3.1.1 ICT access* 69.4 61
3.1.2 ICT use* 57.5 67
3.1.3 Government’s online service* 70.0 69
3.1.4 E-participation* 75.0 57
3.2 General infrastructure 21.0 104
3.2.1 Electricity output, GWh/mn pop. 2,639.2 72
3.2.2 Logistics performance* 26.0 88
3.2.3 Gross capital formation, % GDP 20.9 80
3.3 Ecological sustainability 25.2 80
3.3.1 GDP/unit of energy use 9.4 75
3.3.2 Environmental performance* 52.3 51
3.3.3 ISO 14001 environmental certificates/bn PPP$ GDP 0.1 130 ○
Market sophistication 40.4 99 ◇
4.1 Credit 39.4 73
4.1.1 Ease of getting credit* 70.0 44
4.1.2 Domestic credit to private sector, % GDP 59.9 55
4.1.3 Microfinance gross loans, % GDP 0.6 33
4.2 Investment 23.5 [97]
4.2.1 Ease of protecting minority investors* 42.0 102 ◇
4.2.2 Market capitalization, % GDP n/a n/a
4.2.3 Venture capital investors, deals/bn PPP$ GDP 0.0 58
4.2.4 Venture capital recipients, deals/bn PPP$ GDP n/a n/a
4.3 Trade, diversification, and market scale 58.4 98
4.3.1 Applied tariff rate, weighted avg., % 4.1 75
4.3.2 Domestic industry diversification 71.5 95 ○ ◇
4.3.3 Domestic market scale, bn PPP$ 40.8 110 ○ ◇
NOTES: ● indicates a strength; ○ a weakness; ◆ an income group strength; ◇ an income group weakness; * an index; †
a survey question. indicates that
the
economy’s data are older than the base year; see appendices for details, including the year of the data, at http://globalinnovationindex.org. Square
brackets [ ] indicate
that the data minimum coverage (DMC) requirements were not met at the sub-pillar or pillar level.](https://image.slidesharecdn.com/e-220805033615-e8521670/75/E-INDEX-2021-pdf-66-2048.jpg)
![47
GII 2021 Economy profiles
Australia GII 2021 rank
25
Output rank Input rank Income Region Population (mn) GDP, PPP$ (bn) GDP per capita, PPP$ GII 2020 rank
33 15 High SEAO 25.5 1,307.9 50,845 23
Score/
Value Rank
Business sophistication 43.0 26 ◇
5.1 Knowledge workers 52.2 [24]
5.1.1 Knowledge-intensive employment, % 46.1 17
5.1.2 Firms offering formal training, % n/a n/a
5.1.3 GERD performed by business, % GDP 0.9 22
5.1.4 GERD financed by business, % n/a n/a
5.1.5 Females employed w/advanced degrees, % 22.6 22
5.2 Innovation linkages 44.6 19
5.2.1 University-industry RD collaboration†
53.4 33 ◇
5.2.2 State of cluster development and depth†
55.3 34
5.2.3 GERD financed by abroad, % GDP n/a n/a
5.2.4 Joint venture/strategic alliance deals/bn PPP$ GDP 0.2 10
5.2.5 Patent families/bn PPP$ GDP 1.0 27 ◇
5.3 Knowledge absorption 32.2 52 ◇
5.3.1 Intellectual property payments, % total trade 1.1 33
5.3.2 High-tech imports, % total trade 10.2 30
5.3.3 ICT services imports, % total trade 1.1 67 ○ ◇
5.3.4 FDI net inflows, % GDP 3.6 37
5.3.5 Research talent, % in businesses 27.9 43 ◇
Knowledge and technology outputs 29.1 42 ◇
6.1 Knowledge creation 42.9 20
6.1.1 Patents by origin/bn PPP$ GDP 2.0 38 ◇
6.1.2 PCT patents by origin/bn PPP$ GDP 1.3 25 ◇
6.1.3 Utility models by origin/bn PPP$ GDP 0.7 28
6.1.4 Scientific and technical articles/bn PPP$ GDP 52.2 6 ●
6.1.5 Citable documents H-index 66.6 9 ●
6.2 Knowledge impact 31.6 59 ◇
6.2.1 Labor productivity growth, % −1.2 87 ○
6.2.2 New businesses/th pop. 15–64 14.5 9
6.2.3 Software spending, % GDP 0.2 61
6.2.4 ISO 9001 quality certificates/bn PPP$ GDP 5.7 49
6.2.5 High-tech manufacturing, % 24.6 50 ◇
6.3 Knowledge diffusion 12.8 78 ○ ◇
6.3.1 Intellectual property receipts, % total trade 0.3 29 ◇
6.3.2 Production and export complexity 31.6 86 ○ ◇
6.3.3 High-tech exports, % total trade 2.0 58 ◇
6.3.4 ICT services exports, % total trade 1.1 78 ○
Creative outputs 39.6 24
7.1 Intangible assets 41.7 37
7.1.1 Trademarks by origin/bn PPP$ GDP 58.2 38
7.1.2 Global brand value, top 5,000, % GDP 77.1 26
7.1.3 Industrial designs by origin/bn PPP$ GDP 2.3 43
7.1.4 ICTs and organizational model creation†
67.3 25 ◇
7.2 Creative goods and services 22.4 43 ◇
7.2.1 Cultural and creative services exports, % total trade 0.3 66 ○
7.2.2 National feature films/mn pop. 15–69 3.2 58 ○
7.2.3 Entertainment and media market/th pop. 15–69 62.4 6
7.2.4 Printing and other media, % manufacturing 2.0 15
7.2.5 Creative goods exports, % total trade 0.7 57
7.3 Online creativity 52.9 17
7.3.1 Generic top-level domains (TLDs)/th pop. 15–69 62.3 9 ●
7.3.2 Country-code TLDs/th pop. 15–69 54.6 15
7.3.3 Wikipedia edits/mn pop. 15–69 75.8 21
7.3.4 Mobile app creation/bn PPP$ GDP 15.1 33
Score/
Value Rank
Institutions 88.3 10
1.1 Political environment 85.0 15
1.1.1 Political and operational stability* 83.9 13
1.1.2 Government effectiveness* 85.6 14
1.2 Regulatory environment 92.3 10
1.2.1 Regulatory quality* 92.5 4 ●
1.2.2 Rule of law* 92.4 13
1.2.3 Cost of redundancy dismissal 12.0 38
1.3 Business environment 87.7 11
1.3.1 Ease of starting a business* 96.6 7 ●
1.3.2 Ease of resolving insolvency* 78.9 19
Human capital and research 57.4 12
2.1 Education 59.6 29
2.1.1 Expenditure on education, % GDP 5.1 35
2.1.2 Government funding/pupil, secondary, % GDP/cap 15.4 74 ○ ◇
2.1.3 School life expectancy, years 20.5 1 ● ◆
2.1.4 PISA scales in reading, maths and science 499.0 20
2.1.5 Pupil-teacher ratio, secondary n/a n/a
2.2 Tertiary education 54.3 6 ● ◆
2.2.1 Tertiary enrolment, % gross 107.8 3 ● ◆
2.2.2 Graduates in science and engineering, % 17.4 88 ○ ◇
2.2.3 Tertiary inbound mobility, % 26.5 4 ● ◆
2.3 Research and development (RD) 58.3 17
2.3.1 Researchers, FTE/mn pop. 4,532.4 21
2.3.2 Gross expenditure on RD, % GDP 1.8 20
2.3.3 Global corporate RD investors, top 3, mn US$ 65.3 18
2.3.4 QS university ranking, top 3* 77.9 7 ●
Infrastructure 55.7 20
3.1 Informationandcommunicationtechnologies(ICTs) 88.3 13
3.1.1 ICT access* 80.6 29
3.1.2 ICT use* 81.5 20
3.1.3 Government’s online service* 94.7 7 ●
3.1.4 E-participation* 96.4 9
3.2 General infrastructure 42.4 22
3.2.1 Electricity output, GWh/mn pop. 10,435.2 13
3.2.2 Logistics performance* 79.1 18
3.2.3 Gross capital formation, % GDP 22.0 66 ○
3.3 Ecological sustainability 36.4 41
3.3.1 GDP/unit of energy use 9.3 77 ○
3.3.2 Environmental performance* 74.9 13
3.3.3 ISO 14001 environmental certificates/bn PPP$ GDP 1.9 47
Market sophistication 66.4 9 ●
4.1 Credit 75.8 5 ● ◆
4.1.1 Ease of getting credit* 95.0 4 ● ◆
4.1.2 Domestic credit to private sector, % GDP 135.8 13
4.1.3 Microfinance gross loans, % GDP n/a n/a
4.2 Investment 38.2 39
4.2.1 Ease of protecting minority investors* 64.0 56
4.2.2 Market capitalization, % GDP 102.7 12
4.2.3 Venture capital investors, deals/bn PPP$ GDP 0.1 23
4.2.4 Venture capital recipients, deals/bn PPP$ GDP 0.1 19
4.3 Trade, diversification, and market scale 85.2 13
4.3.1 Applied tariff rate, weighted avg., % 0.8 8 ●
4.3.2 Domestic industry diversification 94.0 35
4.3.3 Domestic market scale, bn PPP$ 1,307.9 18
NOTES: ● indicates a strength; ○ a weakness; ◆ an income group strength; ◇ an income group weakness; * an index; †
a survey question. indicates that
the
economy’s data are older than the base year; see appendices for details, including the year of the data, at http://globalinnovationindex.org. Square
brackets [ ] indicate
that the data minimum coverage (DMC) requirements were not met at the sub-pillar or pillar level.](https://image.slidesharecdn.com/e-220805033615-e8521670/75/E-INDEX-2021-pdf-67-2048.jpg)
![48 Global Innovation Index 2021
Austria GII 2021 rank
18
Output rank Input rank Income Region Population (mn) GDP, PPP$ (bn) GDP per capita, PPP$ GII 2020 rank
24 16 High EUR 9.0 493.2 55,406 19
Score/
Value Rank
Business sophistication 52.3 15
5.1 Knowledge workers 60.4 17
5.1.1 Knowledge-intensive employment, % 42.0 24
5.1.2 Firms offering formal training, % n/a n/a
5.1.3 GERD performed by business, % GDP 2.2 7
5.1.4 GERD financed by business, % 53.6 22
5.1.5 Females employed w/advanced degrees, % 17.7 37 ◇
5.2 Innovation linkages 54.7 11
5.2.1 University-industry RD collaboration†
62.7 17
5.2.2 State of cluster development and depth†
65.0 14
5.2.3 GERD financed by abroad, % GDP 0.5 4 ● ◆
5.2.4 Joint venture/strategic alliance deals/bn PPP$ GDP 0.0 43 ◇
5.2.5 Patent families/bn PPP$ GDP 3.8 11
5.3 Knowledge absorption 41.9 25
5.3.1 Intellectual property payments, % total trade 0.8 47
5.3.2 High-tech imports, % total trade 7.8 61 ○
5.3.3 ICT services imports, % total trade 2.7 13
5.3.4 FDI net inflows, % GDP −1.6 126 ○
5.3.5 Research talent, % in businesses 63.0 7
Knowledge and technology outputs 40.3 19
6.1 Knowledge creation 46.5 18
6.1.1 Patents by origin/bn PPP$ GDP 8.5 12
6.1.2 PCT patents by origin/bn PPP$ GDP 3.1 11
6.1.3 Utility models by origin/bn PPP$ GDP 0.6 34 ○
6.1.4 Scientific and technical articles/bn PPP$ GDP 37.1 24
6.1.5 Citable documents H-index 44.1 18
6.2 Knowledge impact 38.5 29
6.2.1 Labor productivity growth, % −1.3 91 ○
6.2.2 New businesses/th pop. 15–64 0.6 91 ○ ◇
6.2.3 Software spending, % GDP 0.5 16
6.2.4 ISO 9001 quality certificates/bn PPP$ GDP 6.5 43
6.2.5 High-tech manufacturing, % 45.4 16
6.3 Knowledge diffusion 36.0 26
6.3.1 Intellectual property receipts, % total trade 0.6 25
6.3.2 Production and export complexity 85.7 6 ●
6.3.3 High-tech exports, % total trade 6.7 26
6.3.4 ICT services exports, % total trade 3.3 26
Creative outputs 39.0 27 ◇
7.1 Intangible assets 41.1 38
7.1.1 Trademarks by origin/bn PPP$ GDP 53.7 41
7.1.2 Global brand value, top 5,000, % GDP 52.6 35 ◇
7.1.3 Industrial designs by origin/bn PPP$ GDP 7.4 17
7.1.4 ICTs and organizational model creation†
64.9 29 ◇
7.2 Creative goods and services 26.2 34
7.2.1 Cultural and creative services exports, % total trade 1.2 23
7.2.2 National feature films/mn pop. 15–69 7.0 30
7.2.3 Entertainment and media market/th pop. 15–69 61.8 7
7.2.4 Printing and other media, % manufacturing 1.0 52 ○
7.2.5 Creative goods exports, % total trade 0.9 48
7.3 Online creativity 47.3 24
7.3.1 Generic top-level domains (TLDs)/th pop. 15–69 35.5 19
7.3.2 Country-code TLDs/th pop. 15–69 63.3 11
7.3.3 Wikipedia edits/mn pop. 15–69 73.8 26
7.3.4 Mobile app creation/bn PPP$ GDP 13.4 40
Score/
Value Rank
Institutions 86.2 16
1.1 Political environment 83.8 17
1.1.1 Political and operational stability* 83.9 13
1.1.2 Government effectiveness* 83.8 16
1.2 Regulatory environment 94.5 6 ●
1.2.1 Regulatory quality* 81.6 17
1.2.2 Rule of law* 96.3 7 ●
1.2.3 Cost of redundancy dismissal 8.0 1 ● ◆
1.3 Business environment 80.3 32
1.3.1 Ease of starting a business* 83.2 98 ○ ◇
1.3.2 Ease of resolving insolvency* 77.4 21
Human capital and research 59.9 7 ●
2.1 Education 62.5 19
2.1.1 Expenditure on education, % GDP 5.4 26
2.1.2 Government funding/pupil, secondary, % GDP/cap 27.1 12 ◆
2.1.3 School life expectancy, years 16.1 35
2.1.4 PISA scales in reading, maths and science 491.0 27
2.1.5 Pupil-teacher ratio, secondary 9.3 22 ◆
2.2 Tertiary education 58.8 4 ● ◆
2.2.1 Tertiary enrolment, % gross 86.7 14
2.2.2 Graduates in science and engineering, % 31.0 14 ◆
2.2.3 Tertiary inbound mobility, % 17.5 10
2.3 Research and development (RD) 58.3 16
2.3.1 Researchers, FTE/mn pop. 5,868.6 8 ●
2.3.2 Gross expenditure on RD, % GDP 3.2 5 ●
2.3.3 Global corporate RD investors, top 3, mn US$ 55.5 25
2.3.4 QS university ranking, top 3* 43.5 25
Infrastructure 60.0 7 ●
3.1 Informationandcommunicationtechnologies(ICTs) 89.5 11
3.1.1 ICT access* 87.3 14
3.1.2 ICT use* 78.2 26
3.1.3 Government’s online service* 94.7 7 ●
3.1.4 E-participation* 97.6 6 ●
3.2 General infrastructure 46.8 14
3.2.1 Electricity output, GWh/mn pop. 7,979.3 23
3.2.2 Logistics performance* 91.9 4 ●
3.2.3 Gross capital formation, % GDP 26.2 38
3.3 Ecological sustainability 43.8 26
3.3.1 GDP/unit of energy use 14.2 30
3.3.2 Environmental performance* 79.6 6 ●
3.3.3 ISO 14001 environmental certificates/bn PPP$ GDP 2.0 40
Market sophistication 51.9 40 ◇
4.1 Credit 44.9 50
4.1.1 Ease of getting credit* 55.0 88 ○
4.1.2 Domestic credit to private sector, % GDP 85.8 35
4.1.3 Microfinance gross loans, % GDP n/a n/a
4.2 Investment 28.5 71 ○ ◇
4.2.1 Ease of protecting minority investors* 70.0 36
4.2.2 Market capitalization, % GDP 30.6 46 ○ ◇
4.2.3 Venture capital investors, deals/bn PPP$ GDP 0.1 28 ◇
4.2.4 Venture capital recipients, deals/bn PPP$ GDP 0.0 41 ○ ◇
4.3 Trade, diversification, and market scale 82.2 22
4.3.1 Applied tariff rate, weighted avg., % 1.8 25
4.3.2 Domestic industry diversification 99.2 5 ●
4.3.3 Domestic market scale, bn PPP$ 493.2 41
NOTES: ● indicates a strength; ○ a weakness; ◆ an income group strength; ◇ an income group weakness; * an index; †
a survey question. indicates that
the
economy’s data are older than the base year; see appendices for details, including the year of the data, at http://globalinnovationindex.org. Square
brackets [ ] indicate
that the data minimum coverage (DMC) requirements were not met at the sub-pillar or pillar level.](https://image.slidesharecdn.com/e-220805033615-e8521670/75/E-INDEX-2021-pdf-68-2048.jpg)
![49
GII 2021 Economy profiles
Azerbaijan GII 2021 rank
80
Output rank Input rank Income Region Population (mn) GDP, PPP$ (bn) GDP per capita, PPP$ GII 2020 rank
91 74 Upper middle NAWA 10.1 146.5 14,499 82
Score/
Value Rank
Business sophistication 20.7 92
5.1 Knowledge workers 29.0 75
5.1.1 Knowledge-intensive employment, % 23.1 67
5.1.2 Firms offering formal training, % 33.9 43
5.1.3 GERD performed by business, % GDP 0.0 85 ○
5.1.4 GERD financed by business, % 30.8 58
5.1.5 Females employed w/advanced degrees, % 12.9 56
5.2 Innovation linkages 20.6 66
5.2.1 University-industry RD collaboration†
59.5 23 ● ◆
5.2.2 State of cluster development and depth†
58.3 27 ● ◆
5.2.3 GERD financed by abroad, % GDP 0.0 100 ○
5.2.4 Joint venture/strategic alliance deals/bn PPP$ GDP 0.0 87
5.2.5 Patent families/bn PPP$ GDP 0.0 81
5.3 Knowledge absorption 12.6 128 ○ ◇
5.3.1 Intellectual property payments, % total trade 0.0 124 ○ ◇
5.3.2 High-tech imports, % total trade 3.9 118
5.3.3 ICT services imports, % total trade 0.5 109
5.3.4 FDI net inflows, % GDP 4.4 25 ●
5.3.5 Research talent, % in businesses n/a n/a
Knowledge and technology outputs 10.5 115 ◇
6.1 Knowledge creation 7.5 92
6.1.1 Patents by origin/bn PPP$ GDP 1.3 56
6.1.2 PCT patents by origin/bn PPP$ GDP 0.0 76
6.1.3 Utility models by origin/bn PPP$ GDP 0.4 39
6.1.4 Scientific and technical articles/bn PPP$ GDP 5.9 106
6.1.5 Citable documents H-index 5.6 97
6.2 Knowledge impact 21.0 99
6.2.1 Labor productivity growth, % 0.9 47
6.2.2 New businesses/th pop. 15–64 1.7 62
6.2.3 Software spending, % GDP 0.1 96
6.2.4 ISO 9001 quality certificates/bn PPP$ GDP 1.6 94
6.2.5 High-tech manufacturing, % 15.1 74
6.3 Knowledge diffusion 3.0 126 ○ ◇
6.3.1 Intellectual property receipts, % total trade 0.0 113 ○ ◇
6.3.2 Production and export complexity 12.3 117 ○ ◇
6.3.3 High-tech exports, % total trade 0.1 114
6.3.4 ICT services exports, % total trade 0.3 112
Creative outputs 23.5 67
7.1 Intangible assets 34.3 54
7.1.1 Trademarks by origin/bn PPP$ GDP 26.0 80
7.1.2 Global brand value, top 5,000, % GDP n/a n/a
7.1.3 Industrial designs by origin/bn PPP$ GDP 0.9 74
7.1.4 ICTs and organizational model creation†
63.4 35 ● ◆
7.2 Creative goods and services 9.4 83
7.2.1 Cultural and creative services exports, % total trade 0.1 86
7.2.2 National feature films/mn pop. 15–69 7.4 27 ●
7.2.3 Entertainment and media market/th pop. 15–69 n/a n/a
7.2.4 Printing and other media, % manufacturing 1.1 49
7.2.5 Creative goods exports, % total trade 0.0 122 ○
7.3 Online creativity 15.7 72
7.3.1 Generic top-level domains (TLDs)/th pop. 15–69 0.9 96
7.3.2 Country-code TLDs/th pop. 15–69 1.4 77
7.3.3 Wikipedia edits/mn pop. 15–69 59.3 53
7.3.4 Mobile app creation/bn PPP$ GDP 0.0 96
Score/
Value Rank
Institutions 65.5 58
1.1 Political environment 54.9 77
1.1.1 Political and operational stability* 69.6 60
1.1.2 Government effectiveness* 47.6 83
1.2 Regulatory environment 61.6 77
1.2.1 Regulatory quality* 37.6 89
1.2.2 Rule of law* 31.5 100
1.2.3 Cost of redundancy dismissal 13.7 51
1.3 Business environment 79.8 33 ● ◆
1.3.1 Ease of starting a business* 96.2 9 ● ◆
1.3.2 Ease of resolving insolvency* 63.5 43
Human capital and research 24.2 89
2.1 Education 42.7 84
2.1.1 Expenditure on education, % GDP 2.5 106 ◇
2.1.2 Government funding/pupil, secondary, % GDP/cap n/a n/a
2.1.3 School life expectancy, years 13.5 78
2.1.4 PISA scales in reading, maths and science 402.2 65
2.1.5 Pupil-teacher ratio, secondary 7.8 8 ● ◆
2.2 Tertiary education 28.7 76
2.2.1 Tertiary enrolment, % gross 31.5 83
2.2.2 Graduates in science and engineering, % 25.9 35 ●
2.2.3 Tertiary inbound mobility, % 2.2 74
2.3 Research and development (RD) 1.2 104
2.3.1 Researchers, FTE/mn pop. n/a n/a
2.3.2 Gross expenditure on RD, % GDP 0.2 93
2.3.3 Global corporate RD investors, top 3, mn US$ 0.0 41 ○ ◇
2.3.4 QS university ranking, top 3* 0.0 74 ○ ◇
Infrastructure 35.1 88
3.1 Informationandcommunicationtechnologies(ICTs) 66.6 67
3.1.1 ICT access* 68.6 64
3.1.2 ICT use* 58.0 65
3.1.3 Government’s online service* 70.6 65
3.1.4 E-participation* 69.0 73
3.2 General infrastructure 12.0 127 ○ ◇
3.2.1 Electricity output, GWh/mn pop. 2,537.6 73
3.2.2 Logistics performance* n/a n/a
3.2.3 Gross capital formation, % GDP 14.4 118 ○ ◇
3.3 Ecological sustainability 26.8 75
3.3.1 GDP/unit of energy use 11.8 51
3.3.2 Environmental performance* 46.5 66
3.3.3 ISO 14001 environmental certificates/bn PPP$ GDP 0.4 90
Market sophistication 53.2 36 ●
4.1 Credit 49.7 33 ● ◆
4.1.1 Ease of getting credit* 100.0 1 ● ◆
4.1.2 Domestic credit to private sector, % GDP 23.1 110 ◇
4.1.3 Microfinance gross loans, % GDP 1.9 13 ●
4.2 Investment 50.0 [19]
4.2.1 Ease of protecting minority investors* 50.0 92
4.2.2 Market capitalization, % GDP n/a n/a
4.2.3 Venture capital investors, deals/bn PPP$ GDP n/a n/a
4.2.4 Venture capital recipients, deals/bn PPP$ GDP n/a n/a
4.3 Trade, diversification, and market scale 59.8 95
4.3.1 Applied tariff rate, weighted avg., % 12.0 125 ○ ◇
4.3.2 Domestic industry diversification 83.8 71
4.3.3 Domestic market scale, bn PPP$ 146.5 73
NOTES: ● indicates a strength; ○ a weakness; ◆ an income group strength; ◇ an income group weakness; * an index; †
a survey question. indicates that
the
economy’s data are older than the base year; see appendices for details, including the year of the data, at http://globalinnovationindex.org. Square
brackets [ ] indicate
that the data minimum coverage (DMC) requirements were not met at the sub-pillar or pillar level.](https://image.slidesharecdn.com/e-220805033615-e8521670/75/E-INDEX-2021-pdf-69-2048.jpg)
![50 Global Innovation Index 2021
Bahrain GII 2021 rank
78
Output rank Input rank Income Region Population (mn) GDP, PPP$ (bn) GDP per capita, PPP$ GII 2020 rank
99 63 High NAWA 1.7 74.2 49,057 79
Score/
Value Rank
Business sophistication 21.1 90 ◇
5.1 Knowledge workers 19.9 [101]
5.1.1 Knowledge-intensive employment, % 21.9 72 ◇
5.1.2 Firms offering formal training, % n/a n/a
5.1.3 GERD performed by business, % GDP 0.0 82 ○ ◇
5.1.4 GERD financed by business, % 21.8 65 ◇
5.1.5 Females employed w/advanced degrees, % n/a n/a
5.2 Innovation linkages 30.5 33 ●
5.2.1 University-industry RD collaboration†
38.2 87 ◇
5.2.2 State of cluster development and depth†
56.3 33 ●
5.2.3 GERD financed by abroad, % GDP 0.0 74
5.2.4 Joint venture/strategic alliance deals/bn PPP$ GDP 0.2 9 ● ◆
5.2.5 Patent families/bn PPP$ GDP 0.0 76
5.3 Knowledge absorption 12.9 126 ○ ◇
5.3.1 Intellectual property payments, % total trade n/a n/a
5.3.2 High-tech imports, % total trade 5.2 109
5.3.3 ICT services imports, % total trade 0.4 113 ◇
5.3.4 FDI net inflows, % GDP 1.4 98
5.3.5 Research talent, % in businesses 0.4 83 ○ ◇
Knowledge and technology outputs 15.8 82 ◇
6.1 Knowledge creation 3.4 121 ○ ◇
6.1.1 Patents by origin/bn PPP$ GDP 0.1 113
6.1.2 PCT patents by origin/bn PPP$ GDP 0.0 85
6.1.3 Utility models by origin/bn PPP$ GDP n/a n/a
6.1.4 Scientific and technical articles/bn PPP$ GDP 4.7 113 ◇
6.1.5 Citable documents H-index 4.4 112 ◇
6.2 Knowledge impact 26.2 80 ◇
6.2.1 Labor productivity growth, % −0.2 71
6.2.2 New businesses/th pop. 15–64 3.1 44
6.2.3 Software spending, % GDP 0.3 30 ●
6.2.4 ISO 9001 quality certificates/bn PPP$ GDP 5.7 48
6.2.5 High-tech manufacturing, % 9.8 89 ◇
6.3 Knowledge diffusion 17.8 61
6.3.1 Intellectual property receipts, % total trade 0.0 114 ○ ◇
6.3.2 Production and export complexity 50.9 48
6.3.3 High-tech exports, % total trade 0.4 94 ◇
6.3.4 ICT services exports, % total trade 3.1 33 ●
Creative outputs 14.8 106 ◇
7.1 Intangible assets 18.8 107 ◇
7.1.1 Trademarks by origin/bn PPP$ GDP 4.5 125 ○ ◇
7.1.2 Global brand value, top 5,000, % GDP 17.0 51
7.1.3 Industrial designs by origin/bn PPP$ GDP 0.1 110 ○
7.1.4 ICTs and organizational model creation†
58.2 51
7.2 Creative goods and services 6.7 [95]
7.2.1 Cultural and creative services exports, % total trade 0.0 113 ○ ◇
7.2.2 National feature films/mn pop. 15–69 n/a n/a
7.2.3 Entertainment and media market/th pop. 15–69 8.1 39 ◇
7.2.4 Printing and other media, % manufacturing n/a n/a
7.2.5 Creative goods exports, % total trade 0.8 50
7.3 Online creativity 14.9 74 ◇
7.3.1 Generic top-level domains (TLDs)/th pop. 15–69 4.2 57
7.3.2 Country-code TLDs/th pop. 15–69 0.4 101 ◇
7.3.3 Wikipedia edits/mn pop. 15–69 54.5 58 ◇
7.3.4 Mobile app creation/bn PPP$ GDP 0.0 93
Score/
Value Rank
Institutions 69.4 49
1.1 Political environment 60.8 56 ◇
1.1.1 Political and operational stability* 67.9 71 ◇
1.1.2 Government effectiveness* 57.3 55 ◇
1.2 Regulatory environment 73.4 40
1.2.1 Regulatory quality* 56.2 51 ◇
1.2.2 Rule of law* 59.7 45
1.2.3 Cost of redundancy dismissal 13.6 49
1.3 Business environment 73.9 56
1.3.1 Ease of starting a business* 89.6 57
1.3.2 Ease of resolving insolvency* 58.2 55
Human capital and research 26.3 83 ◇
2.1 Education 44.1 81 ◇
2.1.1 Expenditure on education, % GDP 2.3 108 ○ ◇
2.1.2 Government funding/pupil, secondary, % GDP/cap 17.5 62
2.1.3 School life expectancy, years 16.3 28 ●
2.1.4 PISA scales in reading, maths and science n/a n/a
2.1.5 Pupil-teacher ratio, secondary 10.4 32 ●
2.2 Tertiary education 30.5 73 ◇
2.2.1 Tertiary enrolment, % gross 55.6 53
2.2.2 Graduates in science and engineering, % 15.6 96 ◇
2.2.3 Tertiary inbound mobility, % 14.2 12 ●
2.3 Research and development (RD) 4.2 82 ◇
2.3.1 Researchers, FTE/mn pop. 369.0 73 ◇
2.3.2 Gross expenditure on RD, % GDP 0.1 105 ○ ◇
2.3.3 Global corporate RD investors, top 3, mn US$ 0.0 41 ○ ◇
2.3.4 QS university ranking, top 3* 10.9 64
Infrastructure 50.5 38
3.1 Informationandcommunicationtechnologies(ICTs) 77.7 41
3.1.1 ICT access* 83.4 23 ●
3.1.2 ICT use* 71.3 45
3.1.3 Government’s online service* 78.8 45
3.1.4 E-participation* 77.4 51
3.2 General infrastructure 50.3 10 ● ◆
3.2.1 Electricity output, GWh/mn pop. 18,831.1 3 ● ◆
3.2.2 Logistics performance* 41.2 58 ◇
3.2.3 Gross capital formation, % GDP 33.6 15 ● ◆
3.3 Ecological sustainability 23.5 84 ◇
3.3.1 GDP/unit of energy use 4.9 116 ○ ◇
3.3.2 Environmental performance* 51.0 54 ◇
3.3.3 ISO 14001 environmental certificates/bn PPP$ GDP 1.8 48
Market sophistication 44.3 78
4.1 Credit 42.3 58
4.1.1 Ease of getting credit* 55.0 88
4.1.2 Domestic credit to private sector, % GDP 73.9 44
4.1.3 Microfinance gross loans, % GDP n/a n/a
4.2 Investment 29.3 70
4.2.1 Ease of protecting minority investors* 66.0 50
4.2.2 Market capitalization, % GDP 63.0 25
4.2.3 Venture capital investors, deals/bn PPP$ GDP 0.1 33
4.2.4 Venture capital recipients, deals/bn PPP$ GDP 0.0 40
4.3 Trade, diversification, and market scale 61.4 88 ◇
4.3.1 Applied tariff rate, weighted avg., % 3.5 68
4.3.2 Domestic industry diversification 70.9 96
4.3.3 Domestic market scale, bn PPP$ 74.2 92
NOTES: ● indicates a strength; ○ a weakness; ◆ an income group strength; ◇ an income group weakness; * an index; †
a survey question. indicates that
the
economy’s data are older than the base year; see appendices for details, including the year of the data, at http://globalinnovationindex.org. Square
brackets [ ] indicate
that the data minimum coverage (DMC) requirements were not met at the sub-pillar or pillar level.](https://image.slidesharecdn.com/e-220805033615-e8521670/75/E-INDEX-2021-pdf-70-2048.jpg)
![51
GII 2021 Economy profiles
Bangladesh GII 2021 rank
116
Output rank Input rank Income Region Population (mn) GDP, PPP$ (bn) GDP per capita, PPP$ GII 2020 rank
113 121 Lower middle CSA 164.7 864.9 5,139 116
Score/
Value Rank
Business sophistication 15.4 122
5.1 Knowledge workers 12.9 [119]
5.1.1 Knowledge-intensive employment, % 8.3 113
5.1.2 Firms offering formal training, % 21.9 70
5.1.3 GERD performed by business, % GDP n/a n/a
5.1.4 GERD financed by business, % n/a n/a
5.1.5 Females employed w/advanced degrees, % 1.3 112
5.2 Innovation linkages 17.0 96
5.2.1 University-industry RD collaboration†
25.9 123 ○ ◇
5.2.2 State of cluster development and depth†
42.4 91
5.2.3 GERD financed by abroad, % GDP n/a n/a
5.2.4 Joint venture/strategic alliance deals/bn PPP$ GDP 0.0 86
5.2.5 Patent families/bn PPP$ GDP 0.0 100 ○ ◇
5.3 Knowledge absorption 16.3 109
5.3.1 Intellectual property payments, % total trade 0.1 107
5.3.2 High-tech imports, % total trade 8.1 59 ●
5.3.3 ICT services imports, % total trade 0.2 128 ○ ◇
5.3.4 FDI net inflows, % GDP 0.7 113
5.3.5 Research talent, % in businesses n/a n/a
Knowledge and technology outputs 13.7 92
6.1 Knowledge creation 6.3 [99]
6.1.1 Patents by origin/bn PPP$ GDP 0.1 115
6.1.2 PCT patents by origin/bn PPP$ GDP n/a n/a
6.1.3 Utility models by origin/bn PPP$ GDP n/a n/a
6.1.4 Scientific and technical articles/bn PPP$ GDP 4.7 112
6.1.5 Citable documents H-index 11.8 65 ●
6.2 Knowledge impact 27.8 71 ●
6.2.1 Labor productivity growth, % 6.9 2 ● ◆
6.2.2 New businesses/th pop. 15–64 0.0 120 ○
6.2.3 Software spending, % GDP 0.2 74
6.2.4 ISO 9001 quality certificates/bn PPP$ GDP 0.7 117
6.2.5 High-tech manufacturing, % 9.4 91
6.3 Knowledge diffusion 7.0 111
6.3.1 Intellectual property receipts, % total trade 0.0 104
6.3.2 Production and export complexity 23.5 105
6.3.3 High-tech exports, % total trade 0.2 105
6.3.4 ICT services exports, % total trade 1.0 83
Creative outputs 9.6 123 ◇
7.1 Intangible assets 15.0 119
7.1.1 Trademarks by origin/bn PPP$ GDP 9.3 114
7.1.2 Global brand value, top 5,000, % GDP 1.0 79
7.1.3 Industrial designs by origin/bn PPP$ GDP 1.7 51 ●
7.1.4 ICTs and organizational model creation†
42.1 108
7.2 Creative goods and services 1.6 121 ◇
7.2.1 Cultural and creative services exports, % total trade 0.2 73
7.2.2 National feature films/mn pop. 15–69 0.3 102
7.2.3 Entertainment and media market/th pop. 15–69 n/a n/a
7.2.4 Printing and other media, % manufacturing 0.2 101 ○
7.2.5 Creative goods exports, % total trade 0.1 108
7.3 Online creativity 6.9 115
7.3.1 Generic top-level domains (TLDs)/th pop. 15–69 0.4 113
7.3.2 Country-code TLDs/th pop. 15–69 0.0 122
7.3.3 Wikipedia edits/mn pop. 15–69 29.4 107
7.3.4 Mobile app creation/bn PPP$ GDP 0.7 76
Score/
Value Rank
Institutions 45.5 122
1.1 Political environment 41.9 111
1.1.1 Political and operational stability* 57.1 106
1.1.2 Government effectiveness* 34.2 113
1.2 Regulatory environment 39.5 122
1.2.1 Regulatory quality* 19.2 125 ◇
1.2.2 Rule of law* 30.0 104
1.2.3 Cost of redundancy dismissal 31.0 121
1.3 Business environment 55.3 117
1.3.1 Ease of starting a business* 82.4 101
1.3.2 Ease of resolving insolvency* 28.1 123
Human capital and research 10.1 128 ○ ◇
2.1 Education 15.2 129 ○ ◇
2.1.1 Expenditure on education, % GDP 1.3 114 ○ ◇
2.1.2 Government funding/pupil, secondary, % GDP/cap 8.6 94
2.1.3 School life expectancy, years 12.0 92
2.1.4 PISA scales in reading, maths and science n/a n/a
2.1.5 Pupil-teacher ratio, secondary 38.6 122 ○ ◇
2.2 Tertiary education 10.7 112
2.2.1 Tertiary enrolment, % gross 24.0 93
2.2.2 Graduates in science and engineering, % 11.1 106 ○ ◇
2.2.3 Tertiary inbound mobility, % n/a n/a
2.3 Research and development (RD) 4.4 [80]
2.3.1 Researchers, FTE/mn pop. n/a n/a
2.3.2 Gross expenditure on RD, % GDP n/a n/a
2.3.3 Global corporate RD investors, top 3, mn US$ 0.0 41 ○ ◇
2.3.4 QS university ranking, top 3* 8.8 67 ●
Infrastructure 32.0 95
3.1 Informationandcommunicationtechnologies(ICTs) 46.3 97
3.1.1 ICT access* 42.1 103
3.1.2 ICT use* 24.7 108
3.1.3 Government’s online service* 61.2 86
3.1.4 E-participation* 57.1 91
3.2 General infrastructure 24.5 86
3.2.1 Electricity output, GWh/mn pop. 487.2 109
3.2.2 Logistics performance* 24.6 96
3.2.3 Gross capital formation, % GDP 27.7 29 ●
3.3 Ecological sustainability 25.1 81
3.3.1 GDP/unit of energy use 16.0 17 ● ◆
3.3.2 Environmental performance* 29.0 124 ◇
3.3.3 ISO 14001 environmental certificates/bn PPP$ GDP 0.2 109
Market sophistication 40.9 95
4.1 Credit 30.0 106
4.1.1 Ease of getting credit* 45.0 101
4.1.2 Domestic credit to private sector, % GDP 45.3 76
4.1.3 Microfinance gross loans, % GDP 1.4 22 ●
4.2 Investment 23.7 96
4.2.1 Ease of protecting minority investors* 60.0 71 ●
4.2.2 Market capitalization, % GDP 31.5 44
4.2.3 Venture capital investors, deals/bn PPP$ GDP n/a n/a
4.2.4 Venture capital recipients, deals/bn PPP$ GDP 0.0 91 ○ ◇
4.3 Trade, diversification, and market scale 69.1 65 ●
4.3.1 Applied tariff rate, weighted avg., % 8.6 108
4.3.2 Domestic industry diversification 79.9 80
4.3.3 Domestic market scale, bn PPP$ 864.9 30 ● ◆
NOTES: ● indicates a strength; ○ a weakness; ◆ an income group strength; ◇ an income group weakness; * an index; †
a survey question. indicates that
the
economy’s data are older than the base year; see appendices for details, including the year of the data, at http://globalinnovationindex.org. Square
brackets [ ] indicate
that the data minimum coverage (DMC) requirements were not met at the sub-pillar or pillar level.](https://image.slidesharecdn.com/e-220805033615-e8521670/75/E-INDEX-2021-pdf-71-2048.jpg)
![52 Global Innovation Index 2021
Belarus GII 2021 rank
62
Output rank Input rank Income Region Population (mn) GDP, PPP$ (bn) GDP per capita, PPP$ GII 2020 rank
62 68 Upper middle EUR 9.4 185.9 19,759 64
Score/
Value Rank
Business sophistication 24.4 69
5.1 Knowledge workers 47.7 28 ◆
5.1.1 Knowledge-intensive employment, % 40.6 26 ◆
5.1.2 Firms offering formal training, % 31.5 49
5.1.3 GERD performed by business, % GDP 0.4 42
5.1.4 GERD financed by business, % 45.0 34
5.1.5 Females employed w/advanced degrees, % 32.6 1 ● ◆
5.2 Innovation linkages 5.3[128]
5.2.1 University-industry RD collaboration†
n/a n/a
5.2.2 State of cluster development and depth†
n/a n/a
5.2.3 GERD financed by abroad, % GDP 0.1 44
5.2.4 Joint venture/strategic alliance deals/bn PPP$ GDP 0.0 111 ○
5.2.5 Patent families/bn PPP$ GDP 0.1 52
5.3 Knowledge absorption 20.2 91
5.3.1 Intellectual property payments, % total trade 0.4 74
5.3.2 High-tech imports, % total trade 6.4 91
5.3.3 ICT services imports, % total trade 1.0 81
5.3.4 FDI net inflows, % GDP 2.2 73
5.3.5 Research talent, % in businesses n/a n/a
Knowledge and technology outputs 30.3 37
6.1 Knowledge creation 16.9 61
6.1.1 Patents by origin/bn PPP$ GDP 2.2 33
6.1.2 PCT patents by origin/bn PPP$ GDP 0.1 70
6.1.3 Utility models by origin/bn PPP$ GDP 1.5 16 ●
6.1.4 Scientific and technical articles/bn PPP$ GDP 7.0 102
6.1.5 Citable documents H-index 10.6 72
6.2 Knowledge impact 43.6 16 ● ◆
6.2.1 Labor productivity growth, % 1.2 38
6.2.2 New businesses/th pop. 15–64 1.3 74
6.2.3 Software spending, % GDP 0.0 103 ◇
6.2.4 ISO 9001 quality certificates/bn PPP$ GDP 34.1 3 ● ◆
6.2.5 High-tech manufacturing, % 28.4 44
6.3 Knowledge diffusion 30.3 34 ◆
6.3.1 Intellectual property receipts, % total trade 0.2 44
6.3.2 Production and export complexity 64.4 29 ◆
6.3.3 High-tech exports, % total trade 1.8 62
6.3.4 ICT services exports, % total trade 5.7 11 ● ◆
Creative outputs 17.0 93
7.1 Intangible assets 9.8 129 ○ ◇
7.1.1 Trademarks by origin/bn PPP$ GDP 26.1 79
7.1.2 Global brand value, top 5,000, % GDP 0.0 80 ○ ◇
7.1.3 Industrial designs by origin/bn PPP$ GDP 1.7 52
7.1.4 ICTs and organizational model creation†
n/a n/a
7.2 Creative goods and services 6.0 100
7.2.1 Cultural and creative services exports, % total trade 0.4 56
7.2.2 National feature films/mn pop. 15–69 0.1 106 ○ ◇
7.2.3 Entertainment and media market/th pop. 15–69 n/a n/a
7.2.4 Printing and other media, % manufacturing 0.5 90 ○ ◇
7.2.5 Creative goods exports, % total trade 0.5 62
7.3 Online creativity 42.6 26 ◆
7.3.1 Generic top-level domains (TLDs)/th pop. 15–69 1.7 83
7.3.2 Country-code TLDs/th pop. 15–69 5.8 49
7.3.3 Wikipedia edits/mn pop. 15–69 61.4 49
7.3.4 Mobile app creation/bn PPP$ GDP 100.0 1 ● ◆
Score/
Value Rank
Institutions 57.8 85
1.1 Political environment 50.1 89
1.1.1 Political and operational stability* 57.1 106 ○
1.1.2 Government effectiveness* 46.6 85
1.2 Regulatory environment 50.2 103
1.2.1 Regulatory quality* 29.3 104 ◇
1.2.2 Rule of law* 25.8 112 ○ ◇
1.2.3 Cost of redundancy dismissal 21.7 93
1.3 Business environment 73.2 58
1.3.1 Ease of starting a business* 93.5 28
1.3.2 Ease of resolving insolvency* 52.9 68
Human capital and research 42.1 38 ◆
2.1 Education 63.2 16 ● ◆
2.1.1 Expenditure on education, % GDP 4.8 47
2.1.2 Government funding/pupil, secondary, % GDP/cap 35.7 5 ● ◆
2.1.3 School life expectancy, years 15.4 46
2.1.4 PISA scales in reading, maths and science 472.3 36 ◆
2.1.5 Pupil-teacher ratio, secondary 8.6 17 ● ◆
2.2 Tertiary education 54.0 7 ● ◆
2.2.1 Tertiary enrolment, % gross 87.4 12 ● ◆
2.2.2 Graduates in science and engineering, % 33.2 11 ● ◆
2.2.3 Tertiary inbound mobility, % 4.3 55
2.3 Research and development (RD) 9.1 64
2.3.1 Researchers, FTE/mn pop. n/a n/a
2.3.2 Gross expenditure on RD, % GDP 0.6 57
2.3.3 Global corporate RD investors, top 3, mn US$ 0.0 41 ○ ◇
2.3.4 QS university ranking, top 3* 15.3 58
Infrastructure 43.4 59
3.1 Informationandcommunicationtechnologies(ICTs) 77.1 44 ◆
3.1.1 ICT access* 86.5 16 ● ◆
3.1.2 ICT use* 76.3 33 ◆
3.1.3 Government’s online service* 70.6 65
3.1.4 E-participation* 75.0 57
3.2 General infrastructure 26.6 74
3.2.1 Electricity output, GWh/mn pop. 4,110.3 55
3.2.2 Logistics performance* 24.5 99 ◇
3.2.3 Gross capital formation, % GDP 26.3 37
3.3 Ecological sustainability 26.5 77
3.3.1 GDP/unit of energy use 6.7 103 ○ ◇
3.3.2 Environmental performance* 53.0 47
3.3.3 ISO 14001 environmental certificates/bn PPP$ GDP 2.0 41
Market sophistication 39.8 101 ◇
4.1 Credit 24.1 118 ○ ◇
4.1.1 Ease of getting credit* 50.0 94 ◇
4.1.2 Domestic credit to private sector, % GDP 29.4 96
4.1.3 Microfinance gross loans, % GDP 0.0 83 ○ ◇
4.2 Investment 20.6 112 ○
4.2.1 Ease of protecting minority investors* 58.0 77
4.2.2 Market capitalization, % GDP n/a n/a
4.2.3 Venture capital investors, deals/bn PPP$ GDP 0.0 86 ○
4.2.4 Venture capital recipients, deals/bn PPP$ GDP 0.0 69
4.3 Trade, diversification, and market scale 74.7 45
4.3.1 Applied tariff rate, weighted avg., % 2.8 60
4.3.2 Domestic industry diversification 93.1 41
4.3.3 Domestic market scale, bn PPP$ 185.9 67
NOTES: ● indicates a strength; ○ a weakness; ◆ an income group strength; ◇ an income group weakness; * an index; †
a survey question. indicates that
the
economy’s data are older than the base year; see appendices for details, including the year of the data, at http://globalinnovationindex.org. Square
brackets [ ] indicate
that the data minimum coverage (DMC) requirements were not met at the sub-pillar or pillar level.](https://image.slidesharecdn.com/e-220805033615-e8521670/75/E-INDEX-2021-pdf-72-2048.jpg)
![53
GII 2021 Economy profiles
Belgium GII 2021 rank
22
Output rank Input rank Income Region Population (mn) GDP, PPP$ (bn) GDP per capita, PPP$ GII 2020 rank
26 21 High EUR 11.6 575.8 50,114 22
Score/
Value Rank
Business sophistication 51.7 16
5.1 Knowledge workers 69.3 6 ●
5.1.1 Knowledge-intensive employment, % 47.6 13
5.1.2 Firms offering formal training, % 57.8 9 ●
5.1.3 GERD performed by business, % GDP 2.0 9
5.1.4 GERD financed by business, % 63.5 9 ●
5.1.5 Females employed w/advanced degrees, % 25.4 14
5.2 Innovation linkages 47.1 16
5.2.1 University-industry RD collaboration†
70.1 7 ●
5.2.2 State of cluster development and depth†
64.3 16
5.2.3 GERD financed by abroad, % GDP 0.3 7 ●
5.2.4 Joint venture/strategic alliance deals/bn PPP$ GDP 0.1 27
5.2.5 Patent families/bn PPP$ GDP 2.5 14
5.3 Knowledge absorption 38.7 31
5.3.1 Intellectual property payments, % total trade 0.8 51
5.3.2 High-tech imports, % total trade 9.0 44
5.3.3 ICT services imports, % total trade 2.4 24
5.3.4 FDI net inflows, % GDP −6.9 129 ○ ◇
5.3.5 Research talent, % in businesses 56.7 17
Knowledge and technology outputs 42.3 17
6.1 Knowledge creation 50.5 15
6.1.1 Patents by origin/bn PPP$ GDP 5.3 17
6.1.2 PCT patents by origin/bn PPP$ GDP 2.3 17
6.1.3 Utility models by origin/bn PPP$ GDP n/a n/a
6.1.4 Scientific and technical articles/bn PPP$ GDP 40.0 19
6.1.5 Citable documents H-index 53.8 14
6.2 Knowledge impact 37.1 34
6.2.1 Labor productivity growth, % −2.0 100 ○
6.2.2 New businesses/th pop. 15–64 3.4 40
6.2.3 Software spending, % GDP 0.5 6 ●
6.2.4 ISO 9001 quality certificates/bn PPP$ GDP 4.9 56
6.2.5 High-tech manufacturing, % 40.4 26
6.3 Knowledge diffusion 39.2 22
6.3.1 Intellectual property receipts, % total trade 1.0 20
6.3.2 Production and export complexity 71.1 21
6.3.3 High-tech exports, % total trade 9.5 16
6.3.4 ICT services exports, % total trade 3.3 27
Creative outputs 35.1 36 ◇
7.1 Intangible assets 34.5 52 ◇
7.1.1 Trademarks by origin/bn PPP$ GDP 32.3 72 ○
7.1.2 Global brand value, top 5,000, % GDP 54.6 33
7.1.3 Industrial designs by origin/bn PPP$ GDP 2.2 44
7.1.4 ICTs and organizational model creation†
72.2 16
7.2 Creative goods and services 29.0 27
7.2.1 Cultural and creative services exports, % total trade 1.3 19
7.2.2 National feature films/mn pop. 15–69 10.9 16
7.2.3 Entertainment and media market/th pop. 15–69 51.7 15
7.2.4 Printing and other media, % manufacturing 0.9 59 ○
7.2.5 Creative goods exports, % total trade 1.5 36
7.3 Online creativity 42.2 27
7.3.1 Generic top-level domains (TLDs)/th pop. 15–69 21.1 27
7.3.2 Country-code TLDs/th pop. 15–69 63.1 12
7.3.3 Wikipedia edits/mn pop. 15–69 78.0 14
7.3.4 Mobile app creation/bn PPP$ GDP 2.8 66 ○ ◇
Score/
Value Rank
Institutions 80.8 23
1.1 Political environment 75.8 32 ◇
1.1.1 Political and operational stability* 80.4 29
1.1.2 Government effectiveness* 73.6 31 ◇
1.2 Regulatory environment 78.4 32
1.2.1 Regulatory quality* 77.2 22
1.2.2 Rule of law* 82.7 21
1.2.3 Cost of redundancy dismissal 19.7 83 ○
1.3 Business environment 88.2 8 ●
1.3.1 Ease of starting a business* 92.3 44
1.3.2 Ease of resolving insolvency* 84.1 9 ●
Human capital and research 59.7 8 ●
2.1 Education 82.0 2 ● ◆
2.1.1 Expenditure on education, % GDP 6.4 9 ●
2.1.2 Government funding/pupil, secondary, % GDP/cap n/a n/a
2.1.3 School life expectancy, years 19.6 4 ● ◆
2.1.4 PISA scales in reading, maths and science 499.9 19
2.1.5 Pupil-teacher ratio, secondary 8.9 20 ◆
2.2 Tertiary education 36.6 52
2.2.1 Tertiary enrolment, % gross 78.9 22
2.2.2 Graduates in science and engineering, % 17.0 90 ○ ◇
2.2.3 Tertiary inbound mobility, % 10.5 20
2.3 Research and development (RD) 60.4 13
2.3.1 Researchers, FTE/mn pop. 5,425.4 12
2.3.2 Gross expenditure on RD, % GDP 2.9 10 ●
2.3.3 Global corporate RD investors, top 3, mn US$ 65.6 17
2.3.4 QS university ranking, top 3* 53.2 17
Infrastructure 52.0 35 ◇
3.1 Informationandcommunicationtechnologies(ICTs) 74.0 51 ◇
3.1.1 ICT access* 83.3 25
3.1.2 ICT use* 81.2 23
3.1.3 Government’s online service* 65.9 76 ○ ◇
3.1.4 E-participation* 65.5 77 ○ ◇
3.2 General infrastructure 45.8 17
3.2.1 Electricity output, GWh/mn pop. 8,089.5 21
3.2.2 Logistics performance* 92.5 3 ●
3.2.3 Gross capital formation, % GDP 24.7 50
3.3 Ecological sustainability 36.2 44
3.3.1 GDP/unit of energy use 10.0 68
3.3.2 Environmental performance* 73.3 15
3.3.3 ISO 14001 environmental certificates/bn PPP$ GDP 1.6 53
Market sophistication 54.1 33
4.1 Credit 46.5 45
4.1.1 Ease of getting credit* 65.0 61 ○
4.1.2 Domestic credit to private sector, % GDP 70.1 47 ◇
4.1.3 Microfinance gross loans, % GDP n/a n/a
4.2 Investment 35.4 48
4.2.1 Ease of protecting minority investors* 68.0 44
4.2.2 Market capitalization, % GDP 75.2 22
4.2.3 Venture capital investors, deals/bn PPP$ GDP 0.1 24
4.2.4 Venture capital recipients, deals/bn PPP$ GDP 0.1 26
4.3 Trade, diversification, and market scale 80.3 27
4.3.1 Applied tariff rate, weighted avg., % 1.8 25
4.3.2 Domestic industry diversification 93.0 42
4.3.3 Domestic market scale, bn PPP$ 575.8 36
NOTES: ● indicates a strength; ○ a weakness; ◆ an income group strength; ◇ an income group weakness; * an index; †
a survey question. indicates that
the
economy’s data are older than the base year; see appendices for details, including the year of the data, at http://globalinnovationindex.org. Square
brackets [ ] indicate
that the data minimum coverage (DMC) requirements were not met at the sub-pillar or pillar level.](https://image.slidesharecdn.com/e-220805033615-e8521670/75/E-INDEX-2021-pdf-73-2048.jpg)
![54 Global Innovation Index 2021
Benin GII 2021 rank
128
Output rank Input rank Income Region Population (mn) GDP, PPP$ (bn) GDP per capita, PPP$ GII 2020 rank
132 113 Lower middle SSF 12.1 41.8 3,443 126
Score/
Value Rank
Business sophistication 17.0 113
5.1 Knowledge workers 13.5 [115]
5.1.1 Knowledge-intensive employment, % n/a n/a
5.1.2 Firms offering formal training, % 20.0 78
5.1.3 GERD performed by business, % GDP n/a n/a
5.1.4 GERD financed by business, % n/a n/a
5.1.5 Females employed w/advanced degrees, % 0.8 116
5.2 Innovation linkages 17.7 89
5.2.1 University-industry RD collaboration†
39.0 83
5.2.2 State of cluster development and depth†
38.8 106
5.2.3 GERD financed by abroad, % GDP n/a n/a
5.2.4 Joint venture/strategic alliance deals/bn PPP$ GDP 0.0 95
5.2.5 Patent families/bn PPP$ GDP 0.0 100 ○ ◇
5.3 Knowledge absorption 19.7 93
5.3.1 Intellectual property payments, % total trade 0.0 121 ○ ◇
5.3.2 High-tech imports, % total trade 3.3 123
5.3.3 ICT services imports, % total trade 2.9 10 ● ◆
5.3.4 FDI net inflows, % GDP 1.5 93
5.3.5 Research talent, % in businesses n/a n/a
Knowledge and technology outputs 2.7 131 ○ ◇
6.1 Knowledge creation 4.8 113
6.1.1 Patents by origin/bn PPP$ GDP 0.1 104
6.1.2 PCT patents by origin/bn PPP$ GDP 0.0 87
6.1.3 Utility models by origin/bn PPP$ GDP 0.0 76 ○ ◇
6.1.4 Scientific and technical articles/bn PPP$ GDP 10.5 82 ●
6.1.5 Citable documents H-index 4.7 109
6.2 Knowledge impact 3.1[130]
6.2.1 Labor productivity growth, % n/a n/a
6.2.2 New businesses/th pop. 15–64 0.5 94
6.2.3 Software spending, % GDP 0.1 98
6.2.4 ISO 9001 quality certificates/bn PPP$ GDP 1.1 104
6.2.5 High-tech manufacturing, % n/a n/a
6.3 Knowledge diffusion 0.3 132 ○ ◇
6.3.1 Intellectual property receipts, % total trade 0.0 100
6.3.2 Production and export complexity n/a n/a
6.3.3 High-tech exports, % total trade 0.0 127 ○
6.3.4 ICT services exports, % total trade 0.1 128 ○
Creative outputs 8.5 128 ○ ◇
7.1 Intangible assets 11.9 127 ◇
7.1.1 Trademarks by origin/bn PPP$ GDP 5.0 122
7.1.2 Global brand value, top 5,000, % GDP 0.0 80 ○ ◇
7.1.3 Industrial designs by origin/bn PPP$ GDP 0.0 117
7.1.4 ICTs and organizational model creation†
39.2 115
7.2 Creative goods and services 0.3 [131]
7.2.1 Cultural and creative services exports, % total trade 0.0 98
7.2.2 National feature films/mn pop. 15–69 n/a n/a
7.2.3 Entertainment and media market/th pop. 15–69 n/a n/a
7.2.4 Printing and other media, % manufacturing n/a n/a
7.2.5 Creative goods exports, % total trade 0.0 130 ○
7.3 Online creativity 9.8 94
7.3.1 Generic top-level domains (TLDs)/th pop. 15–69 0.6 103
7.3.2 Country-code TLDs/th pop. 15–69 0.0 126
7.3.3 Wikipedia edits/mn pop. 15–69 31.5 99
7.3.4 Mobile app creation/bn PPP$ GDP n/a n/a
Score/
Value Rank
Institutions 58.5 84
1.1 Political environment 47.5 96
1.1.1 Political and operational stability* 60.7 97
1.1.2 Government effectiveness* 40.9 96
1.2 Regulatory environment 62.1 76 ●
1.2.1 Regulatory quality* 33.7 97
1.2.2 Rule of law* 29.2 106
1.2.3 Cost of redundancy dismissal 11.6 37 ●
1.3 Business environment 65.8 81 ●
1.3.1 Ease of starting a business* 90.6 55 ●
1.3.2 Ease of resolving insolvency* 41.0 95
Human capital and research 17.3 111
2.1 Education 33.1 109
2.1.1 Expenditure on education, % GDP 2.9 99
2.1.2 Government funding/pupil, secondary, % GDP/cap 7.9 97 ◇
2.1.3 School life expectancy, years 12.6 86
2.1.4 PISA scales in reading, maths and science n/a n/a
2.1.5 Pupil-teacher ratio, secondary 11.0 39 ● ◆
2.2 Tertiary education 19.0 97
2.2.1 Tertiary enrolment, % gross 12.5 109
2.2.2 Graduates in science and engineering, % 20.9 68 ●
2.2.3 Tertiary inbound mobility, % 4.5 52 ● ◆
2.3 Research and development (RD) 0.0[123]
2.3.1 Researchers, FTE/mn pop. n/a n/a
2.3.2 Gross expenditure on RD, % GDP n/a n/a
2.3.3 Global corporate RD investors, top 3, mn US$ 0.0 41 ○ ◇
2.3.4 QS university ranking, top 3* 0.0 74 ○ ◇
Infrastructure 25.1 118
3.1 Informationandcommunicationtechnologies(ICTs) 37.4 114
3.1.1 ICT access* 31.6 122 ◇
3.1.2 ICT use* 12.0 127 ◇
3.1.3 Government’s online service* 51.2 104
3.1.4 E-participation* 54.8 94
3.2 General infrastructure 25.1 81 ●
3.2.1 Electricity output, GWh/mn pop. 17.6 124 ○ ◇
3.2.2 Logistics performance* 32.7 75 ●
3.2.3 Gross capital formation, % GDP 26.6 36 ●
3.3 Ecological sustainability 13.0 131 ○ ◇
3.3.1 GDP/unit of energy use 5.0 115 ◇
3.3.2 Environmental performance* 30.0 120
3.3.3 ISO 14001 environmental certificates/bn PPP$ GDP 0.1 126
Market sophistication 33.6 123
4.1 Credit 19.5 124 ◇
4.1.1 Ease of getting credit* 30.0 122 ◇
4.1.2 Domestic credit to private sector, % GDP 17.6 116
4.1.3 Microfinance gross loans, % GDP 1.5 19 ●
4.2 Investment 42.0 [28]
4.2.1 Ease of protecting minority investors* 42.0 102
4.2.2 Market capitalization, % GDP n/a n/a
4.2.3 Venture capital investors, deals/bn PPP$ GDP n/a n/a
4.2.4 Venture capital recipients, deals/bn PPP$ GDP n/a n/a
4.3 Trade, diversification, and market scale 39.2 126 ◇
4.3.1 Applied tariff rate, weighted avg., % 9.9 116
4.3.2 Domestic industry diversification n/a n/a
4.3.3 Domestic market scale, bn PPP$ 41.8 107
NOTES: ● indicates a strength; ○ a weakness; ◆ an income group strength; ◇ an income group weakness; * an index; †
a survey question. indicates that
the
economy’s data are older than the base year; see appendices for details, including the year of the data, at http://globalinnovationindex.org. Square
brackets [ ] indicate
that the data minimum coverage (DMC) requirements were not met at the sub-pillar or pillar level.](https://image.slidesharecdn.com/e-220805033615-e8521670/75/E-INDEX-2021-pdf-74-2048.jpg)
![55
GII 2021 Economy profiles
Bolivia (Plurinational State of) GII 2021 rank
104
Output rank Input rank Income Region Population (mn) GDP, PPP$ (bn) GDP per capita, PPP$ GII 2020 rank
111 95 Lower middle LCN 11.7 97.8 8,342 105
Score/
Value Rank
Business sophistication 23.7 75
5.1 Knowledge workers 37.4 [48]
5.1.1 Knowledge-intensive employment, % 15.8 92
5.1.2 Firms offering formal training, % 49.9 18 ● ◆
5.1.3 GERD performed by business, % GDP n/a n/a
5.1.4 GERD financed by business, % n/a n/a
5.1.5 Females employed w/advanced degrees, % 7.7 81
5.2 Innovation linkages 13.4 117
5.2.1 University-industry RD collaboration†
24.1 125 ○ ◇
5.2.2 State of cluster development and depth†
32.0 120 ◇
5.2.3 GERD financed by abroad, % GDP n/a n/a
5.2.4 Joint venture/strategic alliance deals/bn PPP$ GDP 0.0 107
5.2.5 Patent families/bn PPP$ GDP 0.0 100 ○ ◇
5.3 Knowledge absorption 20.3 90
5.3.1 Intellectual property payments, % total trade 0.8 60 ●
5.3.2 High-tech imports, % total trade 10.8 24 ●
5.3.3 ICT services imports, % total trade 0.7 91
5.3.4 FDI net inflows, % GDP 0.7 116
5.3.5 Research talent, % in businesses 0.4 84 ○
Knowledge and technology outputs 11.1 112
6.1 Knowledge creation 4.6 114
6.1.1 Patents by origin/bn PPP$ GDP 0.6 76
6.1.2 PCT patents by origin/bn PPP$ GDP n/a n/a
6.1.3 Utility models by origin/bn PPP$ GDP 0.1 54
6.1.4 Scientific and technical articles/bn PPP$ GDP 3.1 121
6.1.5 Citable documents H-index 6.7 93
6.2 Knowledge impact 22.0 93
6.2.1 Labor productivity growth, % 0.5 57 ●
6.2.2 New businesses/th pop. 15–64 0.5 98
6.2.3 Software spending, % GDP 0.3 44 ●
6.2.4 ISO 9001 quality certificates/bn PPP$ GDP 2.2 86
6.2.5 High-tech manufacturing, % 7.7 94
6.3 Knowledge diffusion 6.6 112
6.3.1 Intellectual property receipts, % total trade 0.1 51 ●
6.3.2 Production and export complexity 19.8 111
6.3.3 High-tech exports, % total trade 0.4 93
6.3.4 ICT services exports, % total trade 0.8 88
Creative outputs 13.4 111
7.1 Intangible assets 17.7 110
7.1.1 Trademarks by origin/bn PPP$ GDP 37.0 63 ●
7.1.2 Global brand value, top 5,000, % GDP 0.0 80 ○ ◇
7.1.3 Industrial designs by origin/bn PPP$ GDP 0.2 105
7.1.4 ICTs and organizational model creation†
31.7 122 ○ ◇
7.2 Creative goods and services 9.5 82
7.2.1 Cultural and creative services exports, % total trade 0.2 72
7.2.2 National feature films/mn pop. 15–69 0.8 88
7.2.3 Entertainment and media market/th pop. 15–69 n/a n/a
7.2.4 Printing and other media, % manufacturing 1.0 54
7.2.5 Creative goods exports, % total trade 1.0 44 ●
7.3 Online creativity 8.8 102
7.3.1 Generic top-level domains (TLDs)/th pop. 15–69 1.8 82
7.3.2 Country-code TLDs/th pop. 15–69 0.5 98
7.3.3 Wikipedia edits/mn pop. 15–69 35.1 93
7.3.4 Mobile app creation/bn PPP$ GDP 0.0 95
Score/
Value Rank
Institutions 37.8 131 ○ ◇
1.1 Political environment 40.1 119
1.1.1 Political and operational stability* 50.0 123 ○ ◇
1.1.2 Government effectiveness* 35.1 112
1.2 Regulatory environment 17.4 132 ○ ◇
1.2.1 Regulatory quality* 17.5 127 ○ ◇
1.2.2 Rule of law* 17.2 128 ○ ◇
1.2.3 Cost of redundancy dismissal n/a n/a
1.3 Business environment 55.8 116
1.3.1 Ease of starting a business* 69.4 126 ○ ◇
1.3.2 Ease of resolving insolvency* 42.3 92
Human capital and research 34.0 [55]
2.1 Education 67.5 [10]
2.1.1 Expenditure on education, % GDP n/a n/a
2.1.2 Government funding/pupil, secondary, % GDP/cap n/a n/a
2.1.3 School life expectancy, years n/a n/a
2.1.4 PISA scales in reading, maths and science n/a n/a
2.1.5 Pupil-teacher ratio, secondary 18.5 90
2.2 Tertiary education n/a [n/a]
2.2.1 Tertiary enrolment, % gross n/a n/a
2.2.2 Graduates in science and engineering, % n/a n/a
2.2.3 Tertiary inbound mobility, % n/a n/a
2.3 Research and development (RD) 0.6 110
2.3.1 Researchers, FTE/mn pop. 163.8 82
2.3.2 Gross expenditure on RD, % GDP n/a n/a
2.3.3 Global corporate RD investors, top 3, mn US$ 0.0 41 ○ ◇
2.3.4 QS university ranking, top 3* 0.0 74 ○ ◇
Infrastructure 29.1 106
3.1 Informationandcommunicationtechnologies(ICTs) 51.6 94
3.1.1 ICT access* 42.4 101
3.1.2 ICT use* 46.0 89
3.1.3 Government’s online service* 58.2 90
3.1.4 E-participation* 59.5 87
3.2 General infrastructure 12.5 126 ○ ◇
3.2.1 Electricity output, GWh/mn pop. 870.5 101
3.2.2 Logistics performance* 14.5 117
3.2.3 Gross capital formation, % GDP 16.0 110 ◇
3.3 Ecological sustainability 23.1 85
3.3.1 GDP/unit of energy use 9.0 81
3.3.2 Environmental performance* 44.3 77 ◆
3.3.3 ISO 14001 environmental certificates/bn PPP$ GDP 0.5 83
Market sophistication 48.4 59 ●
4.1 Credit 45.4 47 ●
4.1.1 Ease of getting credit* 35.0 118 ◇
4.1.2 Domestic credit to private sector, % GDP 71.2 46 ●
4.1.3 Microfinance gross loans, % GDP 28.5 1 ● ◆
4.2 Investment 38.0 [40]
4.2.1 Ease of protecting minority investors* 38.0 115
4.2.2 Market capitalization, % GDP n/a n/a
4.2.3 Venture capital investors, deals/bn PPP$ GDP n/a n/a
4.2.4 Venture capital recipients, deals/bn PPP$ GDP n/a n/a
4.3 Trade, diversification, and market scale 61.7 87
4.3.1 Applied tariff rate, weighted avg., % 4.7 81
4.3.2 Domestic industry diversification 72.3 93
4.3.3 Domestic market scale, bn PPP$ 97.8 85
NOTES: ● indicates a strength; ○ a weakness; ◆ an income group strength; ◇ an income group weakness; * an index; †
a survey question. indicates that
the
economy’s data are older than the base year; see appendices for details, including the year of the data, at http://globalinnovationindex.org. Square
brackets [ ] indicate
that the data minimum coverage (DMC) requirements were not met at the sub-pillar or pillar level.](https://image.slidesharecdn.com/e-220805033615-e8521670/75/E-INDEX-2021-pdf-75-2048.jpg)
![56 Global Innovation Index 2021
Bosnia and Herzegovina GII 2021 rank
75
Output rank Input rank Income Region Population (mn) GDP, PPP$ (bn) GDP per capita, PPP$ GII 2020 rank
80 70 Upper middle EUR 3.3 48.8 14,895 74
Score/
Value Rank
Business sophistication 18.8 99 ◇
5.1 Knowledge workers 29.2 74
5.1.1 Knowledge-intensive employment, % 21.8 73
5.1.2 Firms offering formal training, % 37.9 34
5.1.3 GERD performed by business, % GDP 0.1 65
5.1.4 GERD financed by business, % 36.1 53
5.1.5 Females employed w/advanced degrees, % 6.2 89 ◇
5.2 Innovation linkages 12.4 122 ○ ◇
5.2.1 University-industry RD collaboration†
26.8 119 ○ ◇
5.2.2 State of cluster development and depth†
35.4 114 ○ ◇
5.2.3 GERD financed by abroad, % GDP 0.0 72
5.2.4 Joint venture/strategic alliance deals/bn PPP$ GDP 0.0 83
5.2.5 Patent families/bn PPP$ GDP 0.0 82
5.3 Knowledge absorption 14.9 118 ○ ◇
5.3.1 Intellectual property payments, % total trade 0.1 104
5.3.2 High-tech imports, % total trade 5.6 104
5.3.3 ICT services imports, % total trade 0.5 108
5.3.4 FDI net inflows, % GDP 2.6 68
5.3.5 Research talent, % in businesses 12.0 61
Knowledge and technology outputs 20.7 66
6.1 Knowledge creation 9.3 83
6.1.1 Patents by origin/bn PPP$ GDP 0.9 68
6.1.2 PCT patents by origin/bn PPP$ GDP 0.1 58
6.1.3 Utility models by origin/bn PPP$ GDP n/a n/a
6.1.4 Scientific and technical articles/bn PPP$ GDP 13.1 67
6.1.5 Citable documents H-index 5.0 105
6.2 Knowledge impact 33.4 50
6.2.1 Labor productivity growth, % −0.8 78
6.2.2 New businesses/th pop. 15–64 1.1 83
6.2.3 Software spending, % GDP 0.1 92
6.2.4 ISO 9001 quality certificates/bn PPP$ GDP 27.0 5 ● ◆
6.2.5 High-tech manufacturing, % 14.2 77
6.3 Knowledge diffusion 19.3 56
6.3.1 Intellectual property receipts, % total trade 0.2 39 ◆
6.3.2 Production and export complexity 59.4 37 ●
6.3.3 High-tech exports, % total trade 2.6 51
6.3.4 ICT services exports, % total trade 1.7 65
Creative outputs 15.9 99 ◇
7.1 Intangible assets 16.4 115 ○ ◇
7.1.1 Trademarks by origin/bn PPP$ GDP 19.1 93
7.1.2 Global brand value, top 5,000, % GDP 0.0 80 ○ ◇
7.1.3 Industrial designs by origin/bn PPP$ GDP 1.6 53
7.1.4 ICTs and organizational model creation†
39.0 116 ○ ◇
7.2 Creative goods and services 12.2 73
7.2.1 Cultural and creative services exports, % total trade 0.1 75
7.2.2 National feature films/mn pop. 15–69 8.4 24 ● ◆
7.2.3 Entertainment and media market/th pop. 15–69 n/a n/a
7.2.4 Printing and other media, % manufacturing 1.1 44
7.2.5 Creative goods exports, % total trade 0.4 66
7.3 Online creativity 18.6 61
7.3.1 Generic top-level domains (TLDs)/th pop. 15–69 2.8 68
7.3.2 Country-code TLDs/th pop. 15–69 2.9 62
7.3.3 Wikipedia edits/mn pop. 15–69 66.5 43 ◆
7.3.4 Mobile app creation/bn PPP$ GDP 0.1 88 ○
Score/
Value Rank
Institutions 59.5 82
1.1 Political environment 45.8 102 ◇
1.1.1 Political and operational stability* 64.3 80
1.1.2 Government effectiveness* 36.6 106 ◇
1.2 Regulatory environment 68.5 54
1.2.1 Regulatory quality* 38.4 84
1.2.2 Rule of law* 40.6 74
1.2.3 Cost of redundancy dismissal 9.2 24 ●
1.3 Business environment 64.1 88
1.3.1 Ease of starting a business* 60.0 131 ○ ◇
1.3.2 Ease of resolving insolvency* 68.2 34 ●
Human capital and research 31.4 68
2.1 Education 60.7 [25]
2.1.1 Expenditure on education, % GDP n/a n/a
2.1.2 Government funding/pupil, secondary, % GDP/cap n/a n/a
2.1.3 School life expectancy, years n/a n/a
2.1.4 PISA scales in reading, maths and science 402.6 63
2.1.5 Pupil-teacher ratio, secondary 8.8 18 ●
2.2 Tertiary education 31.2 71
2.2.1 Tertiary enrolment, % gross 40.2 74
2.2.2 Graduates in science and engineering, % 23.5 49
2.2.3 Tertiary inbound mobility, % 7.1 36 ● ◆
2.3 Research and development (RD) 2.2 91
2.3.1 Researchers, FTE/mn pop. 460.2 71
2.3.2 Gross expenditure on RD, % GDP 0.2 91
2.3.3 Global corporate RD investors, top 3, mn US$ 0.0 41 ○ ◇
2.3.4 QS university ranking, top 3* 0.0 74 ○ ◇
Infrastructure 45.7 52
3.1 Informationandcommunicationtechnologies(ICTs) 59.3 84
3.1.1 ICT access* 71.3 58
3.1.2 ICT use* 51.6 79
3.1.3 Government’s online service* 53.5 97 ◇
3.1.4 E-participation* 60.7 85
3.2 General infrastructure 25.3 78
3.2.1 Electricity output, GWh/mn pop. 5,733.8 38 ● ◆
3.2.2 Logistics performance* 35.4 71
3.2.3 Gross capital formation, % GDP 19.8 88
3.3 Ecological sustainability 52.4 5 ● ◆
3.3.1 GDP/unit of energy use 6.0 106 ○ ◇
3.3.2 Environmental performance* 45.4 70
3.3.3 ISO 14001 environmental certificates/bn PPP$ GDP 16.2 1 ● ◆
Market sophistication 49.3 51
4.1 Credit 37.6 79
4.1.1 Ease of getting credit* 65.0 61
4.1.2 Domestic credit to private sector, % GDP 58.1 59
4.1.3 Microfinance gross loans, % GDP 0.7 29
4.2 Investment 56.0 [15]
4.2.1 Ease of protecting minority investors* 56.0 82
4.2.2 Market capitalization, % GDP n/a n/a
4.2.3 Venture capital investors, deals/bn PPP$ GDP n/a n/a
4.2.4 Venture capital recipients, deals/bn PPP$ GDP n/a n/a
4.3 Trade, diversification, and market scale 54.3 110 ◇
4.3.1 Applied tariff rate, weighted avg., % 17.9 132 ○ ◇
4.3.2 Domestic industry diversification 97.7 13 ●
4.3.3 Domestic market scale, bn PPP$ 48.8 103
NOTES: ● indicates a strength; ○ a weakness; ◆ an income group strength; ◇ an income group weakness; * an index; †
a survey question. indicates that
the
economy’s data are older than the base year; see appendices for details, including the year of the data, at http://globalinnovationindex.org. Square
brackets [ ] indicate
that the data minimum coverage (DMC) requirements were not met at the sub-pillar or pillar level.](https://image.slidesharecdn.com/e-220805033615-e8521670/75/E-INDEX-2021-pdf-76-2048.jpg)
![57
GII 2021 Economy profiles
Botswana GII 2021 rank
106
Output rank Input rank Income Region Population (mn) GDP, PPP$ (bn) GDP per capita, PPP$ GII 2020 rank
109 98 Upper middle SSF 2.4 39.1 16,153 89
Score/
Value Rank
Business sophistication 24.0 73
5.1 Knowledge workers 33.7 59
5.1.1 Knowledge-intensive employment, % 24.2 63
5.1.2 Firms offering formal training, % 51.9 16 ●
5.1.3 GERD performed by business, % GDP 0.1 64
5.1.4 GERD financed by business, % 17.7 70
5.1.5 Females employed w/advanced degrees, % 18.8 35 ●
5.2 Innovation linkages 18.5 77
5.2.1 University-industry RD collaboration†
40.0 76
5.2.2 State of cluster development and depth†
39.1 103
5.2.3 GERD financed by abroad, % GDP 0.1 36 ● ◆
5.2.4 Joint venture/strategic alliance deals/bn PPP$ GDP 0.0 61
5.2.5 Patent families/bn PPP$ GDP 0.0 100 ○ ◇
5.3 Knowledge absorption 19.9 92
5.3.1 Intellectual property payments, % total trade 1.5 24 ●
5.3.2 High-tech imports, % total trade 6.0 96
5.3.3 ICT services imports, % total trade 0.6 99
5.3.4 FDI net inflows, % GDP 1.5 94
5.3.5 Research talent, % in businesses 1.0 79 ◇
Knowledge and technology outputs 12.1 101
6.1 Knowledge creation 7.5 93
6.1.1 Patents by origin/bn PPP$ GDP 0.0 121 ○
6.1.2 PCT patents by origin/bn PPP$ GDP 0.0 98 ○ ◇
6.1.3 Utility models by origin/bn PPP$ GDP 0.4 40
6.1.4 Scientific and technical articles/bn PPP$ GDP 12.4 69
6.1.5 Citable documents H-index 5.4 100
6.2 Knowledge impact 22.2 92
6.2.1 Labor productivity growth, % −4.4 118 ○ ◇
6.2.2 New businesses/th pop. 15–64 20.1 3 ● ◆
6.2.3 Software spending, % GDP 0.1 85
6.2.4 ISO 9001 quality certificates/bn PPP$ GDP 0.4 126 ○
6.2.5 High-tech manufacturing, % n/a n/a
6.3 Knowledge diffusion 6.5 113
6.3.1 Intellectual property receipts, % total trade 0.0 96
6.3.2 Production and export complexity 32.7 83
6.3.3 High-tech exports, % total trade 0.3 100
6.3.4 ICT services exports, % total trade 0.2 121 ○
Creative outputs 12.6 112 ◇
7.1 Intangible assets 15.1 118 ◇
7.1.1 Trademarks by origin/bn PPP$ GDP 14.2 102 ◇
7.1.2 Global brand value, top 5,000, % GDP 0.0 80 ○ ◇
7.1.3 Industrial designs by origin/bn PPP$ GDP 0.4 94
7.1.4 ICTs and organizational model creation†
41.9 109 ◇
7.2 Creative goods and services 1.7[120]
7.2.1 Cultural and creative services exports, % total trade 0.1 93
7.2.2 National feature films/mn pop. 15–69 n/a n/a
7.2.3 Entertainment and media market/th pop. 15–69 n/a n/a
7.2.4 Printing and other media, % manufacturing n/a n/a
7.2.5 Creative goods exports, % total trade 0.2 87
7.3 Online creativity 18.6 62
7.3.1 Generic top-level domains (TLDs)/th pop. 15–69 1.1 94
7.3.2 Country-code TLDs/th pop. 15–69 1.3 80
7.3.3 Wikipedia edits/mn pop. 15–69 53.0 60
7.3.4 Mobile app creation/bn PPP$ GDP n/a n/a
Score/
Value Rank
Institutions 65.1 59
1.1 Political environment 66.9 44 ● ◆
1.1.1 Political and operational stability* 80.4 29 ● ◆
1.1.2 Government effectiveness* 60.2 47
1.2 Regulatory environment 66.1 62
1.2.1 Regulatory quality* 53.2 54
1.2.2 Rule of law* 59.9 44 ● ◆
1.2.3 Cost of redundancy dismissal 20.3 86
1.3 Business environment 62.2 95
1.3.1 Ease of starting a business* 76.2 117
1.3.2 Ease of resolving insolvency* 48.2 76
Human capital and research 8.3 130 ○ ◇
2.1 Education n/a [n/a]
2.1.1 Expenditure on education, % GDP n/a n/a
2.1.2 Government funding/pupil, secondary, % GDP/cap n/a n/a
2.1.3 School life expectancy, years n/a n/a
2.1.4 PISA scales in reading, maths and science n/a n/a
2.1.5 Pupil-teacher ratio, secondary n/a n/a
2.2 Tertiary education 13.5 107 ◇
2.2.1 Tertiary enrolment, % gross 25.1 91 ◇
2.2.2 Graduates in science and engineering, % n/a n/a
2.2.3 Tertiary inbound mobility, % 2.3 73
2.3 Research and development (RD) 3.2 86
2.3.1 Researchers, FTE/mn pop. 185.2 81
2.3.2 Gross expenditure on RD, % GDP 0.5 63
2.3.3 Global corporate RD investors, top 3, mn US$ 0.0 41 ○ ◇
2.3.4 QS university ranking, top 3* 0.0 74 ○ ◇
Infrastructure 33.4 93 ◇
3.1 Informationandcommunicationtechnologies(ICTs) 43.3 103 ◇
3.1.1 ICT access* 55.2 85
3.1.2 ICT use* 44.5 93
3.1.3 Government’s online service* 36.5 119 ◇
3.1.4 E-participation* 36.9 116 ◇
3.2 General infrastructure 29.9 62
3.2.1 Electricity output, GWh/mn pop. 1,401.1 92 ◇
3.2.2 Logistics performance* n/a n/a
3.2.3 Gross capital formation, % GDP 31.7 22 ● ◆
3.3 Ecological sustainability 26.9 73
3.3.1 GDP/unit of energy use 14.0 31 ●
3.3.2 Environmental performance* 40.4 87 ◇
3.3.3 ISO 14001 environmental certificates/bn PPP$ GDP 0.3 101
Market sophistication 36.8 113 ◇
4.1 Credit 35.9 82
4.1.1 Ease of getting credit* 60.0 74
4.1.2 Domestic credit to private sector, % GDP 32.8 93
4.1.3 Microfinance gross loans, % GDP n/a n/a
4.2 Investment 32.5 [59]
4.2.1 Ease of protecting minority investors* 60.0 71
4.2.2 Market capitalization, % GDP n/a n/a
4.2.3 Venture capital investors, deals/bn PPP$ GDP 0.0 59
4.2.4 Venture capital recipients, deals/bn PPP$ GDP n/a n/a
4.3 Trade, diversification, and market scale 42.1 123 ○ ◇
4.3.1 Applied tariff rate, weighted avg., % 1.0 10 ●
4.3.2 Domestic industry diversification 22.3 111 ○ ◇
4.3.3 Domestic market scale, bn PPP$ 39.1 113 ◇
NOTES: ● indicates a strength; ○ a weakness; ◆ an income group strength; ◇ an income group weakness; * an index; †
a survey question. indicates that
the
economy’s data are older than the base year; see appendices for details, including the year of the data, at http://globalinnovationindex.org. Square
brackets [ ] indicate
that the data minimum coverage (DMC) requirements were not met at the sub-pillar or pillar level.](https://image.slidesharecdn.com/e-220805033615-e8521670/75/E-INDEX-2021-pdf-77-2048.jpg)
![58 Global Innovation Index 2021
Brazil GII 2021 rank
57
Output rank Input rank Income Region Population (mn) GDP, PPP$ (bn) GDP per capita, PPP$ GII 2020 rank
59 56 Upper middle LCN 212.6 3,078.9 14,563 62
Score/
Value Rank
Business sophistication 36.0 34 ◆
5.1 Knowledge workers 46.1 [30]
5.1.1 Knowledge-intensive employment, % 25.2 58
5.1.2 Firms offering formal training, % n/a n/a
5.1.3 GERD performed by business, % GDP n/a n/a
5.1.4 GERD financed by business, % 43.5 35
5.1.5 Females employed w/advanced degrees, % 15.3 46
5.2 Innovation linkages 21.4 61
5.2.1 University-industry RD collaboration†
39.0 81
5.2.2 State of cluster development and depth†
49.4 49
5.2.3 GERD financed by abroad, % GDP n/a n/a
5.2.4 Joint venture/strategic alliance deals/bn PPP$ GDP 0.0 89 ○
5.2.5 Patent families/bn PPP$ GDP 0.1 56
5.3 Knowledge absorption 40.4 28 ● ◆
5.3.1 Intellectual property payments, % total trade 2.1 14 ● ◆
5.3.2 High-tech imports, % total trade 10.5 28 ●
5.3.3 ICT services imports, % total trade 2.2 30 ● ◆
5.3.4 FDI net inflows, % GDP 3.7 34
5.3.5 Research talent, % in businesses 26.6 46
Knowledge and technology outputs 25.3 51
6.1 Knowledge creation 23.0 46
6.1.1 Patents by origin/bn PPP$ GDP 1.7 41
6.1.2 PCT patents by origin/bn PPP$ GDP 0.2 47
6.1.3 Utility models by origin/bn PPP$ GDP 0.9 26
6.1.4 Scientific and technical articles/bn PPP$ GDP 18.8 47
6.1.5 Citable documents H-index 37.6 24 ● ◆
6.2 Knowledge impact 35.5 40
6.2.1 Labor productivity growth, % 1.3 35
6.2.2 New businesses/th pop. 15–64 1.3 76
6.2.3 Software spending, % GDP 0.3 29 ◆
6.2.4 ISO 9001 quality certificates/bn PPP$ GDP 5.6 54
6.2.5 High-tech manufacturing, % 36.3 32
6.3 Knowledge diffusion 17.4 62
6.3.1 Intellectual property receipts, % total trade 0.3 33 ◆
6.3.2 Production and export complexity 48.8 49
6.3.3 High-tech exports, % total trade 3.7 44
6.3.4 ICT services exports, % total trade 1.0 82
Creative outputs 23.5 66
7.1 Intangible assets 35.3 51
7.1.1 Trademarks by origin/bn PPP$ GDP 67.9 27 ●
7.1.2 Global brand value, top 5,000, % GDP 36.1 41
7.1.3 Industrial designs by origin/bn PPP$ GDP 1.3 59
7.1.4 ICTs and organizational model creation†
52.6 69
7.2 Creative goods and services 6.8 94 ○
7.2.1 Cultural and creative services exports, % total trade 0.5 48
7.2.2 National feature films/mn pop. 15–69 1.1 84 ○
7.2.3 Entertainment and media market/th pop. 15–69 7.8 40
7.2.4 Printing and other media, % manufacturing 0.5 86 ○
7.2.5 Creative goods exports, % total trade 0.3 70
7.3 Online creativity 16.7 69
7.3.1 Generic top-level domains (TLDs)/th pop. 15–69 1.6 87
7.3.2 Country-code TLDs/th pop. 15–69 8.6 42
7.3.3 Wikipedia edits/mn pop. 15–69 42.8 81
7.3.4 Mobile app creation/bn PPP$ GDP 15.0 37
Score/
Value Rank
Institutions 60.6 78
1.1 Political environment 53.0 85
1.1.1 Political and operational stability* 66.1 74
1.1.2 Government effectiveness* 46.5 86
1.2 Regulatory environment 62.8 74
1.2.1 Regulatory quality* 38.9 82
1.2.2 Rule of law* 42.0 72
1.2.3 Cost of redundancy dismissal 15.4 60
1.3 Business environment 65.9 80
1.3.1 Ease of starting a business* 81.3 106 ○
1.3.2 Ease of resolving insolvency* 50.4 69
Human capital and research 37.5 48
2.1 Education 55.4 48
2.1.1 Expenditure on education, % GDP 6.3 11 ● ◆
2.1.2 Government funding/pupil, secondary, % GDP/cap 21.8 35
2.1.3 School life expectancy, years 15.7 42
2.1.4 PISA scales in reading, maths and science 400.0 68 ○
2.1.5 Pupil-teacher ratio, secondary 16.6 81
2.2 Tertiary education 25.1 85
2.2.1 Tertiary enrolment, % gross 53.3 58
2.2.2 Graduates in science and engineering, % 18.4 83 ○
2.2.3 Tertiary inbound mobility, % 0.2 104 ○ ◇
2.3 Research and development (RD) 31.9 36 ◆
2.3.1 Researchers, FTE/mn pop. 887.7 53
2.3.2 Gross expenditure on RD, % GDP 1.2 34 ◆
2.3.3 Global corporate RD investors, top 3, mn US$ 52.7 26 ● ◆
2.3.4 QS university ranking, top 3* 40.9 31 ◆
Infrastructure 41.2 69
3.1 Informationandcommunicationtechnologies(ICTs) 74.5 49
3.1.1 ICT access* 58.9 77
3.1.2 ICT use* 61.5 60
3.1.3 Government’s online service* 87.1 20 ● ◆
3.1.4 E-participation* 90.5 18 ● ◆
3.2 General infrastructure 20.5 107 ○
3.2.1 Electricity output, GWh/mn pop. 2,967.7 67
3.2.2 Logistics performance* 43.6 55
3.2.3 Gross capital formation, % GDP 14.7 116 ○ ◇
3.3 Ecological sustainability 28.6 64
3.3.1 GDP/unit of energy use 11.1 56
3.3.2 Environmental performance* 51.2 53
3.3.3 ISO 14001 environmental certificates/bn PPP$ GDP 0.9 68
Market sophistication 44.9 75
4.1 Credit 30.5 103 ○ ◇
4.1.1 Ease of getting credit* 50.0 94 ○ ◇
4.1.2 Domestic credit to private sector, % GDP 63.7 53
4.1.3 Microfinance gross loans, % GDP 0.1 58
4.2 Investment 23.2 99 ○
4.2.1 Ease of protecting minority investors* 62.0 60
4.2.2 Market capitalization, % GDP 53.1 33
4.2.3 Venture capital investors, deals/bn PPP$ GDP 0.0 57
4.2.4 Venture capital recipients, deals/bn PPP$ GDP 0.0 55
4.3 Trade, diversification, and market scale 80.8 26 ●
4.3.1 Applied tariff rate, weighted avg., % 8.0 102 ○
4.3.2 Domestic industry diversification 94.8 28
4.3.3 Domestic market scale, bn PPP$ 3,078.9 8 ● ◆
NOTES: ● indicates a strength; ○ a weakness; ◆ an income group strength; ◇ an income group weakness; * an index; †
a survey question. indicates that
the
economy’s data are older than the base year; see appendices for details, including the year of the data, at http://globalinnovationindex.org. Square
brackets [ ] indicate
that the data minimum coverage (DMC) requirements were not met at the sub-pillar or pillar level.](https://image.slidesharecdn.com/e-220805033615-e8521670/75/E-INDEX-2021-pdf-78-2048.jpg)
![59
GII 2021 Economy profiles
Brunei Darussalam GII 2021 rank
82
Output rank Input rank Income Region Population (mn) GDP, PPP$ (bn) GDP per capita, PPP$ GII 2020 rank
115 51 High SEAO 0.4 28.5 61,816 71
Score/
Value Rank
Business sophistication 22.0 84 ◇
5.1 Knowledge workers 32.4 [63]
5.1.1 Knowledge-intensive employment, % 38.6 30
5.1.2 Firms offering formal training, % n/a n/a
5.1.3 GERD performed by business, % GDP n/a n/a
5.1.4 GERD financed by business, % 0.0 102 ○ ◇
5.1.5 Females employed w/advanced degrees, % 12.8 58
5.2 Innovation linkages 17.4 92 ◇
5.2.1 University-industry RD collaboration†
39.4 80 ◇
5.2.2 State of cluster development and depth†
44.2 80 ◇
5.2.3 GERD financed by abroad, % GDP 0.0 96 ○ ◇
5.2.4 Joint venture/strategic alliance deals/bn PPP$ GDP 0.0 42
5.2.5 Patent families/bn PPP$ GDP 0.1 57
5.3 Knowledge absorption 16.0 114 ◇
5.3.1 Intellectual property payments, % total trade 0.3 78
5.3.2 High-tech imports, % total trade 3.4 121 ○ ◇
5.3.3 ICT services imports, % total trade 1.0 77
5.3.4 FDI net inflows, % GDP 3.5 40
5.3.5 Research talent, % in businesses n/a n/a
Knowledge and technology outputs 4.5[130]
6.1 Knowledge creation 6.4 98 ◇
6.1.1 Patents by origin/bn PPP$ GDP 0.2 90
6.1.2 PCT patents by origin/bn PPP$ GDP 0.0 78
6.1.3 Utility models by origin/bn PPP$ GDP n/a n/a
6.1.4 Scientific and technical articles/bn PPP$ GDP 11.1 78 ◇
6.1.5 Citable documents H-index 3.6 117 ◇
6.2 Knowledge impact 5.7 [126]
6.2.1 Labor productivity growth, % n/a n/a
6.2.2 New businesses/th pop. 15–64 2.4 53
6.2.3 Software spending, % GDP n/a n/a
6.2.4 ISO 9001 quality certificates/bn PPP$ GDP 3.0 77
6.2.5 High-tech manufacturing, % 3.3 107 ○ ◇
6.3 Knowledge diffusion 1.4 [129]
6.3.1 Intellectual property receipts, % total trade n/a n/a
6.3.2 Production and export complexity n/a n/a
6.3.3 High-tech exports, % total trade 0.7 85
6.3.4 ICT services exports, % total trade 0.0 130 ○ ◇
Creative outputs 18.7 85 ◇
7.1 Intangible assets 21.5 94 ◇
7.1.1 Trademarks by origin/bn PPP$ GDP 9.5 113 ◇
7.1.2 Global brand value, top 5,000, % GDP n/a n/a
7.1.3 Industrial designs by origin/bn PPP$ GDP 0.0 115 ○
7.1.4 ICTs and organizational model creation†
47.5 90 ◇
7.2 Creative goods and services 2.6 [114]
7.2.1 Cultural and creative services exports, % total trade 0.0 110 ○ ◇
7.2.2 National feature films/mn pop. 15–69 n/a n/a
7.2.3 Entertainment and media market/th pop. 15–69 n/a n/a
7.2.4 Printing and other media, % manufacturing 0.5 88
7.2.5 Creative goods exports, % total trade 0.1 90
7.3 Online creativity 29.2 36
7.3.1 Generic top-level domains (TLDs)/th pop. 15–69 7.3 45
7.3.2 Country-code TLDs/th pop. 15–69 0.9 88 ◇
7.3.3 Wikipedia edits/mn pop. 15–69 75.8 22 ●
7.3.4 Mobile app creation/bn PPP$ GDP n/a n/a
Score/
Value Rank
Institutions 80.7 24
1.1 Political environment 84.8 16 ●
1.1.1 Political and operational stability* 94.6 2 ● ◆
1.1.2 Government effectiveness* 79.9 23
1.2 Regulatory environment 80.7 30
1.2.1 Regulatory quality* 60.1 42
1.2.2 Rule of law* 62.9 38
1.2.3 Cost of redundancy dismissal 8.0 1 ● ◆
1.3 Business environment 76.6 43
1.3.1 Ease of starting a business* 94.9 15 ●
1.3.2 Ease of resolving insolvency* 58.2 54
Human capital and research 35.2 52
2.1 Education 50.7 66
2.1.1 Expenditure on education, % GDP 4.4 59
2.1.2 Government funding/pupil, secondary, % GDP/cap 23.6 21
2.1.3 School life expectancy, years 14.1 71 ◇
2.1.4 PISA scales in reading, maths and science 423.1 53 ◇
2.1.5 Pupil-teacher ratio, secondary 8.2 11 ● ◆
2.2 Tertiary education 45.6 20 ●
2.2.1 Tertiary enrolment, % gross 31.5 84 ◇
2.2.2 Graduates in science and engineering, % 40.1 4 ● ◆
2.2.3 Tertiary inbound mobility, % 3.4 64
2.3 Research and development (RD) 9.4 62 ◇
2.3.1 Researchers, FTE/mn pop. n/a n/a
2.3.2 Gross expenditure on RD, % GDP 0.3 84 ◇
2.3.3 Global corporate RD investors, top 3, mn US$ 0.0 41 ○ ◇
2.3.4 QS university ranking, top 3* 22.8 46
Infrastructure 48.0 46
3.1 Informationandcommunicationtechnologies(ICTs) 64.9 70 ◇
3.1.1 ICT access* 69.4 62 ◇
3.1.2 ICT use* 71.9 43
3.1.3 Government’s online service* 63.5 80 ◇
3.1.4 E-participation* 54.8 94 ◇
3.2 General infrastructure 51.9 8 ● ◆
3.2.1 Electricity output, GWh/mn pop. 10,009.3 14 ●
3.2.2 Logistics performance* 30.6 79 ◇
3.2.3 Gross capital formation, % GDP 48.4 3 ● ◆
3.3 Ecological sustainability 27.1 70 ◇
3.3.1 GDP/unit of energy use 8.9 82
3.3.2 Environmental performance* 54.8 44
3.3.3 ISO 14001 environmental certificates/bn PPP$ GDP 0.9 70
Market sophistication 37.8 106 ◇
4.1 Credit 56.5 21 ●
4.1.1 Ease of getting credit* 100.0 1 ● ◆
4.1.2 Domestic credit to private sector, % GDP 35.7 87 ◇
4.1.3 Microfinance gross loans, % GDP n/a n/a
4.2 Investment 23.9 [94]
4.2.1 Ease of protecting minority investors* 40.0 110 ◇
4.2.2 Market capitalization, % GDP n/a n/a
4.2.3 Venture capital investors, deals/bn PPP$ GDP 0.0 46
4.2.4 Venture capital recipients, deals/bn PPP$ GDP n/a n/a
4.3 Trade, diversification, and market scale 32.8 130 ○ ◇
4.3.1 Applied tariff rate, weighted avg., % 0.0 2 ● ◆
4.3.2 Domestic industry diversification 0.0 112 ○ ◇
4.3.3 Domestic market scale, bn PPP$ 28.5 123 ○ ◇
NOTES: ● indicates a strength; ○ a weakness; ◆ an income group strength; ◇ an income group weakness; * an index; †
a survey question. indicates that
the
economy’s data are older than the base year; see appendices for details, including the year of the data, at http://globalinnovationindex.org. Square
brackets [ ] indicate
that the data minimum coverage (DMC) requirements were not met at the sub-pillar or pillar level.](https://image.slidesharecdn.com/e-220805033615-e8521670/75/E-INDEX-2021-pdf-79-2048.jpg)
![60 Global Innovation Index 2021
Bulgaria GII 2021 rank
35
Output rank Input rank Income Region Population (mn) GDP, PPP$ (bn) GDP per capita, PPP$ GII 2020 rank
27 46 Upper middle EUR 6.9 164.1 23,741 37
Score/
Value Rank
Business sophistication 32.6 42
5.1 Knowledge workers 36.1 54
5.1.1 Knowledge-intensive employment, % 31.1 45
5.1.2 Firms offering formal training, % 20.0 78 ○
5.1.3 GERD performed by business, % GDP 0.6 37
5.1.4 GERD financed by business, % 43.1 36
5.1.5 Females employed w/advanced degrees, % 18.8 34
5.2 Innovation linkages 29.1 36 ◆
5.2.1 University-industry RD collaboration†
46.4 51
5.2.2 State of cluster development and depth†
55.3 35
5.2.3 GERD financed by abroad, % GDP 0.3 13 ● ◆
5.2.4 Joint venture/strategic alliance deals/bn PPP$ GDP 0.0 41 ◆
5.2.5 Patent families/bn PPP$ GDP 0.3 39
5.3 Knowledge absorption 32.7 49
5.3.1 Intellectual property payments, % total trade 0.5 68
5.3.2 High-tech imports, % total trade 7.2 73
5.3.3 ICT services imports, % total trade 1.3 59
5.3.4 FDI net inflows, % GDP 2.9 55
5.3.5 Research talent, % in businesses 50.1 23 ◆
Knowledge and technology outputs 36.0 27 ◆
6.1 Knowledge creation 27.1 36
6.1.1 Patents by origin/bn PPP$ GDP 1.3 57
6.1.2 PCT patents by origin/bn PPP$ GDP 0.3 40
6.1.3 Utility models by origin/bn PPP$ GDP 2.7 7 ● ◆
6.1.4 Scientific and technical articles/bn PPP$ GDP 15.4 55
6.1.5 Citable documents H-index 15.9 52
6.2 Knowledge impact 51.4 6 ● ◆
6.2.1 Labor productivity growth, % 1.6 33
6.2.2 New businesses/th pop. 15–64 10.1 14 ● ◆
6.2.3 Software spending, % GDP 0.2 68
6.2.4 ISO 9001 quality certificates/bn PPP$ GDP 38.0 1 ● ◆
6.2.5 High-tech manufacturing, % 22.9 56
6.3 Knowledge diffusion 29.5 36
6.3.1 Intellectual property receipts, % total trade 0.2 40 ◆
6.3.2 Production and export complexity 56.7 41
6.3.3 High-tech exports, % total trade 5.0 37
6.3.4 ICT services exports, % total trade 4.2 20 ◆
Creative outputs 41.1 21 ◆
7.1 Intangible assets 57.9 7 ● ◆
7.1.1 Trademarks by origin/bn PPP$ GDP 84.8 18 ● ◆
7.1.2 Global brand value, top 5,000, % GDP n/a n/a
7.1.3 Industrial designs by origin/bn PPP$ GDP 8.5 13 ● ◆
7.1.4 ICTs and organizational model creation†
53.7 64
7.2 Creative goods and services 21.7 46
7.2.1 Cultural and creative services exports, % total trade 1.7 13 ● ◆
7.2.2 National feature films/mn pop. 15–69 4.7 45
7.2.3 Entertainment and media market/th pop. 15–69 n/a n/a
7.2.4 Printing and other media, % manufacturing 1.1 43
7.2.5 Creative goods exports, % total trade 1.0 42
7.3 Online creativity 26.8 43
7.3.1 Generic top-level domains (TLDs)/th pop. 15–69 23.7 24 ◆
7.3.2 Country-code TLDs/th pop. 15–69 3.8 59
7.3.3 Wikipedia edits/mn pop. 15–69 69.5 39 ◆
7.3.4 Mobile app creation/bn PPP$ GDP 7.3 53
Score/
Value Rank
Institutions 69.8 47 ◆
1.1 Political environment 62.0 53
1.1.1 Political and operational stability* 69.6 60
1.1.2 Government effectiveness* 58.2 53
1.2 Regulatory environment 75.7 36 ◆
1.2.1 Regulatory quality* 57.4 46 ◆
1.2.2 Rule of law* 47.7 62
1.2.3 Cost of redundancy dismissal 8.6 16 ●
1.3 Business environment 71.6 64
1.3.1 Ease of starting a business* 85.4 86 ○
1.3.2 Ease of resolving insolvency* 57.8 56
Human capital and research 31.7 65
2.1 Education 47.4 74
2.1.1 Expenditure on education, % GDP 4.1 65
2.1.2 Government funding/pupil, secondary, % GDP/cap 21.6 36
2.1.3 School life expectancy, years 14.2 69 ○
2.1.4 PISA scales in reading, maths and science 426.7 50 ○
2.1.5 Pupil-teacher ratio, secondary 12.6 54
2.2 Tertiary education 34.8 61
2.2.1 Tertiary enrolment, % gross 71.5 28
2.2.2 Graduates in science and engineering, % 19.3 77 ○
2.2.3 Tertiary inbound mobility, % 6.4 38
2.3 Research and development (RD) 12.9 52
2.3.1 Researchers, FTE/mn pop. 2,420.0 35 ◆
2.3.2 Gross expenditure on RD, % GDP 0.8 43
2.3.3 Global corporate RD investors, top 3, mn US$ 0.0 41 ○ ◇
2.3.4 QS university ranking, top 3* 6.2 70
Infrastructure 51.7 36 ◆
3.1 Informationandcommunicationtechnologies(ICTs) 77.4 42 ◆
3.1.1 ICT access* 71.4 57
3.1.2 ICT use* 72.0 42 ◆
3.1.3 Government’s online service* 77.1 47
3.1.4 E-participation* 89.3 23 ◆
3.2 General infrastructure 27.5 69
3.2.1 Electricity output, GWh/mn pop. 6,282.1 32 ◆
3.2.2 Logistics performance* 45.8 51
3.2.3 Gross capital formation, % GDP 18.7 97 ○
3.3 Ecological sustainability 50.2 15 ● ◆
3.3.1 GDP/unit of energy use 7.8 92 ○
3.3.2 Environmental performance* 57.0 39 ◆
3.3.3 ISO 14001 environmental certificates/bn PPP$ GDP 12.2 2 ● ◆
Market sophistication 45.1 72
4.1 Credit 33.7 93 ○
4.1.1 Ease of getting credit* 65.0 61
4.1.2 Domestic credit to private sector, % GDP 49.8 71
4.1.3 Microfinance gross loans, % GDP 0.0 82 ○
4.2 Investment 24.6 86 ○
4.2.1 Ease of protecting minority investors* 74.0 24
4.2.2 Market capitalization, % GDP 14.5 63 ○
4.2.3 Venture capital investors, deals/bn PPP$ GDP 0.0 43
4.2.4 Venture capital recipients, deals/bn PPP$ GDP 0.0 45
4.3 Trade, diversification, and market scale 76.9 38
4.3.1 Applied tariff rate, weighted avg., % 1.8 25
4.3.2 Domestic industry diversification 97.1 15 ●
4.3.3 Domestic market scale, bn PPP$ 164.1 71
NOTES: ● indicates a strength; ○ a weakness; ◆ an income group strength; ◇ an income group weakness; * an index; †
a survey question. indicates that
the
economy’s data are older than the base year; see appendices for details, including the year of the data, at http://globalinnovationindex.org. Square
brackets [ ] indicate
that the data minimum coverage (DMC) requirements were not met at the sub-pillar or pillar level.](https://image.slidesharecdn.com/e-220805033615-e8521670/75/E-INDEX-2021-pdf-80-2048.jpg)
![61
GII 2021 Economy profiles
Burkina Faso GII 2021 rank
115
Output rank Input rank Income Region Population (mn) GDP, PPP$ (bn) GDP per capita, PPP$ GII 2020 rank
123 108 Low SSF 20.9 46.1 2,203 118
Score/
Value Rank
Business sophistication 16.0 120
5.1 Knowledge workers 12.2 [121]
5.1.1 Knowledge-intensive employment, % 13.3 99 ◆
5.1.2 Firms offering formal training, % n/a n/a
5.1.3 GERD performed by business, % GDP n/a n/a
5.1.4 GERD financed by business, % n/a n/a
5.1.5 Females employed w/advanced degrees, % 0.8 115
5.2 Innovation linkages 14.2 111
5.2.1 University-industry RD collaboration†
30.2 111
5.2.2 State of cluster development and depth†
28.7 124 ○ ◇
5.2.3 GERD financed by abroad, % GDP 0.0 60 ●
5.2.4 Joint venture/strategic alliance deals/bn PPP$ GDP 0.0 117
5.2.5 Patent families/bn PPP$ GDP n/a n/a
5.3 Knowledge absorption 21.5 83
5.3.1 Intellectual property payments, % total trade 0.0 118
5.3.2 High-tech imports, % total trade 7.0 80
5.3.3 ICT services imports, % total trade 2.1 32 ● ◆
5.3.4 FDI net inflows, % GDP 1.0 107
5.3.5 Research talent, % in businesses n/a n/a
Knowledge and technology outputs 11.8 106
6.1 Knowledge creation 5.1 111
6.1.1 Patents by origin/bn PPP$ GDP 0.0 128 ○ ◇
6.1.2 PCT patents by origin/bn PPP$ GDP 0.0 98 ○ ◇
6.1.3 Utility models by origin/bn PPP$ GDP 0.1 55
6.1.4 Scientific and technical articles/bn PPP$ GDP 10.2 85
6.1.5 Citable documents H-index 5.6 98
6.2 Knowledge impact 20.6 102
6.2.1 Labor productivity growth, % 1.8 29 ●
6.2.2 New businesses/th pop. 15–64 0.3 107
6.2.3 Software spending, % GDP 0.0 110
6.2.4 ISO 9001 quality certificates/bn PPP$ GDP 0.6 118
6.2.5 High-tech manufacturing, % n/a n/a
6.3 Knowledge diffusion 9.7 95
6.3.1 Intellectual property receipts, % total trade 0.0 89
6.3.2 Production and export complexity 31.2 87 ◆
6.3.3 High-tech exports, % total trade 0.7 82 ◆
6.3.4 ICT services exports, % total trade 1.2 75 ●
Creative outputs 8.3 129 ○
7.1 Intangible assets 12.0 125 ○
7.1.1 Trademarks by origin/bn PPP$ GDP 4.5 123 ○
7.1.2 Global brand value, top 5,000, % GDP 0.0 80 ○ ◇
7.1.3 Industrial designs by origin/bn PPP$ GDP 0.3 100
7.1.4 ICTs and organizational model creation†
39.5 113
7.2 Creative goods and services 2.1 [118]
7.2.1 Cultural and creative services exports, % total trade 0.2 69
7.2.2 National feature films/mn pop. 15–69 0.5 98
7.2.3 Entertainment and media market/th pop. 15–69 n/a n/a
7.2.4 Printing and other media, % manufacturing n/a n/a
7.2.5 Creative goods exports, % total trade 0.0 117
7.3 Online creativity 7.1 113
7.3.1 Generic top-level domains (TLDs)/th pop. 15–69 0.1 126 ○
7.3.2 Country-code TLDs/th pop. 15–69 0.0 124
7.3.3 Wikipedia edits/mn pop. 15–69 24.7 114
7.3.4 Mobile app creation/bn PPP$ GDP n/a n/a
Score/
Value Rank
Institutions 56.2 92
1.1 Political environment 39.2 121
1.1.1 Political and operational stability* 50.0 123 ○
1.1.2 Government effectiveness* 33.8 115
1.2 Regulatory environment 64.8 66 ●
1.2.1 Regulatory quality* 33.7 98
1.2.2 Rule of law* 35.5 88
1.2.3 Cost of redundancy dismissal 10.5 33 ●
1.3 Business environment 64.5 85
1.3.1 Ease of starting a business* 88.2 71 ●
1.3.2 Ease of resolving insolvency* 40.8 96
Human capital and research 18.4 103
2.1 Education 36.7 100
2.1.1 Expenditure on education, % GDP 5.4 24 ● ◆
2.1.2 Government funding/pupil, secondary, % GDP/cap 15.7 71
2.1.3 School life expectancy, years 9.3 110
2.1.4 PISA scales in reading, maths and science n/a n/a
2.1.5 Pupil-teacher ratio, secondary 22.2 102
2.2 Tertiary education 15.4 101
2.2.1 Tertiary enrolment, % gross 7.1 120
2.2.2 Graduates in science and engineering, % 20.3 71
2.2.3 Tertiary inbound mobility, % 2.3 72
2.3 Research and development (RD) 3.1 87 ◆
2.3.1 Researchers, FTE/mn pop. 47.6 95
2.3.2 Gross expenditure on RD, % GDP 0.6 56 ● ◆
2.3.3 Global corporate RD investors, top 3, mn US$ 0.0 41 ○ ◇
2.3.4 QS university ranking, top 3* 0.0 74 ○ ◇
Infrastructure 27.4 111
3.1 Informationandcommunicationtechnologies(ICTs) 36.6 117
3.1.1 ICT access* 33.0 120
3.1.2 ICT use* 15.9 119
3.1.3 Government’s online service* 46.5 111
3.1.4 E-participation* 51.2 99
3.2 General infrastructure 26.1 76 ●
3.2.1 Electricity output, GWh/mn pop. n/a n/a
3.2.2 Logistics performance* 26.7 87
3.2.3 Gross capital formation, % GDP 21.8 71 ●
3.3 Ecological sustainability 19.4 104
3.3.1 GDP/unit of energy use n/a n/a
3.3.2 Environmental performance* 38.3 93 ◆
3.3.3 ISO 14001 environmental certificates/bn PPP$ GDP 0.1 125 ○
Market sophistication 36.8 114
4.1 Credit 21.1 122
4.1.1 Ease of getting credit* 30.0 122 ○
4.1.2 Domestic credit to private sector, % GDP 28.4 98 ◆
4.1.3 Microfinance gross loans, % GDP 1.5 21 ●
4.2 Investment 42.0 [28]
4.2.1 Ease of protecting minority investors* 42.0 102
4.2.2 Market capitalization, % GDP n/a n/a
4.2.3 Venture capital investors, deals/bn PPP$ GDP n/a n/a
4.2.4 Venture capital recipients, deals/bn PPP$ GDP n/a n/a
4.3 Trade, diversification, and market scale 47.3 118
4.3.1 Applied tariff rate, weighted avg., % 5.8 94
4.3.2 Domestic industry diversification n/a n/a
4.3.3 Domestic market scale, bn PPP$ 46.1 105
NOTES: ● indicates a strength; ○ a weakness; ◆ an income group strength; ◇ an income group weakness; * an index; †
a survey question. indicates that
the
economy’s data are older than the base year; see appendices for details, including the year of the data, at http://globalinnovationindex.org. Square
brackets [ ] indicate
that the data minimum coverage (DMC) requirements were not met at the sub-pillar or pillar level.](https://image.slidesharecdn.com/e-220805033615-e8521670/75/E-INDEX-2021-pdf-81-2048.jpg)
![62 Global Innovation Index 2021
Cabo Verde GII 2021 rank
89
Output rank Input rank Income Region Population (mn) GDP, PPP$ (bn) GDP per capita, PPP$ GII 2020 rank
88 96 Lower middle SSF 0.6 3.9 6,980 100
Score/
Value Rank
Business sophistication 23.9 [74]
5.1 Knowledge workers 23.6 [89]
5.1.1 Knowledge-intensive employment, % 17.1 89
5.1.2 Firms offering formal training, % n/a n/a
5.1.3 GERD performed by business, % GDP n/a n/a
5.1.4 GERD financed by business, % n/a n/a
5.1.5 Females employed w/advanced degrees, % 7.6 83
5.2 Innovation linkages 26.7 [40]
5.2.1 University-industry RD collaboration†
41.1 72
5.2.2 State of cluster development and depth†
46.3 67
5.2.3 GERD financed by abroad, % GDP n/a n/a
5.2.4 Joint venture/strategic alliance deals/bn PPP$ GDP n/a n/a
5.2.5 Patent families/bn PPP$ GDP 0.0 100 ○ ◇
5.3 Knowledge absorption 21.4 84
5.3.1 Intellectual property payments, % total trade 0.8 50
5.3.2 High-tech imports, % total trade 3.0 124 ○ ◇
5.3.3 ICT services imports, % total trade 1.4 55
5.3.4 FDI net inflows, % GDP 5.7 17 ●
5.3.5 Research talent, % in businesses n/a n/a
Knowledge and technology outputs 8.6[122]
6.1 Knowledge creation 9.2 [85]
6.1.1 Patents by origin/bn PPP$ GDP 0.8 70
6.1.2 PCT patents by origin/bn PPP$ GDP n/a n/a
6.1.3 Utility models by origin/bn PPP$ GDP n/a n/a
6.1.4 Scientific and technical articles/bn PPP$ GDP 14.4 59
6.1.5 Citable documents H-index 0.0 132 ○ ◇
6.2 Knowledge impact 13.7 [118]
6.2.1 Labor productivity growth, % n/a n/a
6.2.2 New businesses/th pop. 15–64 4.0 36 ● ◆
6.2.3 Software spending, % GDP n/a n/a
6.2.4 ISO 9001 quality certificates/bn PPP$ GDP 7.5 36 ● ◆
6.2.5 High-tech manufacturing, % 7.2 97
6.3 Knowledge diffusion 2.9 127 ○
6.3.1 Intellectual property receipts, % total trade 0.0 98
6.3.2 Production and export complexity n/a n/a
6.3.3 High-tech exports, % total trade 0.0 131 ○ ◇
6.3.4 ICT services exports, % total trade 0.9 86
Creative outputs 25.7 59
7.1 Intangible assets 32.5 59
7.1.1 Trademarks by origin/bn PPP$ GDP 22.1 90
7.1.2 Global brand value, top 5,000, % GDP n/a n/a
7.1.3 Industrial designs by origin/bn PPP$ GDP 8.1 16 ● ◆
7.1.4 ICTs and organizational model creation†
44.6 98
7.2 Creative goods and services 11.0 [77]
7.2.1 Cultural and creative services exports, % total trade 0.3 61
7.2.2 National feature films/mn pop. 15–69 n/a n/a
7.2.3 Entertainment and media market/th pop. 15–69 n/a n/a
7.2.4 Printing and other media, % manufacturing 1.8 20 ●
7.2.5 Creative goods exports, % total trade 0.1 110
7.3 Online creativity 26.8 42 ● ◆
7.3.1 Generic top-level domains (TLDs)/th pop. 15–69 1.9 79
7.3.2 Country-code TLDs/th pop. 15–69 2.0 71 ◆
7.3.3 Wikipedia edits/mn pop. 15–69 73.3 28 ● ◆
7.3.4 Mobile app creation/bn PPP$ GDP n/a n/a
Score/
Value Rank
Institutions 57.0 88
1.1 Political environment 63.7 49 ◆
1.1.1 Political and operational stability* 76.8 37 ● ◆
1.1.2 Government effectiveness* 57.2 56 ◆
1.2 Regulatory environment 65.2 64 ◆
1.2.1 Regulatory quality* 37.6 87
1.2.2 Rule of law* 60.3 43 ● ◆
1.2.3 Cost of redundancy dismissal 17.4 73
1.3 Business environment 42.2 130 ○ ◇
1.3.1 Ease of starting a business* 84.5 93
1.3.2 Ease of resolving insolvency* 0.0 129 ○ ◇
Human capital and research 21.1 95
2.1 Education 47.9 73
2.1.1 Expenditure on education, % GDP 5.2 31 ●
2.1.2 Government funding/pupil, secondary, % GDP/cap 19.7 49
2.1.3 School life expectancy, years 12.7 84
2.1.4 PISA scales in reading, maths and science n/a n/a
2.1.5 Pupil-teacher ratio, secondary 15.4 75
2.2 Tertiary education 14.9 102
2.2.1 Tertiary enrolment, % gross 23.6 95
2.2.2 Graduates in science and engineering, % 16.1 93
2.2.3 Tertiary inbound mobility, % 1.4 82
2.3 Research and development (RD) 0.6 108
2.3.1 Researchers, FTE/mn pop. 123.5 85
2.3.2 Gross expenditure on RD, % GDP 0.1 109
2.3.3 Global corporate RD investors, top 3, mn US$ 0.0 41 ○ ◇
2.3.4 QS university ranking, top 3* 0.0 74 ○ ◇
Infrastructure 42.3 66 ◆
3.1 Informationandcommunicationtechnologies(ICTs) 49.0 95
3.1.1 ICT access* 57.9 80 ◆
3.1.2 ICT use* 46.5 85
3.1.3 Government’s online service* 50.0 106
3.1.4 E-participation* 41.7 111
3.2 General infrastructure 60.0 [4]
3.2.1 Electricity output, GWh/mn pop. n/a n/a
3.2.2 Logistics performance* n/a n/a
3.2.3 Gross capital formation, % GDP 42.2 5 ● ◆
3.3 Ecological sustainability 17.8 113
3.3.1 GDP/unit of energy use n/a n/a
3.3.2 Environmental performance* 32.8 112
3.3.3 ISO 14001 environmental certificates/bn PPP$ GDP 0.5 87
Market sophistication 26.6 128 ○ ◇
4.1 Credit 29.0 111
4.1.1 Ease of getting credit* 35.0 118 ◇
4.1.2 Domestic credit to private sector, % GDP 58.7 58
4.1.3 Microfinance gross loans, % GDP n/a n/a
4.2 Investment 24.0 [91]
4.2.1 Ease of protecting minority investors* 24.0 128 ○ ◇
4.2.2 Market capitalization, % GDP n/a n/a
4.2.3 Venture capital investors, deals/bn PPP$ GDP n/a n/a
4.2.4 Venture capital recipients, deals/bn PPP$ GDP n/a n/a
4.3 Trade, diversification, and market scale 26.7 132 ○ ◇
4.3.1 Applied tariff rate, weighted avg., % 11.6 124 ◇
4.3.2 Domestic industry diversification 49.2 107 ○ ◇
4.3.3 Domestic market scale, bn PPP$ 3.9 132 ○ ◇
NOTES: ● indicates a strength; ○ a weakness; ◆ an income group strength; ◇ an income group weakness; * an index; †
a survey question. indicates that
the
economy’s data are older than the base year; see appendices for details, including the year of the data, at http://globalinnovationindex.org. Square
brackets [ ] indicate
that the data minimum coverage (DMC) requirements were not met at the sub-pillar or pillar level.](https://image.slidesharecdn.com/e-220805033615-e8521670/75/E-INDEX-2021-pdf-82-2048.jpg)
![63
GII 2021 Economy profiles
Cambodia GII 2021 rank
109
Output rank Input rank Income Region Population (mn) GDP, PPP$ (bn) GDP per capita, PPP$ GII 2020 rank
104 106 Lower middle SEAO 16.7 74.3 4,441 110
Score/
Value Rank
Business sophistication 16.2 117
5.1 Knowledge workers 11.9 122 ○ ◇
5.1.1 Knowledge-intensive employment, % 5.5 117 ○ ◇
5.1.2 Firms offering formal training, % 22.2 68
5.1.3 GERD performed by business, % GDP 0.0 84 ○
5.1.4 GERD financed by business, % 19.4 66
5.1.5 Females employed w/advanced degrees, % 2.2 105
5.2 Innovation linkages 24.0 51 ● ◆
5.2.1 University-industry RD collaboration†
39.0 82
5.2.2 State of cluster development and depth†
45.7 70
5.2.3 GERD financed by abroad, % GDP 0.0 56
5.2.4 Joint venture/strategic alliance deals/bn PPP$ GDP 0.0 39 ● ◆
5.2.5 Patent families/bn PPP$ GDP n/a n/a
5.3 Knowledge absorption 12.6 127 ○ ◇
5.3.1 Intellectual property payments, % total trade 0.1 105
5.3.2 High-tech imports, % total trade 2.4 129 ○ ◇
5.3.3 ICT services imports, % total trade 0.6 95
5.3.4 FDI net inflows, % GDP 13.1 7 ● ◆
5.3.5 Research talent, % in businesses 4.3 73
Knowledge and technology outputs 11.2 111
6.1 Knowledge creation 3.6 117
6.1.1 Patents by origin/bn PPP$ GDP 0.1 120 ○
6.1.2 PCT patents by origin/bn PPP$ GDP 0.0 94
6.1.3 Utility models by origin/bn PPP$ GDP n/a n/a
6.1.4 Scientific and technical articles/bn PPP$ GDP 4.7 111
6.1.5 Citable documents H-index 5.6 98
6.2 Knowledge impact 22.6 90
6.2.1 Labor productivity growth, % 2.7 19 ●
6.2.2 New businesses/th pop. 15–64 0.7 90
6.2.3 Software spending, % GDP 0.0 109 ◇
6.2.4 ISO 9001 quality certificates/bn PPP$ GDP 1.1 107
6.2.5 High-tech manufacturing, % n/a n/a
6.3 Knowledge diffusion 7.4 106
6.3.1 Intellectual property receipts, % total trade 0.0 90
6.3.2 Production and export complexity 30.9 89
6.3.3 High-tech exports, % total trade 0.7 83
6.3.4 ICT services exports, % total trade 0.4 103
Creative outputs 16.3 98
7.1 Intangible assets 26.5 82
7.1.1 Trademarks by origin/bn PPP$ GDP 39.5 59
7.1.2 Global brand value, top 5,000, % GDP 0.0 80 ○ ◇
7.1.3 Industrial designs by origin/bn PPP$ GDP 0.2 104
7.1.4 ICTs and organizational model creation†
60.6 41 ● ◆
7.2 Creative goods and services 6.2 [99]
7.2.1 Cultural and creative services exports, % total trade n/a n/a
7.2.2 National feature films/mn pop. 15–69 3.2 57
7.2.3 Entertainment and media market/th pop. 15–69 n/a n/a
7.2.4 Printing and other media, % manufacturing n/a n/a
7.2.5 Creative goods exports, % total trade 0.4 69
7.3 Online creativity 6.0 117
7.3.1 Generic top-level domains (TLDs)/th pop. 15–69 0.8 100
7.3.2 Country-code TLDs/th pop. 15–69 0.1 118
7.3.3 Wikipedia edits/mn pop. 15–69 25.0 113
7.3.4 Mobile app creation/bn PPP$ GDP 1.7 71
Score/
Value Rank
Institutions 50.5 111
1.1 Political environment 49.6 91
1.1.1 Political and operational stability* 73.2 44 ● ◆
1.1.2 Government effectiveness* 37.8 103
1.2 Regulatory environment 51.4 102
1.2.1 Regulatory quality* 28.6 106
1.2.2 Rule of law* 22.1 118
1.2.3 Cost of redundancy dismissal 19.4 82
1.3 Business environment 50.5 127 ○ ◇
1.3.1 Ease of starting a business* 52.4 132 ○ ◇
1.3.2 Ease of resolving insolvency* 48.5 74
Human capital and research 17.6 109
2.1 Education 27.6[120]
2.1.1 Expenditure on education, % GDP 2.2 110 ○ ◇
2.1.2 Government funding/pupil, secondary, % GDP/cap n/a n/a
2.1.3 School life expectancy, years n/a n/a
2.1.4 PISA scales in reading, maths and science n/a n/a
2.1.5 Pupil-teacher ratio, secondary 21.7 100
2.2 Tertiary education 24.6 86
2.2.1 Tertiary enrolment, % gross 14.7 102
2.2.2 Graduates in science and engineering, % 23.2 52
2.2.3 Tertiary inbound mobility, % n/a n/a
2.3 Research and development (RD) 0.6 112
2.3.1 Researchers, FTE/mn pop. 30.4 101 ○
2.3.2 Gross expenditure on RD, % GDP 0.1 102
2.3.3 Global corporate RD investors, top 3, mn US$ 0.0 41 ○ ◇
2.3.4 QS university ranking, top 3* 0.0 74 ○ ◇
Infrastructure 28.9 107
3.1 Informationandcommunicationtechnologies(ICTs) 44.9 100
3.1.1 ICT access* 46.5 94
3.1.2 ICT use* 46.3 86
3.1.3 Government’s online service* 45.3 113
3.1.4 E-participation* 41.7 111
3.2 General infrastructure 23.6 89
3.2.1 Electricity output, GWh/mn pop. 502.9 107
3.2.2 Logistics performance* 24.7 94
3.2.3 Gross capital formation, % GDP 26.6 35 ●
3.3 Ecological sustainability 18.2 112
3.3.1 GDP/unit of energy use 8.2 89
3.3.2 Environmental performance* 33.6 108
3.3.3 ISO 14001 environmental certificates/bn PPP$ GDP 0.3 94
Market sophistication 45.8 69
4.1 Credit 70.9 6 ● ◆
4.1.1 Ease of getting credit* 80.0 23 ●
4.1.2 Domestic credit to private sector, % GDP 114.2 19 ● ◆
4.1.3 Microfinance gross loans, % GDP 38.4 1 ● ◆
4.2 Investment 23.2 100
4.2.1 Ease of protecting minority investors* 40.0 110
4.2.2 Market capitalization, % GDP n/a n/a
4.2.3 Venture capital investors, deals/bn PPP$ GDP 0.1 39 ◆
4.2.4 Venture capital recipients, deals/bn PPP$ GDP 0.0 32 ● ◆
4.3 Trade, diversification, and market scale 43.3 122 ○ ◇
4.3.1 Applied tariff rate, weighted avg., % 9.8 115
4.3.2 Domestic industry diversification n/a n/a
4.3.3 Domestic market scale, bn PPP$ 74.3 91
NOTES: ● indicates a strength; ○ a weakness; ◆ an income group strength; ◇ an income group weakness; * an index; †
a survey question. indicates that
the
economy’s data are older than the base year; see appendices for details, including the year of the data, at http://globalinnovationindex.org. Square
brackets [ ] indicate
that the data minimum coverage (DMC) requirements were not met at the sub-pillar or pillar level.](https://image.slidesharecdn.com/e-220805033615-e8521670/75/E-INDEX-2021-pdf-83-2048.jpg)
![64 Global Innovation Index 2021
Cameroon GII 2021 rank
123
Output rank Input rank Income Region Population (mn) GDP, PPP$ (bn) GDP per capita, PPP$ GII 2020 rank
117 124 Lower middle SSF 26.5 97.0 3,710 119
Score/
Value Rank
Business sophistication 20.4 93
5.1 Knowledge workers 23.7 [88]
5.1.1 Knowledge-intensive employment, % 10.9 108
5.1.2 Firms offering formal training, % 37.6 35 ●
5.1.3 GERD performed by business, % GDP n/a n/a
5.1.4 GERD financed by business, % n/a n/a
5.1.5 Females employed w/advanced degrees, % 2.0 106
5.2 Innovation linkages 18.6 76 ●
5.2.1 University-industry RD collaboration†
40.0 75
5.2.2 State of cluster development and depth†
42.0 96
5.2.3 GERD financed by abroad, % GDP n/a n/a
5.2.4 Joint venture/strategic alliance deals/bn PPP$ GDP 0.0 102
5.2.5 Patent families/bn PPP$ GDP 0.0 91
5.3 Knowledge absorption 18.8 99
5.3.1 Intellectual property payments, % total trade 0.0 117 ○
5.3.2 High-tech imports, % total trade 5.7 102
5.3.3 ICT services imports, % total trade 1.6 45 ●
5.3.4 FDI net inflows, % GDP 2.3 71 ●
5.3.5 Research talent, % in businesses n/a n/a
Knowledge and technology outputs 12.9 98
6.1 Knowledge creation 7.2 95
6.1.1 Patents by origin/bn PPP$ GDP 0.3 85
6.1.2 PCT patents by origin/bn PPP$ GDP 0.0 90
6.1.3 Utility models by origin/bn PPP$ GDP 0.0 62
6.1.4 Scientific and technical articles/bn PPP$ GDP 14.3 61 ●
6.1.5 Citable documents H-index 7.4 89
6.2 Knowledge impact 26.1 [81]
6.2.1 Labor productivity growth, % 1.3 37 ●
6.2.2 New businesses/th pop. 15–64 n/a n/a
6.2.3 Software spending, % GDP 0.1 81
6.2.4 ISO 9001 quality certificates/bn PPP$ GDP 0.7 116
6.2.5 High-tech manufacturing, % n/a n/a
6.3 Knowledge diffusion 5.5 118
6.3.1 Intellectual property receipts, % total trade 0.0 71
6.3.2 Production and export complexity 6.8 119 ○ ◇
6.3.3 High-tech exports, % total trade 0.2 107
6.3.4 ICT services exports, % total trade 1.3 70 ●
Creative outputs 9.6 124 ○ ◇
7.1 Intangible assets 13.3 122
7.1.1 Trademarks by origin/bn PPP$ GDP 6.3 118 ○
7.1.2 Global brand value, top 5,000, % GDP 0.0 80 ○ ◇
7.1.3 Industrial designs by origin/bn PPP$ GDP 0.4 93
7.1.4 ICTs and organizational model creation†
42.4 107
7.2 Creative goods and services 5.3[103]
7.2.1 Cultural and creative services exports, % total trade 0.6 45 ●
7.2.2 National feature films/mn pop. 15–69 n/a n/a
7.2.3 Entertainment and media market/th pop. 15–69 n/a n/a
7.2.4 Printing and other media, % manufacturing n/a n/a
7.2.5 Creative goods exports, % total trade 0.0 121
7.3 Online creativity 6.2 116
7.3.1 Generic top-level domains (TLDs)/th pop. 15–69 0.2 119
7.3.2 Country-code TLDs/th pop. 15–69 1.2 81
7.3.3 Wikipedia edits/mn pop. 15–69 21.2 118
7.3.4 Mobile app creation/bn PPP$ GDP n/a n/a
Score/
Value Rank
Institutions 49.9 113
1.1 Political environment 40.2 118
1.1.1 Political and operational stability* 55.4 112
1.1.2 Government effectiveness* 32.6 119
1.2 Regulatory environment 48.0 110
1.2.1 Regulatory quality* 21.9 120
1.2.2 Rule of law* 17.2 127 ○ ◇
1.2.3 Cost of redundancy dismissal 19.9 84
1.3 Business environment 61.4 103
1.3.1 Ease of starting a business* 86.3 80
1.3.2 Ease of resolving insolvency* 36.6 110
Human capital and research 18.2 105
2.1 Education 35.7 103
2.1.1 Expenditure on education, % GDP 3.1 93
2.1.2 Government funding/pupil, secondary, % GDP/cap 17.8 60 ●
2.1.3 School life expectancy, years 12.1 91
2.1.4 PISA scales in reading, maths and science n/a n/a
2.1.5 Pupil-teacher ratio, secondary 19.3 94
2.2 Tertiary education 19.0 96
2.2.1 Tertiary enrolment, % gross 14.3 104
2.2.2 Graduates in science and engineering, % 21.3 66
2.2.3 Tertiary inbound mobility, % 2.8 69
2.3 Research and development (RD) 0.0[123]
2.3.1 Researchers, FTE/mn pop. n/a n/a
2.3.2 Gross expenditure on RD, % GDP n/a n/a
2.3.3 Global corporate RD investors, top 3, mn US$ 0.0 41 ○ ◇
2.3.4 QS university ranking, top 3* 0.0 74 ○ ◇
Infrastructure 25.8 115
3.1 Informationandcommunicationtechnologies(ICTs) 34.2 120 ◇
3.1.1 ICT access* 34.4 117
3.1.2 ICT use* 13.5 124 ○ ◇
3.1.3 Government’s online service* 47.1 110
3.1.4 E-participation* 41.7 111
3.2 General infrastructure 24.1 87
3.2.1 Electricity output, GWh/mn pop. 342.1 114
3.2.2 Logistics performance* 25.5 91
3.2.3 Gross capital formation, % GDP 27.2 32 ●
3.3 Ecological sustainability 19.2 108
3.3.1 GDP/unit of energy use 9.4 76
3.3.2 Environmental performance* 33.6 108
3.3.3 ISO 14001 environmental certificates/bn PPP$ GDP 0.2 118
Market sophistication 26.1 129 ○ ◇
4.1 Credit 28.2 112
4.1.1 Ease of getting credit* 60.0 74
4.1.2 Domestic credit to private sector, % GDP 15.2 119
4.1.3 Microfinance gross loans, % GDP 0.7 28 ●
4.2 Investment 15.6[127]
4.2.1 Ease of protecting minority investors* 28.0 124 ○ ◇
4.2.2 Market capitalization, % GDP n/a n/a
4.2.3 Venture capital investors, deals/bn PPP$ GDP n/a n/a
4.2.4 Venture capital recipients, deals/bn PPP$ GDP 0.0 73
4.3 Trade, diversification, and market scale 34.5 128 ○ ◇
4.3.1 Applied tariff rate, weighted avg., % 15.5 131 ○ ◇
4.3.2 Domestic industry diversification n/a n/a
4.3.3 Domestic market scale, bn PPP$ 97.0 86
NOTES: ● indicates a strength; ○ a weakness; ◆ an income group strength; ◇ an income group weakness; * an index; †
a survey question. indicates that
the
economy’s data are older than the base year; see appendices for details, including the year of the data, at http://globalinnovationindex.org. Square
brackets [ ] indicate
that the data minimum coverage (DMC) requirements were not met at the sub-pillar or pillar level.](https://image.slidesharecdn.com/e-220805033615-e8521670/75/E-INDEX-2021-pdf-84-2048.jpg)
![65
GII 2021 Economy profiles
Canada GII 2021 rank
16
Output rank Input rank Income Region Population (mn) GDP, PPP$ (bn) GDP per capita, PPP$ GII 2020 rank
23 8 High NAC 37.7 1,809.0 47,569 17
Score/
Value Rank
Business sophistication 50.1 20
5.1 Knowledge workers 48.0 27 ◇
5.1.1 Knowledge-intensive employment, % 43.7 21
5.1.2 Firms offering formal training, % n/a n/a
5.1.3 GERD performed by business, % GDP 0.8 30 ◇
5.1.4 GERD financed by business, % 41.0 42 ◇
5.1.5 Females employed w/advanced degrees, % 19.0 33
5.2 Innovation linkages 56.1 9 ●
5.2.1 University-industry RD collaboration†
67.9 10
5.2.2 State of cluster development and depth†
62.5 22
5.2.3 GERD financed by abroad, % GDP 0.2 30
5.2.4 Joint venture/strategic alliance deals/bn PPP$ GDP 0.4 1 ● ◆
5.2.5 Patent families/bn PPP$ GDP 2.0 21
5.3 Knowledge absorption 46.1 19
5.3.1 Intellectual property payments, % total trade 2.1 13
5.3.2 High-tech imports, % total trade 10.6 27
5.3.3 ICT services imports, % total trade 1.0 72 ○ ◇
5.3.4 FDI net inflows, % GDP 2.2 74 ○
5.3.5 Research talent, % in businesses 56.7 18
Knowledge and technology outputs 38.3 23
6.1 Knowledge creation 48.7 16
6.1.1 Patents by origin/bn PPP$ GDP 2.2 32 ◇
6.1.2 PCT patents by origin/bn PPP$ GDP 1.4 23 ◇
6.1.3 Utility models by origin/bn PPP$ GDP n/a n/a
6.1.4 Scientific and technical articles/bn PPP$ GDP 39.6 20
6.1.5 Citable documents H-index 79.8 4 ● ◆
6.2 Knowledge impact 37.8 32
6.2.1 Labor productivity growth, % 0.2 61
6.2.2 New businesses/th pop. 15–64 0.2 113 ○ ◇
6.2.3 Software spending, % GDP 0.6 5 ●
6.2.4 ISO 9001 quality certificates/bn PPP$ GDP 2.4 82 ○ ◇
6.2.5 High-tech manufacturing, % 37.6 31
6.3 Knowledge diffusion 28.3 41
6.3.1 Intellectual property receipts, % total trade 0.9 21
6.3.2 Production and export complexity 58.8 39 ◇
6.3.3 High-tech exports, % total trade 6.6 28
6.3.4 ICT services exports, % total trade 1.6 67 ○
Creative outputs 41.9 19
7.1 Intangible assets 46.3 24
7.1.1 Trademarks by origin/bn PPP$ GDP 47.8 46
7.1.2 Global brand value, top 5,000, % GDP 138.2 13
7.1.3 Industrial designs by origin/bn PPP$ GDP 0.4 92 ○
7.1.4 ICTs and organizational model creation†
77.0 11
7.2 Creative goods and services 24.1 40 ◇
7.2.1 Cultural and creative services exports, % total trade 1.0 29
7.2.2 National feature films/mn pop. 15–69 3.4 54
7.2.3 Entertainment and media market/th pop. 15–69 59.1 9
7.2.4 Printing and other media, % manufacturing 1.4 32
7.2.5 Creative goods exports, % total trade 1.0 45
7.3 Online creativity 50.8 20
7.3.1 Generic top-level domains (TLDs)/th pop. 15–69 78.6 6 ● ◆
7.3.2 Country-code TLDs/th pop. 15–69 33.2 21
7.3.3 Wikipedia edits/mn pop. 15–69 73.2 29
7.3.4 Mobile app creation/bn PPP$ GDP 15.0 36
Score/
Value Rank
Institutions 90.1 5 ●
1.1 Political environment 87.4 10 ●
1.1.1 Political and operational stability* 83.9 13
1.1.2 Government effectiveness* 89.1 10 ●
1.2 Regulatory environment 93.4 8 ●
1.2.1 Regulatory quality* 88.4 10 ●
1.2.2 Rule of law* 93.1 12
1.2.3 Cost of redundancy dismissal 10.0 29
1.3 Business environment 89.6 4 ●
1.3.1 Ease of starting a business* 98.2 3 ● ◆
1.3.2 Ease of resolving insolvency* 81.0 12
Human capital and research 52.4 18
2.1 Education 58.9 33
2.1.1 Expenditure on education, % GDP 5.3 29
2.1.2 Government funding/pupil, secondary, % GDP/cap 18.3 58 ○
2.1.3 School life expectancy, years 16.2 32
2.1.4 PISA scales in reading, maths and science 516.7 7
2.1.5 Pupil-teacher ratio, secondary 9.9 28
2.2 Tertiary education 42.1 35
2.2.1 Tertiary enrolment, % gross 70.1 34
2.2.2 Graduates in science and engineering, % 22.4 56
2.2.3 Tertiary inbound mobility, % 13.8 14
2.3 Research and development (RD) 56.2 18
2.3.1 Researchers, FTE/mn pop. 4,325.6 23
2.3.2 Gross expenditure on RD, % GDP 1.5 23
2.3.3 Global corporate RD investors, top 3, mn US$ 63.4 21
2.3.4 QS university ranking, top 3* 79.2 6 ●
Infrastructure 53.7 30 ◇
3.1 Informationandcommunicationtechnologies(ICTs) 84.9 21
3.1.1 ICT access* 80.3 31
3.1.2 ICT use* 81.1 24
3.1.3 Government’s online service* 84.1 31
3.1.4 E-participation* 94.0 16
3.2 General infrastructure 48.1 13
3.2.1 Electricity output, GWh/mn pop. 17,655.8 5 ● ◆
3.2.2 Logistics performance* 78.0 20
3.2.3 Gross capital formation, % GDP 21.4 75 ○
3.3 Ecological sustainability 28.1 66 ◇
3.3.1 GDP/unit of energy use 5.7 111 ○ ◇
3.3.2 Environmental performance* 71.0 20
3.3.3 ISO 14001 environmental certificates/bn PPP$ GDP 0.4 89 ○ ◇
Market sophistication 84.7 1 ● ◆
4.1 Credit 85.0 [3]
4.1.1 Ease of getting credit* 85.0 14 ◆
4.1.2 Domestic credit to private sector, % GDP n/a n/a
4.1.3 Microfinance gross loans, % GDP n/a n/a
4.2 Investment 81.9 3 ● ◆
4.2.1 Ease of protecting minority investors* 84.0 7 ◆
4.2.2 Market capitalization, % GDP 128.9 7
4.2.3 Venture capital investors, deals/bn PPP$ GDP 0.4 1 ● ◆
4.2.4 Venture capital recipients, deals/bn PPP$ GDP 0.3 1 ● ◆
4.3 Trade, diversification, and market scale 87.2 9 ●
4.3.1 Applied tariff rate, weighted avg., % 1.5 18
4.3.2 Domestic industry diversification 97.9 11
4.3.3 Domestic market scale, bn PPP$ 1,809.0 15
NOTES: ● indicates a strength; ○ a weakness; ◆ an income group strength; ◇ an income group weakness; * an index; †
a survey question. indicates that
the
economy’s data are older than the base year; see appendices for details, including the year of the data, at http://globalinnovationindex.org. Square
brackets [ ] indicate
that the data minimum coverage (DMC) requirements were not met at the sub-pillar or pillar level.](https://image.slidesharecdn.com/e-220805033615-e8521670/75/E-INDEX-2021-pdf-85-2048.jpg)
![66 Global Innovation Index 2021
Chile GII 2021 rank
53
Output rank Input rank Income Region Population (mn) GDP, PPP$ (bn) GDP per capita, PPP$ GII 2020 rank
61 44 High LCN 19.1 456.4 23,455 54
Score/
Value Rank
Business sophistication 30.6 48
5.1 Knowledge workers 39.5 43
5.1.1 Knowledge-intensive employment, % 31.9 44
5.1.2 Firms offering formal training, % 57.5 10 ● ◆
5.1.3 GERD performed by business, % GDP 0.1 60 ◇
5.1.4 GERD financed by business, % 29.9 62
5.1.5 Females employed w/advanced degrees, % 11.9 63 ◇
5.2 Innovation linkages 17.4 93 ○ ◇
5.2.1 University-industry RD collaboration†
39.7 77 ◇
5.2.2 State of cluster development and depth†
44.8 78 ◇
5.2.3 GERD financed by abroad, % GDP 0.0 70
5.2.4 Joint venture/strategic alliance deals/bn PPP$ GDP 0.0 60
5.2.5 Patent families/bn PPP$ GDP 0.2 43
5.3 Knowledge absorption 34.8 43
5.3.1 Intellectual property payments, % total trade 2.2 12 ●
5.3.2 High-tech imports, % total trade 8.5 56
5.3.3 ICT services imports, % total trade 0.7 88 ◇
5.3.4 FDI net inflows, % GDP 3.0 51
5.3.5 Research talent, % in businesses 27.5 44
Knowledge and technology outputs 22.3 58
6.1 Knowledge creation 17.4 58
6.1.1 Patents by origin/bn PPP$ GDP 0.9 67
6.1.2 PCT patents by origin/bn PPP$ GDP 0.6 33
6.1.3 Utility models by origin/bn PPP$ GDP 0.2 45
6.1.4 Scientific and technical articles/bn PPP$ GDP 23.6 39
6.1.5 Citable documents H-index 24.3 37
6.2 Knowledge impact 39.9 24 ●
6.2.1 Labor productivity growth, % 1.4 34 ◆
6.2.2 New businesses/th pop. 15–64 10.3 12 ●
6.2.3 Software spending, % GDP 0.5 7 ●
6.2.4 ISO 9001 quality certificates/bn PPP$ GDP 6.8 40
6.2.5 High-tech manufacturing, % 23.9 54
6.3 Knowledge diffusion 9.6 96 ○ ◇
6.3.1 Intellectual property receipts, % total trade 0.1 67
6.3.2 Production and export complexity 39.7 71 ◇
6.3.3 High-tech exports, % total trade 0.8 76
6.3.4 ICT services exports, % total trade 0.6 100 ○
Creative outputs 25.3 60 ◇
7.1 Intangible assets 36.5 47
7.1.1 Trademarks by origin/bn PPP$ GDP 68.7 25
7.1.2 Global brand value, top 5,000, % GDP 39.1 40
7.1.3 Industrial designs by origin/bn PPP$ GDP 0.1 108 ○
7.1.4 ICTs and organizational model creation†
57.8 54
7.2 Creative goods and services 8.1 89 ◇
7.2.1 Cultural and creative services exports, % total trade 0.3 63
7.2.2 National feature films/mn pop. 15–69 3.7 51
7.2.3 Entertainment and media market/th pop. 15–69 13.8 32 ◇
7.2.4 Printing and other media, % manufacturing 0.7 78 ○
7.2.5 Creative goods exports, % total trade 0.1 92 ○
7.3 Online creativity 20.2 57 ◇
7.3.1 Generic top-level domains (TLDs)/th pop. 15–69 2.1 76 ◇
7.3.2 Country-code TLDs/th pop. 15–69 14.7 33
7.3.3 Wikipedia edits/mn pop. 15–69 60.4 51
7.3.4 Mobile app creation/bn PPP$ GDP 2.3 68
Score/
Value Rank
Institutions 72.7 40
1.1 Political environment 73.9 35
1.1.1 Political and operational stability* 73.2 44
1.1.2 Government effectiveness* 74.2 29
1.2 Regulatory environment 68.4 55 ◇
1.2.1 Regulatory quality* 75.5 25 ●
1.2.2 Rule of law* 75.0 26
1.2.3 Cost of redundancy dismissal 27.4 110 ○ ◇
1.3 Business environment 75.7 46
1.3.1 Ease of starting a business* 91.4 50
1.3.2 Ease of resolving insolvency* 60.1 48
Human capital and research 35.2 51
2.1 Education 53.5 55
2.1.1 Expenditure on education, % GDP 5.4 22 ●
2.1.2 Government funding/pupil, secondary, % GDP/cap 18.7 57
2.1.3 School life expectancy, years 16.6 22 ●
2.1.4 PISA scales in reading, maths and science 437.8 46 ◇
2.1.5 Pupil-teacher ratio, secondary 18.0 87 ○ ◇
2.2 Tertiary education 38.8 44
2.2.1 Tertiary enrolment, % gross 90.9 8 ●
2.2.2 Graduates in science and engineering, % 20.9 67
2.2.3 Tertiary inbound mobility, % 0.5 100 ○ ◇
2.3 Research and development (RD) 13.4 51 ◇
2.3.1 Researchers, FTE/mn pop. 491.5 68 ◇
2.3.2 Gross expenditure on RD, % GDP 0.3 76 ◇
2.3.3 Global corporate RD investors, top 3, mn US$ 0.0 41 ○ ◇
2.3.4 QS university ranking, top 3* 41.0 30
Infrastructure 47.4 47 ◇
3.1 Informationandcommunicationtechnologies(ICTs) 78.3 37
3.1.1 ICT access* 72.3 56 ◇
3.1.2 ICT use* 70.0 46
3.1.3 Government’s online service* 85.3 24
3.1.4 E-participation* 85.7 29
3.2 General infrastructure 31.9 53
3.2.1 Electricity output, GWh/mn pop. 4,385.3 51
3.2.2 Logistics performance* 59.0 33
3.2.3 Gross capital formation, % GDP 22.1 64
3.3 Ecological sustainability 31.9 52
3.3.1 GDP/unit of energy use 10.9 60
3.3.2 Environmental performance* 55.3 42
3.3.3 ISO 14001 environmental certificates/bn PPP$ GDP 2.0 43
Market sophistication 46.4 66
4.1 Credit 45.1 48
4.1.1 Ease of getting credit* 55.0 88 ○
4.1.2 Domestic credit to private sector, % GDP 122.5 16 ●
4.1.3 Microfinance gross loans, % GDP 0.8 26 ◆
4.2 Investment 25.9 82
4.2.1 Ease of protecting minority investors* 66.0 50
4.2.2 Market capitalization, % GDP 87.5 16
4.2.3 Venture capital investors, deals/bn PPP$ GDP 0.0 61
4.2.4 Venture capital recipients, deals/bn PPP$ GDP 0.0 67 ○
4.3 Trade, diversification, and market scale 68.3 68
4.3.1 Applied tariff rate, weighted avg., % 0.4 4 ●
4.3.2 Domestic industry diversification 61.4 103 ○ ◇
4.3.3 Domestic market scale, bn PPP$ 456.4 43
NOTES: ● indicates a strength; ○ a weakness; ◆ an income group strength; ◇ an income group weakness; * an index; †
a survey question. indicates that
the
economy’s data are older than the base year; see appendices for details, including the year of the data, at http://globalinnovationindex.org. Square
brackets [ ] indicate
that the data minimum coverage (DMC) requirements were not met at the sub-pillar or pillar level.](https://image.slidesharecdn.com/e-220805033615-e8521670/75/E-INDEX-2021-pdf-86-2048.jpg)
![67
GII 2021 Economy profiles
China GII 2021 rank
12
Output rank Input rank Income Region Population (mn) GDP, PPP$ (bn) GDP per capita, PPP$ GII 2020 rank
7 25 Upper middle SEAO 1,439.3 24,162.4 17,206 14
Score/
Value Rank
Business sophistication 54.3 13 ◆
5.1 Knowledge workers 77.7 [2]
5.1.1 Knowledge-intensive employment, % n/a n/a
5.1.2 Firms offering formal training, % 79.2 1 ● ◆
5.1.3 GERD performed by business, % GDP 1.7 12 ◆
5.1.4 GERD financed by business, % 76.3 4 ◆
5.1.5 Females employed w/advanced degrees, % n/a n/a
5.2 Innovation linkages 31.3 32 ◆
5.2.1 University-industry RD collaboration†
70.5 6 ◆
5.2.2 State of cluster development and depth†
73.1 3 ● ◆
5.2.3 GERD financed by abroad, % GDP 0.0 94 ○
5.2.4 Joint venture/strategic alliance deals/bn PPP$ GDP 0.0 63
5.2.5 Patent families/bn PPP$ GDP 1.4 26 ◆
5.3 Knowledge absorption 53.9 9 ◆
5.3.1 Intellectual property payments, % total trade 1.3 29
5.3.2 High-tech imports, % total trade 22.8 5 ◆
5.3.3 ICT services imports, % total trade 1.0 73
5.3.4 FDI net inflows, % GDP 1.4 101 ○
5.3.5 Research talent, % in businesses 57.7 15 ◆
Knowledge and technology outputs 58.5 4 ● ◆
6.1 Knowledge creation 70.5 4 ● ◆
6.1.1 Patents by origin/bn PPP$ GDP 53.2 1 ● ◆
6.1.2 PCT patents by origin/bn PPP$ GDP 2.8 13 ◆
6.1.3 Utility models by origin/bn PPP$ GDP 96.6 1 ● ◆
6.1.4 Scientific and technical articles/bn PPP$ GDP 21.3 42
6.1.5 Citable documents H-index 58.6 13 ◆
6.2 Knowledge impact 52.2 5 ◆
6.2.1 Labor productivity growth, % 5.2 6 ◆
6.2.2 New businesses/th pop. 15–64 n/a n/a
6.2.3 Software spending, % GDP 0.3 39
6.2.4 ISO 9001 quality certificates/bn PPP$ GDP 12.0 24
6.2.5 High-tech manufacturing, % 48.5 14 ◆
6.3 Knowledge diffusion 52.9 9 ◆
6.3.1 Intellectual property receipts, % total trade 0.2 36 ◆
6.3.2 Production and export complexity 74.9 18 ◆
6.3.3 High-tech exports, % total trade 27.8 1 ● ◆
6.3.4 ICT services exports, % total trade 2.1 53
Creative outputs 46.5 14 ◆
7.1 Intangible assets 70.9 2 ● ◆
7.1.1 Trademarks by origin/bn PPP$ GDP 324.1 1 ● ◆
7.1.2 Global brand value, top 5,000, % GDP 118.0 16 ◆
7.1.3 Industrial designs by origin/bn PPP$ GDP 29.6 1 ● ◆
7.1.4 ICTs and organizational model creation†
59.7 46
7.2 Creative goods and services 40.0 11 ◆
7.2.1 Cultural and creative services exports, % total trade 0.5 46
7.2.2 National feature films/mn pop. 15–69 0.8 91 ○
7.2.3 Entertainment and media market/th pop. 15–69 10.4 37 ◆
7.2.4 Printing and other media, % manufacturing 0.7 76 ○
7.2.5 Creative goods exports, % total trade 11.2 1 ● ◆
7.3 Online creativity 4.3[125]
7.3.1 Generic top-level domains (TLDs)/th pop. 15–69 2.2 74
7.3.2 Country-code TLDs/th pop. 15–69 6.3 47
7.3.3 Wikipedia edits/mn pop. 15–69 n/a n/a
7.3.4 Mobile app creation/bn PPP$ GDP n/a n/a
Score/
Value Rank
Institutions 64.4 61
1.1 Political environment 65.3 47 ◆
1.1.1 Political and operational stability* 71.4 54
1.1.2 Government effectiveness* 62.2 43 ◆
1.2 Regulatory environment 49.9 106 ○
1.2.1 Regulatory quality* 37.1 91
1.2.2 Rule of law* 39.5 77
1.2.3 Cost of redundancy dismissal 27.4 110 ○
1.3 Business environment 78.1 39
1.3.1 Ease of starting a business* 94.1 25 ◆
1.3.2 Ease of resolving insolvency* 62.1 46
Human capital and research 50.6 21 ◆
2.1 Education 66.7 [12]
2.1.1 Expenditure on education, % GDP n/a n/a
2.1.2 Government funding/pupil, secondary, % GDP/cap n/a n/a
2.1.3 School life expectancy, years 12.4 88 ○ ◇
2.1.4 PISA scales in reading, maths and science 579.0 1 ● ◆
2.1.5 Pupil-teacher ratio, secondary 13.3 56
2.2 Tertiary education 25.2 83
2.2.1 Tertiary enrolment, % gross 53.8 57
2.2.2 Graduates in science and engineering, % n/a n/a
2.2.3 Tertiary inbound mobility, % 0.4 101 ○
2.3 Research and development (RD) 59.8 14 ◆
2.3.1 Researchers, FTE/mn pop. 1,471.3 45
2.3.2 Gross expenditure on RD, % GDP 2.2 13 ◆
2.3.3 Global corporate RD investors, top 3, mn US$ 92.5 3 ● ◆
2.3.4 QS university ranking, top 3* 84.2 3 ● ◆
Infrastructure 54.6 24 ◆
3.1 Informationandcommunicationtechnologies(ICTs) 79.4 34 ◆
3.1.1 ICT access* 63.0 71
3.1.2 ICT use* 67.7 52 ◆
3.1.3 Government’s online service* 90.6 12 ◆
3.1.4 E-participation* 96.4 9 ◆
3.2 General infrastructure 54.4 5 ◆
3.2.1 Electricity output, GWh/mn pop. 5,332.3 40 ◆
3.2.2 Logistics performance* 72.3 26 ◆
3.2.3 Gross capital formation, % GDP 43.9 4 ● ◆
3.3 Ecological sustainability 29.9 59
3.3.1 GDP/unit of energy use 7.5 97 ○
3.3.2 Environmental performance* 37.3 98 ○ ◇
3.3.3 ISO 14001 environmental certificates/bn PPP$ GDP 5.8 17
Market sophistication 61.5 16 ◆
4.1 Credit 51.7 26 ◆
4.1.1 Ease of getting credit* 60.0 74
4.1.2 Domestic credit to private sector, % GDP 164.7 5 ◆
4.1.3 Microfinance gross loans, % GDP 0.0 74 ○
4.2 Investment 35.9 44
4.2.1 Ease of protecting minority investors* 72.0 27
4.2.2 Market capitalization, % GDP 58.6 28
4.2.3 Venture capital investors, deals/bn PPP$ GDP 0.1 29 ◆
4.2.4 Venture capital recipients, deals/bn PPP$ GDP 0.1 17 ◆
4.3 Trade, diversification, and market scale 96.9 1 ● ◆
4.3.1 Applied tariff rate, weighted avg., % 2.5 58
4.3.2 Domestic industry diversification 99.4 2 ●
4.3.3 Domestic market scale, bn PPP$ 24,162.4 1 ● ◆
NOTES: ● indicates a strength; ○ a weakness; ◆ an income group strength; ◇ an income group weakness; * an index; †
a survey question. indicates that
the
economy’s data are older than the base year; see appendices for details, including the year of the data, at http://globalinnovationindex.org. Square
brackets [ ] indicate
that the data minimum coverage (DMC) requirements were not met at the sub-pillar or pillar level.](https://image.slidesharecdn.com/e-220805033615-e8521670/75/E-INDEX-2021-pdf-87-2048.jpg)
![68 Global Innovation Index 2021
Colombia GII 2021 rank
67
Output rank Input rank Income Region Population (mn) GDP, PPP$ (bn) GDP per capita, PPP$ GII 2020 rank
75 58 Upper middle LCN 50.9 719.3 14,137 68
Score/
Value Rank
Business sophistication 29.4 50
5.1 Knowledge workers 44.4 36
5.1.1 Knowledge-intensive employment, % n/a n/a
5.1.2 Firms offering formal training, % 63.0 7 ● ◆
5.1.3 GERD performed by business, % GDP 0.1 61
5.1.4 GERD financed by business, % 43.0 37
5.1.5 Females employed w/advanced degrees, % 14.4 52
5.2 Innovation linkages 16.8 98 ○
5.2.1 University-industry RD collaboration†
45.2 53
5.2.2 State of cluster development and depth†
45.0 77
5.2.3 GERD financed by abroad, % GDP 0.0 69
5.2.4 Joint venture/strategic alliance deals/bn PPP$ GDP 0.0 84
5.2.5 Patent families/bn PPP$ GDP 0.1 61
5.3 Knowledge absorption 27.0 64
5.3.1 Intellectual property payments, % total trade 0.8 55
5.3.2 High-tech imports, % total trade 13.9 15 ●
5.3.3 ICT services imports, % total trade 1.4 54
5.3.4 FDI net inflows, % GDP 4.1 27 ●
5.3.5 Research talent, % in businesses 2.4 75 ○ ◇
Knowledge and technology outputs 19.2 72
6.1 Knowledge creation 9.6 80
6.1.1 Patents by origin/bn PPP$ GDP 0.5 78
6.1.2 PCT patents by origin/bn PPP$ GDP 0.2 53
6.1.3 Utility models by origin/bn PPP$ GDP 0.2 49
6.1.4 Scientific and technical articles/bn PPP$ GDP 9.8 87
6.1.5 Citable documents H-index 17.8 45
6.2 Knowledge impact 35.5 39
6.2.1 Labor productivity growth, % 3.6 13 ● ◆
6.2.2 New businesses/th pop. 15–64 2.0 55
6.2.3 Software spending, % GDP 0.2 70
6.2.4 ISO 9001 quality certificates/bn PPP$ GDP 13.5 21 ●
6.2.5 High-tech manufacturing, % 20.0 63
6.3 Knowledge diffusion 12.4 82
6.3.1 Intellectual property receipts, % total trade 0.2 45
6.3.2 Production and export complexity 46.2 56
6.3.3 High-tech exports, % total trade 1.3 69
6.3.4 ICT services exports, % total trade 0.7 90
Creative outputs 19.8 82
7.1 Intangible assets 27.1 78
7.1.1 Trademarks by origin/bn PPP$ GDP 36.8 64
7.1.2 Global brand value, top 5,000, % GDP 30.2 43
7.1.3 Industrial designs by origin/bn PPP$ GDP 0.4 89 ○
7.1.4 ICTs and organizational model creation†
54.5 62
7.2 Creative goods and services 7.7 90
7.2.1 Cultural and creative services exports, % total trade 0.2 70
7.2.2 National feature films/mn pop. 15–69 1.4 76
7.2.3 Entertainment and media market/th pop. 15–69 7.5 42
7.2.4 Printing and other media, % manufacturing 1.2 35
7.2.5 Creative goods exports, % total trade 0.2 74
7.3 Online creativity 17.2 66
7.3.1 Generic top-level domains (TLDs)/th pop. 15–69 2.8 66
7.3.2 Country-code TLDs/th pop. 15–69 21.7 29
7.3.3 Wikipedia edits/mn pop. 15–69 43.1 80
7.3.4 Mobile app creation/bn PPP$ GDP 2.0 70
Score/
Value Rank
Institutions 66.2 56
1.1 Political environment 55.7 72
1.1.1 Political and operational stability* 62.5 89 ○
1.1.2 Government effectiveness* 52.2 67
1.2 Regulatory environment 63.8 70
1.2.1 Regulatory quality* 53.9 53
1.2.2 Rule of law* 35.7 86
1.2.3 Cost of redundancy dismissal 16.7 65
1.3 Business environment 79.2 36
1.3.1 Ease of starting a business* 87.0 74
1.3.2 Ease of resolving insolvency* 71.4 30 ◆
Human capital and research 28.4 78
2.1 Education 42.4 87
2.1.1 Expenditure on education, % GDP 4.5 58
2.1.2 Government funding/pupil, secondary, % GDP/cap 19.1 56
2.1.3 School life expectancy, years 14.5 62
2.1.4 PISA scales in reading, maths and science 405.5 62 ○
2.1.5 Pupil-teacher ratio, secondary 26.1 107 ○ ◇
2.2 Tertiary education 32.7 67
2.2.1 Tertiary enrolment, % gross 55.0 55
2.2.2 Graduates in science and engineering, % 24.6 41
2.2.3 Tertiary inbound mobility, % 0.2 106 ○ ◇
2.3 Research and development (RD) 10.2 59
2.3.1 Researchers, FTE/mn pop. 88.0 91 ○ ◇
2.3.2 Gross expenditure on RD, % GDP 0.3 82
2.3.3 Global corporate RD investors, top 3, mn US$ 0.0 41 ○ ◇
2.3.4 QS university ranking, top 3* 34.4 35
Infrastructure 44.9 57
3.1 Informationandcommunicationtechnologies(ICTs) 68.3 61
3.1.1 ICT access* 60.9 74
3.1.2 ICT use* 48.9 82
3.1.3 Government’s online service* 76.5 49
3.1.4 E-participation* 86.9 27
3.2 General infrastructure 23.0 93
3.2.1 Electricity output, GWh/mn pop. 1,610.6 89
3.2.2 Logistics performance* 41.5 57
3.2.3 Gross capital formation, % GDP 19.7 90
3.3 Ecological sustainability 43.4 27 ● ◆
3.3.1 GDP/unit of energy use 18.2 11 ● ◆
3.3.2 Environmental performance* 52.9 48
3.3.3 ISO 14001 environmental certificates/bn PPP$ GDP 4.0 23 ●
Market sophistication 50.8 42
4.1 Credit 50.4 32 ◆
4.1.1 Ease of getting credit* 90.0 10 ● ◆
4.1.2 Domestic credit to private sector, % GDP 51.5 66
4.1.3 Microfinance gross loans, % GDP 1.8 15 ●
4.2 Investment 24.1 90
4.2.1 Ease of protecting minority investors* 80.0 13 ● ◆
4.2.2 Market capitalization, % GDP 37.0 41
4.2.3 Venture capital investors, deals/bn PPP$ GDP 0.0 84 ○
4.2.4 Venture capital recipients, deals/bn PPP$ GDP 0.0 72 ○
4.3 Trade, diversification, and market scale 78.0 35
4.3.1 Applied tariff rate, weighted avg., % 2.9 61
4.3.2 Domestic industry diversification 88.0 60
4.3.3 Domestic market scale, bn PPP$ 719.2 31
NOTES: ● indicates a strength; ○ a weakness; ◆ an income group strength; ◇ an income group weakness; * an index; †
a survey question. indicates that
the
economy’s data are older than the base year; see appendices for details, including the year of the data, at http://globalinnovationindex.org. Square
brackets [ ] indicate
that the data minimum coverage (DMC) requirements were not met at the sub-pillar or pillar level.](https://image.slidesharecdn.com/e-220805033615-e8521670/75/E-INDEX-2021-pdf-88-2048.jpg)
![69
GII 2021 Economy profiles
Costa Rica GII 2021 rank
56
Output rank Input rank Income Region Population (mn) GDP, PPP$ (bn) GDP per capita, PPP$ GII 2020 rank
49 66 Upper middle LCN 5.1 99.0 19,309 56
Score/
Value Rank
Business sophistication 30.0 49
5.1 Knowledge workers 29.3 73
5.1.1 Knowledge-intensive employment, % 27.4 56
5.1.2 Firms offering formal training, % 54.7 12 ●
5.1.3 GERD performed by business, % GDP 0.1 58
5.1.4 GERD financed by business, % 1.3 93 ○ ◇
5.1.5 Females employed w/advanced degrees, % 12.2 62
5.2 Innovation linkages 16.9 97
5.2.1 University-industry RD collaboration†
42.3 68
5.2.2 State of cluster development and depth†
49.2 51
5.2.3 GERD financed by abroad, % GDP 0.0 81
5.2.4 Joint venture/strategic alliance deals/bn PPP$ GDP 0.0 85
5.2.5 Patent families/bn PPP$ GDP 0.0 83
5.3 Knowledge absorption 43.7 22 ● ◆
5.3.1 Intellectual property payments, % total trade 2.8 7 ● ◆
5.3.2 High-tech imports, % total trade 8.9 46
5.3.3 ICT services imports, % total trade 1.3 58
5.3.4 FDI net inflows, % GDP 4.5 24
5.3.5 Research talent, % in businesses n/a n/a
Knowledge and technology outputs 22.9 56
6.1 Knowledge creation 6.1 100
6.1.1 Patents by origin/bn PPP$ GDP 0.2 101
6.1.2 PCT patents by origin/bn PPP$ GDP 0.1 63
6.1.3 Utility models by origin/bn PPP$ GDP 0.0 63
6.1.4 Scientific and technical articles/bn PPP$ GDP 9.0 92
6.1.5 Citable documents H-index 10.8 71
6.2 Knowledge impact 27.4 73
6.2.1 Labor productivity growth, % 1.6 32
6.2.2 New businesses/th pop. 15–64 2.6 50
6.2.3 Software spending, % GDP 0.3 31 ◆
6.2.4 ISO 9001 quality certificates/bn PPP$ GDP 2.8 78
6.2.5 High-tech manufacturing, % 13.3 83
6.3 Knowledge diffusion 35.3 27 ◆
6.3.1 Intellectual property receipts, % total trade 0.0 79
6.3.2 Production and export complexity 51.6 47
6.3.3 High-tech exports, % total trade 5.7 32
6.3.4 ICT services exports, % total trade 6.6 7 ● ◆
Creative outputs 31.3 45
7.1 Intangible assets 38.5 42
7.1.1 Trademarks by origin/bn PPP$ GDP 85.8 16 ● ◆
7.1.2 Global brand value, top 5,000, % GDP 0.0 80 ○ ◇
7.1.3 Industrial designs by origin/bn PPP$ GDP 0.1 109 ○
7.1.4 ICTs and organizational model creation†
63.0 36 ◆
7.2 Creative goods and services 31.3 22 ● ◆
7.2.1 Cultural and creative services exports, % total trade 5.1 1 ● ◆
7.2.2 National feature films/mn pop. 15–69 3.6 52
7.2.3 Entertainment and media market/th pop. 15–69 n/a n/a
7.2.4 Printing and other media, % manufacturing 2.2 13 ● ◆
7.2.5 Creative goods exports, % total trade 0.1 93
7.3 Online creativity 17.0 67
7.3.1 Generic top-level domains (TLDs)/th pop. 15–69 11.2 37 ◆
7.3.2 Country-code TLDs/th pop. 15–69 1.5 76
7.3.3 Wikipedia edits/mn pop. 15–69 51.0 63
7.3.4 Mobile app creation/bn PPP$ GDP 4.1 60
Score/
Value Rank
Institutions 63.1 66
1.1 Political environment 63.2 51
1.1.1 Political and operational stability* 69.6 60
1.1.2 Government effectiveness* 60.1 48
1.2 Regulatory environment 68.8 52
1.2.1 Regulatory quality* 56.5 50 ◆
1.2.2 Rule of law* 61.1 42 ◆
1.2.3 Cost of redundancy dismissal 18.7 77
1.3 Business environment 57.3 112 ○ ◇
1.3.1 Ease of starting a business* 79.9 110 ○
1.3.2 Ease of resolving insolvency* 34.6 114 ○ ◇
Human capital and research 32.4 61
2.1 Education 62.5 18 ● ◆
2.1.1 Expenditure on education, % GDP 7.0 6 ● ◆
2.1.2 Government funding/pupil, secondary, % GDP/cap 24.1 19 ◆
2.1.3 School life expectancy, years 16.5 24 ◆
2.1.4 PISA scales in reading, maths and science 414.8 59
2.1.5 Pupil-teacher ratio, secondary 13.3 58
2.2 Tertiary education 28.2 80
2.2.1 Tertiary enrolment, % gross 57.7 52
2.2.2 Graduates in science and engineering, % 15.1 99 ○
2.2.3 Tertiary inbound mobility, % n/a n/a
2.3 Research and development (RD) 6.6 72
2.3.1 Researchers, FTE/mn pop. 345.0 74
2.3.2 Gross expenditure on RD, % GDP 0.4 72
2.3.3 Global corporate RD investors, top 3, mn US$ 0.0 41 ○ ◇
2.3.4 QS university ranking, top 3* 15.1 59
Infrastructure 40.7 71
3.1 Informationandcommunicationtechnologies(ICTs) 67.7 64
3.1.1 ICT access* 69.4 63
3.1.2 ICT use* 67.8 51 ◆
3.1.3 Government’s online service* 68.2 72
3.1.4 E-participation* 65.5 77
3.2 General infrastructure 18.2 115 ○
3.2.1 Electricity output, GWh/mn pop. 2,268.5 77
3.2.2 Logistics performance* 34.6 72
3.2.3 Gross capital formation, % GDP 15.4 114 ○
3.3 Ecological sustainability 36.3 43
3.3.1 GDP/unit of energy use 17.2 14 ● ◆
3.3.2 Environmental performance* 52.5 50
3.3.3 ISO 14001 environmental certificates/bn PPP$ GDP 1.1 65
Market sophistication 43.0 85
4.1 Credit 43.5 54
4.1.1 Ease of getting credit* 85.0 14 ●
4.1.2 Domestic credit to private sector, % GDP 58.8 57
4.1.3 Microfinance gross loans, % GDP 0.1 64
4.2 Investment 17.0 125 ○ ◇
4.2.1 Ease of protecting minority investors* 48.0 96
4.2.2 Market capitalization, % GDP 4.4 72 ○
4.2.3 Venture capital investors, deals/bn PPP$ GDP 0.0 73 ○
4.2.4 Venture capital recipients, deals/bn PPP$ GDP n/a n/a
4.3 Trade, diversification, and market scale 68.4 67
4.3.1 Applied tariff rate, weighted avg., % 1.6 20 ●
4.3.2 Domestic industry diversification 80.2 77
4.3.3 Domestic market scale, bn PPP$ 99.0 84
NOTES: ● indicates a strength; ○ a weakness; ◆ an income group strength; ◇ an income group weakness; * an index; †
a survey question. indicates that
the
economy’s data are older than the base year; see appendices for details, including the year of the data, at http://globalinnovationindex.org. Square
brackets [ ] indicate
that the data minimum coverage (DMC) requirements were not met at the sub-pillar or pillar level.](https://image.slidesharecdn.com/e-220805033615-e8521670/75/E-INDEX-2021-pdf-89-2048.jpg)
![70 Global Innovation Index 2021
Côte d’Ivoire GII 2021 rank
114
Output rank Input rank Income Region Population (mn) GDP, PPP$ (bn) GDP per capita, PPP$ GII 2020 rank
121 107 Lower middle SSF 26.4 144.5 5,360 112
Score/
Value Rank
Business sophistication 20.9 91
5.1 Knowledge workers 21.7 [98]
5.1.1 Knowledge-intensive employment, % 10.3 110
5.1.2 Firms offering formal training, % 35.5 41 ●
5.1.3 GERD performed by business, % GDP n/a n/a
5.1.4 GERD financed by business, % n/a n/a
5.1.5 Females employed w/advanced degrees, % 1.3 111
5.2 Innovation linkages 18.3 81
5.2.1 University-industry RD collaboration†
38.1 89
5.2.2 State of cluster development and depth†
43.8 81
5.2.3 GERD financed by abroad, % GDP n/a n/a
5.2.4 Joint venture/strategic alliance deals/bn PPP$ GDP 0.0 123 ○
5.2.5 Patent families/bn PPP$ GDP 0.0 100 ○ ◇
5.3 Knowledge absorption 22.6 78
5.3.1 Intellectual property payments, % total trade 0.1 111
5.3.2 High-tech imports, % total trade 5.9 99
5.3.3 ICT services imports, % total trade 2.6 15 ● ◆
5.3.4 FDI net inflows, % GDP 1.6 92
5.3.5 Research talent, % in businesses n/a n/a
Knowledge and technology outputs 11.5 110
6.1 Knowledge creation 2.6 124 ○
6.1.1 Patents by origin/bn PPP$ GDP 0.1 109
6.1.2 PCT patents by origin/bn PPP$ GDP 0.0 98 ○ ◇
6.1.3 Utility models by origin/bn PPP$ GDP 0.0 70
6.1.4 Scientific and technical articles/bn PPP$ GDP 3.1 120
6.1.5 Citable documents H-index 6.1 95
6.2 Knowledge impact 23.3 88
6.2.1 Labor productivity growth, % 3.1 16 ●
6.2.2 New businesses/th pop. 15–64 0.7 89
6.2.3 Software spending, % GDP 0.0 119 ○ ◇
6.2.4 ISO 9001 quality certificates/bn PPP$ GDP 1.6 95
6.2.5 High-tech manufacturing, % n/a n/a
6.3 Knowledge diffusion 8.6 100
6.3.1 Intellectual property receipts, % total trade 0.0 92
6.3.2 Production and export complexity 21.7 107
6.3.3 High-tech exports, % total trade 1.1 71 ●
6.3.4 ICT services exports, % total trade 1.2 74
Creative outputs 9.9 121
7.1 Intangible assets 16.1 116
7.1.1 Trademarks by origin/bn PPP$ GDP 6.7 117 ○
7.1.2 Global brand value, top 5,000, % GDP 3.6 71
7.1.3 Industrial designs by origin/bn PPP$ GDP 0.5 88
7.1.4 ICTs and organizational model creation†
50.3 81
7.2 Creative goods and services 1.4[123]
7.2.1 Cultural and creative services exports, % total trade 0.1 77
7.2.2 National feature films/mn pop. 15–69 n/a n/a
7.2.3 Entertainment and media market/th pop. 15–69 n/a n/a
7.2.4 Printing and other media, % manufacturing n/a n/a
7.2.5 Creative goods exports, % total trade 0.0 118
7.3 Online creativity 5.9 118
7.3.1 Generic top-level domains (TLDs)/th pop. 15–69 0.4 112
7.3.2 Country-code TLDs/th pop. 15–69 0.2 113
7.3.3 Wikipedia edits/mn pop. 15–69 21.1 119
7.3.4 Mobile app creation/bn PPP$ GDP n/a n/a
Score/
Value Rank
Institutions 60.6 79 ◆
1.1 Political environment 48.6 93
1.1.1 Political and operational stability* 66.1 74
1.1.2 Government effectiveness* 39.9 98
1.2 Regulatory environment 62.2 75
1.2.1 Regulatory quality* 37.1 90
1.2.2 Rule of law* 31.8 99
1.2.3 Cost of redundancy dismissal 13.1 46 ●
1.3 Business environment 70.8 69 ●
1.3.1 Ease of starting a business* 93.7 27 ● ◆
1.3.2 Ease of resolving insolvency* 47.9 77
Human capital and research 11.1 124 ○ ◇
2.1 Education 26.7 122 ○ ◇
2.1.1 Expenditure on education, % GDP 3.3 89
2.1.2 Government funding/pupil, secondary, % GDP/cap 13.6 80
2.1.3 School life expectancy, years 10.5 104
2.1.4 PISA scales in reading, maths and science n/a n/a
2.1.5 Pupil-teacher ratio, secondary 28.9 116 ○ ◇
2.2 Tertiary education 6.3 121 ○ ◇
2.2.1 Tertiary enrolment, % gross 10.0 115
2.2.2 Graduates in science and engineering, % n/a n/a
2.2.3 Tertiary inbound mobility, % 2.2 76
2.3 Research and development (RD) 0.4 114
2.3.1 Researchers, FTE/mn pop. n/a n/a
2.3.2 Gross expenditure on RD, % GDP 0.1 110 ○ ◇
2.3.3 Global corporate RD investors, top 3, mn US$ 0.0 41 ○ ◇
2.3.4 QS university ranking, top 3* 0.0 74 ○ ◇
Infrastructure 28.0 109
3.1 Informationandcommunicationtechnologies(ICTs) 40.0 110
3.1.1 ICT access* 39.4 107
3.1.2 ICT use* 34.7 102
3.1.3 Government’s online service* 45.3 113
3.1.4 E-participation* 40.5 115
3.2 General infrastructure 26.9 73 ●
3.2.1 Electricity output, GWh/mn pop. 401.3 112
3.2.2 Logistics performance* 48.1 49 ● ◆
3.2.3 Gross capital formation, % GDP 23.7 55 ●
3.3 Ecological sustainability 17.1 114
3.3.1 GDP/unit of energy use 9.6 72
3.3.2 Environmental performance* 25.8 129 ○ ◇
3.3.3 ISO 14001 environmental certificates/bn PPP$ GDP 0.3 100
Market sophistication 36.0 117
4.1 Credit 31.1 101
4.1.1 Ease of getting credit* 70.0 44 ●
4.1.2 Domestic credit to private sector, % GDP 19.6 114
4.1.3 Microfinance gross loans, % GDP 0.2 49
4.2 Investment 25.1 [83]
4.2.1 Ease of protecting minority investors* 42.0 102
4.2.2 Market capitalization, % GDP n/a n/a
4.2.3 Venture capital investors, deals/bn PPP$ GDP n/a n/a
4.2.4 Venture capital recipients, deals/bn PPP$ GDP 0.0 53
4.3 Trade, diversification, and market scale 51.7 114
4.3.1 Applied tariff rate, weighted avg., % 7.7 101
4.3.2 Domestic industry diversification n/a n/a
4.3.3 Domestic market scale, bn PPP$ 144.5 74 ●
NOTES: ● indicates a strength; ○ a weakness; ◆ an income group strength; ◇ an income group weakness; * an index; †
a survey question. indicates that
the
economy’s data are older than the base year; see appendices for details, including the year of the data, at http://globalinnovationindex.org. Square
brackets [ ] indicate
that the data minimum coverage (DMC) requirements were not met at the sub-pillar or pillar level.](https://image.slidesharecdn.com/e-220805033615-e8521670/75/E-INDEX-2021-pdf-90-2048.jpg)
![71
GII 2021 Economy profiles
Croatia GII 2021 rank
42
Output rank Input rank Income Region Population (mn) GDP, PPP$ (bn) GDP per capita, PPP$ GII 2020 rank
48 41 High EUR 4.1 112.0 27,681 41
Score/
Value Rank
Business sophistication 27.7 55
5.1 Knowledge workers 37.0 53
5.1.1 Knowledge-intensive employment, % 37.1 33
5.1.2 Firms offering formal training, % 26.2 60
5.1.3 GERD performed by business, % GDP 0.5 38
5.1.4 GERD financed by business, % 33.2 56
5.1.5 Females employed w/advanced degrees, % 17.6 38
5.2 Innovation linkages 18.3 80 ◇
5.2.1 University-industry RD collaboration†
29.4 113 ○ ◇
5.2.2 State of cluster development and depth†
30.2 123 ○ ◇
5.2.3 GERD financed by abroad, % GDP 0.2 21 ●
5.2.4 Joint venture/strategic alliance deals/bn PPP$ GDP 0.0 59
5.2.5 Patent families/bn PPP$ GDP 0.1 53
5.3 Knowledge absorption 27.8 62
5.3.1 Intellectual property payments, % total trade 1.1 37
5.3.2 High-tech imports, % total trade 6.4 89 ○
5.3.3 ICT services imports, % total trade 1.6 46
5.3.4 FDI net inflows, % GDP 1.6 90 ○
5.3.5 Research talent, % in businesses 24.8 51
Knowledge and technology outputs 26.9 47
6.1 Knowledge creation 22.5 48
6.1.1 Patents by origin/bn PPP$ GDP 1.8 40
6.1.2 PCT patents by origin/bn PPP$ GDP 0.2 52
6.1.3 Utility models by origin/bn PPP$ GDP 0.5 37
6.1.4 Scientific and technical articles/bn PPP$ GDP 37.4 23 ●
6.1.5 Citable documents H-index 17.3 49
6.2 Knowledge impact 33.5 49
6.2.1 Labor productivity growth, % −2.4 108 ○ ◇
6.2.2 New businesses/th pop. 15–64 5.9 28 ●
6.2.3 Software spending, % GDP 0.1 97 ○ ◇
6.2.4 ISO 9001 quality certificates/bn PPP$ GDP 22.4 6 ● ◆
6.2.5 High-tech manufacturing, % 26.2 47
6.3 Knowledge diffusion 24.7 48
6.3.1 Intellectual property receipts, % total trade 0.2 37
6.3.2 Production and export complexity 64.0 30
6.3.3 High-tech exports, % total trade 3.0 48
6.3.4 ICT services exports, % total trade 3.1 34
Creative outputs 28.2 54
7.1 Intangible assets 30.2 69
7.1.1 Trademarks by origin/bn PPP$ GDP 52.2 44
7.1.2 Global brand value, top 5,000, % GDP 8.5 62
7.1.3 Industrial designs by origin/bn PPP$ GDP 3.4 31
7.1.4 ICTs and organizational model creation†
51.9 73 ◇
7.2 Creative goods and services 25.2 38
7.2.1 Cultural and creative services exports, % total trade 1.7 15 ●
7.2.2 National feature films/mn pop. 15–69 2.0 67
7.2.3 Entertainment and media market/th pop. 15–69 n/a n/a
7.2.4 Printing and other media, % manufacturing 2.7 5 ● ◆
7.2.5 Creative goods exports, % total trade 0.8 51
7.3 Online creativity 27.2 41
7.3.1 Generic top-level domains (TLDs)/th pop. 15–69 14.8 32
7.3.2 Country-code TLDs/th pop. 15–69 11.5 39
7.3.3 Wikipedia edits/mn pop. 15–69 70.5 35
7.3.4 Mobile app creation/bn PPP$ GDP 9.2 49
Score/
Value Rank
Institutions 69.8 46
1.1 Political environment 66.6 45
1.1.1 Political and operational stability* 80.4 29
1.1.2 Government effectiveness* 59.8 49 ◇
1.2 Regulatory environment 71.8 45
1.2.1 Regulatory quality* 58.9 44
1.2.2 Rule of law* 56.4 48 ◇
1.2.3 Cost of redundancy dismissal 15.1 59
1.3 Business environment 70.9 68
1.3.1 Ease of starting a business* 85.3 87 ○ ◇
1.3.2 Ease of resolving insolvency* 56.5 58
Human capital and research 37.6 47
2.1 Education 59.1 32
2.1.1 Expenditure on education, % GDP 3.9 71
2.1.2 Government funding/pupil, secondary, % GDP/cap n/a n/a
2.1.3 School life expectancy, years 15.2 48
2.1.4 PISA scales in reading, maths and science 471.9 37
2.1.5 Pupil-teacher ratio, secondary 6.4 1 ● ◆
2.2 Tertiary education 39.8 40
2.2.1 Tertiary enrolment, % gross 67.7 37
2.2.2 Graduates in science and engineering, % 26.3 32
2.2.3 Tertiary inbound mobility, % 3.0 66
2.3 Research and development (RD) 14.0 50
2.3.1 Researchers, FTE/mn pop. 2,135.4 38
2.3.2 Gross expenditure on RD, % GDP 1.1 35
2.3.3 Global corporate RD investors, top 3, mn US$ 0.0 41 ○ ◇
2.3.4 QS university ranking, top 3* 8.4 68 ◇
Infrastructure 53.8 29 ●
3.1 Informationandcommunicationtechnologies(ICTs) 78.2 39
3.1.1 ICT access* 79.0 38
3.1.2 ICT use* 69.3 48 ◇
3.1.3 Government’s online service* 75.3 52
3.1.4 E-participation* 89.3 23 ●
3.2 General infrastructure 30.8 58
3.2.1 Electricity output, GWh/mn pop. 3,109.1 63
3.2.2 Logistics performance* 49.1 48
3.2.3 Gross capital formation, % GDP 25.2 45
3.3 Ecological sustainability 52.3 6 ● ◆
3.3.1 GDP/unit of energy use 12.5 43
3.3.2 Environmental performance* 63.1 34
3.3.3 ISO 14001 environmental certificates/bn PPP$ GDP 9.8 6 ● ◆
Market sophistication 46.1 67
4.1 Credit 35.6 86
4.1.1 Ease of getting credit* 50.0 94 ○
4.1.2 Domestic credit to private sector, % GDP 54.4 60
4.1.3 Microfinance gross loans, % GDP n/a n/a
4.2 Investment 28.0 73
4.2.1 Ease of protecting minority investors* 70.0 36
4.2.2 Market capitalization, % GDP 37.1 40
4.2.3 Venture capital investors, deals/bn PPP$ GDP 0.0 76 ○ ◇
4.2.4 Venture capital recipients, deals/bn PPP$ GDP n/a n/a
4.3 Trade, diversification, and market scale 74.8 43
4.3.1 Applied tariff rate, weighted avg., % 1.8 25
4.3.2 Domestic industry diversification 95.8 23 ●
4.3.3 Domestic market scale, bn PPP$ 112.0 79
NOTES: ● indicates a strength; ○ a weakness; ◆ an income group strength; ◇ an income group weakness; * an index; †
a survey question. indicates that
the
economy’s data are older than the base year; see appendices for details, including the year of the data, at http://globalinnovationindex.org. Square
brackets [ ] indicate
that the data minimum coverage (DMC) requirements were not met at the sub-pillar or pillar level.](https://image.slidesharecdn.com/e-220805033615-e8521670/75/E-INDEX-2021-pdf-91-2048.jpg)
![72 Global Innovation Index 2021
Cyprus GII 2021 rank
28
Output rank Input rank Income Region Population (mn) GDP, PPP$ (bn) GDP per capita, PPP$ GII 2020 rank
21 31 High NAWA 1.2 34.6 39,079 29
Score/
Value Rank
Business sophistication 42.6 28
5.1 Knowledge workers 42.2 40
5.1.1 Knowledge-intensive employment, % 35.5 38
5.1.2 Firms offering formal training, % 39.7 30
5.1.3 GERD performed by business, % GDP 0.3 50
5.1.4 GERD financed by business, % 34.8 55
5.1.5 Females employed w/advanced degrees, % 25.5 13
5.2 Innovation linkages 39.9 25
5.2.1 University-industry RD collaboration†
43.9 59
5.2.2 State of cluster development and depth†
49.1 54
5.2.3 GERD financed by abroad, % GDP 0.2 28
5.2.4 Joint venture/strategic alliance deals/bn PPP$ GDP 0.2 14
5.2.5 Patent families/bn PPP$ GDP 2.0 19
5.3 Knowledge absorption 45.6 20
5.3.1 Intellectual property payments, % total trade 1.5 26
5.3.2 High-tech imports, % total trade 3.6 120 ○ ◇
5.3.3 ICT services imports, % total trade 11.1 1 ● ◆
5.3.4 FDI net inflows, % GDP 44.2 1 ● ◆
5.3.5 Research talent, % in businesses 33.5 39
Knowledge and technology outputs 39.4 21
6.1 Knowledge creation 32.2 30
6.1.1 Patents by origin/bn PPP$ GDP 1.4 53
6.1.2 PCT patents by origin/bn PPP$ GDP 1.2 26
6.1.3 Utility models by origin/bn PPP$ GDP n/a n/a
6.1.4 Scientific and technical articles/bn PPP$ GDP 51.1 8 ● ◆
6.1.5 Citable documents H-index 12.4 62
6.2 Knowledge impact 38.6 27
6.2.1 Labor productivity growth, % −1.6 95 ○
6.2.2 New businesses/th pop. 15–64 17.6 5 ● ◆
6.2.3 Software spending, % GDP 0.2 75
6.2.4 ISO 9001 quality certificates/bn PPP$ GDP 21.4 9 ◆
6.2.5 High-tech manufacturing, % 19.2 64
6.3 Knowledge diffusion 47.3 17
6.3.1 Intellectual property receipts, % total trade 0.9 22
6.3.2 Production and export complexity 48.1 50
6.3.3 High-tech exports, % total trade 0.9 72
6.3.4 ICT services exports, % total trade 16.3 1 ● ◆
Creative outputs 41.3 20
7.1 Intangible assets 45.4 27
7.1.1 Trademarks by origin/bn PPP$ GDP 89.6 13 ◆
7.1.2 Global brand value, top 5,000, % GDP 0.0 80 ○ ◇
7.1.3 Industrial designs by origin/bn PPP$ GDP 15.3 7 ● ◆
7.1.4 ICTs and organizational model creation†
47.3 93 ○ ◇
7.2 Creative goods and services 14.4 65
7.2.1 Cultural and creative services exports, % total trade 0.2 68
7.2.2 National feature films/mn pop. 15–69 6.9 32
7.2.3 Entertainment and media market/th pop. 15–69 n/a n/a
7.2.4 Printing and other media, % manufacturing 1.9 16
7.2.5 Creative goods exports, % total trade 0.2 75
7.3 Online creativity 60.1 8 ● ◆
7.3.1 Generic top-level domains (TLDs)/th pop. 15–69 72.3 8 ● ◆
7.3.2 Country-code TLDs/th pop. 15–69 5.8 51
7.3.3 Wikipedia edits/mn pop. 15–69 60.8 50
7.3.4 Mobile app creation/bn PPP$ GDP 100.0 1 ● ◆
Score/
Value Rank
Institutions 80.4 26
1.1 Political environment 74.7 33
1.1.1 Political and operational stability* 78.6 34
1.1.2 Government effectiveness* 72.7 34
1.2 Regulatory environment 84.2 22
1.2.1 Regulatory quality* 70.0 32
1.2.2 Rule of law* 66.7 35
1.2.3 Cost of redundancy dismissal 8.0 1 ● ◆
1.3 Business environment 82.3 26
1.3.1 Ease of starting a business* 92.0 45
1.3.2 Ease of resolving insolvency* 72.5 29
Human capital and research 38.7 42
2.1 Education 65.9 14
2.1.1 Expenditure on education, % GDP 5.8 18
2.1.2 Government funding/pupil, secondary, % GDP/cap 37.4 3 ● ◆
2.1.3 School life expectancy, years 15.4 47
2.1.4 PISA scales in reading, maths and science 438.0 45 ◇
2.1.5 Pupil-teacher ratio, secondary 8.1 10 ◆
2.2 Tertiary education 42.8 34
2.2.1 Tertiary enrolment, % gross 81.3 19
2.2.2 Graduates in science and engineering, % 15.1 98 ○ ◇
2.2.3 Tertiary inbound mobility, % 23.9 5 ● ◆
2.3 Research and development (RD) 7.4 66 ◇
2.3.1 Researchers, FTE/mn pop. 1,432.8 47 ◇
2.3.2 Gross expenditure on RD, % GDP 0.6 55
2.3.3 Global corporate RD investors, top 3, mn US$ 0.0 41 ○ ◇
2.3.4 QS university ranking, top 3* 0.0 74 ○ ◇
Infrastructure 53.9 28
3.1 Informationandcommunicationtechnologies(ICTs) 88.3 14
3.1.1 ICT access* 87.9 11
3.1.2 ICT use* 83.0 14
3.1.3 Government’s online service* 87.1 20
3.1.4 E-participation* 95.2 14
3.2 General infrastructure 26.3 75 ◇
3.2.1 Electricity output, GWh/mn pop. 5,842.0 36
3.2.2 Logistics performance* 51.3 44
3.2.3 Gross capital formation, % GDP 16.2 109 ○ ◇
3.3 Ecological sustainability 47.0 21
3.3.1 GDP/unit of energy use 13.9 32
3.3.2 Environmental performance* 64.8 31
3.3.3 ISO 14001 environmental certificates/bn PPP$ GDP 6.2 16
Market sophistication 50.0 46
4.1 Credit 53.2 22
4.1.1 Ease of getting credit* 60.0 74
4.1.2 Domestic credit to private sector, % GDP 112.3 20
4.1.3 Microfinance gross loans, % GDP n/a n/a
4.2 Investment 33.0 56
4.2.1 Ease of protecting minority investors* 76.0 21
4.2.2 Market capitalization, % GDP 14.2 64 ○
4.2.3 Venture capital investors, deals/bn PPP$ GDP 0.1 36
4.2.4 Venture capital recipients, deals/bn PPP$ GDP 0.1 14
4.3 Trade, diversification, and market scale 63.8 79
4.3.1 Applied tariff rate, weighted avg., % 1.8 25
4.3.2 Domestic industry diversification 80.3 76
4.3.3 Domestic market scale, bn PPP$ 34.6 117 ○ ◇
NOTES: ● indicates a strength; ○ a weakness; ◆ an income group strength; ◇ an income group weakness; * an index; †
a survey question. indicates that
the
economy’s data are older than the base year; see appendices for details, including the year of the data, at http://globalinnovationindex.org. Square
brackets [ ] indicate
that the data minimum coverage (DMC) requirements were not met at the sub-pillar or pillar level.](https://image.slidesharecdn.com/e-220805033615-e8521670/75/E-INDEX-2021-pdf-92-2048.jpg)
![73
GII 2021 Economy profiles
Czech Republic GII 2021 rank
24
Output rank Input rank Income Region Population (mn) GDP, PPP$ (bn) GDP per capita, PPP$ GII 2020 rank
15 30 High EUR 10.7 430.9 40,293 24
Score/
Value Rank
Business sophistication 43.5 25 ◇
5.1 Knowledge workers 45.4 31 ◇
5.1.1 Knowledge-intensive employment, % 37.7 31 ◇
5.1.2 Firms offering formal training, % 43.6 24
5.1.3 GERD performed by business, % GDP 1.2 17
5.1.4 GERD financed by business, % 38.2 47 ◇
5.1.5 Females employed w/advanced degrees, % 12.3 61 ◇
5.2 Innovation linkages 36.4 26 ◇
5.2.1 University-industry RD collaboration†
53.7 32 ◇
5.2.2 State of cluster development and depth†
47.3 62 ◇
5.2.3 GERD financed by abroad, % GDP 0.5 3 ● ◆
5.2.4 Joint venture/strategic alliance deals/bn PPP$ GDP 0.0 77 ○ ◇
5.2.5 Patent families/bn PPP$ GDP 0.6 30 ◇
5.3 Knowledge absorption 48.5 15 ●
5.3.1 Intellectual property payments, % total trade 0.8 53
5.3.2 High-tech imports, % total trade 20.7 8 ● ◆
5.3.3 ICT services imports, % total trade 1.3 57
5.3.4 FDI net inflows, % GDP 4.1 28
5.3.5 Research talent, % in businesses 51.1 22
Knowledge and technology outputs 48.2 12 ●
6.1 Knowledge creation 39.4 22
6.1.1 Patents by origin/bn PPP$ GDP 2.1 34 ◇
6.1.2 PCT patents by origin/bn PPP$ GDP 0.5 35 ◇
6.1.3 Utility models by origin/bn PPP$ GDP 2.8 6 ● ◆
6.1.4 Scientific and technical articles/bn PPP$ GDP 35.1 25
6.1.5 Citable documents H-index 30.3 31
6.2 Knowledge impact 53.1 4 ● ◆
6.2.1 Labor productivity growth, % −0.1 65 ○
6.2.2 New businesses/th pop. 15–64 4.4 34
6.2.3 Software spending, % GDP 0.2 54
6.2.4 ISO 9001 quality certificates/bn PPP$ GDP 27.4 4 ● ◆
6.2.5 High-tech manufacturing, % 61.1 3 ● ◆
6.3 Knowledge diffusion 52.2 10 ●
6.3.1 Intellectual property receipts, % total trade 0.3 30 ◇
6.3.2 Production and export complexity 85.6 7 ●
6.3.3 High-tech exports, % total trade 21.0 7 ● ◆
6.3.4 ICT services exports, % total trade 2.6 44
Creative outputs 40.3 22
7.1 Intangible assets 36.2 49 ◇
7.1.1 Trademarks by origin/bn PPP$ GDP 53.7 42
7.1.2 Global brand value, top 5,000, % GDP 26.0 47 ◇
7.1.3 Industrial designs by origin/bn PPP$ GDP 3.3 33
7.1.4 ICTs and organizational model creation†
66.3 26 ◇
7.2 Creative goods and services 46.7 4 ● ◆
7.2.1 Cultural and creative services exports, % total trade 0.6 44
7.2.2 National feature films/mn pop. 15–69 7.0 29
7.2.3 Entertainment and media market/th pop. 15–69 25.6 26 ◇
7.2.4 Printing and other media, % manufacturing 0.9 63 ○
7.2.5 Creative goods exports, % total trade 11.0 1 ● ◆
7.3 Online creativity 42.1 28
7.3.1 Generic top-level domains (TLDs)/th pop. 15–69 16.8 30 ◇
7.3.2 Country-code TLDs/th pop. 15–69 54.2 16
7.3.3 Wikipedia edits/mn pop. 15–69 76.4 18
7.3.4 Mobile app creation/bn PPP$ GDP 17.3 29
Score/
Value Rank
Institutions 76.9 32 ◇
1.1 Political environment 74.3 34 ◇
1.1.1 Political and operational stability* 82.1 24
1.1.2 Government effectiveness* 70.3 35 ◇
1.2 Regulatory environment 75.5 37
1.2.1 Regulatory quality* 76.0 24
1.2.2 Rule of law* 74.3 28 ◇
1.2.3 Cost of redundancy dismissal 20.2 85 ○
1.3 Business environment 81.1 29
1.3.1 Ease of starting a business* 82.1 103 ○ ◇
1.3.2 Ease of resolving insolvency* 80.1 15 ●
Human capital and research 43.0 33 ◇
2.1 Education 55.1 49
2.1.1 Expenditure on education, % GDP 3.9 72 ○
2.1.2 Government funding/pupil, secondary, % GDP/cap 23.5 23
2.1.3 School life expectancy, years 16.3 30
2.1.4 PISA scales in reading, maths and science 495.5 23
2.1.5 Pupil-teacher ratio, secondary 11.5 45
2.2 Tertiary education 44.5 22
2.2.1 Tertiary enrolment, % gross 63.8 44
2.2.2 Graduates in science and engineering, % 26.1 33
2.2.3 Tertiary inbound mobility, % 13.6 15
2.3 Research and development (RD) 29.5 37 ◇
2.3.1 Researchers, FTE/mn pop. 3,976.0 26
2.3.2 Gross expenditure on RD, % GDP 1.9 18
2.3.3 Global corporate RD investors, top 3, mn US$ 0.0 41 ○ ◇
2.3.4 QS university ranking, top 3* 31.5 38 ◇
Infrastructure 56.0 19
3.1 Informationandcommunicationtechnologies(ICTs) 73.9 53 ◇
3.1.1 ICT access* 73.2 53 ◇
3.1.2 ICT use* 77.2 29 ◇
3.1.3 Government’s online service* 72.4 61 ◇
3.1.4 E-participation* 72.6 65 ◇
3.2 General infrastructure 42.6 21
3.2.1 Electricity output, GWh/mn pop. 8,047.2 22
3.2.2 Logistics performance* 75.8 22
3.2.3 Gross capital formation, % GDP 25.9 40
3.3 Ecological sustainability 51.4 13 ●
3.3.1 GDP/unit of energy use 9.4 74 ○
3.3.2 Environmental performance* 71.0 20
3.3.3 ISO 14001 environmental certificates/bn PPP$ GDP 9.7 7 ● ◆
Market sophistication 49.5 50 ◇
4.1 Credit 44.8 51
4.1.1 Ease of getting credit* 70.0 44
4.1.2 Domestic credit to private sector, % GDP 50.6 68 ◇
4.1.3 Microfinance gross loans, % GDP n/a n/a
4.2 Investment 24.2 89 ○ ◇
4.2.1 Ease of protecting minority investors* 62.0 60 ○
4.2.2 Market capitalization, % GDP n/a n/a
4.2.3 Venture capital investors, deals/bn PPP$ GDP 0.0 44 ◇
4.2.4 Venture capital recipients, deals/bn PPP$ GDP 0.0 82 ○ ◇
4.3 Trade, diversification, and market scale 79.4 30
4.3.1 Applied tariff rate, weighted avg., % 1.8 25
4.3.2 Domestic industry diversification 93.6 37
4.3.3 Domestic market scale, bn PPP$ 430.9 46
NOTES: ● indicates a strength; ○ a weakness; ◆ an income group strength; ◇ an income group weakness; * an index; †
a survey question. indicates that
the
economy’s data are older than the base year; see appendices for details, including the year of the data, at http://globalinnovationindex.org. Square
brackets [ ] indicate
that the data minimum coverage (DMC) requirements were not met at the sub-pillar or pillar level.](https://image.slidesharecdn.com/e-220805033615-e8521670/75/E-INDEX-2021-pdf-93-2048.jpg)
![74 Global Innovation Index 2021
Denmark GII 2021 rank
9
Output rank Input rank Income Region Population (mn) GDP, PPP$ (bn) GDP per capita, PPP$ GII 2020 rank
11 5 High EUR 5.8 335.8 57,781 6
Score/
Value Rank
Business sophistication 55.2 11
5.1 Knowledge workers 65.8 8
5.1.1 Knowledge-intensive employment, % 48.8 11
5.1.2 Firms offering formal training, % n/a n/a
5.1.3 GERD performed by business, % GDP 1.8 11
5.1.4 GERD financed by business, % 60.4 13
5.1.5 Females employed w/advanced degrees, % 22.9 21
5.2 Innovation linkages 58.6 7
5.2.1 University-industry RD collaboration†
66.3 12
5.2.2 State of cluster development and depth†
63.1 20
5.2.3 GERD financed by abroad, % GDP 0.3 9
5.2.4 Joint venture/strategic alliance deals/bn PPP$ GDP 0.2 16
5.2.5 Patent families/bn PPP$ GDP 4.8 9
5.3 Knowledge absorption 41.1 26
5.3.1 Intellectual property payments, % total trade 0.9 43
5.3.2 High-tech imports, % total trade 5.8 100 ○
5.3.3 ICT services imports, % total trade 3.4 6
5.3.4 FDI net inflows, % GDP 0.4 120 ○
5.3.5 Research talent, % in businesses 58.5 13
Knowledge and technology outputs 47.6 14
6.1 Knowledge creation 61.5 10
6.1.1 Patents by origin/bn PPP$ GDP 10.8 9
6.1.2 PCT patents by origin/bn PPP$ GDP 4.6 7
6.1.3 Utility models by origin/bn PPP$ GDP 0.2 46 ○
6.1.4 Scientific and technical articles/bn PPP$ GDP 62.2 2 ● ◆
6.1.5 Citable documents H-index 51.0 15
6.2 Knowledge impact 45.1 13
6.2.1 Labor productivity growth, % −0.1 69 ○
6.2.2 New businesses/th pop. 15–64 10.0 16
6.2.3 Software spending, % GDP 0.5 13
6.2.4 ISO 9001 quality certificates/bn PPP$ GDP 7.2 38
6.2.5 High-tech manufacturing, % 48.8 13
6.3 Knowledge diffusion 36.2 24
6.3.1 Intellectual property receipts, % total trade 1.9 13
6.3.2 Production and export complexity 69.2 24
6.3.3 High-tech exports, % total trade 5.2 34
6.3.4 ICT services exports, % total trade 2.8 39
Creative outputs 47.7 13
7.1 Intangible assets 47.2 23
7.1.1 Trademarks by origin/bn PPP$ GDP 34.0 67 ○
7.1.2 Global brand value, top 5,000, % GDP 131.7 15
7.1.3 Industrial designs by origin/bn PPP$ GDP 6.8 20
7.1.4 ICTs and organizational model creation†
78.9 7
7.2 Creative goods and services 32.1 21
7.2.1 Cultural and creative services exports, % total trade 0.8 36
7.2.2 National feature films/mn pop. 15–69 13.4 10
7.2.3 Entertainment and media market/th pop. 15–69 76.5 4
7.2.4 Printing and other media, % manufacturing 0.9 60 ○
7.2.5 Creative goods exports, % total trade 1.5 35
7.3 Online creativity 64.3 6
7.3.1 Generic top-level domains (TLDs)/th pop. 15–69 49.9 16
7.3.2 Country-code TLDs/th pop. 15–69 100.0 1 ● ◆
7.3.3 Wikipedia edits/mn pop. 15–69 72.0 32
7.3.4 Mobile app creation/bn PPP$ GDP 32.1 16
Score/
Value Rank
Institutions 88.8 8
1.1 Political environment 92.8 2 ● ◆
1.1.1 Political and operational stability* 91.1 5 ● ◆
1.1.2 Government effectiveness* 93.7 3 ● ◆
1.2 Regulatory environment 84.6 20
1.2.1 Regulatory quality* 84.4 16
1.2.2 Rule of law* 96.7 5 ●
1.2.3 Cost of redundancy dismissal 18.8 78 ○
1.3 Business environment 88.9 6
1.3.1 Ease of starting a business* 92.7 42
1.3.2 Ease of resolving insolvency* 85.1 6
Human capital and research 62.3 5 ● ◆
2.1 Education 74.2 5 ● ◆
2.1.1 Expenditure on education, % GDP 7.8 3 ● ◆
2.1.2 Government funding/pupil, secondary, % GDP/cap 22.9 27
2.1.3 School life expectancy, years 18.8 9
2.1.4 PISA scales in reading, maths and science 501.1 17
2.1.5 Pupil-teacher ratio, secondary 9.9 26
2.2 Tertiary education 43.3 30
2.2.1 Tertiary enrolment, % gross 81.2 20
2.2.2 Graduates in science and engineering, % 22.2 58 ○
2.2.3 Tertiary inbound mobility, % 10.7 19
2.3 Research and development (RD) 69.5 7
2.3.1 Researchers, FTE/mn pop. 7,739.4 2 ● ◆
2.3.2 Gross expenditure on RD, % GDP 2.9 9
2.3.3 Global corporate RD investors, top 3, mn US$ 69.1 16
2.3.4 QS university ranking, top 3* 58.1 15
Infrastructure 60.8 5 ●
3.1 Informationandcommunicationtechnologies(ICTs) 91.0 3 ●
3.1.1 ICT access* 80.2 32
3.1.2 ICT use* 90.4 2 ● ◆
3.1.3 Government’s online service* 97.1 3 ● ◆
3.1.4 E-participation* 96.4 9
3.2 General infrastructure 39.6 31
3.2.1 Electricity output, GWh/mn pop. 5,073.2 42
3.2.2 Logistics performance* 90.3 8
3.2.3 Gross capital formation, % GDP 21.2 77 ○
3.3 Ecological sustainability 51.7 11
3.3.1 GDP/unit of energy use 18.6 10
3.3.2 Environmental performance* 82.5 1 ●
3.3.3 ISO 14001 environmental certificates/bn PPP$ GDP 3.0 28
Market sophistication 68.0 7
4.1 Credit 68.5 8
4.1.1 Ease of getting credit* 70.0 44 ○
4.1.2 Domestic credit to private sector, % GDP 159.7 7
4.1.3 Microfinance gross loans, % GDP n/a n/a
4.2 Investment 58.6 13
4.2.1 Ease of protecting minority investors* 72.0 27
4.2.2 Market capitalization, % GDP n/a n/a
4.2.3 Venture capital investors, deals/bn PPP$ GDP 0.3 11
4.2.4 Venture capital recipients, deals/bn PPP$ GDP 0.1 11
4.3 Trade, diversification, and market scale 76.9 37
4.3.1 Applied tariff rate, weighted avg., % 1.8 25
4.3.2 Domestic industry diversification 90.0 50
4.3.3 Domestic market scale, bn PPP$ 335.8 51
NOTES: ● indicates a strength; ○ a weakness; ◆ an income group strength; ◇ an income group weakness; * an index; †
a survey question. indicates that
the
economy’s data are older than the base year; see appendices for details, including the year of the data, at http://globalinnovationindex.org. Square
brackets [ ] indicate
that the data minimum coverage (DMC) requirements were not met at the sub-pillar or pillar level.](https://image.slidesharecdn.com/e-220805033615-e8521670/75/E-INDEX-2021-pdf-94-2048.jpg)
![75
GII 2021 Economy profiles
Dominican Republic GII 2021 rank
93
Output rank Input rank Income Region Population (mn) GDP, PPP$ (bn) GDP per capita, PPP$ GII 2020 rank
98 93 Upper middle LCN 10.8 196.5 18,783 90
Score/
Value Rank
Business sophistication 21.8 86
5.1 Knowledge workers 24.7 [86]
5.1.1 Knowledge-intensive employment, % 16.7 91
5.1.2 Firms offering formal training, % 23.4 67
5.1.3 GERD performed by business, % GDP n/a n/a
5.1.4 GERD financed by business, % n/a n/a
5.1.5 Females employed w/advanced degrees, % 9.5 73
5.2 Innovation linkages 19.4 73
5.2.1 University-industry RD collaboration†
33.0 102
5.2.2 State of cluster development and depth†
50.0 47 ●
5.2.3 GERD financed by abroad, % GDP n/a n/a
5.2.4 Joint venture/strategic alliance deals/bn PPP$ GDP 0.0 125 ○
5.2.5 Patent families/bn PPP$ GDP 0.0 79
5.3 Knowledge absorption 21.4 85
5.3.1 Intellectual property payments, % total trade 0.8 48 ●
5.3.2 High-tech imports, % total trade 6.5 87
5.3.3 ICT services imports, % total trade 0.3 120 ◇
5.3.4 FDI net inflows, % GDP 3.6 35 ●
5.3.5 Research talent, % in businesses n/a n/a
Knowledge and technology outputs 11.7 108
6.1 Knowledge creation 1.6 128 ○ ◇
6.1.1 Patents by origin/bn PPP$ GDP 0.1 111
6.1.2 PCT patents by origin/bn PPP$ GDP 0.1 75
6.1.3 Utility models by origin/bn PPP$ GDP 0.1 56
6.1.4 Scientific and technical articles/bn PPP$ GDP 1.1 130 ○ ◇
6.1.5 Citable documents H-index 2.8 124 ○
6.2 Knowledge impact 21.3 96
6.2.1 Labor productivity growth, % 1.9 28 ●
6.2.2 New businesses/th pop. 15–64 1.5 69
6.2.3 Software spending, % GDP 0.0 116 ○ ◇
6.2.4 ISO 9001 quality certificates/bn PPP$ GDP 1.0 109
6.2.5 High-tech manufacturing, % n/a n/a
6.3 Knowledge diffusion 12.2 83
6.3.1 Intellectual property receipts, % total trade n/a n/a
6.3.2 Production and export complexity 39.7 69
6.3.3 High-tech exports, % total trade 1.8 63
6.3.4 ICT services exports, % total trade 0.4 104
Creative outputs 19.0 84
7.1 Intangible assets 23.1 90
7.1.1 Trademarks by origin/bn PPP$ GDP 38.3 60
7.1.2 Global brand value, top 5,000, % GDP 3.2 73
7.1.3 Industrial designs by origin/bn PPP$ GDP 0.0 118 ○
7.1.4 ICTs and organizational model creation†
48.9 85
7.2 Creative goods and services 20.8 [49]
7.2.1 Cultural and creative services exports, % total trade n/a n/a
7.2.2 National feature films/mn pop. 15–69 3.5 53
7.2.3 Entertainment and media market/th pop. 15–69 n/a n/a
7.2.4 Printing and other media, % manufacturing n/a n/a
7.2.5 Creative goods exports, % total trade 2.2 28 ●
7.3 Online creativity 8.8 103
7.3.1 Generic top-level domains (TLDs)/th pop. 15–69 2.4 73
7.3.2 Country-code TLDs/th pop. 15–69 1.3 78
7.3.3 Wikipedia edits/mn pop. 15–69 33.8 95 ◇
7.3.4 Mobile app creation/bn PPP$ GDP 0.0 98 ○
Score/
Value Rank
Institutions 55.1 96
1.1 Political environment 51.7 88
1.1.1 Political and operational stability* 69.6 60
1.1.2 Government effectiveness* 42.7 91
1.2 Regulatory environment 51.9 101
1.2.1 Regulatory quality* 42.1 74
1.2.2 Rule of law* 37.6 83
1.2.3 Cost of redundancy dismissal 26.2 106
1.3 Business environment 61.7 99
1.3.1 Ease of starting a business* 85.4 85
1.3.2 Ease of resolving insolvency* 38.0 108 ◇
Human capital and research 18.5 102 ◇
2.1 Education 35.4 105 ◇
2.1.1 Expenditure on education, % GDP n/a n/a
2.1.2 Government funding/pupil, secondary, % GDP/cap 13.1 82
2.1.3 School life expectancy, years 14.2 68
2.1.4 PISA scales in reading, maths and science 334.1 79 ○ ◇
2.1.5 Pupil-teacher ratio, secondary 17.7 86
2.2 Tertiary education 20.1 94
2.2.1 Tertiary enrolment, % gross 59.9 50 ●
2.2.2 Graduates in science and engineering, % 11.6 104 ○ ◇
2.2.3 Tertiary inbound mobility, % 1.7 79
2.3 Research and development (RD) 0.0[123]
2.3.1 Researchers, FTE/mn pop. n/a n/a
2.3.2 Gross expenditure on RD, % GDP n/a n/a
2.3.3 Global corporate RD investors, top 3, mn US$ 0.0 41 ○ ◇
2.3.4 QS university ranking, top 3* 0.0 74 ○ ◇
Infrastructure 39.6 75
3.1 Informationandcommunicationtechnologies(ICTs) 63.1 76
3.1.1 ICT access* 46.3 95 ◇
3.1.2 ICT use* 52.3 78
3.1.3 Government’s online service* 76.5 49 ●
3.1.4 E-participation* 77.4 51 ●
3.2 General infrastructure 20.9 105
3.2.1 Electricity output, GWh/mn pop. 1,849.2 84
3.2.2 Logistics performance* 28.6 85
3.2.3 Gross capital formation, % GDP 20.9 81
3.3 Ecological sustainability 34.6 47 ●
3.3.1 GDP/unit of energy use 19.4 9 ● ◆
3.3.2 Environmental performance* 46.3 68
3.3.3 ISO 14001 environmental certificates/bn PPP$ GDP 0.2 121
Market sophistication 39.5 104 ◇
4.1 Credit 24.2 117 ◇
4.1.1 Ease of getting credit* 45.0 101 ◇
4.1.2 Domestic credit to private sector, % GDP 28.2 99
4.1.3 Microfinance gross loans, % GDP 0.6 31 ●
4.2 Investment 34.0 [53]
4.2.1 Ease of protecting minority investors* 34.0 118 ◇
4.2.2 Market capitalization, % GDP n/a n/a
4.2.3 Venture capital investors, deals/bn PPP$ GDP n/a n/a
4.2.4 Venture capital recipients, deals/bn PPP$ GDP n/a n/a
4.3 Trade, diversification, and market scale 60.3 94
4.3.1 Applied tariff rate, weighted avg., % 4.2 77
4.3.2 Domestic industry diversification n/a n/a
4.3.3 Domestic market scale, bn PPP$ 196.5 65
NOTES: ● indicates a strength; ○ a weakness; ◆ an income group strength; ◇ an income group weakness; * an index; †
a survey question. indicates that
the
economy’s data are older than the base year; see appendices for details, including the year of the data, at http://globalinnovationindex.org. Square
brackets [ ] indicate
that the data minimum coverage (DMC) requirements were not met at the sub-pillar or pillar level.](https://image.slidesharecdn.com/e-220805033615-e8521670/75/E-INDEX-2021-pdf-95-2048.jpg)
![76 Global Innovation Index 2021
Ecuador GII 2021 rank
91
Output rank Input rank Income Region Population (mn) GDP, PPP$ (bn) GDP per capita, PPP$ GII 2020 rank
94 92 Upper middle LCN 17.6 185.9 10,617 99
Score/
Value Rank
Business sophistication 19.9 97
5.1 Knowledge workers 28.5 78
5.1.1 Knowledge-intensive employment, % 13.9 95 ◇
5.1.2 Firms offering formal training, % 73.7 2 ● ◆
5.1.3 GERD performed by business, % GDP 0.2 55
5.1.4 GERD financed by business, % 0.1 99 ○ ◇
5.1.5 Females employed w/advanced degrees, % 8.7 76
5.2 Innovation linkages 13.0 118 ◇
5.2.1 University-industry RD collaboration†
31.3 108 ◇
5.2.2 State of cluster development and depth†
39.7 102
5.2.3 GERD financed by abroad, % GDP 0.0 77
5.2.4 Joint venture/strategic alliance deals/bn PPP$ GDP 0.0 121 ○
5.2.5 Patent families/bn PPP$ GDP 0.0 84
5.3 Knowledge absorption 18.2 101
5.3.1 Intellectual property payments, % total trade 0.5 67
5.3.2 High-tech imports, % total trade 6.4 90
5.3.3 ICT services imports, % total trade 0.4 112 ◇
5.3.4 FDI net inflows, % GDP 0.9 108
5.3.5 Research talent, % in businesses n/a n/a
Knowledge and technology outputs 13.2 97
6.1 Knowledge creation 7.6 91
6.1.1 Patents by origin/bn PPP$ GDP 0.1 107
6.1.2 PCT patents by origin/bn PPP$ GDP 0.0 89
6.1.3 Utility models by origin/bn PPP$ GDP 0.2 44
6.1.4 Scientific and technical articles/bn PPP$ GDP 11.6 72
6.1.5 Citable documents H-index 9.3 81
6.2 Knowledge impact 27.2 75
6.2.1 Labor productivity growth, % 0.2 62
6.2.2 New businesses/th pop. 15–64 n/a n/a
6.2.3 Software spending, % GDP 0.2 64
6.2.4 ISO 9001 quality certificates/bn PPP$ GDP 5.6 52 ●
6.2.5 High-tech manufacturing, % 13.3 82
6.3 Knowledge diffusion 4.8 121 ◇
6.3.1 Intellectual property receipts, % total trade 0.0 73
6.3.2 Production and export complexity 21.4 109 ◇
6.3.3 High-tech exports, % total trade 0.3 104
6.3.4 ICT services exports, % total trade 0.2 117
Creative outputs 18.5 86
7.1 Intangible assets 29.4 74
7.1.1 Trademarks by origin/bn PPP$ GDP 59.6 36 ●
7.1.2 Global brand value, top 5,000, % GDP 0.0 80 ○ ◇
7.1.3 Industrial designs by origin/bn PPP$ GDP 0.4 91
7.1.4 ICTs and organizational model creation†
52.9 66
7.2 Creative goods and services 4.6 108
7.2.1 Cultural and creative services exports, % total trade 0.0 109 ○
7.2.2 National feature films/mn pop. 15–69 2.1 64
7.2.3 Entertainment and media market/th pop. 15–69 n/a n/a
7.2.4 Printing and other media, % manufacturing 0.9 62
7.2.5 Creative goods exports, % total trade 0.0 114
7.3 Online creativity 10.7 90
7.3.1 Generic top-level domains (TLDs)/th pop. 15–69 1.9 78
7.3.2 Country-code TLDs/th pop. 15–69 1.1 84
7.3.3 Wikipedia edits/mn pop. 15–69 40.9 83
7.3.4 Mobile app creation/bn PPP$ GDP 0.2 86
Score/
Value Rank
Institutions 44.1 126 ○ ◇
1.1 Political environment 45.1 103 ◇
1.1.1 Political and operational stability* 51.8 119 ◇
1.1.2 Government effectiveness* 41.8 94 ◇
1.2 Regulatory environment 39.8 121 ◇
1.2.1 Regulatory quality* 22.0 119 ◇
1.2.2 Rule of law* 31.5 101
1.2.3 Cost of redundancy dismissal 31.8 122 ○ ◇
1.3 Business environment 47.3 128 ○ ◇
1.3.1 Ease of starting a business* 69.1 128 ○ ◇
1.3.2 Ease of resolving insolvency* 25.5 126 ○ ◇
Human capital and research 20.5 97 ◇
2.1 Education 41.6 89
2.1.1 Expenditure on education, % GDP 5.0 39 ●
2.1.2 Government funding/pupil, secondary, % GDP/cap 6.7 100 ○ ◇
2.1.3 School life expectancy, years 14.8 56
2.1.4 PISA scales in reading, maths and science n/a n/a
2.1.5 Pupil-teacher ratio, secondary 20.6 97
2.2 Tertiary education 13.6 106 ◇
2.2.1 Tertiary enrolment, % gross 47.6 66
2.2.2 Graduates in science and engineering, % 9.4 110 ○ ◇
2.2.3 Tertiary inbound mobility, % 0.8 93
2.3 Research and development (RD) 6.4 73
2.3.1 Researchers, FTE/mn pop. 399.5 72
2.3.2 Gross expenditure on RD, % GDP 0.4 70
2.3.3 Global corporate RD investors, top 3, mn US$ 0.0 41 ○ ◇
2.3.4 QS university ranking, top 3* 12.4 62 ●
Infrastructure 39.6 74
3.1 Informationandcommunicationtechnologies(ICTs) 63.7 73
3.1.1 ICT access* 51.3 90
3.1.2 ICT use* 42.6 97 ◇
3.1.3 Government’s online service* 81.2 40 ●
3.1.4 E-participation* 79.8 49 ●
3.2 General infrastructure 24.8 85
3.2.1 Electricity output, GWh/mn pop. 1,859.1 83
3.2.2 Logistics performance* 38.8 61
3.2.3 Gross capital formation, % GDP 22.4 63
3.3 Ecological sustainability 30.3 57 ●
3.3.1 GDP/unit of energy use 13.0 38 ●
3.3.2 Environmental performance* 51.0 54 ●
3.3.3 ISO 14001 environmental certificates/bn PPP$ GDP 0.8 72
Market sophistication 50.3 44 ●
4.1 Credit 44.5 52 ●
4.1.1 Ease of getting credit* 45.0 101 ◇
4.1.2 Domestic credit to private sector, % GDP 42.8 78
4.1.3 Microfinance gross loans, % GDP 6.1 1 ● ◆
4.2 Investment 44.0 [26]
4.2.1 Ease of protecting minority investors* 44.0 98 ◇
4.2.2 Market capitalization, % GDP n/a n/a
4.2.3 Venture capital investors, deals/bn PPP$ GDP n/a n/a
4.2.4 Venture capital recipients, deals/bn PPP$ GDP n/a n/a
4.3 Trade, diversification, and market scale 62.6 85
4.3.1 Applied tariff rate, weighted avg., % 8.1 104
4.3.2 Domestic industry diversification 77.5 85
4.3.3 Domestic market scale, bn PPP$ 185.9 66
NOTES: ● indicates a strength; ○ a weakness; ◆ an income group strength; ◇ an income group weakness; * an index; †
a survey question. indicates that
the
economy’s data are older than the base year; see appendices for details, including the year of the data, at http://globalinnovationindex.org. Square
brackets [ ] indicate
that the data minimum coverage (DMC) requirements were not met at the sub-pillar or pillar level.](https://image.slidesharecdn.com/e-220805033615-e8521670/75/E-INDEX-2021-pdf-96-2048.jpg)
![77
GII 2021 Economy profiles
Egypt GII 2021 rank
94
Output rank Input rank Income Region Population (mn) GDP, PPP$ (bn) GDP per capita, PPP$ GII 2020 rank
86 102 Lower middle NAWA 102.3 1,292.5 12,719 96
Score/
Value Rank
Business sophistication 18.0 106
5.1 Knowledge workers 13.9 113
5.1.1 Knowledge-intensive employment, % 29.6 50 ◆
5.1.2 Firms offering formal training, % 7.9 96 ○ ◇
5.1.3 GERD performed by business, % GDP 0.0 79 ○
5.1.4 GERD financed by business, % 3.9 86
5.1.5 Females employed w/advanced degrees, % 5.8 92
5.2 Innovation linkages 20.7 65
5.2.1 University-industry RD collaboration†
44.3 56
5.2.2 State of cluster development and depth†
67.2 12 ● ◆
5.2.3 GERD financed by abroad, % GDP 0.0 87
5.2.4 Joint venture/strategic alliance deals/bn PPP$ GDP 0.0 101
5.2.5 Patent families/bn PPP$ GDP 0.0 95
5.3 Knowledge absorption 19.6 96
5.3.1 Intellectual property payments, % total trade 0.3 80
5.3.2 High-tech imports, % total trade 9.3 40 ●
5.3.3 ICT services imports, % total trade 1.0 80
5.3.4 FDI net inflows, % GDP 3.1 44 ●
5.3.5 Research talent, % in businesses 6.3 68
Knowledge and technology outputs 19.4 70
6.1 Knowledge creation 13.8 68
6.1.1 Patents by origin/bn PPP$ GDP 0.8 69
6.1.2 PCT patents by origin/bn PPP$ GDP 0.0 77
6.1.3 Utility models by origin/bn PPP$ GDP n/a n/a
6.1.4 Scientific and technical articles/bn PPP$ GDP 15.9 54
6.1.5 Citable documents H-index 17.7 46 ● ◆
6.2 Knowledge impact 33.0 53 ● ◆
6.2.1 Labor productivity growth, % 4.5 9 ●
6.2.2 New businesses/th pop. 15–64 n/a n/a
6.2.3 Software spending, % GDP 0.2 72
6.2.4 ISO 9001 quality certificates/bn PPP$ GDP 1.9 90
6.2.5 High-tech manufacturing, % 21.8 58
6.3 Knowledge diffusion 11.3 90
6.3.1 Intellectual property receipts, % total trade 0.0 99
6.3.2 Production and export complexity 42.5 66
6.3.3 High-tech exports, % total trade 0.5 90
6.3.4 ICT services exports, % total trade 1.2 73
Creative outputs 15.5 104
7.1 Intangible assets 21.3 95
7.1.1 Trademarks by origin/bn PPP$ GDP 18.7 95
7.1.2 Global brand value, top 5,000, % GDP 3.1 75
7.1.3 Industrial designs by origin/bn PPP$ GDP 1.4 58
7.1.4 ICTs and organizational model creation†
56.0 57
7.2 Creative goods and services 8.2 87
7.2.1 Cultural and creative services exports, % total trade n/a n/a
7.2.2 National feature films/mn pop. 15–69 0.6 94 ○
7.2.3 Entertainment and media market/th pop. 15–69 0.8 61 ○
7.2.4 Printing and other media, % manufacturing 0.5 84
7.2.5 Creative goods exports, % total trade 1.3 40 ●
7.3 Online creativity 11.4 87
7.3.1 Generic top-level domains (TLDs)/th pop. 15–69 1.2 92
7.3.2 Country-code TLDs/th pop. 15–69 0.0 123 ○
7.3.3 Wikipedia edits/mn pop. 15–69 45.1 76 ◆
7.3.4 Mobile app creation/bn PPP$ GDP 0.2 85
Score/
Value Rank
Institutions 49.3 114
1.1 Political environment 47.1 99
1.1.1 Political and operational stability* 58.9 100
1.1.2 Government effectiveness* 41.2 95
1.2 Regulatory environment 35.8 124 ○ ◇
1.2.1 Regulatory quality* 21.9 121 ○
1.2.2 Rule of law* 35.6 87
1.2.3 Cost of redundancy dismissal 36.8 125 ○ ◇
1.3 Business environment 65.0 84
1.3.1 Ease of starting a business* 87.8 72
1.3.2 Ease of resolving insolvency* 42.2 93
Human capital and research 21.8 93
2.1 Education 40.7 [93]
2.1.1 Expenditure on education, % GDP n/a n/a
2.1.2 Government funding/pupil, secondary, % GDP/cap 11.8 85
2.1.3 School life expectancy, years 13.6 75
2.1.4 PISA scales in reading, maths and science n/a n/a
2.1.5 Pupil-teacher ratio, secondary 15.8 78
2.2 Tertiary education 13.9 105
2.2.1 Tertiary enrolment, % gross 38.9 76
2.2.2 Graduates in science and engineering, % 11.2 105 ○ ◇
2.2.3 Tertiary inbound mobility, % 1.8 78
2.3 Research and development (RD) 10.7 55 ◆
2.3.1 Researchers, FTE/mn pop. 686.7 60
2.3.2 Gross expenditure on RD, % GDP 0.7 49 ◆
2.3.3 Global corporate RD investors, top 3, mn US$ 0.0 41 ○ ◇
2.3.4 QS university ranking, top 3* 20.4 52 ● ◆
Infrastructure 33.5 92
3.1 Informationandcommunicationtechnologies(ICTs) 52.5 92
3.1.1 ICT access* 58.8 78 ◆
3.1.2 ICT use* 43.1 95
3.1.3 Government’s online service* 57.1 94
3.1.4 E-participation* 51.2 99
3.2 General infrastructure 21.4 102
3.2.1 Electricity output, GWh/mn pop. 1,971.8 81
3.2.2 Logistics performance* 36.1 66
3.2.3 Gross capital formation, % GDP 19.0 96
3.3 Ecological sustainability 26.7 76 ◆
3.3.1 GDP/unit of energy use 12.1 48 ●
3.3.2 Environmental performance* 43.3 81 ◆
3.3.3 ISO 14001 environmental certificates/bn PPP$ GDP 0.8 73
Market sophistication 40.9 96
4.1 Credit 29.5 108
4.1.1 Ease of getting credit* 65.0 61
4.1.2 Domestic credit to private sector, % GDP 24.0 109
4.1.3 Microfinance gross loans, % GDP 0.1 62
4.2 Investment 19.6 117 ○
4.2.1 Ease of protecting minority investors* 64.0 56
4.2.2 Market capitalization, % GDP 17.0 62
4.2.3 Venture capital investors, deals/bn PPP$ GDP 0.0 67
4.2.4 Venture capital recipients, deals/bn PPP$ GDP 0.0 60
4.3 Trade, diversification, and market scale 73.6 49 ●
4.3.1 Applied tariff rate, weighted avg., % 10.4 119 ○
4.3.2 Domestic industry diversification 92.2 45 ●
4.3.3 Domestic market scale, bn PPP$ 1,292.5 19 ● ◆
NOTES: ● indicates a strength; ○ a weakness; ◆ an income group strength; ◇ an income group weakness; * an index; †
a survey question. indicates that
the
economy’s data are older than the base year; see appendices for details, including the year of the data, at http://globalinnovationindex.org. Square
brackets [ ] indicate
that the data minimum coverage (DMC) requirements were not met at the sub-pillar or pillar level.](https://image.slidesharecdn.com/e-220805033615-e8521670/75/E-INDEX-2021-pdf-97-2048.jpg)
![78 Global Innovation Index 2021
El Salvador GII 2021 rank
96
Output rank Input rank Income Region Population (mn) GDP, PPP$ (bn) GDP per capita, PPP$ GII 2020 rank
89 100 Lower middle LCN 6.5 54.5 8,401 92
Score/
Value Rank
Business sophistication 22.4 80
5.1 Knowledge workers 29.3 72
5.1.1 Knowledge-intensive employment, % 12.3 103
5.1.2 Firms offering formal training, % 53.8 13 ● ◆
5.1.3 GERD performed by business, % GDP 0.1 71
5.1.4 GERD financed by business, % 35.2 54
5.1.5 Females employed w/advanced degrees, % 4.3 97
5.2 Innovation linkages 11.0 126 ○ ◇
5.2.1 University-industry RD collaboration†
26.2 121 ○ ◇
5.2.2 State of cluster development and depth†
33.9 116 ○ ◇
5.2.3 GERD financed by abroad, % GDP 0.0 80
5.2.4 Joint venture/strategic alliance deals/bn PPP$ GDP 0.0 124 ○
5.2.5 Patent families/bn PPP$ GDP 0.0 88
5.3 Knowledge absorption 26.9 66
5.3.1 Intellectual property payments, % total trade 1.1 35 ● ◆
5.3.2 High-tech imports, % total trade 8.9 47 ●
5.3.3 ICT services imports, % total trade 0.5 102
5.3.4 FDI net inflows, % GDP 2.1 76
5.3.5 Research talent, % in businesses n/a n/a
Knowledge and technology outputs 8.3 124 ○
6.1 Knowledge creation 1.3 131 ○ ◇
6.1.1 Patents by origin/bn PPP$ GDP 0.0 126 ○
6.1.2 PCT patents by origin/bn PPP$ GDP 0.0 91
6.1.3 Utility models by origin/bn PPP$ GDP 0.1 58
6.1.4 Scientific and technical articles/bn PPP$ GDP 1.1 129 ○ ◇
6.1.5 Citable documents H-index 2.6 125 ○
6.2 Knowledge impact 4.6[128]
6.2.1 Labor productivity growth, % n/a n/a
6.2.2 New businesses/th pop. 15–64 0.6 93
6.2.3 Software spending, % GDP 0.0 100
6.2.4 ISO 9001 quality certificates/bn PPP$ GDP 2.7 80
6.2.5 High-tech manufacturing, % n/a n/a
6.3 Knowledge diffusion 18.9 57
6.3.1 Intellectual property receipts, % total trade 0.3 34 ● ◆
6.3.2 Production and export complexity 47.0 53 ◆
6.3.3 High-tech exports, % total trade 2.2 53 ●
6.3.4 ICT services exports, % total trade 2.4 47 ●
Creative outputs 26.0 57 ◆
7.1 Intangible assets 44.6 31 ● ◆
7.1.1 Trademarks by origin/bn PPP$ GDP 82.3 20 ● ◆
7.1.2 Global brand value, top 5,000, % GDP n/a n/a
7.1.3 Industrial designs by origin/bn PPP$ GDP 0.1 107
7.1.4 ICTs and organizational model creation†
42.7 103
7.2 Creative goods and services 4.9 [106]
7.2.1 Cultural and creative services exports, % total trade 0.0 106 ○
7.2.2 National feature films/mn pop. 15–69 n/a n/a
7.2.3 Entertainment and media market/th pop. 15–69 n/a n/a
7.2.4 Printing and other media, % manufacturing n/a n/a
7.2.5 Creative goods exports, % total trade 0.6 58
7.3 Online creativity 9.9 93
7.3.1 Generic top-level domains (TLDs)/th pop. 15–69 2.5 72 ◆
7.3.2 Country-code TLDs/th pop. 15–69 0.6 96
7.3.3 Wikipedia edits/mn pop. 15–69 38.2 87
7.3.4 Mobile app creation/bn PPP$ GDP 0.0 101 ○
Score/
Value Rank
Institutions 54.5 98
1.1 Political environment 48.3 94
1.1.1 Political and operational stability* 64.3 80
1.1.2 Government effectiveness* 40.3 97
1.2 Regulatory environment 53.0 99
1.2.1 Regulatory quality* 44.1 69 ◆
1.2.2 Rule of law* 26.6 111
1.2.3 Cost of redundancy dismissal 22.9 97
1.3 Business environment 62.1 96
1.3.1 Ease of starting a business* 78.6 112
1.3.2 Ease of resolving insolvency* 45.6 83
Human capital and research 18.1 106
2.1 Education 31.2 112
2.1.1 Expenditure on education, % GDP 3.6 80
2.1.2 Government funding/pupil, secondary, % GDP/cap 14.2 79
2.1.3 School life expectancy, years 11.6 94
2.1.4 PISA scales in reading, maths and science n/a n/a
2.1.5 Pupil-teacher ratio, secondary 27.6 113 ◇
2.2 Tertiary education 22.0 92
2.2.1 Tertiary enrolment, % gross 29.4 86
2.2.2 Graduates in science and engineering, % 21.4 64
2.2.3 Tertiary inbound mobility, % 0.5 96
2.3 Research and development (RD) 0.9 105
2.3.1 Researchers, FTE/mn pop. 71.2 92
2.3.2 Gross expenditure on RD, % GDP 0.2 94
2.3.3 Global corporate RD investors, top 3, mn US$ 0.0 41 ○ ◇
2.3.4 QS university ranking, top 3* 0.0 74 ○ ◇
Infrastructure 30.5 99
3.1 Informationandcommunicationtechnologies(ICTs) 52.1 93
3.1.1 ICT access* 49.4 91
3.1.2 ICT use* 33.7 103
3.1.3 Government’s online service* 57.6 93
3.1.4 E-participation* 67.9 75
3.2 General infrastructure 14.0 121 ○
3.2.1 Electricity output, GWh/mn pop. 941.9 98
3.2.2 Logistics performance* 24.6 97
3.2.3 Gross capital formation, % GDP 14.7 115 ◇
3.3 Ecological sustainability 25.3 79
3.3.1 GDP/unit of energy use 11.7 53 ●
3.3.2 Environmental performance* 43.1 82 ◆
3.3.3 ISO 14001 environmental certificates/bn PPP$ GDP 0.3 93
Market sophistication 39.1 105
4.1 Credit 42.0 61
4.1.1 Ease of getting credit* 80.0 23 ●
4.1.2 Domestic credit to private sector, % GDP 54.0 61
4.1.3 Microfinance gross loans, % GDP 0.4 38
4.2 Investment 19.9 [115]
4.2.1 Ease of protecting minority investors* 36.0 116
4.2.2 Market capitalization, % GDP n/a n/a
4.2.3 Venture capital investors, deals/bn PPP$ GDP 0.0 62
4.2.4 Venture capital recipients, deals/bn PPP$ GDP n/a n/a
4.3 Trade, diversification, and market scale 55.6 107
4.3.1 Applied tariff rate, weighted avg., % 2.0 56 ● ◆
4.3.2 Domestic industry diversification n/a n/a
4.3.3 Domestic market scale, bn PPP$ 54.5 101
NOTES: ● indicates a strength; ○ a weakness; ◆ an income group strength; ◇ an income group weakness; * an index; †
a survey question. indicates that
the
economy’s data are older than the base year; see appendices for details, including the year of the data, at http://globalinnovationindex.org. Square
brackets [ ] indicate
that the data minimum coverage (DMC) requirements were not met at the sub-pillar or pillar level.](https://image.slidesharecdn.com/e-220805033615-e8521670/75/E-INDEX-2021-pdf-98-2048.jpg)
![79
GII 2021 Economy profiles
Estonia GII 2021 rank
21
Output rank Input rank Income Region Population (mn) GDP, PPP$ (bn) GDP per capita, PPP$ GII 2020 rank
20 24 High EUR 1.3 49.1 37,033 25
Score/
Value Rank
Business sophistication 39.9 29 ◇
5.1 Knowledge workers 52.0 25 ◇
5.1.1 Knowledge-intensive employment, % 46.6 14
5.1.2 Firms offering formal training, % 40.7 27
5.1.3 GERD performed by business, % GDP 0.9 25
5.1.4 GERD financed by business, % 40.8 43 ◇
5.1.5 Females employed w/advanced degrees, % 27.0 7 ●
5.2 Innovation linkages 32.9 29 ◇
5.2.1 University-industry RD collaboration†
48.8 43 ◇
5.2.2 State of cluster development and depth†
46.4 65 ○ ◇
5.2.3 GERD financed by abroad, % GDP 0.2 20
5.2.4 Joint venture/strategic alliance deals/bn PPP$ GDP 0.1 20
5.2.5 Patent families/bn PPP$ GDP 0.9 28 ◇
5.3 Knowledge absorption 34.8 42 ◇
5.3.1 Intellectual property payments, % total trade 0.3 82 ○ ◇
5.3.2 High-tech imports, % total trade 8.5 53
5.3.3 ICT services imports, % total trade 2.8 11
5.3.4 FDI net inflows, % GDP 6.6 15
5.3.5 Research talent, % in businesses 39.1 33 ◇
Knowledge and technology outputs 38.4 22
6.1 Knowledge creation 30.9 32 ◇
6.1.1 Patents by origin/bn PPP$ GDP 1.6 46 ◇
6.1.2 PCT patents by origin/bn PPP$ GDP 1.1 27 ◇
6.1.3 Utility models by origin/bn PPP$ GDP 1.3 19
6.1.4 Scientific and technical articles/bn PPP$ GDP 43.5 14
6.1.5 Citable documents H-index 17.4 47 ◇
6.2 Knowledge impact 48.1 9
6.2.1 Labor productivity growth, % 2.2 25 ◆
6.2.2 New businesses/th pop. 15–64 23.6 2 ● ◆
6.2.3 Software spending, % GDP 0.1 78 ○ ◇
6.2.4 ISO 9001 quality certificates/bn PPP$ GDP 19.5 13 ◆
6.2.5 High-tech manufacturing, % 32.2 40
6.3 Knowledge diffusion 36.0 25
6.3.1 Intellectual property receipts, % total trade 0.1 61 ○ ◇
6.3.2 Production and export complexity 66.2 28
6.3.3 High-tech exports, % total trade 8.4 21
6.3.4 ICT services exports, % total trade 4.6 19
Creative outputs 45.3 15
7.1 Intangible assets 44.3 33
7.1.1 Trademarks by origin/bn PPP$ GDP 80.7 21
7.1.2 Global brand value, top 5,000, % GDP 0.0 80 ○ ◇
7.1.3 Industrial designs by origin/bn PPP$ GDP 3.5 30
7.1.4 ICTs and organizational model creation†
79.3 5 ●
7.2 Creative goods and services 36.5 17
7.2.1 Cultural and creative services exports, % total trade 2.0 7
7.2.2 National feature films/mn pop. 15–69 19.5 5 ● ◆
7.2.3 Entertainment and media market/th pop. 15–69 n/a n/a
7.2.4 Printing and other media, % manufacturing 1.9 17
7.2.5 Creative goods exports, % total trade 1.0 43
7.3 Online creativity 56.1 14
7.3.1 Generic top-level domains (TLDs)/th pop. 15–69 10.4 39 ◇
7.3.2 Country-code TLDs/th pop. 15–69 44.0 17
7.3.3 Wikipedia edits/mn pop. 15–69 88.7 3 ● ◆
7.3.4 Mobile app creation/bn PPP$ GDP 75.8 8 ◆
Score/
Value Rank
Institutions 81.1 22
1.1 Political environment 79.1 23
1.1.1 Political and operational stability* 83.9 13
1.1.2 Government effectiveness* 76.8 25
1.2 Regulatory environment 86.5 16
1.2.1 Regulatory quality* 85.1 15
1.2.2 Rule of law* 80.5 22
1.2.3 Cost of redundancy dismissal 12.9 39
1.3 Business environment 77.7 41 ◇
1.3.1 Ease of starting a business* 95.4 13
1.3.2 Ease of resolving insolvency* 60.1 49 ◇
Human capital and research 42.9 34 ◇
2.1 Education 58.2 36
2.1.1 Expenditure on education, % GDP 5.0 40
2.1.2 Government funding/pupil, secondary, % GDP/cap 19.1 54 ○
2.1.3 School life expectancy, years 15.9 38
2.1.4 PISA scales in reading, maths and science 525.5 4 ●
2.1.5 Pupil-teacher ratio, secondary 9.7 24
2.2 Tertiary education 45.9 19
2.2.1 Tertiary enrolment, % gross 70.4 32
2.2.2 Graduates in science and engineering, % 27.7 26
2.2.3 Tertiary inbound mobility, % 9.6 24
2.3 Research and development (RD) 24.6 42 ◇
2.3.1 Researchers, FTE/mn pop. 3,765.7 28 ◇
2.3.2 Gross expenditure on RD, % GDP 1.6 22
2.3.3 Global corporate RD investors, top 3, mn US$ 0.0 41 ○ ◇
2.3.4 QS university ranking, top 3* 21.3 48 ◇
Infrastructure 59.8 8
3.1 Informationandcommunicationtechnologies(ICTs) 90.7 5 ●
3.1.1 ICT access* 82.1 26
3.1.2 ICT use* 81.3 21
3.1.3 Government’s online service* 99.4 2 ● ◆
3.1.4 E-participation* 100.0 1 ●
3.2 General infrastructure 39.0 33
3.2.1 Electricity output, GWh/mn pop. 9,370.7 16
3.2.2 Logistics performance* 58.7 35 ◇
3.2.3 Gross capital formation, % GDP 25.2 44
3.3 Ecological sustainability 49.7 16
3.3.1 GDP/unit of energy use 8.8 83 ○
3.3.2 Environmental performance* 65.3 30
3.3.3 ISO 14001 environmental certificates/bn PPP$ GDP 10.1 4 ● ◆
Market sophistication 66.4 10
4.1 Credit 46.6 44
4.1.1 Ease of getting credit* 70.0 44
4.1.2 Domestic credit to private sector, % GDP 59.0 56 ◇
4.1.3 Microfinance gross loans, % GDP n/a n/a
4.2 Investment 80.6 4 ● ◆
4.2.1 Ease of protecting minority investors* 58.0 77 ○ ◇
4.2.2 Market capitalization, % GDP n/a n/a
4.2.3 Venture capital investors, deals/bn PPP$ GDP 0.4 8 ◆
4.2.4 Venture capital recipients, deals/bn PPP$ GDP 0.2 5 ● ◆
4.3 Trade, diversification, and market scale 71.9 56
4.3.1 Applied tariff rate, weighted avg., % 1.8 25
4.3.2 Domestic industry diversification 96.9 18
4.3.3 Domestic market scale, bn PPP$ 49.1 102 ○ ◇
NOTES: ● indicates a strength; ○ a weakness; ◆ an income group strength; ◇ an income group weakness; * an index; †
a survey question. indicates that
the
economy’s data are older than the base year; see appendices for details, including the year of the data, at http://globalinnovationindex.org. Square
brackets [ ] indicate
that the data minimum coverage (DMC) requirements were not met at the sub-pillar or pillar level.](https://image.slidesharecdn.com/e-220805033615-e8521670/75/E-INDEX-2021-pdf-99-2048.jpg)
![80 Global Innovation Index 2021
Ethiopia GII 2021 rank
126
Output rank Input rank Income Region Population (mn) GDP, PPP$ (bn) GDP per capita, PPP$ GII 2020 rank
107 129 Low SSF 115.0 272.0 2,772 127
Score/
Value Rank
Business sophistication 14.5 126
5.1 Knowledge workers 5.4 130 ◇
5.1.1 Knowledge-intensive employment, % 4.5 119
5.1.2 Firms offering formal training, % 20.8 74
5.1.3 GERD performed by business, % GDP 0.0 88
5.1.4 GERD financed by business, % 1.5 92
5.1.5 Females employed w/advanced degrees, % 0.3 123
5.2 Innovation linkages 15.0 108
5.2.1 University-industry RD collaboration†
39.6 78
5.2.2 State of cluster development and depth†
37.7 110
5.2.3 GERD financed by abroad, % GDP 0.1 51 ●
5.2.4 Joint venture/strategic alliance deals/bn PPP$ GDP 0.0 105
5.2.5 Patent families/bn PPP$ GDP 0.0 100 ○ ◇
5.3 Knowledge absorption 23.1 75
5.3.1 Intellectual property payments, % total trade 0.1 103
5.3.2 High-tech imports, % total trade 15.2 12 ● ◆
5.3.3 ICT services imports, % total trade 0.9 83
5.3.4 FDI net inflows, % GDP 3.8 30 ●
5.3.5 Research talent, % in businesses 2.2 76
Knowledge and technology outputs 16.2 81 ◆
6.1 Knowledge creation 18.0 57 ● ◆
6.1.1 Patents by origin/bn PPP$ GDP 0.1 119
6.1.2 PCT patents by origin/bn PPP$ GDP n/a n/a
6.1.3 Utility models by origin/bn PPP$ GDP 1.7 13 ●
6.1.4 Scientific and technical articles/bn PPP$ GDP 13.0 68
6.1.5 Citable documents H-index 8.6 84 ◆
6.2 Knowledge impact 23.5 87
6.2.1 Labor productivity growth, % 5.3 5 ● ◆
6.2.2 New businesses/th pop. 15–64 0.5 97
6.2.3 Software spending, % GDP 0.0 125 ○ ◇
6.2.4 ISO 9001 quality certificates/bn PPP$ GDP 0.2 130
6.2.5 High-tech manufacturing, % 13.6 79
6.3 Knowledge diffusion 7.1 109
6.3.1 Intellectual property receipts, % total trade 0.0 78
6.3.2 Production and export complexity 28.7 96
6.3.3 High-tech exports, % total trade 0.3 97
6.3.4 ICT services exports, % total trade 0.6 97
Creative outputs 8.7 127
7.1 Intangible assets 13.0 124
7.1.1 Trademarks by origin/bn PPP$ GDP 2.3 127 ○ ◇
7.1.2 Global brand value, top 5,000, % GDP 2.9 76
7.1.3 Industrial designs by origin/bn PPP$ GDP n/a n/a
7.1.4 ICTs and organizational model creation†
38.2 117
7.2 Creative goods and services 8.7 [85]
7.2.1 Cultural and creative services exports, % total trade 0.0 105
7.2.2 National feature films/mn pop. 15–69 n/a n/a
7.2.3 Entertainment and media market/th pop. 15–69 n/a n/a
7.2.4 Printing and other media, % manufacturing 1.8 21 ●
7.2.5 Creative goods exports, % total trade 0.0 116
7.3 Online creativity 0.0 132 ○ ◇
7.3.1 Generic top-level domains (TLDs)/th pop. 15–69 0.0 130
7.3.2 Country-code TLDs/th pop. 15–69 0.0 131
7.3.3 Wikipedia edits/mn pop. 15–69 6.1 131 ○ ◇
7.3.4 Mobile app creation/bn PPP$ GDP 0.0 104 ○ ◇
Score/
Value Rank
Institutions 48.4 116
1.1 Political environment 41.6 113
1.1.1 Political and operational stability* 51.8 119
1.1.2 Government effectiveness* 36.5 107
1.2 Regulatory environment 52.6 100
1.2.1 Regulatory quality* 20.3 123
1.2.2 Rule of law* 34.2 93
1.2.3 Cost of redundancy dismissal 19.1 81
1.3 Business environment 51.0 126 ◇
1.3.1 Ease of starting a business* 71.7 122 ◇
1.3.2 Ease of resolving insolvency* 30.3 119 ◇
Human capital and research 10.5 126
2.1 Education 24.8 124
2.1.1 Expenditure on education, % GDP 4.7 49 ●
2.1.2 Government funding/pupil, secondary, % GDP/cap 16.8 67
2.1.3 School life expectancy, years 8.4 116
2.1.4 PISA scales in reading, maths and science n/a n/a
2.1.5 Pupil-teacher ratio, secondary 43.7 123 ○ ◇
2.2 Tertiary education 5.1 [125]
2.2.1 Tertiary enrolment, % gross 8.1 118
2.2.2 Graduates in science and engineering, % n/a n/a
2.2.3 Tertiary inbound mobility, % n/a n/a
2.3 Research and development (RD) 1.6 100
2.3.1 Researchers, FTE/mn pop. 90.5 89 ◆
2.3.2 Gross expenditure on RD, % GDP 0.3 85
2.3.3 Global corporate RD investors, top 3, mn US$ 0.0 41 ○ ◇
2.3.4 QS university ranking, top 3* 0.0 74 ○ ◇
Infrastructure 24.6 121
3.1 Informationandcommunicationtechnologies(ICTs) 25.6 127
3.1.1 ICT access* 21.7 132 ○ ◇
3.1.2 ICT use* 10.9 129
3.1.3 Government’s online service* 36.5 119
3.1.4 E-participation* 33.3 120
3.2 General infrastructure 34.0 43 ●
3.2.1 Electricity output, GWh/mn pop. 124.3 121
3.2.2 Logistics performance* n/a n/a
3.2.3 Gross capital formation, % GDP 36.7 11 ●
3.3 Ecological sustainability 14.1 127
3.3.1 GDP/unit of energy use 4.8 118
3.3.2 Environmental performance* 34.4 105
3.3.3 ISO 14001 environmental certificates/bn PPP$ GDP 0.0 132 ○ ◇
Market sophistication 26.1 130 ◇
4.1 Credit 10.1 128
4.1.1 Ease of getting credit* 15.0 127 ◇
4.1.2 Domestic credit to private sector, % GDP n/a n/a
4.1.3 Microfinance gross loans, % GDP 0.0 66
4.2 Investment 4.0 132 ○ ◇
4.2.1 Ease of protecting minority investors* 10.0 132 ○ ◇
4.2.2 Market capitalization, % GDP n/a n/a
4.2.3 Venture capital investors, deals/bn PPP$ GDP 0.0 87
4.2.4 Venture capital recipients, deals/bn PPP$ GDP 0.0 87 ◇
4.3 Trade, diversification, and market scale 64.3 76 ◆
4.3.1 Applied tariff rate, weighted avg., % 12.1 126 ◇
4.3.2 Domestic industry diversification 89.1 54 ●
4.3.3 Domestic market scale, bn PPP$ 272.0 58 ● ◆
NOTES: ● indicates a strength; ○ a weakness; ◆ an income group strength; ◇ an income group weakness; * an index; †
a survey question. indicates that
the
economy’s data are older than the base year; see appendices for details, including the year of the data, at http://globalinnovationindex.org. Square
brackets [ ] indicate
that the data minimum coverage (DMC) requirements were not met at the sub-pillar or pillar level.](https://image.slidesharecdn.com/e-220805033615-e8521670/75/E-INDEX-2021-pdf-100-2048.jpg)
![81
GII 2021 Economy profiles
Finland GII 2021 rank
7
Output rank Input rank Income Region Population (mn) GDP, PPP$ (bn) GDP per capita, PPP$ GII 2020 rank
9 6 High EUR 5.5 272.7 49,334 7
Score/
Value Rank
Business sophistication 61.0 6
5.1 Knowledge workers 66.0 7
5.1.1 Knowledge-intensive employment, % 48.8 10
5.1.2 Firms offering formal training, % n/a n/a
5.1.3 GERD performed by business, % GDP 1.8 10
5.1.4 GERD financed by business, % 54.3 21
5.1.5 Females employed w/advanced degrees, % 28.0 4 ● ◆
5.2 Innovation linkages 70.1 3 ● ◆
5.2.1 University-industry RD collaboration†
72.5 4 ●
5.2.2 State of cluster development and depth†
63.1 19
5.2.3 GERD financed by abroad, % GDP 0.4 5
5.2.4 Joint venture/strategic alliance deals/bn PPP$ GDP 0.2 11
5.2.5 Patent families/bn PPP$ GDP 5.7 1 ● ◆
5.3 Knowledge absorption 46.7 17
5.3.1 Intellectual property payments, % total trade 1.0 39
5.3.2 High-tech imports, % total trade 7.2 74 ○
5.3.3 ICT services imports, % total trade 4.4 3 ● ◆
5.3.4 FDI net inflows, % GDP 2.9 54
5.3.5 Research talent, % in businesses 57.2 16
Knowledge and technology outputs 56.5 5 ●
6.1 Knowledge creation 62.5 9
6.1.1 Patents by origin/bn PPP$ GDP 10.8 10
6.1.2 PCT patents by origin/bn PPP$ GDP 6.1 1 ● ◆
6.1.3 Utility models by origin/bn PPP$ GDP 1.0 23
6.1.4 Scientific and technical articles/bn PPP$ GDP 52.1 7
6.1.5 Citable documents H-index 43.2 19
6.2 Knowledge impact 39.2 26
6.2.1 Labor productivity growth, % −1.0 82 ○
6.2.2 New businesses/th pop. 15–64 4.3 35
6.2.3 Software spending, % GDP 0.4 21
6.2.4 ISO 9001 quality certificates/bn PPP$ GDP 9.4 29
6.2.5 High-tech manufacturing, % 40.4 25
6.3 Knowledge diffusion 67.9 3 ● ◆
6.3.1 Intellectual property receipts, % total trade 3.3 1 ● ◆
6.3.2 Production and export complexity 79.6 12
6.3.3 High-tech exports, % total trade 4.3 38
6.3.4 ICT services exports, % total trade 11.3 5 ● ◆
Creative outputs 42.9 16
7.1 Intangible assets 44.4 32
7.1.1 Trademarks by origin/bn PPP$ GDP 38.2 62 ○
7.1.2 Global brand value, top 5,000, % GDP 111.4 18
7.1.3 Industrial designs by origin/bn PPP$ GDP 3.4 32
7.1.4 ICTs and organizational model creation†
80.4 3 ● ◆
7.2 Creative goods and services 24.1 41 ◇
7.2.1 Cultural and creative services exports, % total trade 0.9 33
7.2.2 National feature films/mn pop. 15–69 10.7 17
7.2.3 Entertainment and media market/th pop. 15–69 54.8 11
7.2.4 Printing and other media, % manufacturing 0.9 56 ○
7.2.5 Creative goods exports, % total trade 0.5 61 ○
7.3 Online creativity 58.8 11
7.3.1 Generic top-level domains (TLDs)/th pop. 15–69 29.2 21
7.3.2 Country-code TLDs/th pop. 15–69 40.0 18
7.3.3 Wikipedia edits/mn pop. 15–69 83.8 7
7.3.4 Mobile app creation/bn PPP$ GDP 77.7 7 ◆
Score/
Value Rank
Institutions 93.3 2 ● ◆
1.1 Political environment 90.9 5 ●
1.1.1 Political and operational stability* 85.7 11
1.1.2 Government effectiveness* 93.5 4 ● ◆
1.2 Regulatory environment 95.9 5 ●
1.2.1 Regulatory quality* 91.9 6
1.2.2 Rule of law* 100.0 1 ● ◆
1.2.3 Cost of redundancy dismissal 10.1 31
1.3 Business environment 93.1 1 ● ◆
1.3.1 Ease of starting a business* 93.5 29
1.3.2 Ease of resolving insolvency* 92.7 1 ● ◆
Human capital and research 62.4 4 ● ◆
2.1 Education 69.6 9
2.1.1 Expenditure on education, % GDP 6.4 10
2.1.2 Government funding/pupil, secondary, % GDP/cap 22.7 32
2.1.3 School life expectancy, years 19.5 6 ◆
2.1.4 PISA scales in reading, maths and science 516.4 8
2.1.5 Pupil-teacher ratio, secondary 13.8 65 ○
2.2 Tertiary education 51.1 12
2.2.1 Tertiary enrolment, % gross 90.3 9
2.2.2 Graduates in science and engineering, % 28.1 22
2.2.3 Tertiary inbound mobility, % 8.1 30
2.3 Research and development (RD) 66.6 10
2.3.1 Researchers, FTE/mn pop. 7,227.6 4 ● ◆
2.3.2 Gross expenditure on RD, % GDP 2.8 11
2.3.3 Global corporate RD investors, top 3, mn US$ 75.5 11
2.3.4 QS university ranking, top 3* 48.7 20
Infrastructure 59.5 11
3.1 Informationandcommunicationtechnologies(ICTs) 86.8 17
3.1.1 ICT access* 73.6 50 ◇
3.1.2 ICT use* 81.2 22
3.1.3 Government’s online service* 97.1 3 ● ◆
3.1.4 E-participation* 95.2 14
3.2 General infrastructure 48.8 12
3.2.1 Electricity output, GWh/mn pop. 12,435.1 10
3.2.2 Logistics performance* 89.2 10
3.2.3 Gross capital formation, % GDP 24.6 51
3.3 Ecological sustainability 42.9 30
3.3.1 GDP/unit of energy use 7.5 99 ○
3.3.2 Environmental performance* 78.9 7
3.3.3 ISO 14001 environmental certificates/bn PPP$ GDP 5.4 20
Market sophistication 58.7 19
4.1 Credit 49.4 34
4.1.1 Ease of getting credit* 60.0 74 ○
4.1.2 Domestic credit to private sector, % GDP 95.1 26
4.1.3 Microfinance gross loans, % GDP n/a n/a
4.2 Investment 48.2 22
4.2.1 Ease of protecting minority investors* 62.0 60 ○
4.2.2 Market capitalization, % GDP n/a n/a
4.2.3 Venture capital investors, deals/bn PPP$ GDP 0.2 18
4.2.4 Venture capital recipients, deals/bn PPP$ GDP 0.1 10
4.3 Trade, diversification, and market scale 78.5 32
4.3.1 Applied tariff rate, weighted avg., % 1.8 25
4.3.2 Domestic industry diversification 96.0 21
4.3.3 Domestic market scale, bn PPP$ 272.7 57 ○
NOTES: ● indicates a strength; ○ a weakness; ◆ an income group strength; ◇ an income group weakness; * an index; †
a survey question. indicates that
the
economy’s data are older than the base year; see appendices for details, including the year of the data, at http://globalinnovationindex.org. Square
brackets [ ] indicate
that the data minimum coverage (DMC) requirements were not met at the sub-pillar or pillar level.](https://image.slidesharecdn.com/e-220805033615-e8521670/75/E-INDEX-2021-pdf-101-2048.jpg)
![82 Global Innovation Index 2021
France GII 2021 rank
11
Output rank Input rank Income Region Population (mn) GDP, PPP$ (bn) GDP per capita, PPP$ GII 2020 rank
10 17 High EUR 65.3 2,954.2 45,454 12
Score/
Value Rank
Business sophistication 50.4 19
5.1 Knowledge workers 61.0 16
5.1.1 Knowledge-intensive employment, % 46.4 15
5.1.2 Firms offering formal training, % n/a n/a
5.1.3 GERD performed by business, % GDP 1.4 16
5.1.4 GERD financed by business, % 56.7 16
5.1.5 Females employed w/advanced degrees, % 23.4 19
5.2 Innovation linkages 40.9 23
5.2.1 University-industry RD collaboration†
54.1 31 ◇
5.2.2 State of cluster development and depth†
58.2 28
5.2.3 GERD financed by abroad, % GDP 0.2 25
5.2.4 Joint venture/strategic alliance deals/bn PPP$ GDP 0.1 29
5.2.5 Patent families/bn PPP$ GDP 3.2 13
5.3 Knowledge absorption 49.3 13
5.3.1 Intellectual property payments, % total trade 1.7 17
5.3.2 High-tech imports, % total trade 9.9 35
5.3.3 ICT services imports, % total trade 2.5 18
5.3.4 FDI net inflows, % GDP 1.9 80 ○
5.3.5 Research talent, % in businesses 62.8 8
Knowledge and technology outputs 44.3 16
6.1 Knowledge creation 44.8 19
6.1.1 Patents by origin/bn PPP$ GDP 7.5 13
6.1.2 PCT patents by origin/bn PPP$ GDP 2.7 14
6.1.3 Utility models by origin/bn PPP$ GDP 0.1 57 ○ ◇
6.1.4 Scientific and technical articles/bn PPP$ GDP 25.9 36
6.1.5 Citable documents H-index 78.9 5 ● ◆
6.2 Knowledge impact 41.5 22
6.2.1 Labor productivity growth, % −2.0 103 ○ ◇
6.2.2 New businesses/th pop. 15–64 4.8 31
6.2.3 Software spending, % GDP 0.5 9 ●
6.2.4 ISO 9001 quality certificates/bn PPP$ GDP 6.7 41
6.2.5 High-tech manufacturing, % 51.4 10
6.3 Knowledge diffusion 46.7 18
6.3.1 Intellectual property receipts, % total trade 1.8 14
6.3.2 Production and export complexity 75.6 16
6.3.3 High-tech exports, % total trade 13.4 10 ●
6.3.4 ICT services exports, % total trade 2.1 50 ○
Creative outputs 52.6 6 ●
7.1 Intangible assets 68.9 3 ● ◆
7.1.1 Trademarks by origin/bn PPP$ GDP 99.4 7 ● ◆
7.1.2 Global brand value, top 5,000, % GDP 171.1 6 ●
7.1.3 Industrial designs by origin/bn PPP$ GDP 13.0 8 ● ◆
7.1.4 ICTs and organizational model creation†
70.9 19
7.2 Creative goods and services 27.5 30
7.2.1 Cultural and creative services exports, % total trade 1.1 26
7.2.2 National feature films/mn pop. 15–69 6.8 33
7.2.3 Entertainment and media market/th pop. 15–69 49.5 17
7.2.4 Printing and other media, % manufacturing 1.0 53 ○
7.2.5 Creative goods exports, % total trade 1.8 31
7.3 Online creativity 45.3 25
7.3.1 Generic top-level domains (TLDs)/th pop. 15–69 41.2 18
7.3.2 Country-code TLDs/th pop. 15–69 24.9 27
7.3.3 Wikipedia edits/mn pop. 15–69 78.8 12
7.3.4 Mobile app creation/bn PPP$ GDP 32.2 15
Score/
Value Rank
Institutions 83.4 19
1.1 Political environment 79.9 22
1.1.1 Political and operational stability* 76.8 37 ◇
1.1.2 Government effectiveness* 81.4 19
1.2 Regulatory environment 86.3 17
1.2.1 Regulatory quality* 81.1 18
1.2.2 Rule of law* 83.9 19
1.2.3 Cost of redundancy dismissal 13.0 40
1.3 Business environment 83.9 22
1.3.1 Ease of starting a business* 93.1 35
1.3.2 Ease of resolving insolvency* 74.6 24
Human capital and research 55.4 15
2.1 Education 60.5 26
2.1.1 Expenditure on education, % GDP 5.5 20
2.1.2 Government funding/pupil, secondary, % GDP/cap 25.9 15 ◆
2.1.3 School life expectancy, years 15.8 39
2.1.4 PISA scales in reading, maths and science 493.7 25
2.1.5 Pupil-teacher ratio, secondary 13.3 59 ○
2.2 Tertiary education 42.0 38
2.2.1 Tertiary enrolment, % gross 67.6 38
2.2.2 Graduates in science and engineering, % 25.4 36
2.2.3 Tertiary inbound mobility, % 8.8 28
2.3 Research and development (RD) 63.7 12
2.3.1 Researchers, FTE/mn pop. 4,687.2 20
2.3.2 Gross expenditure on RD, % GDP 2.2 14
2.3.3 Global corporate RD investors, top 3, mn US$ 86.1 7 ●
2.3.4 QS university ranking, top 3* 68.8 11
Infrastructure 57.1 17
3.1 Informationandcommunicationtechnologies(ICTs) 87.7 16
3.1.1 ICT access* 86.5 17
3.1.2 ICT use* 85.5 10 ●
3.1.3 Government’s online service* 88.2 18
3.1.4 E-participation* 90.5 18
3.2 General infrastructure 42.2 23
3.2.1 Electricity output, GWh/mn pop. 8,392.9 18
3.2.2 Logistics performance* 83.4 16
3.2.3 Gross capital formation, % GDP 22.7 60 ○
3.3 Ecological sustainability 41.4 33
3.3.1 GDP/unit of energy use 12.0 49 ○
3.3.2 Environmental performance* 80.0 5 ●
3.3.3 ISO 14001 environmental certificates/bn PPP$ GDP 2.0 42
Market sophistication 61.0 17
4.1 Credit 47.2 43
4.1.1 Ease of getting credit* 50.0 94 ○
4.1.2 Domestic credit to private sector, % GDP 107.6 21
4.1.3 Microfinance gross loans, % GDP n/a n/a
4.2 Investment 48.2 21
4.2.1 Ease of protecting minority investors* 68.0 44
4.2.2 Market capitalization, % GDP 92.7 14
4.2.3 Venture capital investors, deals/bn PPP$ GDP 0.2 17
4.2.4 Venture capital recipients, deals/bn PPP$ GDP 0.1 9
4.3 Trade, diversification, and market scale 87.6 8 ●
4.3.1 Applied tariff rate, weighted avg., % 1.8 25 ○
4.3.2 Domestic industry diversification 95.0 25
4.3.3 Domestic market scale, bn PPP$ 2,954.2 10 ●
NOTES: ● indicates a strength; ○ a weakness; ◆ an income group strength; ◇ an income group weakness; * an index; †
a survey question. indicates that
the
economy’s data are older than the base year; see appendices for details, including the year of the data, at http://globalinnovationindex.org. Square
brackets [ ] indicate
that the data minimum coverage (DMC) requirements were not met at the sub-pillar or pillar level.](https://image.slidesharecdn.com/e-220805033615-e8521670/75/E-INDEX-2021-pdf-102-2048.jpg)
![83
GII 2021 Economy profiles
Georgia GII 2021 rank
63
Output rank Input rank Income Region Population (mn) GDP, PPP$ (bn) GDP per capita, PPP$ GII 2020 rank
74 49 Upper middle NAWA 4.0 56.1 15,142 63
Score/
Value Rank
Business sophistication 25.6 61
5.1 Knowledge workers 35.7 56
5.1.1 Knowledge-intensive employment, % 33.6 43 ◆
5.1.2 Firms offering formal training, % 32.0 46
5.1.3 GERD performed by business, % GDP n/a n/a
5.1.4 GERD financed by business, % 1.7 89 ○ ◇
5.1.5 Females employed w/advanced degrees, % 22.5 23 ● ◆
5.2 Innovation linkages 20.2 68
5.2.1 University-industry RD collaboration†
40.4 73
5.2.2 State of cluster development and depth†
49.3 50
5.2.3 GERD financed by abroad, % GDP 0.0 61
5.2.4 Joint venture/strategic alliance deals/bn PPP$ GDP 0.1 32 ◆
5.2.5 Patent families/bn PPP$ GDP 0.0 67
5.3 Knowledge absorption 20.9 88
5.3.1 Intellectual property payments, % total trade 0.3 77
5.3.2 High-tech imports, % total trade 6.2 94
5.3.3 ICT services imports, % total trade 0.8 86
5.3.4 FDI net inflows, % GDP 8.9 9 ● ◆
5.3.5 Research talent, % in businesses n/a n/a
Knowledge and technology outputs 18.1 75
6.1 Knowledge creation 17.4 59
6.1.1 Patents by origin/bn PPP$ GDP 1.5 51
6.1.2 PCT patents by origin/bn PPP$ GDP 0.1 62
6.1.3 Utility models by origin/bn PPP$ GDP 1.3 18
6.1.4 Scientific and technical articles/bn PPP$ GDP 15.1 58
6.1.5 Citable documents H-index 10.6 72
6.2 Knowledge impact 25.5 83
6.2.1 Labor productivity growth, % 2.2 24 ●
6.2.2 New businesses/th pop. 15–64 10.4 11 ● ◆
6.2.3 Software spending, % GDP 0.1 90
6.2.4 ISO 9001 quality certificates/bn PPP$ GDP 3.1 74
6.2.5 High-tech manufacturing, % 9.8 90 ○ ◇
6.3 Knowledge diffusion 11.4 88
6.3.1 Intellectual property receipts, % total trade 0.0 97 ○ ◇
6.3.2 Production and export complexity 43.0 65
6.3.3 High-tech exports, % total trade 0.8 79
6.3.4 ICT services exports, % total trade 1.1 80
Creative outputs 21.8 74
7.1 Intangible assets 27.3 77
7.1.1 Trademarks by origin/bn PPP$ GDP 51.0 45
7.1.2 Global brand value, top 5,000, % GDP 8.3 63
7.1.3 Industrial designs by origin/bn PPP$ GDP 3.2 34
7.1.4 ICTs and organizational model creation†
43.6 101 ○ ◇
7.2 Creative goods and services 11.3 76
7.2.1 Cultural and creative services exports, % total trade 0.1 80
7.2.2 National feature films/mn pop. 15–69 6.7 34
7.2.3 Entertainment and media market/th pop. 15–69 n/a n/a
7.2.4 Printing and other media, % manufacturing 1.5 26
7.2.5 Creative goods exports, % total trade 0.1 104 ○
7.3 Online creativity 21.1 55
7.3.1 Generic top-level domains (TLDs)/th pop. 15–69 1.7 84
7.3.2 Country-code TLDs/th pop. 15–69 4.5 56
7.3.3 Wikipedia edits/mn pop. 15–69 73.1 30 ◆
7.3.4 Mobile app creation/bn PPP$ GDP 2.1 69
Score/
Value Rank
Institutions 76.2 35 ◆
1.1 Political environment 69.3 40 ◆
1.1.1 Political and operational stability* 69.6 60
1.1.2 Government effectiveness* 69.1 38 ◆
1.2 Regulatory environment 81.3 28 ◆
1.2.1 Regulatory quality* 72.8 28 ◆
1.2.2 Rule of law* 54.9 51 ◆
1.2.3 Cost of redundancy dismissal 8.6 16 ●
1.3 Business environment 77.9 40
1.3.1 Ease of starting a business* 99.6 2 ● ◆
1.3.2 Ease of resolving insolvency* 56.2 59
Human capital and research 32.5 60
2.1 Education 52.0 60
2.1.1 Expenditure on education, % GDP 3.5 85
2.1.2 Government funding/pupil, secondary, % GDP/cap n/a n/a
2.1.3 School life expectancy, years 15.6 44
2.1.4 PISA scales in reading, maths and science 386.7 70 ○
2.1.5 Pupil-teacher ratio, secondary 7.2 3 ● ◆
2.2 Tertiary education 39.6 43
2.2.1 Tertiary enrolment, % gross 63.9 43
2.2.2 Graduates in science and engineering, % 24.6 42
2.2.3 Tertiary inbound mobility, % 8.1 29 ◆
2.3 Research and development (RD) 5.7 75
2.3.1 Researchers, FTE/mn pop. 1,463.8 46
2.3.2 Gross expenditure on RD, % GDP 0.3 83
2.3.3 Global corporate RD investors, top 3, mn US$ 0.0 41 ○ ◇
2.3.4 QS university ranking, top 3* 0.0 74 ○ ◇
Infrastructure 36.3 85
3.1 Informationandcommunicationtechnologies(ICTs) 64.0 72
3.1.1 ICT access* 70.4 59
3.1.2 ICT use* 62.7 58
3.1.3 Government’s online service* 58.8 88
3.1.4 E-participation* 64.3 80
3.2 General infrastructure 23.5 90
3.2.1 Electricity output, GWh/mn pop. 3,256.2 62
3.2.2 Logistics performance* 18.4 111 ○ ◇
3.2.3 Gross capital formation, % GDP 25.4 42
3.3 Ecological sustainability 21.3 92 ◇
3.3.1 GDP/unit of energy use 8.7 84
3.3.2 Environmental performance* 41.3 86 ◇
3.3.3 ISO 14001 environmental certificates/bn PPP$ GDP 0.3 102 ○
Market sophistication 53.9 34
4.1 Credit 50.6 29 ◆
4.1.1 Ease of getting credit* 85.0 14 ●
4.1.2 Domestic credit to private sector, % GDP 67.7 48
4.1.3 Microfinance gross loans, % GDP 1.6 17
4.2 Investment 44.8 [24]
4.2.1 Ease of protecting minority investors* 84.0 7 ● ◆
4.2.2 Market capitalization, % GDP n/a n/a
4.2.3 Venture capital investors, deals/bn PPP$ GDP 0.0 50
4.2.4 Venture capital recipients, deals/bn PPP$ GDP n/a n/a
4.3 Trade, diversification, and market scale 66.4 73
4.3.1 Applied tariff rate, weighted avg., % 0.7 5 ●
4.3.2 Domestic industry diversification 78.4 82
4.3.3 Domestic market scale, bn PPP$ 56.1 99
NOTES: ● indicates a strength; ○ a weakness; ◆ an income group strength; ◇ an income group weakness; * an index; †
a survey question. indicates that
the
economy’s data are older than the base year; see appendices for details, including the year of the data, at http://globalinnovationindex.org. Square
brackets [ ] indicate
that the data minimum coverage (DMC) requirements were not met at the sub-pillar or pillar level.](https://image.slidesharecdn.com/e-220805033615-e8521670/75/E-INDEX-2021-pdf-103-2048.jpg)
![84 Global Innovation Index 2021
Germany GII 2021 rank
10
Output rank Input rank Income Region Population (mn) GDP, PPP$ (bn) GDP per capita, PPP$ GII 2020 rank
8 14 High EUR 83.8 4,454.5 53,571 9
Score/
Value Rank
Business sophistication 54.5 12
5.1 Knowledge workers 65.0 12
5.1.1 Knowledge-intensive employment, % 46.1 16
5.1.2 Firms offering formal training, % n/a n/a
5.1.3 GERD performed by business, % GDP 2.2 8
5.1.4 GERD financed by business, % 66.0 7
5.1.5 Females employed w/advanced degrees, % 14.0 53 ◇
5.2 Innovation linkages 54.2 12
5.2.1 University-industry RD collaboration†
68.5 9
5.2.2 State of cluster development and depth†
69.9 5 ● ◆
5.2.3 GERD financed by abroad, % GDP 0.2 23
5.2.4 Joint venture/strategic alliance deals/bn PPP$ GDP 0.1 31
5.2.5 Patent families/bn PPP$ GDP 5.5 6 ◆
5.3 Knowledge absorption 44.3 21
5.3.1 Intellectual property payments, % total trade 0.9 41
5.3.2 High-tech imports, % total trade 10.0 33
5.3.3 ICT services imports, % total trade 2.5 19
5.3.4 FDI net inflows, % GDP 3.1 45
5.3.5 Research talent, % in businesses 60.7 12
Knowledge and technology outputs 53.3 9
6.1 Knowledge creation 69.5 5 ●
6.1.1 Patents by origin/bn PPP$ GDP 15.7 1 ● ◆
6.1.2 PCT patents by origin/bn PPP$ GDP 4.2 9
6.1.3 Utility models by origin/bn PPP$ GDP 1.8 12
6.1.4 Scientific and technical articles/bn PPP$ GDP 25.9 35
6.1.5 Citable documents H-index 87.0 3 ● ◆
6.2 Knowledge impact 43.8 15
6.2.1 Labor productivity growth, % −1.4 94 ○
6.2.2 New businesses/th pop. 15–64 1.4 73 ○
6.2.3 Software spending, % GDP 0.5 19
6.2.4 ISO 9001 quality certificates/bn PPP$ GDP 11.0 26
6.2.5 High-tech manufacturing, % 57.1 7
6.3 Knowledge diffusion 46.5 19
6.3.1 Intellectual property receipts, % total trade 1.4 16
6.3.2 Production and export complexity 92.1 4 ● ◆
6.3.3 High-tech exports, % total trade 12.3 12
6.3.4 ICT services exports, % total trade 2.5 45
Creative outputs 50.0 11
7.1 Intangible assets 58.4 6 ●
7.1.1 Trademarks by origin/bn PPP$ GDP 60.5 34
7.1.2 Global brand value, top 5,000, % GDP 145.9 12
7.1.3 Industrial designs by origin/bn PPP$ GDP 12.0 11 ◆
7.1.4 ICTs and organizational model creation†
78.0 8
7.2 Creative goods and services 25.6 36
7.2.1 Cultural and creative services exports, % total trade 0.9 31
7.2.2 National feature films/mn pop. 15–69 4.0 49 ○
7.2.3 Entertainment and media market/th pop. 15–69 52.8 12
7.2.4 Printing and other media, % manufacturing 0.9 66 ○
7.2.5 Creative goods exports, % total trade 2.1 29
7.3 Online creativity 57.9 13
7.3.1 Generic top-level domains (TLDs)/th pop. 15–69 52.1 14
7.3.2 Country-code TLDs/th pop. 15–69 84.8 6 ● ◆
7.3.3 Wikipedia edits/mn pop. 15–69 77.5 15
7.3.4 Mobile app creation/bn PPP$ GDP 13.3 41
Score/
Value Rank
Institutions 84.3 17
1.1 Political environment 85.2 14
1.1.1 Political and operational stability* 83.9 13
1.1.2 Government effectiveness* 85.9 13
1.2 Regulatory environment 81.1 29
1.2.1 Regulatory quality* 88.5 9
1.2.2 Rule of law* 89.4 14
1.2.3 Cost of redundancy dismissal 21.6 91 ○ ◇
1.3 Business environment 86.7 14
1.3.1 Ease of starting a business* 83.7 96 ○ ◇
1.3.2 Ease of resolving insolvency* 89.8 4 ● ◆
Human capital and research 62.7 3 ● ◆
2.1 Education 60.1 27
2.1.1 Expenditure on education, % GDP 4.9 44
2.1.2 Government funding/pupil, secondary, % GDP/cap 23.4 25
2.1.3 School life expectancy, years 16.9 18
2.1.4 PISA scales in reading, maths and science 500.4 18
2.1.5 Pupil-teacher ratio, secondary 11.8 49
2.2 Tertiary education 54.7 5 ● ◆
2.2.1 Tertiary enrolment, % gross 70.3 33
2.2.2 Graduates in science and engineering, % 35.3 6 ◆
2.2.3 Tertiary inbound mobility, % 10.0 21
2.3 Research and development (RD) 73.2 6 ●
2.3.1 Researchers, FTE/mn pop. 5,381.7 13
2.3.2 Gross expenditure on RD, % GDP 3.2 6
2.3.3 Global corporate RD investors, top 3, mn US$ 94.1 2 ● ◆
2.3.4 QS university ranking, top 3* 70.4 10
Infrastructure 55.6 21
3.1 Informationandcommunicationtechnologies(ICTs) 80.2 32
3.1.1 ICT access* 90.8 6 ●
3.1.2 ICT use* 81.5 19
3.1.3 Government’s online service* 73.5 59 ◇
3.1.4 E-participation* 75.0 57 ○ ◇
3.2 General infrastructure 44.2 20
3.2.1 Electricity output, GWh/mn pop. 7,259.6 28
3.2.2 Logistics performance* 100.0 1 ● ◆
3.2.3 Gross capital formation, % GDP 21.4 76 ○
3.3 Ecological sustainability 42.3 32
3.3.1 GDP/unit of energy use 13.8 34
3.3.2 Environmental performance* 77.2 10
3.3.3 ISO 14001 environmental certificates/bn PPP$ GDP 1.9 44
Market sophistication 57.8 20
4.1 Credit 51.2 27
4.1.1 Ease of getting credit* 70.0 44 ○
4.1.2 Domestic credit to private sector, % GDP 80.2 37
4.1.3 Microfinance gross loans, % GDP n/a n/a
4.2 Investment 32.5 60 ○ ◇
4.2.1 Ease of protecting minority investors* 62.0 60 ○
4.2.2 Market capitalization, % GDP 53.4 32
4.2.3 Venture capital investors, deals/bn PPP$ GDP 0.1 25
4.2.4 Venture capital recipients, deals/bn PPP$ GDP 0.1 24
4.3 Trade, diversification, and market scale 89.8 2 ● ◆
4.3.1 Applied tariff rate, weighted avg., % 1.8 25
4.3.2 Domestic industry diversification 96.5 19
4.3.3 Domestic market scale, bn PPP$ 4,454.5 5 ● ◆
NOTES: ● indicates a strength; ○ a weakness; ◆ an income group strength; ◇ an income group weakness; * an index; †
a survey question. indicates that
the
economy’s data are older than the base year; see appendices for details, including the year of the data, at http://globalinnovationindex.org. Square
brackets [ ] indicate
that the data minimum coverage (DMC) requirements were not met at the sub-pillar or pillar level.](https://image.slidesharecdn.com/e-220805033615-e8521670/75/E-INDEX-2021-pdf-104-2048.jpg)
![85
GII 2021 Economy profiles
Ghana GII 2021 rank
112
Output rank Input rank Income Region Population (mn) GDP, PPP$ (bn) GDP per capita, PPP$ GII 2020 rank
103 114 Lower middle SSF 31.1 175.6 5,707 108
Score/
Value Rank
Business sophistication 17.8 108
5.1 Knowledge workers 19.2 103
5.1.1 Knowledge-intensive employment, % 12.2 104
5.1.2 Firms offering formal training, % 40.1 29 ●
5.1.3 GERD performed by business, % GDP n/a n/a
5.1.4 GERD financed by business, % 0.1 100 ○ ◇
5.1.5 Females employed w/advanced degrees, % 3.5 99
5.2 Innovation linkages 21.9 60
5.2.1 University-industry RD collaboration†
47.6 45 ● ◆
5.2.2 State of cluster development and depth†
51.7 42 ●
5.2.3 GERD financed by abroad, % GDP 0.1 35 ●
5.2.4 Joint venture/strategic alliance deals/bn PPP$ GDP 0.0 69
5.2.5 Patent families/bn PPP$ GDP 0.0 100 ○ ◇
5.3 Knowledge absorption 12.2 [130]
5.3.1 Intellectual property payments, % total trade n/a n/a
5.3.2 High-tech imports, % total trade 2.9 126 ○ ◇
5.3.3 ICT services imports, % total trade n/a n/a
5.3.4 FDI net inflows, % GDP 5.3 19 ●
5.3.5 Research talent, % in businesses 1.0 80
Knowledge and technology outputs 11.9 104
6.1 Knowledge creation 6.0 102
6.1.1 Patents by origin/bn PPP$ GDP 0.1 114
6.1.2 PCT patents by origin/bn PPP$ GDP 0.0 98 ○ ◇
6.1.3 Utility models by origin/bn PPP$ GDP 0.0 72
6.1.4 Scientific and technical articles/bn PPP$ GDP 11.6 73
6.1.5 Citable documents H-index 8.9 83
6.2 Knowledge impact 21.2 97
6.2.1 Labor productivity growth, % 3.8 11 ●
6.2.2 New businesses/th pop. 15–64 0.9 85
6.2.3 Software spending, % GDP 0.0 122 ○ ◇
6.2.4 ISO 9001 quality certificates/bn PPP$ GDP 0.5 124
6.2.5 High-tech manufacturing, % 11.0 86
6.3 Knowledge diffusion 8.6 [101]
6.3.1 Intellectual property receipts, % total trade n/a n/a
6.3.2 Production and export complexity 25.4 102
6.3.3 High-tech exports, % total trade 0.0 125
6.3.4 ICT services exports, % total trade n/a n/a
Creative outputs 16.9 94
7.1 Intangible assets 25.8 85
7.1.1 Trademarks by origin/bn PPP$ GDP 5.3 120
7.1.2 Global brand value, top 5,000, % GDP n/a n/a
7.1.3 Industrial designs by origin/bn PPP$ GDP 5.0 24 ●
7.1.4 ICTs and organizational model creation†
49.7 84
7.2 Creative goods and services 10.2 [78]
7.2.1 Cultural and creative services exports, % total trade n/a n/a
7.2.2 National feature films/mn pop. 15–69 n/a n/a
7.2.3 Entertainment and media market/th pop. 15–69 n/a n/a
7.2.4 Printing and other media, % manufacturing 1.6 25 ●
7.2.5 Creative goods exports, % total trade 0.0 120
7.3 Online creativity 5.8 119
7.3.1 Generic top-level domains (TLDs)/th pop. 15–69 0.6 105
7.3.2 Country-code TLDs/th pop. 15–69 0.1 121
7.3.3 Wikipedia edits/mn pop. 15–69 20.7 120
7.3.4 Mobile app creation/bn PPP$ GDP n/a n/a
Score/
Value Rank
Institutions 46.2 120
1.1 Political environment 52.7 87
1.1.1 Political and operational stability* 66.1 74
1.1.2 Government effectiveness* 46.0 88
1.2 Regulatory environment 30.8 128 ○ ◇
1.2.1 Regulatory quality* 40.6 78 ◆
1.2.2 Rule of law* 48.0 61 ◆
1.2.3 Cost of redundancy dismissal 49.8 127 ○ ◇
1.3 Business environment 55.2 118
1.3.1 Ease of starting a business* 85.0 89
1.3.2 Ease of resolving insolvency* 25.4 127 ○
Human capital and research 18.9 101
2.1 Education 41.2 92
2.1.1 Expenditure on education, % GDP 4.0 68
2.1.2 Government funding/pupil, secondary, % GDP/cap 19.3 52
2.1.3 School life expectancy, years 11.9 93
2.1.4 PISA scales in reading, maths and science n/a n/a
2.1.5 Pupil-teacher ratio, secondary 15.2 73
2.2 Tertiary education 13.4 108
2.2.1 Tertiary enrolment, % gross 17.2 101
2.2.2 Graduates in science and engineering, % 16.4 92
2.2.3 Tertiary inbound mobility, % 1.4 84
2.3 Research and development (RD) 2.1 93
2.3.1 Researchers, FTE/mn pop. 89.1 90
2.3.2 Gross expenditure on RD, % GDP 0.4 73
2.3.3 Global corporate RD investors, top 3, mn US$ 0.0 41 ○ ◇
2.3.4 QS university ranking, top 3* 0.0 74 ○ ◇
Infrastructure 31.7 97
3.1 Informationandcommunicationtechnologies(ICTs) 53.7 91
3.1.1 ICT access* 42.2 102
3.1.2 ICT use* 46.0 90
3.1.3 Government’s online service* 63.5 80
3.1.4 E-participation* 63.1 82
3.2 General infrastructure 19.2 114
3.2.1 Electricity output, GWh/mn pop. 411.9 111
3.2.2 Logistics performance* 24.1 101
3.2.3 Gross capital formation, % GDP 21.7 72
3.3 Ecological sustainability 22.1 86
3.3.1 GDP/unit of energy use 13.6 36 ●
3.3.2 Environmental performance* 27.6 125 ○ ◇
3.3.3 ISO 14001 environmental certificates/bn PPP$ GDP 0.3 98
Market sophistication 36.7 115
4.1 Credit 27.2 115
4.1.1 Ease of getting credit* 60.0 74
4.1.2 Domestic credit to private sector, % GDP 12.4 123
4.1.3 Microfinance gross loans, % GDP 0.6 32 ●
4.2 Investment 18.4 119
4.2.1 Ease of protecting minority investors* 60.0 71
4.2.2 Market capitalization, % GDP 8.5 70
4.2.3 Venture capital investors, deals/bn PPP$ GDP 0.0 75
4.2.4 Venture capital recipients, deals/bn PPP$ GDP 0.0 48
4.3 Trade, diversification, and market scale 64.5 75
4.3.1 Applied tariff rate, weighted avg., % 10.0 118
4.3.2 Domestic industry diversification 88.2 58
4.3.3 Domestic market scale, bn PPP$ 175.6 69
NOTES: ● indicates a strength; ○ a weakness; ◆ an income group strength; ◇ an income group weakness; * an index; †
a survey question. indicates that
the
economy’s data are older than the base year; see appendices for details, including the year of the data, at http://globalinnovationindex.org. Square
brackets [ ] indicate
that the data minimum coverage (DMC) requirements were not met at the sub-pillar or pillar level.](https://image.slidesharecdn.com/e-220805033615-e8521670/75/E-INDEX-2021-pdf-105-2048.jpg)
![86 Global Innovation Index 2021
Greece GII 2021 rank
47
Output rank Input rank Income Region Population (mn) GDP, PPP$ (bn) GDP per capita, PPP$ GII 2020 rank
60 39 High EUR 10.4 310.7 29,045 43
Score/
Value Rank
Business sophistication 25.9 60 ◇
5.1 Knowledge workers 35.7 55
5.1.1 Knowledge-intensive employment, % 30.1 47
5.1.2 Firms offering formal training, % 21.6 73
5.1.3 GERD performed by business, % GDP 0.6 36
5.1.4 GERD financed by business, % 41.6 40
5.1.5 Females employed w/advanced degrees, % 18.3 36
5.2 Innovation linkages 20.1 69 ◇
5.2.1 University-industry RD collaboration†
31.0 110 ○ ◇
5.2.2 State of cluster development and depth†
32.8 118 ○ ◇
5.2.3 GERD financed by abroad, % GDP 0.2 22
5.2.4 Joint venture/strategic alliance deals/bn PPP$ GDP 0.0 51
5.2.5 Patent families/bn PPP$ GDP 0.3 38
5.3 Knowledge absorption 21.8 80 ◇
5.3.1 Intellectual property payments, % total trade 0.4 72
5.3.2 High-tech imports, % total trade 5.1 110 ○
5.3.3 ICT services imports, % total trade 1.0 74
5.3.4 FDI net inflows, % GDP 2.0 79
5.3.5 Research talent, % in businesses 25.6 49
Knowledge and technology outputs 25.2 52
6.1 Knowledge creation 23.7 41
6.1.1 Patents by origin/bn PPP$ GDP 1.5 50
6.1.2 PCT patents by origin/bn PPP$ GDP 0.3 39
6.1.3 Utility models by origin/bn PPP$ GDP 0.0 61 ○
6.1.4 Scientific and technical articles/bn PPP$ GDP 38.0 21 ●
6.1.5 Citable documents H-index 33.2 29
6.2 Knowledge impact 36.3 37
6.2.1 Labor productivity growth, % −2.1 104 ○ ◇
6.2.2 New businesses/th pop. 15–64 1.4 71
6.2.3 Software spending, % GDP 0.5 10 ●
6.2.4 ISO 9001 quality certificates/bn PPP$ GDP 19.4 14 ● ◆
6.2.5 High-tech manufacturing, % 14.1 78 ◇
6.3 Knowledge diffusion 15.5 69
6.3.1 Intellectual property receipts, % total trade 0.1 57
6.3.2 Production and export complexity 46.4 55
6.3.3 High-tech exports, % total trade 2.2 55
6.3.4 ICT services exports, % total trade 1.5 69
Creative outputs 22.9 69 ◇
7.1 Intangible assets 21.1 96 ◇
7.1.1 Trademarks by origin/bn PPP$ GDP n/a n/a
7.1.2 Global brand value, top 5,000, % GDP 4.9 68 ◇
7.1.3 Industrial designs by origin/bn PPP$ GDP 2.8 38
7.1.4 ICTs and organizational model creation†
44.6 97 ○ ◇
7.2 Creative goods and services 21.8 45
7.2.1 Cultural and creative services exports, % total trade 0.7 38
7.2.2 National feature films/mn pop. 15–69 11.5 14 ●
7.2.3 Entertainment and media market/th pop. 15–69 24.2 27
7.2.4 Printing and other media, % manufacturing 1.1 50
7.2.5 Creative goods exports, % total trade 1.3 41
7.3 Online creativity 27.5 40
7.3.1 Generic top-level domains (TLDs)/th pop. 15–69 13.2 34
7.3.2 Country-code TLDs/th pop. 15–69 19.8 30
7.3.3 Wikipedia edits/mn pop. 15–69 70.5 34
7.3.4 Mobile app creation/bn PPP$ GDP 3.8 62
Score/
Value Rank
Institutions 69.2 51
1.1 Political environment 63.6 50 ◇
1.1.1 Political and operational stability* 71.4 54 ◇
1.1.2 Government effectiveness* 59.7 50 ◇
1.2 Regulatory environment 69.5 51
1.2.1 Regulatory quality* 57.3 47 ◇
1.2.2 Rule of law* 52.0 54 ◇
1.2.3 Cost of redundancy dismissal 15.9 64
1.3 Business environment 74.6 53
1.3.1 Ease of starting a business* 96.0 11 ● ◆
1.3.2 Ease of resolving insolvency* 53.1 66
Human capital and research 54.3 16 ●
2.1 Education 66.2 13 ●
2.1.1 Expenditure on education, % GDP n/a n/a
2.1.2 Government funding/pupil, secondary, % GDP/cap 21.5 37
2.1.3 School life expectancy, years 19.5 5 ● ◆
2.1.4 PISA scales in reading, maths and science 453.5 43
2.1.5 Pupil-teacher ratio, secondary 8.5 15 ● ◆
2.2 Tertiary education 63.4 1 ● ◆
2.2.1 Tertiary enrolment, % gross 142.9 1 ● ◆
2.2.2 Graduates in science and engineering, % 28.3 21
2.2.3 Tertiary inbound mobility, % 3.4 63
2.3 Research and development (RD) 33.4 34
2.3.1 Researchers, FTE/mn pop. 3,827.2 27
2.3.2 Gross expenditure on RD, % GDP 1.3 30
2.3.3 Global corporate RD investors, top 3, mn US$ 41.4 37
2.3.4 QS university ranking, top 3* 21.2 49
Infrastructure 48.5 45
3.1 Informationandcommunicationtechnologies(ICTs) 77.4 43
3.1.1 ICT access* 84.2 21 ●
3.1.2 ICT use* 76.3 35
3.1.3 Government’s online service* 70.6 65 ◇
3.1.4 E-participation* 78.6 50
3.2 General infrastructure 22.5 94 ◇
3.2.1 Electricity output, GWh/mn pop. 4,961.0 44
3.2.2 Logistics performance* 53.7 41
3.2.3 Gross capital formation, % GDP 11.9 121 ○ ◇
3.3 Ecological sustainability 45.4 23
3.3.1 GDP/unit of energy use 13.8 35
3.3.2 Environmental performance* 69.1 25
3.3.3 ISO 14001 environmental certificates/bn PPP$ GDP 4.7 21 ●
Market sophistication 45.2 70
4.1 Credit 38.5 76
4.1.1 Ease of getting credit* 45.0 101 ○ ◇
4.1.2 Domestic credit to private sector, % GDP 79.2 38
4.1.3 Microfinance gross loans, % GDP n/a n/a
4.2 Investment 21.7 104 ○
4.2.1 Ease of protecting minority investors* 70.0 36
4.2.2 Market capitalization, % GDP 22.7 56 ○
4.2.3 Venture capital investors, deals/bn PPP$ GDP 0.0 48
4.2.4 Venture capital recipients, deals/bn PPP$ GDP 0.0 81 ○
4.3 Trade, diversification, and market scale 75.4 42
4.3.1 Applied tariff rate, weighted avg., % 1.8 25
4.3.2 Domestic industry diversification 87.0 63
4.3.3 Domestic market scale, bn PPP$ 310.7 53
NOTES: ● indicates a strength; ○ a weakness; ◆ an income group strength; ◇ an income group weakness; * an index; †
a survey question. indicates that
the
economy’s data are older than the base year; see appendices for details, including the year of the data, at http://globalinnovationindex.org. Square
brackets [ ] indicate
that the data minimum coverage (DMC) requirements were not met at the sub-pillar or pillar level.](https://image.slidesharecdn.com/e-220805033615-e8521670/75/E-INDEX-2021-pdf-106-2048.jpg)
![87
GII 2021 Economy profiles
Guatemala GII 2021 rank
101
Output rank Input rank Income Region Population (mn) GDP, PPP$ (bn) GDP per capita, PPP$ GII 2020 rank
83 112 Upper middle LCN 17.9 148.6 8,267 106
Score/
Value Rank
Business sophistication 22.9 79
5.1 Knowledge workers 27.9 79
5.1.1 Knowledge-intensive employment, % 9.3 111 ◇
5.1.2 Firms offering formal training, % 55.7 11 ● ◆
5.1.3 GERD performed by business, % GDP n/a n/a
5.1.4 GERD financed by business, % 12.5 74
5.1.5 Females employed w/advanced degrees, % 2.7 102 ◇
5.2 Innovation linkages 14.8 110
5.2.1 University-industry RD collaboration†
37.3 92
5.2.2 State of cluster development and depth†
47.3 61
5.2.3 GERD financed by abroad, % GDP 0.0 102 ○ ◇
5.2.4 Joint venture/strategic alliance deals/bn PPP$ GDP 0.0 126 ○
5.2.5 Patent families/bn PPP$ GDP 0.0 100 ○ ◇
5.3 Knowledge absorption 26.1 67
5.3.1 Intellectual property payments, % total trade 1.3 30 ●
5.3.2 High-tech imports, % total trade 10.2 31 ●
5.3.3 ICT services imports, % total trade 1.8 36 ● ◆
5.3.4 FDI net inflows, % GDP 1.3 102
5.3.5 Research talent, % in businesses 1.4 78 ◇
Knowledge and technology outputs 14.2 90
6.1 Knowledge creation 1.9 127 ◇
6.1.1 Patents by origin/bn PPP$ GDP 0.0 122
6.1.2 PCT patents by origin/bn PPP$ GDP 0.0 93
6.1.3 Utility models by origin/bn PPP$ GDP 0.0 60
6.1.4 Scientific and technical articles/bn PPP$ GDP 1.8 127 ◇
6.1.5 Citable documents H-index 4.5 111
6.2 Knowledge impact 22.3 91
6.2.1 Labor productivity growth, % 2.6 20 ●
6.2.2 New businesses/th pop. 15–64 0.5 96
6.2.3 Software spending, % GDP 0.0 120 ◇
6.2.4 ISO 9001 quality certificates/bn PPP$ GDP 1.5 98
6.2.5 High-tech manufacturing, % n/a n/a
6.3 Knowledge diffusion 18.4 59
6.3.1 Intellectual property receipts, % total trade 0.1 59
6.3.2 Production and export complexity 33.4 81
6.3.3 High-tech exports, % total trade 1.4 67
6.3.4 ICT services exports, % total trade 3.7 22 ● ◆
Creative outputs 21.7 75
7.1 Intangible assets 38.0 43 ●
7.1.1 Trademarks by origin/bn PPP$ GDP 46.7 50 ●
7.1.2 Global brand value, top 5,000, % GDP n/a n/a
7.1.3 Industrial designs by origin/bn PPP$ GDP 0.0 116
7.1.4 ICTs and organizational model creation†
57.0 56
7.2 Creative goods and services 2.8 [111]
7.2.1 Cultural and creative services exports, % total trade 0.1 88
7.2.2 National feature films/mn pop. 15–69 1.2 80
7.2.3 Entertainment and media market/th pop. 15–69 n/a n/a
7.2.4 Printing and other media, % manufacturing n/a n/a
7.2.5 Creative goods exports, % total trade 0.2 76
7.3 Online creativity 8.1 108 ◇
7.3.1 Generic top-level domains (TLDs)/th pop. 15–69 4.0 59
7.3.2 Country-code TLDs/th pop. 15–69 0.6 97
7.3.3 Wikipedia edits/mn pop. 15–69 30.5 102 ◇
7.3.4 Mobile app creation/bn PPP$ GDP 0.0 102 ○
Score/
Value Rank
Institutions 48.3 117 ◇
1.1 Political environment 42.2 109 ◇
1.1.1 Political and operational stability* 55.4 112 ◇
1.1.2 Government effectiveness* 35.6 109 ◇
1.2 Regulatory environment 45.4 115 ◇
1.2.1 Regulatory quality* 37.6 88
1.2.2 Rule of law* 19.0 124 ◇
1.2.3 Cost of redundancy dismissal 27.0 107
1.3 Business environment 57.2 113 ◇
1.3.1 Ease of starting a business* 86.8 77
1.3.2 Ease of resolving insolvency* 27.6 124 ◇
Human capital and research 12.2 120 ◇
2.1 Education 28.5 119 ◇
2.1.1 Expenditure on education, % GDP 3.2 90
2.1.2 Government funding/pupil, secondary, % GDP/cap 5.5 102 ○ ◇
2.1.3 School life expectancy, years 10.8 101 ◇
2.1.4 PISA scales in reading, maths and science n/a n/a
2.1.5 Pupil-teacher ratio, secondary 12.2 51 ●
2.2 Tertiary education 7.9 116 ◇
2.2.1 Tertiary enrolment, % gross 21.8 96 ◇
2.2.2 Graduates in science and engineering, % 9.8 107 ○ ◇
2.2.3 Tertiary inbound mobility, % n/a n/a
2.3 Research and development (RD) 0.1 120
2.3.1 Researchers, FTE/mn pop. 12.9 108 ○ ◇
2.3.2 Gross expenditure on RD, % GDP 0.0 115 ○ ◇
2.3.3 Global corporate RD investors, top 3, mn US$ 0.0 41 ○ ◇
2.3.4 QS university ranking, top 3* 0.0 74 ○ ◇
Infrastructure 23.7 122 ◇
3.1 Informationandcommunicationtechnologies(ICTs) 42.5 105 ◇
3.1.1 ICT access* 48.1 93 ◇
3.1.2 ICT use* 20.8 114 ◇
3.1.3 Government’s online service* 51.2 104 ◇
3.1.4 E-participation* 50.0 103 ◇
3.2 General infrastructure 9.4 130 ○ ◇
3.2.1 Electricity output, GWh/mn pop. 818.8 102 ◇
3.2.2 Logistics performance* 17.1 114 ◇
3.2.3 Gross capital formation, % GDP 11.6 122 ◇
3.3 Ecological sustainability 19.2 107 ◇
3.3.1 GDP/unit of energy use 9.9 70
3.3.2 Environmental performance* 31.8 115 ◇
3.3.3 ISO 14001 environmental certificates/bn PPP$ GDP 0.2 113
Market sophistication 44.4 77
4.1 Credit 39.7 72
4.1.1 Ease of getting credit* 85.0 14 ●
4.1.2 Domestic credit to private sector, % GDP 34.3 91
4.1.3 Microfinance gross loans, % GDP 0.2 48
4.2 Investment 30.0 [69]
4.2.1 Ease of protecting minority investors* 30.0 122 ◇
4.2.2 Market capitalization, % GDP n/a n/a
4.2.3 Venture capital investors, deals/bn PPP$ GDP n/a n/a
4.2.4 Venture capital recipients, deals/bn PPP$ GDP n/a n/a
4.3 Trade, diversification, and market scale 63.6 80
4.3.1 Applied tariff rate, weighted avg., % 1.4 16 ●
4.3.2 Domestic industry diversification n/a n/a
4.3.3 Domestic market scale, bn PPP$ 148.6 72
NOTES: ● indicates a strength; ○ a weakness; ◆ an income group strength; ◇ an income group weakness; * an index; †
a survey question. indicates that
the
economy’s data are older than the base year; see appendices for details, including the year of the data, at http://globalinnovationindex.org. Square
brackets [ ] indicate
that the data minimum coverage (DMC) requirements were not met at the sub-pillar or pillar level.](https://image.slidesharecdn.com/e-220805033615-e8521670/75/E-INDEX-2021-pdf-107-2048.jpg)
![88 Global Innovation Index 2021
Guinea GII 2021 rank
130
Output rank Input rank Income Region Population (mn) GDP, PPP$ (bn) GDP per capita, PPP$ GII 2020 rank
126 130 Low SSF 13.1 35.1 2,516 130
Score/
Value Rank
Business sophistication 15.8[121]
5.1 Knowledge workers 9.6 [125]
5.1.1 Knowledge-intensive employment, % 7.4 114
5.1.2 Firms offering formal training, % 16.0 89
5.1.3 GERD performed by business, % GDP n/a n/a
5.1.4 GERD financed by business, % n/a n/a
5.1.5 Females employed w/advanced degrees, % 2.2 104
5.2 Innovation linkages 26.3 [44]
5.2.1 University-industry RD collaboration†
46.9 48 ● ◆
5.2.2 State of cluster development and depth†
42.2 93
5.2.3 GERD financed by abroad, % GDP n/a n/a
5.2.4 Joint venture/strategic alliance deals/bn PPP$ GDP n/a n/a
5.2.5 Patent families/bn PPP$ GDP 0.0 100 ○ ◇
5.3 Knowledge absorption 11.4 132 ○ ◇
5.3.1 Intellectual property payments, % total trade 0.0 114
5.3.2 High-tech imports, % total trade 2.4 128 ◇
5.3.3 ICT services imports, % total trade 0.7 92 ●
5.3.4 FDI net inflows, % GDP 3.1 47 ●
5.3.5 Research talent, % in businesses n/a n/a
Knowledge and technology outputs 2.5 132 ○ ◇
6.1 Knowledge creation 1.3 130 ○ ◇
6.1.1 Patents by origin/bn PPP$ GDP 0.0 128 ○ ◇
6.1.2 PCT patents by origin/bn PPP$ GDP 0.0 98 ○ ◇
6.1.3 Utility models by origin/bn PPP$ GDP 0.0 76 ○ ◇
6.1.4 Scientific and technical articles/bn PPP$ GDP 2.9 122
6.1.5 Citable documents H-index 2.3 128
6.2 Knowledge impact 1.8 [132]
6.2.1 Labor productivity growth, % n/a n/a
6.2.2 New businesses/th pop. 15–64 0.4 102
6.2.3 Software spending, % GDP 0.0 106
6.2.4 ISO 9001 quality certificates/bn PPP$ GDP 0.4 125
6.2.5 High-tech manufacturing, % n/a n/a
6.3 Knowledge diffusion 4.4 122
6.3.1 Intellectual property receipts, % total trade n/a n/a
6.3.2 Production and export complexity 10.8 118 ◇
6.3.3 High-tech exports, % total trade 0.0 128 ◇
6.3.4 ICT services exports, % total trade 0.7 93 ●
Creative outputs 16.6 96
7.1 Intangible assets 27.1 79 ●
7.1.1 Trademarks by origin/bn PPP$ GDP 7.2 116
7.1.2 Global brand value, top 5,000, % GDP n/a n/a
7.1.3 Industrial designs by origin/bn PPP$ GDP 1.4 57 ●
7.1.4 ICTs and organizational model creation†
60.0 45 ● ◆
7.2 Creative goods and services 2.8 [112]
7.2.1 Cultural and creative services exports, % total trade 0.3 65 ●
7.2.2 National feature films/mn pop. 15–69 0.9 86
7.2.3 Entertainment and media market/th pop. 15–69 n/a n/a
7.2.4 Printing and other media, % manufacturing n/a n/a
7.2.5 Creative goods exports, % total trade 0.0 129 ○
7.3 Online creativity 9.3 99
7.3.1 Generic top-level domains (TLDs)/th pop. 15–69 0.1 125
7.3.2 Country-code TLDs/th pop. 15–69 0.0 132 ○ ◇
7.3.3 Wikipedia edits/mn pop. 15–69 30.6 101
7.3.4 Mobile app creation/bn PPP$ GDP n/a n/a
Score/
Value Rank
Institutions 53.6 100
1.1 Political environment 41.9 110
1.1.1 Political and operational stability* 58.9 100
1.1.2 Government effectiveness* 33.3 116
1.2 Regulatory environment 57.5 88 ●
1.2.1 Regulatory quality* 23.4 118
1.2.2 Rule of law* 14.9 129
1.2.3 Cost of redundancy dismissal 10.1 30 ●
1.3 Business environment 61.5 102
1.3.1 Ease of starting a business* 84.5 94 ●
1.3.2 Ease of resolving insolvency* 38.6 103
Human capital and research 7.0 132 ○ ◇
2.1 Education 15.0 130 ○ ◇
2.1.1 Expenditure on education, % GDP 2.3 109 ◇
2.1.2 Government funding/pupil, secondary, % GDP/cap 8.2 95 ◇
2.1.3 School life expectancy, years 9.0 113
2.1.4 PISA scales in reading, maths and science n/a n/a
2.1.5 Pupil-teacher ratio, secondary 33.1 120
2.2 Tertiary education 5.9 122
2.2.1 Tertiary enrolment, % gross 11.6 110
2.2.2 Graduates in science and engineering, % n/a n/a
2.2.3 Tertiary inbound mobility, % 0.9 90
2.3 Research and development (RD) 0.0 [123]
2.3.1 Researchers, FTE/mn pop. n/a n/a
2.3.2 Gross expenditure on RD, % GDP n/a n/a
2.3.3 Global corporate RD investors, top 3, mn US$ 0.0 41 ○ ◇
2.3.4 QS university ranking, top 3* 0.0 74 ○ ◇
Infrastructure 17.8 131 ○ ◇
3.1 Informationandcommunicationtechnologies(ICTs) 25.2 129
3.1.1 ICT access* 33.3 119
3.1.2 ICT use* 15.0 121
3.1.3 Government’s online service* 21.8 130 ○ ◇
3.1.4 E-participation* 31.0 124
3.2 General infrastructure 14.3 119
3.2.1 Electricity output, GWh/mn pop. n/a n/a
3.2.2 Logistics performance* 7.2 122 ◇
3.2.3 Gross capital formation, % GDP 17.1 103
3.3 Ecological sustainability 13.7 130 ○
3.3.1 GDP/unit of energy use n/a n/a
3.3.2 Environmental performance* 26.4 128 ○ ◇
3.3.3 ISO 14001 environmental certificates/bn PPP$ GDP 0.2 111
Market sophistication 25.1 131 ○ ◇
4.1 Credit 13.3 127
4.1.1 Ease of getting credit* 30.0 122
4.1.2 Domestic credit to private sector, % GDP 9.0 129 ○
4.1.3 Microfinance gross loans, % GDP 0.2 51 ●
4.2 Investment 26.0 [80]
4.2.1 Ease of protecting minority investors* 26.0 126
4.2.2 Market capitalization, % GDP n/a n/a
4.2.3 Venture capital investors, deals/bn PPP$ GDP n/a n/a
4.2.4 Venture capital recipients, deals/bn PPP$ GDP n/a n/a
4.3 Trade, diversification, and market scale 36.0 127 ◇
4.3.1 Applied tariff rate, weighted avg., % 10.9 121 ◇
4.3.2 Domestic industry diversification n/a n/a
4.3.3 Domestic market scale, bn PPP$ 35.1 115
NOTES: ● indicates a strength; ○ a weakness; ◆ an income group strength; ◇ an income group weakness; * an index; †
a survey question. indicates that
the
economy’s data are older than the base year; see appendices for details, including the year of the data, at http://globalinnovationindex.org. Square
brackets [ ] indicate
that the data minimum coverage (DMC) requirements were not met at the sub-pillar or pillar level.](https://image.slidesharecdn.com/e-220805033615-e8521670/75/E-INDEX-2021-pdf-108-2048.jpg)
![89
GII 2021 Economy profiles
Honduras GII 2021 rank
108
Output rank Input rank Income Region Population (mn) GDP, PPP$ (bn) GDP per capita, PPP$ GII 2020 rank
106 101 Lower middle LCN 9.9 55.1 5,538 103
Score/
Value Rank
Business sophistication 24.0 72
5.1 Knowledge workers 27.3 81
5.1.1 Knowledge-intensive employment, % 13.9 96
5.1.2 Firms offering formal training, % 47.7 20 ● ◆
5.1.3 GERD performed by business, % GDP n/a n/a
5.1.4 GERD financed by business, % 10.4 76
5.1.5 Females employed w/advanced degrees, % 4.9 95
5.2 Innovation linkages 14.0 113
5.2.1 University-industry RD collaboration†
27.6 118 ◇
5.2.2 State of cluster development and depth†
42.6 89
5.2.3 GERD financed by abroad, % GDP 0.0 95 ○
5.2.4 Joint venture/strategic alliance deals/bn PPP$ GDP 0.0 71
5.2.5 Patent families/bn PPP$ GDP 0.0 86
5.3 Knowledge absorption 30.9 54
5.3.1 Intellectual property payments, % total trade 1.1 36 ● ◆
5.3.2 High-tech imports, % total trade 7.7 65
5.3.3 ICT services imports, % total trade 1.8 41 ● ◆
5.3.4 FDI net inflows, % GDP 4.6 22 ●
5.3.5 Research talent, % in businesses n/a n/a
Knowledge and technology outputs 9.8 118
6.1 Knowledge creation 1.5 129 ○ ◇
6.1.1 Patents by origin/bn PPP$ GDP 0.0 128 ○ ◇
6.1.2 PCT patents by origin/bn PPP$ GDP 0.0 98 ○ ◇
6.1.3 Utility models by origin/bn PPP$ GDP 0.0 76 ○ ◇
6.1.4 Scientific and technical articles/bn PPP$ GDP 3.2 118
6.1.5 Citable documents H-index 2.4 126 ○
6.2 Knowledge impact 15.3 [116]
6.2.1 Labor productivity growth, % n/a n/a
6.2.2 New businesses/th pop. 15–64 n/a n/a
6.2.3 Software spending, % GDP 0.3 47 ●
6.2.4 ISO 9001 quality certificates/bn PPP$ GDP 3.0 76
6.2.5 High-tech manufacturing, % n/a n/a
6.3 Knowledge diffusion 12.7 80
6.3.1 Intellectual property receipts, % total trade n/a n/a
6.3.2 Production and export complexity 28.5 97
6.3.3 High-tech exports, % total trade 0.1 115
6.3.4 ICT services exports, % total trade 2.0 57
Creative outputs 15.6 102
7.1 Intangible assets 26.6 81
7.1.1 Trademarks by origin/bn PPP$ GDP 46.1 51 ●
7.1.2 Global brand value, top 5,000, % GDP 0.0 80 ○ ◇
7.1.3 Industrial designs by origin/bn PPP$ GDP 0.1 112
7.1.4 ICTs and organizational model creation†
55.3 59
7.2 Creative goods and services 1.8 [119]
7.2.1 Cultural and creative services exports, % total trade 0.0 102
7.2.2 National feature films/mn pop. 15–69 2.0 68
7.2.3 Entertainment and media market/th pop. 15–69 n/a n/a
7.2.4 Printing and other media, % manufacturing n/a n/a
7.2.5 Creative goods exports, % total trade 0.0 119
7.3 Online creativity 7.6 110
7.3.1 Generic top-level domains (TLDs)/th pop. 15–69 0.5 107
7.3.2 Country-code TLDs/th pop. 15–69 0.4 103
7.3.3 Wikipedia edits/mn pop. 15–69 32.0 97
7.3.4 Mobile app creation/bn PPP$ GDP 0.1 89
Score/
Value Rank
Institutions 45.8 121
1.1 Political environment 44.9 104
1.1.1 Political and operational stability* 60.7 97
1.1.2 Government effectiveness* 37.1 105
1.2 Regulatory environment 40.6 120
1.2.1 Regulatory quality* 30.6 102
1.2.2 Rule of law* 20.1 121 ◇
1.2.3 Cost of redundancy dismissal 30.3 119
1.3 Business environment 52.0 123 ○
1.3.1 Ease of starting a business* 71.4 124 ○ ◇
1.3.2 Ease of resolving insolvency* 32.6 116
Human capital and research 20.7 96
2.1 Education 47.3 75
2.1.1 Expenditure on education, % GDP 6.1 15 ● ◆
2.1.2 Government funding/pupil, secondary, % GDP/cap 20.3 48
2.1.3 School life expectancy, years 10.3 106
2.1.4 PISA scales in reading, maths and science n/a n/a
2.1.5 Pupil-teacher ratio, secondary 14.6 70
2.2 Tertiary education 14.7 103
2.2.1 Tertiary enrolment, % gross 25.5 90
2.2.2 Graduates in science and engineering, % 15.7 95
2.2.3 Tertiary inbound mobility, % 0.9 88
2.3 Research and development (RD) 0.2 116
2.3.1 Researchers, FTE/mn pop. 34.7 98
2.3.2 Gross expenditure on RD, % GDP 0.0 112 ○ ◇
2.3.3 Global corporate RD investors, top 3, mn US$ 0.0 41 ○ ◇
2.3.4 QS university ranking, top 3* 0.0 74 ○ ◇
Infrastructure 25.8 116
3.1 Informationandcommunicationtechnologies(ICTs) 41.2 107
3.1.1 ICT access* 39.2 108
3.1.2 ICT use* 30.2 104
3.1.3 Government’s online service* 46.5 111
3.1.4 E-participation* 48.8 105
3.2 General infrastructure 16.1 117
3.2.1 Electricity output, GWh/mn pop. 993.5 97
3.2.2 Logistics performance* 25.9 89
3.2.3 Gross capital formation, % GDP 16.9 104
3.3 Ecological sustainability 20.0 100
3.3.1 GDP/unit of energy use 7.8 93
3.3.2 Environmental performance* 37.8 96
3.3.3 ISO 14001 environmental certificates/bn PPP$ GDP 0.7 74
Market sophistication 47.9 62
4.1 Credit 48.7 38 ●
4.1.1 Ease of getting credit* 80.0 23 ●
4.1.2 Domestic credit to private sector, % GDP 63.9 52 ●
4.1.3 Microfinance gross loans, % GDP 1.9 14 ●
4.2 Investment 42.0 [28]
4.2.1 Ease of protecting minority investors* 42.0 102
4.2.2 Market capitalization, % GDP n/a n/a
4.2.3 Venture capital investors, deals/bn PPP$ GDP n/a n/a
4.2.4 Venture capital recipients, deals/bn PPP$ GDP n/a n/a
4.3 Trade, diversification, and market scale 53.1 112
4.3.1 Applied tariff rate, weighted avg., % 3.4 66
4.3.2 Domestic industry diversification n/a n/a
4.3.3 Domestic market scale, bn PPP$ 55.1 100
NOTES: ● indicates a strength; ○ a weakness; ◆ an income group strength; ◇ an income group weakness; * an index; †
a survey question. indicates that
the
economy’s data are older than the base year; see appendices for details, including the year of the data, at http://globalinnovationindex.org. Square
brackets [ ] indicate
that the data minimum coverage (DMC) requirements were not met at the sub-pillar or pillar level.](https://image.slidesharecdn.com/e-220805033615-e8521670/75/E-INDEX-2021-pdf-109-2048.jpg)
![90 Global Innovation Index 2021
Hong Kong, China GII 2021 rank
14
Output rank Input rank Income Region Population (mn) GDP, PPP$ (bn) GDP per capita, PPP$ GII 2020 rank
17 10 High SEAO 7.5 439.5 58,165 11
Score/
Value Rank
Business sophistication 45.2 24 ◇
5.1 Knowledge workers 44.6 35 ◇
5.1.1 Knowledge-intensive employment, % 39.0 29 ◇
5.1.2 Firms offering formal training, % n/a n/a
5.1.3 GERD performed by business, % GDP 0.4 43 ◇
5.1.4 GERD financed by business, % 49.2 29
5.1.5 Females employed w/advanced degrees, % 15.9 44 ◇
5.2 Innovation linkages 40.8 24
5.2.1 University-industry RD collaboration†
61.3 21
5.2.2 State of cluster development and depth†
68.3 10
5.2.3 GERD financed by abroad, % GDP 0.0 58 ◇
5.2.4 Joint venture/strategic alliance deals/bn PPP$ GDP 0.2 7
5.2.5 Patent families/bn PPP$ GDP 0.8 29 ◇
5.3 Knowledge absorption 50.1 12
5.3.1 Intellectual property payments, % total trade 0.3 81 ○ ◇
5.3.2 High-tech imports, % total trade 51.6 1 ● ◆
5.3.3 ICT services imports, % total trade 0.3 119 ○ ◇
5.3.4 FDI net inflows, % GDP 26.1 4 ◆
5.3.5 Research talent, % in businesses 35.6 37 ◇
Knowledge and technology outputs 21.6 62 ◇
6.1 Knowledge creation 24.2 [40]
6.1.1 Patents by origin/bn PPP$ GDP 0.7 72 ◇
6.1.2 PCT patents by origin/bn PPP$ GDP n/a n/a
6.1.3 Utility models by origin/bn PPP$ GDP 1.1 21
6.1.4 Scientific and technical articles/bn PPP$ GDP n/a n/a
6.1.5 Citable documents H-index 37.3 25
6.2 Knowledge impact 38.4 31
6.2.1 Labor productivity growth, % −0.3 74 ○
6.2.2 New businesses/th pop. 15–64 28.6 1 ● ◆
6.2.3 Software spending, % GDP 0.4 25
6.2.4 ISO 9001 quality certificates/bn PPP$ GDP 4.6 57
6.2.5 High-tech manufacturing, % 18.1 66 ◇
6.3 Knowledge diffusion 2.3 128 ○ ◇
6.3.1 Intellectual property receipts, % total trade 0.1 54 ◇
6.3.2 Production and export complexity n/a n/a
6.3.3 High-tech exports, % total trade 0.1 121 ○ ◇
6.3.4 ICT services exports, % total trade 0.4 102 ○
Creative outputs 64.7 1 ● ◆
7.1 Intangible assets 64.7 4 ◆
7.1.1 Trademarks by origin/bn PPP$ GDP 62.3 32
7.1.2 Global brand value, top 5,000, % GDP 307.2 1 ● ◆
7.1.3 Industrial designs by origin/bn PPP$ GDP 3.2 35
7.1.4 ICTs and organizational model creation†
67.6 23
7.2 Creative goods and services 63.7 1 ● ◆
7.2.1 Cultural and creative services exports, % total trade 0.1 78 ○ ◇
7.2.2 National feature films/mn pop. 15–69 9.3 22
7.2.3 Entertainment and media market/th pop. 15–69 47.1 19
7.2.4 Printing and other media, % manufacturing 5.0 1 ● ◆
7.2.5 Creative goods exports, % total trade 11.0 1 ● ◆
7.3 Online creativity 65.7 5
7.3.1 Generic top-level domains (TLDs)/th pop. 15–69 74.0 7
7.3.2 Country-code TLDs/th pop. 15–69 12.2 37 ◇
7.3.3 Wikipedia edits/mn pop. 15–69 86.8 4 ◆
7.3.4 Mobile app creation/bn PPP$ GDP 84.9 6 ◆
Score/
Value Rank
Institutions 88.1 11
1.1 Political environment 86.3 12
1.1.1 Political and operational stability* 80.4 29
1.1.2 Government effectiveness* 89.3 8
1.2 Regulatory environment 96.1 4
1.2.1 Regulatory quality* 95.3 2 ● ◆
1.2.2 Rule of law* 89.0 15
1.2.3 Cost of redundancy dismissal 8.0 1 ● ◆
1.3 Business environment 81.9 28
1.3.1 Ease of starting a business* 98.2 5 ◆
1.3.2 Ease of resolving insolvency* 65.7 41 ◇
Human capital and research 48.6 25
2.1 Education 58.1 37
2.1.1 Expenditure on education, % GDP 3.8 76 ○ ◇
2.1.2 Government funding/pupil, secondary, % GDP/cap 22.7 30
2.1.3 School life expectancy, years 17.2 17
2.1.4 PISA scales in reading, maths and science 530.7 3 ● ◆
2.1.5 Pupil-teacher ratio, secondary 11.0 40
2.2 Tertiary education 51.1 11
2.2.1 Tertiary enrolment, % gross 81.0 21
2.2.2 Graduates in science and engineering, % n/a n/a
2.2.3 Tertiary inbound mobility, % 14.3 11
2.3 Research and development (RD) 36.4 30 ◇
2.3.1 Researchers, FTE/mn pop. 4,026.6 25
2.3.2 Gross expenditure on RD, % GDP 0.9 42 ◇
2.3.3 Global corporate RD investors, top 3, mn US$ 0.0 41 ○ ◇
2.3.4 QS university ranking, top 3* 80.5 5
Infrastructure 60.3 6
3.1 Informationandcommunicationtechnologies(ICTs) 89.6 [10]
3.1.1 ICT access* 94.3 2 ● ◆
3.1.2 ICT use* 84.9 11
3.1.3 Government’s online service* n/a n/a
3.1.4 E-participation* n/a n/a
3.2 General infrastructure 35.4 39 ◇
3.2.1 Electricity output, GWh/mn pop. 4,905.9 45
3.2.2 Logistics performance* 86.9 12
3.2.3 Gross capital formation, % GDP 17.4 101 ○ ◇
3.3 Ecological sustainability 55.7 4 ◆
3.3.1 GDP/unit of energy use 32.2 1 ● ◆
3.3.2 Environmental performance* n/a n/a
3.3.3 ISO 14001 environmental certificates/bn PPP$ GDP 1.9 46
Market sophistication 78.7 3 ● ◆
4.1 Credit 87.5 2 ● ◆
4.1.1 Ease of getting credit* 75.0 34
4.1.2 Domestic credit to private sector, % GDP 235.7 1 ● ◆
4.1.3 Microfinance gross loans, % GDP n/a n/a
4.2 Investment 75.2 6 ◆
4.2.1 Ease of protecting minority investors* 84.0 7 ◆
4.2.2 Market capitalization, % GDP 1,223.5 1 ● ◆
4.2.3 Venture capital investors, deals/bn PPP$ GDP 0.7 1 ● ◆
4.2.4 Venture capital recipients, deals/bn PPP$ GDP 0.0 33
4.3 Trade, diversification, and market scale 73.5 51
4.3.1 Applied tariff rate, weighted avg., % 0.0 1 ●
4.3.2 Domestic industry diversification 73.6 92 ○ ◇
4.3.3 Domestic market scale, bn PPP$ 439.5 45
NOTES: ● indicates a strength; ○ a weakness; ◆ an income group strength; ◇ an income group weakness; * an index; †
a survey question. indicates that
the
economy’s data are older than the base year; see appendices for details, including the year of the data, at http://globalinnovationindex.org. Square
brackets [ ] indicate
that the data minimum coverage (DMC) requirements were not met at the sub-pillar or pillar level.](https://image.slidesharecdn.com/e-220805033615-e8521670/75/E-INDEX-2021-pdf-110-2048.jpg)
![91
GII 2021 Economy profiles
Hungary GII 2021 rank
34
Output rank Input rank Income Region Population (mn) GDP, PPP$ (bn) GDP per capita, PPP$ GII 2020 rank
31 34 High EUR 9.7 316.3 32,434 35
Score/
Value Rank
Business sophistication 37.5 31
5.1 Knowledge workers 44.7 33
5.1.1 Knowledge-intensive employment, % 35.1 39
5.1.2 Firms offering formal training, % 29.3 53
5.1.3 GERD performed by business, % GDP 1.1 21
5.1.4 GERD financed by business, % 52.4 25
5.1.5 Females employed w/advanced degrees, % 15.7 45
5.2 Innovation linkages 24.4 48
5.2.1 University-industry RD collaboration†
44.1 57
5.2.2 State of cluster development and depth†
45.6 71
5.2.3 GERD financed by abroad, % GDP 0.2 17
5.2.4 Joint venture/strategic alliance deals/bn PPP$ GDP 0.0 81 ○
5.2.5 Patent families/bn PPP$ GDP 0.3 34
5.3 Knowledge absorption 43.5 23
5.3.1 Intellectual property payments, % total trade 1.2 31
5.3.2 High-tech imports, % total trade 15.0 13 ● ◆
5.3.3 ICT services imports, % total trade 1.4 53
5.3.4 FDI net inflows, % GDP −9.8 130 ○ ◇
5.3.5 Research talent, % in businesses 58.0 14
Knowledge and technology outputs 39.5 20
6.1 Knowledge creation 23.0 45
6.1.1 Patents by origin/bn PPP$ GDP 1.6 44
6.1.2 PCT patents by origin/bn PPP$ GDP 0.4 36
6.1.3 Utility models by origin/bn PPP$ GDP 0.7 29
6.1.4 Scientific and technical articles/bn PPP$ GDP 25.7 38
6.1.5 Citable documents H-index 29.4 33
6.2 Knowledge impact 49.8 7 ● ◆
6.2.1 Labor productivity growth, % 1.2 40 ◆
6.2.2 New businesses/th pop. 15–64 3.7 38
6.2.3 Software spending, % GDP 0.2 53
6.2.4 ISO 9001 quality certificates/bn PPP$ GDP 21.7 8 ● ◆
6.2.5 High-tech manufacturing, % 56.7 8 ● ◆
6.3 Knowledge diffusion 45.7 20
6.3.1 Intellectual property receipts, % total trade 1.3 17 ●
6.3.2 Production and export complexity 82.3 9 ●
6.3.3 High-tech exports, % total trade 14.1 9 ● ◆
6.3.4 ICT services exports, % total trade 2.1 54
Creative outputs 30.9 47
7.1 Intangible assets 25.9 84 ○ ◇
7.1.1 Trademarks by origin/bn PPP$ GDP 28.3 76 ○
7.1.2 Global brand value, top 5,000, % GDP 9.5 61
7.1.3 Industrial designs by origin/bn PPP$ GDP 2.1 47
7.1.4 ICTs and organizational model creation†
60.3 42
7.2 Creative goods and services 39.0 12 ●
7.2.1 Cultural and creative services exports, % total trade 0.9 35
7.2.2 National feature films/mn pop. 15–69 5.2 43
7.2.3 Entertainment and media market/th pop. 15–69 14.3 31 ◇
7.2.4 Printing and other media, % manufacturing 0.8 70 ○
7.2.5 Creative goods exports, % total trade 7.2 7 ● ◆
7.3 Online creativity 32.6 33
7.3.1 Generic top-level domains (TLDs)/th pop. 15–69 10.4 40
7.3.2 Country-code TLDs/th pop. 15–69 34.5 19 ●
7.3.3 Wikipedia edits/mn pop. 15–69 76.1 19 ●
7.3.4 Mobile app creation/bn PPP$ GDP 5.8 55
Score/
Value Rank
Institutions 71.7 42
1.1 Political environment 69.1 42
1.1.1 Political and operational stability* 83.9 13
1.1.2 Government effectiveness* 61.7 45 ◇
1.2 Regulatory environment 74.4 38
1.2.1 Regulatory quality* 59.3 43
1.2.2 Rule of law* 59.7 46
1.2.3 Cost of redundancy dismissal 13.4 48
1.3 Business environment 71.6 63
1.3.1 Ease of starting a business* 88.2 70
1.3.2 Ease of resolving insolvency* 55.0 61
Human capital and research 42.5 36
2.1 Education 54.3 51
2.1.1 Expenditure on education, % GDP 4.7 53
2.1.2 Government funding/pupil, secondary, % GDP/cap 21.1 42
2.1.3 School life expectancy, years 15.1 49
2.1.4 PISA scales in reading, maths and science 479.3 33
2.1.5 Pupil-teacher ratio, secondary 10.0 29
2.2 Tertiary education 35.4 59
2.2.1 Tertiary enrolment, % gross 50.3 63
2.2.2 Graduates in science and engineering, % 22.5 55
2.2.3 Tertiary inbound mobility, % 11.4 17
2.3 Research and development (RD) 37.8 29
2.3.1 Researchers, FTE/mn pop. 4,057.4 24
2.3.2 Gross expenditure on RD, % GDP 1.5 24
2.3.3 Global corporate RD investors, top 3, mn US$ 51.6 28
2.3.4 QS university ranking, top 3* 21.6 47
Infrastructure 52.6 32
3.1 Informationandcommunicationtechnologies(ICTs) 72.6 55 ◇
3.1.1 ICT access* 79.0 39
3.1.2 ICT use* 69.1 49 ◇
3.1.3 Government’s online service* 74.7 55
3.1.4 E-participation* 67.9 75 ○ ◇
3.2 General infrastructure 37.4 35
3.2.1 Electricity output, GWh/mn pop. 3,495.8 59
3.2.2 Logistics performance* 63.7 30
3.2.3 Gross capital formation, % GDP 28.3 25
3.3 Ecological sustainability 47.6 19 ●
3.3.1 GDP/unit of energy use 11.6 55
3.3.2 Environmental performance* 63.7 33
3.3.3 ISO 14001 environmental certificates/bn PPP$ GDP 7.9 11 ● ◆
Market sophistication 46.6 65
4.1 Credit 43.5 53
4.1.1 Ease of getting credit* 75.0 34
4.1.2 Domestic credit to private sector, % GDP 33.5 92 ○ ◇
4.1.3 Microfinance gross loans, % GDP n/a n/a
4.2 Investment 17.7 122 ○ ◇
4.2.1 Ease of protecting minority investors* 54.0 88 ○ ◇
4.2.2 Market capitalization, % GDP 20.1 59 ○
4.2.3 Venture capital investors, deals/bn PPP$ GDP 0.0 56 ○
4.2.4 Venture capital recipients, deals/bn PPP$ GDP 0.0 65 ○
4.3 Trade, diversification, and market scale 78.5 33
4.3.1 Applied tariff rate, weighted avg., % 1.8 25
4.3.2 Domestic industry diversification 94.5 31
4.3.3 Domestic market scale, bn PPP$ 316.3 52
NOTES: ● indicates a strength; ○ a weakness; ◆ an income group strength; ◇ an income group weakness; * an index; †
a survey question. indicates that
the
economy’s data are older than the base year; see appendices for details, including the year of the data, at http://globalinnovationindex.org. Square
brackets [ ] indicate
that the data minimum coverage (DMC) requirements were not met at the sub-pillar or pillar level.](https://image.slidesharecdn.com/e-220805033615-e8521670/75/E-INDEX-2021-pdf-111-2048.jpg)
![92 Global Innovation Index 2021
Iceland GII 2021 rank
17
Output rank Input rank Income Region Population (mn) GDP, PPP$ (bn) GDP per capita, PPP$ GII 2020 rank
16 20 High EUR 0.3 19.8 54,482 21
Score/
Value Rank
Business sophistication 50.4 18
5.1 Knowledge workers 58.9 19
5.1.1 Knowledge-intensive employment, % 50.4 8
5.1.2 Firms offering formal training, % n/a n/a
5.1.3 GERD performed by business, % GDP 1.6 13
5.1.4 GERD financed by business, % 38.9 45 ◇
5.1.5 Females employed w/advanced degrees, % 25.9 11
5.2 Innovation linkages 58.5 8
5.2.1 University-industry RD collaboration†
58.8 26
5.2.2 State of cluster development and depth†
50.3 45 ◇
5.2.3 GERD financed by abroad, % GDP 0.7 1 ● ◆
5.2.4 Joint venture/strategic alliance deals/bn PPP$ GDP 0.2 17
5.2.5 Patent families/bn PPP$ GDP 2.3 16
5.3 Knowledge absorption 33.9 46 ◇
5.3.1 Intellectual property payments, % total trade 1.1 34
5.3.2 High-tech imports, % total trade 5.8 101 ○
5.3.3 ICT services imports, % total trade 3.1 8
5.3.4 FDI net inflows, % GDP −11.0 131 ○ ◇
5.3.5 Research talent, % in businesses 42.7 31
Knowledge and technology outputs 37.0 25
6.1 Knowledge creation 50.9 13
6.1.1 Patents by origin/bn PPP$ GDP 4.6 19
6.1.2 PCT patents by origin/bn PPP$ GDP 2.6 15
6.1.3 Utility models by origin/bn PPP$ GDP n/a n/a
6.1.4 Scientific and technical articles/bn PPP$ GDP 65.0 1 ● ◆
6.1.5 Citable documents H-index 19.8 42 ◇
6.2 Knowledge impact 28.4 69 ◇
6.2.1 Labor productivity growth, % 0.5 55
6.2.2 New businesses/th pop. 15–64 9.9 17
6.2.3 Software spending, % GDP 0.3 48
6.2.4 ISO 9001 quality certificates/bn PPP$ GDP 3.4 69
6.2.5 High-tech manufacturing, % 15.0 75 ○ ◇
6.3 Knowledge diffusion 31.8 30
6.3.1 Intellectual property receipts, % total trade 2.4 10
6.3.2 Production and export complexity n/a n/a
6.3.3 High-tech exports, % total trade 2.9 49
6.3.4 ICT services exports, % total trade 3.6 24
Creative outputs 50.7 10
7.1 Intangible assets 51.3 17
7.1.1 Trademarks by origin/bn PPP$ GDP 61.9 33
7.1.2 Global brand value, top 5,000, % GDP n/a n/a
7.1.3 Industrial designs by origin/bn PPP$ GDP 0.8 76
7.1.4 ICTs and organizational model creation†
75.5 13
7.2 Creative goods and services 27.6 29
7.2.1 Cultural and creative services exports, % total trade 0.4 54
7.2.2 National feature films/mn pop. 15–69 55.3 1 ● ◆
7.2.3 Entertainment and media market/th pop. 15–69 n/a n/a
7.2.4 Printing and other media, % manufacturing 1.3 33
7.2.5 Creative goods exports, % total trade 0.1 105 ○
7.3 Online creativity 72.5 1 ● ◆
7.3.1 Generic top-level domains (TLDs)/th pop. 15–69 100.0 1 ● ◆
7.3.2 Country-code TLDs/th pop. 15–69 94.5 5 ● ◆
7.3.3 Wikipedia edits/mn pop. 15–69 85.5 5 ● ◆
7.3.4 Mobile app creation/bn PPP$ GDP 5.0 56 ◇
Score/
Value Rank
Institutions 86.8 14
1.1 Political environment 86.0 13
1.1.1 Political and operational stability* 89.3 6
1.1.2 Government effectiveness* 84.4 15
1.2 Regulatory environment 88.2 15
1.2.1 Regulatory quality* 79.4 19
1.2.2 Rule of law* 93.3 11
1.2.3 Cost of redundancy dismissal 13.0 40
1.3 Business environment 86.3 15
1.3.1 Ease of starting a business* 90.6 54
1.3.2 Ease of resolving insolvency* 82.0 11
Human capital and research 49.7 23
2.1 Education 72.2 7 ◆
2.1.1 Expenditure on education, % GDP 7.7 4 ● ◆
2.1.2 Government funding/pupil, secondary, % GDP/cap 20.6 46
2.1.3 School life expectancy, years 19.2 7 ◆
2.1.4 PISA scales in reading, maths and science 481.4 30 ◇
2.1.5 Pupil-teacher ratio, secondary 9.4 23
2.2 Tertiary education 35.4 58
2.2.1 Tertiary enrolment, % gross 73.1 26
2.2.2 Graduates in science and engineering, % 18.6 82 ○ ◇
2.2.3 Tertiary inbound mobility, % 8.0 32
2.3 Research and development (RD) 41.6 24 ◇
2.3.1 Researchers, FTE/mn pop. 6,088.3 7
2.3.2 Gross expenditure on RD, % GDP 2.4 12
2.3.3 Global corporate RD investors, top 3, mn US$ 46.6 33
2.3.4 QS university ranking, top 3* 0.0 74 ○ ◇
Infrastructure 54.5 25
3.1 Informationandcommunicationtechnologies(ICTs) 84.7 23
3.1.1 ICT access* 92.8 4 ● ◆
3.1.2 ICT use* 89.2 4 ● ◆
3.1.3 Government’s online service* 79.4 42
3.1.4 E-participation* 77.4 51 ◇
3.2 General infrastructure 50.8 9
3.2.1 Electricity output, GWh/mn pop. 56,175.6 1 ● ◆
3.2.2 Logistics performance* 54.7 39 ◇
3.2.3 Gross capital formation, % GDP 20.9 82
3.3 Ecological sustainability 27.9 67 ◇
3.3.1 GDP/unit of energy use 3.1 123 ○ ◇
3.3.2 Environmental performance* 72.3 17
3.3.3 ISO 14001 environmental certificates/bn PPP$ GDP 1.5 57
Market sophistication 56.8 25
4.1 Credit 46.0 46
4.1.1 Ease of getting credit* 55.0 88 ○
4.1.2 Domestic credit to private sector, % GDP 90.6 29
4.1.3 Microfinance gross loans, % GDP n/a n/a
4.2 Investment 64.8 12
4.2.1 Ease of protecting minority investors* 72.0 27
4.2.2 Market capitalization, % GDP n/a n/a
4.2.3 Venture capital investors, deals/bn PPP$ GDP 0.2 14
4.2.4 Venture capital recipients, deals/bn PPP$ GDP 0.2 6
4.3 Trade, diversification, and market scale 59.7 96 ○ ◇
4.3.1 Applied tariff rate, weighted avg., % 1.5 19
4.3.2 Domestic industry diversification 75.6 88 ○ ◇
4.3.3 Domestic market scale, bn PPP$ 19.8 129 ○ ◇
NOTES: ● indicates a strength; ○ a weakness; ◆ an income group strength; ◇ an income group weakness; * an index; †
a survey question. indicates that
the
economy’s data are older than the base year; see appendices for details, including the year of the data, at http://globalinnovationindex.org. Square
brackets [ ] indicate
that the data minimum coverage (DMC) requirements were not met at the sub-pillar or pillar level.](https://image.slidesharecdn.com/e-220805033615-e8521670/75/E-INDEX-2021-pdf-112-2048.jpg)
![93
GII 2021 Economy profiles
India GII 2021 rank
46
Output rank Input rank Income Region Population (mn) GDP, PPP$ (bn) GDP per capita, PPP$ GII 2020 rank
45 57 Lower middle CSA 1,380.0 8,681.3 6,284 48
Score/
Value Rank
Business sophistication 29.2 52 ◆
5.1 Knowledge workers 26.4 83
5.1.1 Knowledge-intensive employment, % 17.0 90
5.1.2 Firms offering formal training, % 35.9 38
5.1.3 GERD performed by business, % GDP 0.2 51 ◆
5.1.4 GERD financed by business, % 36.8 51
5.1.5 Females employed w/advanced degrees, % 2.3 103 ○
5.2 Innovation linkages 24.1 50 ◆
5.2.1 University-industry RD collaboration†
42.7 65
5.2.2 State of cluster development and depth†
45.6 72
5.2.3 GERD financed by abroad, % GDP n/a n/a
5.2.4 Joint venture/strategic alliance deals/bn PPP$ GDP 0.1 35 ◆
5.2.5 Patent families/bn PPP$ GDP 0.2 49 ◆
5.3 Knowledge absorption 37.1 34 ◆
5.3.1 Intellectual property payments, % total trade 1.4 27 ◆
5.3.2 High-tech imports, % total trade 10.6 26
5.3.3 ICT services imports, % total trade 1.7 43
5.3.4 FDI net inflows, % GDP 1.6 88
5.3.5 Research talent, % in businesses 34.0 38 ◆
Knowledge and technology outputs 34.5 29 ◆
6.1 Knowledge creation 21.0 51 ◆
6.1.1 Patents by origin/bn PPP$ GDP 2.0 36 ◆
6.1.2 PCT patents by origin/bn PPP$ GDP 0.2 48 ◆
6.1.3 Utility models by origin/bn PPP$ GDP n/a n/a
6.1.4 Scientific and technical articles/bn PPP$ GDP 10.3 84
6.1.5 Citable documents H-index 40.8 21 ● ◆
6.2 Knowledge impact 33.3 51 ◆
6.2.1 Labor productivity growth, % 2.8 17 ●
6.2.2 New businesses/th pop. 15–64 0.1 115 ○
6.2.3 Software spending, % GDP 0.3 51
6.2.4 ISO 9001 quality certificates/bn PPP$ GDP 3.6 68
6.2.5 High-tech manufacturing, % 34.1 36 ◆
6.3 Knowledge diffusion 49.1 13 ● ◆
6.3.1 Intellectual property receipts, % total trade 0.1 46
6.3.2 Production and export complexity 56.3 42 ◆
6.3.3 High-tech exports, % total trade 4.0 39
6.3.4 ICT services exports, % total trade 11.7 1 ● ◆
Creative outputs 23.1 68
7.1 Intangible assets 31.9 61
7.1.1 Trademarks by origin/bn PPP$ GDP 33.8 68
7.1.2 Global brand value, top 5,000, % GDP 70.3 28 ◆
7.1.3 Industrial designs by origin/bn PPP$ GDP 1.0 72
7.1.4 ICTs and organizational model creation†
59.6 47 ◆
7.2 Creative goods and services 19.8 55 ◆
7.2.1 Cultural and creative services exports, % total trade 1.5 18 ● ◆
7.2.2 National feature films/mn pop. 15–69 2.2 63
7.2.3 Entertainment and media market/th pop. 15–69 0.9 59 ○
7.2.4 Printing and other media, % manufacturing 0.5 83 ○
7.2.5 Creative goods exports, % total trade 2.7 24 ◆
7.3 Online creativity 8.6 105
7.3.1 Generic top-level domains (TLDs)/th pop. 15–69 0.9 97
7.3.2 Country-code TLDs/th pop. 15–69 0.7 95
7.3.3 Wikipedia edits/mn pop. 15–69 23.4 117 ○
7.3.4 Mobile app creation/bn PPP$ GDP 13.3 42
Score/
Value Rank
Institutions 64.4 62 ◆
1.1 Political environment 57.7 66 ◆
1.1.1 Political and operational stability* 64.3 80
1.1.2 Government effectiveness* 54.5 60 ◆
1.2 Regulatory environment 63.6 71 ◆
1.2.1 Regulatory quality* 39.3 81
1.2.2 Rule of law* 45.9 65 ◆
1.2.3 Cost of redundancy dismissal 15.8 61
1.3 Business environment 71.8 62 ◆
1.3.1 Ease of starting a business* 81.6 105
1.3.2 Ease of resolving insolvency* 62.0 47 ◆
Human capital and research 34.1 54 ◆
2.1 Education 35.9 102
2.1.1 Expenditure on education, % GDP 3.8 74
2.1.2 Government funding/pupil, secondary, % GDP/cap 16.9 66
2.1.3 School life expectancy, years 11.5 95 ○
2.1.4 PISA scales in reading, maths and science n/a n/a
2.1.5 Pupil-teacher ratio, secondary 21.5 99 ○
2.2 Tertiary education 33.8 64 ◆
2.2.1 Tertiary enrolment, % gross 28.6 88
2.2.2 Graduates in science and engineering, % 32.2 12 ● ◆
2.2.3 Tertiary inbound mobility, % 0.1 108 ○
2.3 Research and development (RD) 32.5 35 ◆
2.3.1 Researchers, FTE/mn pop. 252.7 78
2.3.2 Gross expenditure on RD, % GDP 0.7 52 ◆
2.3.3 Global corporate RD investors, top 3, mn US$ 69.2 15 ● ◆
2.3.4 QS university ranking, top 3* 44.9 23 ● ◆
Infrastructure 36.8 81 ◆
3.1 Informationandcommunicationtechnologies(ICTs) 58.1 86
3.1.1 ICT access* 38.2 111 ○
3.1.2 ICT use* 23.2 110 ○
3.1.3 Government’s online service* 85.3 24 ◆
3.1.4 E-participation* 85.7 29 ◆
3.2 General infrastructure 32.1 52
3.2.1 Electricity output, GWh/mn pop. 1,198.1 94
3.2.2 Logistics performance* 52.4 43 ◆
3.2.3 Gross capital formation, % GDP 27.8 28
3.3 Ecological sustainability 20.3 98
3.3.1 GDP/unit of energy use 10.8 63
3.3.2 Environmental performance* 27.6 125 ○ ◇
3.3.3 ISO 14001 environmental certificates/bn PPP$ GDP 0.9 69
Market sophistication 55.5 28 ◆
4.1 Credit 43.1 56
4.1.1 Ease of getting credit* 80.0 23
4.1.2 Domestic credit to private sector, % GDP 50.2 69
4.1.3 Microfinance gross loans, % GDP 0.9 25
4.2 Investment 35.9 45
4.2.1 Ease of protecting minority investors* 80.0 13 ● ◆
4.2.2 Market capitalization, % GDP 80.2 19 ◆
4.2.3 Venture capital investors, deals/bn PPP$ GDP 0.1 38 ◆
4.2.4 Venture capital recipients, deals/bn PPP$ GDP 0.1 22 ◆
4.3 Trade, diversification, and market scale 87.7 7 ● ◆
4.3.1 Applied tariff rate, weighted avg., % 6.6 97
4.3.2 Domestic industry diversification 97.8 12 ● ◆
4.3.3 Domestic market scale, bn PPP$ 8,681.3 3 ● ◆
NOTES: ● indicates a strength; ○ a weakness; ◆ an income group strength; ◇ an income group weakness; * an index; †
a survey question. indicates that
the
economy’s data are older than the base year; see appendices for details, including the year of the data, at http://globalinnovationindex.org. Square
brackets [ ] indicate
that the data minimum coverage (DMC) requirements were not met at the sub-pillar or pillar level.](https://image.slidesharecdn.com/e-220805033615-e8521670/75/E-INDEX-2021-pdf-113-2048.jpg)
![94 Global Innovation Index 2021
Indonesia GII 2021 rank
87
Output rank Input rank Income Region Population (mn) GDP, PPP$ (bn) GDP per capita, PPP$ GII 2020 rank
84 87 Upper middle SEAO 273.5 3,328.3 12,345 85
Score/
Value Rank
Business sophistication 17.5 110 ◇
5.1 Knowledge workers 8.0 126 ○ ◇
5.1.1 Knowledge-intensive employment, % 11.3 106 ◇
5.1.2 Firms offering formal training, % 7.7 97 ○ ◇
5.1.3 GERD performed by business, % GDP 0.0 83 ○
5.1.4 GERD financed by business, % 8.0 80
5.1.5 Females employed w/advanced degrees, % 6.3 87 ◇
5.2 Innovation linkages 20.7 64
5.2.1 University-industry RD collaboration†
58.4 27 ● ◆
5.2.2 State of cluster development and depth†
61.9 23 ● ◆
5.2.3 GERD financed by abroad, % GDP 0.0 99 ○
5.2.4 Joint venture/strategic alliance deals/bn PPP$ GDP 0.0 113 ○
5.2.5 Patent families/bn PPP$ GDP 0.0 99
5.3 Knowledge absorption 23.9 73
5.3.1 Intellectual property payments, % total trade 0.9 44
5.3.2 High-tech imports, % total trade 8.9 48
5.3.3 ICT services imports, % total trade 1.6 48
5.3.4 FDI net inflows, % GDP 2.0 78
5.3.5 Research talent, % in businesses 7.5 65
Knowledge and technology outputs 18.3 74
6.1 Knowledge creation 9.5 81
6.1.1 Patents by origin/bn PPP$ GDP 0.9 65
6.1.2 PCT patents by origin/bn PPP$ GDP 0.0 96
6.1.3 Utility models by origin/bn PPP$ GDP 0.7 27
6.1.4 Scientific and technical articles/bn PPP$ GDP 1.5 128 ○ ◇
6.1.5 Citable documents H-index 14.5 56
6.2 Knowledge impact 31.8 58
6.2.1 Labor productivity growth, % 1.3 36
6.2.2 New businesses/th pop. 15–64 0.3 106
6.2.3 Software spending, % GDP 0.4 27 ● ◆
6.2.4 ISO 9001 quality certificates/bn PPP$ GDP 2.0 88
6.2.5 High-tech manufacturing, % 31.9 41
6.3 Knowledge diffusion 13.7 74
6.3.1 Intellectual property receipts, % total trade 0.0 72
6.3.2 Production and export complexity 44.2 61
6.3.3 High-tech exports, % total trade 3.1 47
6.3.4 ICT services exports, % total trade 0.6 95
Creative outputs 17.5 91
7.1 Intangible assets 24.3 88
7.1.1 Trademarks by origin/bn PPP$ GDP 12.2 106 ◇
7.1.2 Global brand value, top 5,000, % GDP 30.0 44
7.1.3 Industrial designs by origin/bn PPP$ GDP 0.5 83
7.1.4 ICTs and organizational model creation†
65.4 27 ● ◆
7.2 Creative goods and services 12.0 74
7.2.1 Cultural and creative services exports, % total trade 0.0 94
7.2.2 National feature films/mn pop. 15–69 0.6 95
7.2.3 Entertainment and media market/th pop. 15–69 3.1 50 ◇
7.2.4 Printing and other media, % manufacturing 0.9 65
7.2.5 Creative goods exports, % total trade 2.2 27 ●
7.3 Online creativity 9.3 98
7.3.1 Generic top-level domains (TLDs)/th pop. 15–69 1.5 89
7.3.2 Country-code TLDs/th pop. 15–69 0.7 94
7.3.3 Wikipedia edits/mn pop. 15–69 32.9 96 ◇
7.3.4 Mobile app creation/bn PPP$ GDP 4.5 57
Score/
Value Rank
Institutions 51.2 107 ◇
1.1 Political environment 58.5 64
1.1.1 Political and operational stability* 66.1 74
1.1.2 Government effectiveness* 54.7 59
1.2 Regulatory environment 20.4 131 ○ ◇
1.2.1 Regulatory quality* 41.1 76
1.2.2 Rule of law* 37.7 82
1.2.3 Cost of redundancy dismissal 57.8 129 ○ ◇
1.3 Business environment 74.6 52
1.3.1 Ease of starting a business* 81.2 108
1.3.2 Ease of resolving insolvency* 68.1 35
Human capital and research 22.4 91
2.1 Education 35.4 106 ◇
2.1.1 Expenditure on education, % GDP 3.6 82
2.1.2 Government funding/pupil, secondary, % GDP/cap 10.5 90 ○
2.1.3 School life expectancy, years 13.6 74
2.1.4 PISA scales in reading, maths and science 381.9 72 ○
2.1.5 Pupil-teacher ratio, secondary 15.2 74
2.2 Tertiary education 21.5 93
2.2.1 Tertiary enrolment, % gross 36.3 78
2.2.2 Graduates in science and engineering, % 19.4 76
2.2.3 Tertiary inbound mobility, % 0.1 109 ○ ◇
2.3 Research and development (RD) 10.4 57
2.3.1 Researchers, FTE/mn pop. 216.0 80
2.3.2 Gross expenditure on RD, % GDP 0.2 89
2.3.3 Global corporate RD investors, top 3, mn US$ 0.0 41 ○ ◇
2.3.4 QS university ranking, top 3* 34.9 34 ●
Infrastructure 41.4 68
3.1 Informationandcommunicationtechnologies(ICTs) 60.9 80
3.1.1 ICT access* 55.4 84
3.1.2 ICT use* 45.1 92
3.1.3 Government’s online service* 68.2 72
3.1.4 E-participation* 75.0 57
3.2 General infrastructure 36.1 36 ◆
3.2.1 Electricity output, GWh/mn pop. 1,090.5 96 ◇
3.2.2 Logistics performance* 51.2 45 ◆
3.2.3 Gross capital formation, % GDP 33.0 17 ● ◆
3.3 Ecological sustainability 27.2 69
3.3.1 GDP/unit of energy use 14.4 28 ●
3.3.2 Environmental performance* 37.8 96 ◇
3.3.3 ISO 14001 environmental certificates/bn PPP$ GDP 0.6 78
Market sophistication 48.5 57
4.1 Credit 33.6 95
4.1.1 Ease of getting credit* 70.0 44
4.1.2 Domestic credit to private sector, % GDP 37.8 84
4.1.3 Microfinance gross loans, % GDP 0.0 67
4.2 Investment 24.0 92
4.2.1 Ease of protecting minority investors* 70.0 36
4.2.2 Market capitalization, % GDP 48.2 35
4.2.3 Venture capital investors, deals/bn PPP$ GDP 0.0 65
4.2.4 Venture capital recipients, deals/bn PPP$ GDP 0.0 59
4.3 Trade, diversification, and market scale 87.8 6 ● ◆
4.3.1 Applied tariff rate, weighted avg., % 2.0 55
4.3.2 Domestic industry diversification 94.8 27 ●
4.3.3 Domestic market scale, bn PPP$ 3,328.3 7 ● ◆
NOTES: ● indicates a strength; ○ a weakness; ◆ an income group strength; ◇ an income group weakness; * an index; †
a survey question. indicates that
the
economy’s data are older than the base year; see appendices for details, including the year of the data, at http://globalinnovationindex.org. Square
brackets [ ] indicate
that the data minimum coverage (DMC) requirements were not met at the sub-pillar or pillar level.](https://image.slidesharecdn.com/e-220805033615-e8521670/75/E-INDEX-2021-pdf-114-2048.jpg)
![95
GII 2021 Economy profiles
Iran (Islamic Republic of) GII 2021 rank
60
Output rank Input rank Income Region Population (mn) GDP, PPP$ (bn) GDP per capita, PPP$ GII 2020 rank
44 86 Upper middle CSA 84.0 1,006.7 11,963 67
Score/
Value Rank
Business sophistication 16.5 115 ◇
5.1 Knowledge workers 18.1 [104]
5.1.1 Knowledge-intensive employment, % 19.8 80
5.1.2 Firms offering formal training, % n/a n/a
5.1.3 GERD performed by business, % GDP 0.2 53
5.1.4 GERD financed by business, % n/a n/a
5.1.5 Females employed w/advanced degrees, % 7.9 80
5.2 Innovation linkages 16.2 102
5.2.1 University-industry RD collaboration†
26.7 120 ○ ◇
5.2.2 State of cluster development and depth†
42.9 87
5.2.3 GERD financed by abroad, % GDP n/a n/a
5.2.4 Joint venture/strategic alliance deals/bn PPP$ GDP 0.0 127 ○ ◇
5.2.5 Patent families/bn PPP$ GDP 0.0 74
5.3 Knowledge absorption 15.1 117 ◇
5.3.1 Intellectual property payments, % total trade 0.2 97
5.3.2 High-tech imports, % total trade 3.8 119
5.3.3 ICT services imports, % total trade 0.5 107
5.3.4 FDI net inflows, % GDP 0.8 110 ◇
5.3.5 Research talent, % in businesses 19.2 55
Knowledge and technology outputs 26.9 46
6.1 Knowledge creation 50.6 14 ● ◆
6.1.1 Patents by origin/bn PPP$ GDP 11.1 7 ● ◆
6.1.2 PCT patents by origin/bn PPP$ GDP 0.3 44
6.1.3 Utility models by origin/bn PPP$ GDP n/a n/a
6.1.4 Scientific and technical articles/bn PPP$ GDP 46.2 11 ● ◆
6.1.5 Citable documents H-index 20.5 40 ●
6.2 Knowledge impact 24.9 85
6.2.1 Labor productivity growth, % −4.9 119 ○ ◇
6.2.2 New businesses/th pop. 15–64 0.4 101
6.2.3 Software spending, % GDP 0.3 38
6.2.4 ISO 9001 quality certificates/bn PPP$ GDP 2.1 87
6.2.5 High-tech manufacturing, % 38.6 28 ● ◆
6.3 Knowledge diffusion 5.2 119 ◇
6.3.1 Intellectual property receipts, % total trade 0.0 95
6.3.2 Production and export complexity 27.6 100 ◇
6.3.3 High-tech exports, % total trade 0.1 117
6.3.4 ICT services exports, % total trade 0.1 125 ○
Creative outputs 31.3 46
7.1 Intangible assets 53.8 13 ● ◆
7.1.1 Trademarks by origin/bn PPP$ GDP 418.9 1 ● ◆
7.1.2 Global brand value, top 5,000, % GDP 1.0 78
7.1.3 Industrial designs by origin/bn PPP$ GDP 16.7 4 ● ◆
7.1.4 ICTs and organizational model creation†
47.4 92
7.2 Creative goods and services 2.8 113 ◇
7.2.1 Cultural and creative services exports, % total trade 0.1 81
7.2.2 National feature films/mn pop. 15–69 1.7 73
7.2.3 Entertainment and media market/th pop. 15–69 3.0 51 ◇
7.2.4 Printing and other media, % manufacturing 0.3 98 ○ ◇
7.2.5 Creative goods exports, % total trade 0.1 106
7.3 Online creativity 14.9 75
7.3.1 Generic top-level domains (TLDs)/th pop. 15–69 1.8 80
7.3.2 Country-code TLDs/th pop. 15–69 6.2 48
7.3.3 Wikipedia edits/mn pop. 15–69 50.7 64
7.3.4 Mobile app creation/bn PPP$ GDP 0.8 75
Score/
Value Rank
Institutions 45.3 124 ◇
1.1 Political environment 41.0 114 ◇
1.1.1 Political and operational stability* 46.4 129 ○ ◇
1.1.2 Government effectiveness* 38.3 102 ◇
1.2 Regulatory environment 43.4 119 ◇
1.2.1 Regulatory quality* 6.3 130 ○ ◇
1.2.2 Rule of law* 27.0 110 ◇
1.2.3 Cost of redundancy dismissal 23.1 98
1.3 Business environment 51.4 125 ○ ◇
1.3.1 Ease of starting a business* 67.8 129 ○ ◇
1.3.2 Ease of resolving insolvency* 35.1 111 ◇
Human capital and research 37.3 49
2.1 Education 44.5 80
2.1.1 Expenditure on education, % GDP 4.0 69
2.1.2 Government funding/pupil, secondary, % GDP/cap 17.5 61
2.1.3 School life expectancy, years 14.8 58
2.1.4 PISA scales in reading, maths and science n/a n/a
2.1.5 Pupil-teacher ratio, secondary 19.0 93
2.2 Tertiary education 52.9 9 ● ◆
2.2.1 Tertiary enrolment, % gross 62.8 46
2.2.2 Graduates in science and engineering, % 40.2 3 ● ◆
2.2.3 Tertiary inbound mobility, % 0.6 94
2.3 Research and development (RD) 14.6 48
2.3.1 Researchers, FTE/mn pop. 1,474.9 44
2.3.2 Gross expenditure on RD, % GDP 0.8 45
2.3.3 Global corporate RD investors, top 3, mn US$ 0.0 41 ○ ◇
2.3.4 QS university ranking, top 3* 24.2 44
Infrastructure 40.9 70
3.1 Informationandcommunicationtechnologies(ICTs) 60.1 83
3.1.1 ICT access* 79.2 37 ● ◆
3.1.2 ICT use* 56.0 69
3.1.3 Government’s online service* 58.8 88
3.1.4 E-participation* 46.4 107 ◇
3.2 General infrastructure 41.5 25 ● ◆
3.2.1 Electricity output, GWh/mn pop. 3,787.8 56
3.2.2 Logistics performance* 37.4 63
3.2.3 Gross capital formation, % GDP 40.7 6 ● ◆
3.3 Ecological sustainability 21.2 93 ◇
3.3.1 GDP/unit of energy use 5.9 108 ◇
3.3.2 Environmental performance* 48.0 61
3.3.3 ISO 14001 environmental certificates/bn PPP$ GDP 0.7 77
Market sophistication 43.4 82
4.1 Credit 38.1 78
4.1.1 Ease of getting credit* 50.0 94 ◇
4.1.2 Domestic credit to private sector, % GDP 66.1 49
4.1.3 Microfinance gross loans, % GDP n/a n/a
4.2 Investment 24.6 [85]
4.2.1 Ease of protecting minority investors* 40.0 110 ◇
4.2.2 Market capitalization, % GDP 27.6 50
4.2.3 Venture capital investors, deals/bn PPP$ GDP n/a n/a
4.2.4 Venture capital recipients, deals/bn PPP$ GDP n/a n/a
4.3 Trade, diversification, and market scale 67.5 71
4.3.1 Applied tariff rate, weighted avg., % 15.4 130 ○ ◇
4.3.2 Domestic industry diversification 93.5 38
4.3.3 Domestic market scale, bn PPP$ 1,006.7 25 ●
NOTES: ● indicates a strength; ○ a weakness; ◆ an income group strength; ◇ an income group weakness; * an index; †
a survey question. indicates that
the
economy’s data are older than the base year; see appendices for details, including the year of the data, at http://globalinnovationindex.org. Square
brackets [ ] indicate
that the data minimum coverage (DMC) requirements were not met at the sub-pillar or pillar level.](https://image.slidesharecdn.com/e-220805033615-e8521670/75/E-INDEX-2021-pdf-115-2048.jpg)
![96 Global Innovation Index 2021
Ireland GII 2021 rank
19
Output rank Input rank Income Region Population (mn) GDP, PPP$ (bn) GDP per capita, PPP$ GII 2020 rank
19 22 High EUR 4.9 447.7 89,383 15
Score/
Value Rank
Business sophistication 51.5 17
5.1 Knowledge workers 55.8 22
5.1.1 Knowledge-intensive employment, % 43.8 20
5.1.2 Firms offering formal training, % n/a n/a
5.1.3 GERD performed by business, % GDP 0.9 23
5.1.4 GERD financed by business, % 51.7 26
5.1.5 Females employed w/advanced degrees, % 26.2 9 ●
5.2 Innovation linkages 42.0 22
5.2.1 University-industry RD collaboration†
64.8 15
5.2.2 State of cluster development and depth†
57.3 31
5.2.3 GERD financed by abroad, % GDP 0.3 11
5.2.4 Joint venture/strategic alliance deals/bn PPP$ GDP 0.1 21
5.2.5 Patent families/bn PPP$ GDP 2.0 22
5.3 Knowledge absorption 56.7 5 ●
5.3.1 Intellectual property payments, % total trade 20.6 1 ● ◆
5.3.2 High-tech imports, % total trade 7.9 60
5.3.3 ICT services imports, % total trade 1.2 61 ○
5.3.4 FDI net inflows, % GDP 7.7 12 ●
5.3.5 Research talent, % in businesses 50.0 24
Knowledge and technology outputs 47.6 15
6.1 Knowledge creation 23.3 43 ◇
6.1.1 Patents by origin/bn PPP$ GDP 2.1 35 ◇
6.1.2 PCT patents by origin/bn PPP$ GDP 1.8 21
6.1.3 Utility models by origin/bn PPP$ GDP 0.2 48 ○
6.1.4 Scientific and technical articles/bn PPP$ GDP 21.4 41 ◇
6.1.5 Citable documents H-index 34.9 27
6.2 Knowledge impact 46.8 10 ●
6.2.1 Labor productivity growth, % −1.3 92 ○
6.2.2 New businesses/th pop. 15–64 7.1 23
6.2.3 Software spending, % GDP 0.6 3 ●
6.2.4 ISO 9001 quality certificates/bn PPP$ GDP 5.7 50
6.2.5 High-tech manufacturing, % 58.5 6 ●
6.3 Knowledge diffusion 72.6 1 ● ◆
6.3.1 Intellectual property receipts, % total trade 2.9 7 ● ◆
6.3.2 Production and export complexity 75.3 17
6.3.3 High-tech exports, % total trade 8.5 20
6.3.4 ICT services exports, % total trade 27.3 1 ● ◆
Creative outputs 36.7 29 ◇
7.1 Intangible assets 37.2 46 ◇
7.1.1 Trademarks by origin/bn PPP$ GDP n/a n/a
7.1.2 Global brand value, top 5,000, % GDP 59.3 32
7.1.3 Industrial designs by origin/bn PPP$ GDP 1.2 63 ○
7.1.4 ICTs and organizational model creation†
70.8 20
7.2 Creative goods and services 22.2 44 ◇
7.2.1 Cultural and creative services exports, % total trade 0.5 51
7.2.2 National feature films/mn pop. 15–69 8.9 23
7.2.3 Entertainment and media market/th pop. 15–69 52.1 14
7.2.4 Printing and other media, % manufacturing 0.4 95 ○
7.2.5 Creative goods exports, % total trade 1.4 38
7.3 Online creativity 50.0 22
7.3.1 Generic top-level domains (TLDs)/th pop. 15–69 58.8 12 ●
7.3.2 Country-code TLDs/th pop. 15–69 27.0 25
7.3.3 Wikipedia edits/mn pop. 15–69 75.9 20
7.3.4 Mobile app creation/bn PPP$ GDP 34.9 13
Score/
Value Rank
Institutions 84.3 18
1.1 Political environment 80.1 20
1.1.1 Political and operational stability* 82.1 24
1.1.2 Government effectiveness* 79.1 24
1.2 Regulatory environment 85.9 18
1.2.1 Regulatory quality* 85.4 14
1.2.2 Rule of law* 83.5 20
1.2.3 Cost of redundancy dismissal 14.3 54
1.3 Business environment 86.8 13
1.3.1 Ease of starting a business* 94.4 21
1.3.2 Ease of resolving insolvency* 79.2 18
Human capital and research 48.5 27
2.1 Education 49.2 69 ○ ◇
2.1.1 Expenditure on education, % GDP 3.5 86 ○ ◇
2.1.2 Government funding/pupil, secondary, % GDP/cap 11.0 89 ○ ◇
2.1.3 School life expectancy, years 19.8 2 ● ◆
2.1.4 PISA scales in reading, maths and science 504.6 10
2.1.5 Pupil-teacher ratio, secondary n/a n/a
2.2 Tertiary education 43.7 27
2.2.1 Tertiary enrolment, % gross 77.3 23
2.2.2 Graduates in science and engineering, % 24.1 45
2.2.3 Tertiary inbound mobility, % 9.6 23
2.3 Research and development (RD) 52.5 20
2.3.1 Researchers, FTE/mn pop. 5,282.4 15
2.3.2 Gross expenditure on RD, % GDP 1.2 32 ◇
2.3.3 Global corporate RD investors, top 3, mn US$ 75.0 12 ●
2.3.4 QS university ranking, top 3* 47.5 22
Infrastructure 62.1 4 ● ◆
3.1 Informationandcommunicationtechnologies(ICTs) 81.1 28
3.1.1 ICT access* 83.3 24
3.1.2 ICT use* 78.1 27
3.1.3 Government’s online service* 77.1 47 ◇
3.1.4 E-participation* 85.7 29
3.2 General infrastructure 44.8 19
3.2.1 Electricity output, GWh/mn pop. 6,226.4 33
3.2.2 Logistics performance* 67.9 28 ◇
3.2.3 Gross capital formation, % GDP 32.9 18 ◆
3.3 Ecological sustainability 60.4 1 ● ◆
3.3.1 GDP/unit of energy use 30.8 2 ● ◆
3.3.2 Environmental performance* 72.8 16
3.3.3 ISO 14001 environmental certificates/bn PPP$ GDP 2.2 37
Market sophistication 49.7 48 ◇
4.1 Credit 41.8 62 ○ ◇
4.1.1 Ease of getting credit* 70.0 44
4.1.2 Domestic credit to private sector, % GDP 37.0 85 ○ ◇
4.1.3 Microfinance gross loans, % GDP n/a n/a
4.2 Investment 43.7 27
4.2.1 Ease of protecting minority investors* 80.0 13 ◆
4.2.2 Market capitalization, % GDP 37.4 39 ○ ◇
4.2.3 Venture capital investors, deals/bn PPP$ GDP 0.2 15
4.2.4 Venture capital recipients, deals/bn PPP$ GDP 0.1 13
4.3 Trade, diversification, and market scale 63.5 81 ○ ◇
4.3.1 Applied tariff rate, weighted avg., % 1.8 25
4.3.2 Domestic industry diversification 53.6 106 ○ ◇
4.3.3 Domestic market scale, bn PPP$ 447.7 44
NOTES: ● indicates a strength; ○ a weakness; ◆ an income group strength; ◇ an income group weakness; * an index; †
a survey question. indicates that
the
economy’s data are older than the base year; see appendices for details, including the year of the data, at http://globalinnovationindex.org. Square
brackets [ ] indicate
that the data minimum coverage (DMC) requirements were not met at the sub-pillar or pillar level.](https://image.slidesharecdn.com/e-220805033615-e8521670/75/E-INDEX-2021-pdf-116-2048.jpg)
![97
GII 2021 Economy profiles
Israel GII 2021 rank
15
Output rank Input rank Income Region Population (mn) GDP, PPP$ (bn) GDP per capita, PPP$ GII 2020 rank
12 18 High NAWA 8.7 361.0 39,126 13
Score/
Value Rank
Business sophistication 58.7 8
5.1 Knowledge workers 61.2 15
5.1.1 Knowledge-intensive employment, % 48.4 12
5.1.2 Firms offering formal training, % 18.6 81 ○ ◇
5.1.3 GERD performed by business, % GDP 4.4 1 ● ◆
5.1.4 GERD financed by business, % 36.6 52 ◇
5.1.5 Females employed w/advanced degrees, % 22.4 25
5.2 Innovation linkages 82.1 1 ● ◆
5.2.1 University-industry RD collaboration†
79.2 1 ● ◆
5.2.2 State of cluster development and depth†
56.9 32
5.2.3 GERD financed by abroad, % GDP 2.5 1 ● ◆
5.2.4 Joint venture/strategic alliance deals/bn PPP$ GDP 0.3 3 ● ◆
5.2.5 Patent families/bn PPP$ GDP 5.3 8 ◆
5.3 Knowledge absorption 33.0 48 ◇
5.3.1 Intellectual property payments, % total trade 0.6 64 ○
5.3.2 High-tech imports, % total trade 10.9 22
5.3.3 ICT services imports, % total trade 2.2 28
5.3.4 FDI net inflows, % GDP 5.1 20
5.3.5 Research talent, % in businesses n/a n/a
Knowledge and technology outputs 55.9 6
6.1 Knowledge creation 53.8 12
6.1.1 Patents by origin/bn PPP$ GDP 3.6 23
6.1.2 PCT patents by origin/bn PPP$ GDP 5.4 1 ● ◆
6.1.3 Utility models by origin/bn PPP$ GDP n/a n/a
6.1.4 Scientific and technical articles/bn PPP$ GDP 41.6 15
6.1.5 Citable documents H-index 47.4 16
6.2 Knowledge impact 42.2 21
6.2.1 Labor productivity growth, % 1.0 45
6.2.2 New businesses/th pop. 15–64 3.3 42
6.2.3 Software spending, % GDP 0.2 56
6.2.4 ISO 9001 quality certificates/bn PPP$ GDP 21.7 7 ◆
6.2.5 High-tech manufacturing, % 33.0 37
6.3 Knowledge diffusion 71.8 2 ● ◆
6.3.1 Intellectual property receipts, % total trade 2.1 12
6.3.2 Production and export complexity 71.7 20
6.3.3 High-tech exports, % total trade 11.4 14
6.3.4 ICT services exports, % total trade 15.3 1 ● ◆
Creative outputs 36.3 30 ◇
7.1 Intangible assets 27.5 75 ○ ◇
7.1.1 Trademarks by origin/bn PPP$ GDP 11.3 109 ○ ◇
7.1.2 Global brand value, top 5,000, % GDP 19.9 49 ◇
7.1.3 Industrial designs by origin/bn PPP$ GDP 2.2 46
7.1.4 ICTs and organizational model creation†
77.0 12
7.2 Creative goods and services 31.2 23
7.2.1 Cultural and creative services exports, % total trade 2.9 5 ● ◆
7.2.2 National feature films/mn pop. 15–69 5.3 41
7.2.3 Entertainment and media market/th pop. 15–69 35.6 22 ◇
7.2.4 Printing and other media, % manufacturing 1.2 38
7.2.5 Creative goods exports, % total trade 1.4 37
7.3 Online creativity 59.0 9
7.3.1 Generic top-level domains (TLDs)/th pop. 15–69 21.9 26
7.3.2 Country-code TLDs/th pop. 15–69 14.3 34 ◇
7.3.3 Wikipedia edits/mn pop. 15–69 93.9 1 ● ◆
7.3.4 Mobile app creation/bn PPP$ GDP 100.0 1 ● ◆
Score/
Value Rank
Institutions 76.2 34 ◇
1.1 Political environment 76.6 28 ◇
1.1.1 Political and operational stability* 69.6 60 ○ ◇
1.1.2 Government effectiveness* 80.1 22
1.2 Regulatory environment 68.6 53 ◇
1.2.1 Regulatory quality* 77.0 23
1.2.2 Rule of law* 74.3 27 ◇
1.2.3 Cost of redundancy dismissal 27.4 114 ○ ◇
1.3 Business environment 83.4 24
1.3.1 Ease of starting a business* 94.1 26
1.3.2 Ease of resolving insolvency* 72.7 27
Human capital and research 51.6 19
2.1 Education 58.1 38
2.1.1 Expenditure on education, % GDP 6.1 14
2.1.2 Government funding/pupil, secondary, % GDP/cap 19.4 50
2.1.3 School life expectancy, years 16.1 34
2.1.4 PISA scales in reading, maths and science 465.2 39 ◇
2.1.5 Pupil-teacher ratio, secondary 14.4 68 ○ ◇
2.2 Tertiary education 28.6 77 ○ ◇
2.2.1 Tertiary enrolment, % gross 61.5 47
2.2.2 Graduates in science and engineering, % 18.1 85 ○ ◇
2.2.3 Tertiary inbound mobility, % 2.8 70 ○ ◇
2.3 Research and development (RD) 68.0 8
2.3.1 Researchers, FTE/mn pop. n/a n/a
2.3.2 Gross expenditure on RD, % GDP 4.9 1 ● ◆
2.3.3 Global corporate RD investors, top 3, mn US$ 64.2 20
2.3.4 QS university ranking, top 3* 39.9 32
Infrastructure 50.2 40 ◇
3.1 Informationandcommunicationtechnologies(ICTs) 76.6 45 ◇
3.1.1 ICT access* 81.6 27
3.1.2 ICT use* 78.4 25
3.1.3 Government’s online service* 74.7 55 ◇
3.1.4 E-participation* 71.4 66 ○ ◇
3.2 General infrastructure 33.7 45 ◇
3.2.1 Electricity output, GWh/mn pop. 7,757.5 25
3.2.2 Logistics performance* 58.5 36 ◇
3.2.3 Gross capital formation, % GDP 20.7 84 ○
3.3 Ecological sustainability 40.3 35
3.3.1 GDP/unit of energy use 15.0 22
3.3.2 Environmental performance* 65.8 29
3.3.3 ISO 14001 environmental certificates/bn PPP$ GDP 2.1 38
Market sophistication 66.8 8
4.1 Credit 48.0 39
4.1.1 Ease of getting credit* 70.0 44
4.1.2 Domestic credit to private sector, % GDP 65.4 50 ◇
4.1.3 Microfinance gross loans, % GDP n/a n/a
4.2 Investment 74.4 7 ◆
4.2.1 Ease of protecting minority investors* 78.0 18
4.2.2 Market capitalization, % GDP 58.7 26
4.2.3 Venture capital investors, deals/bn PPP$ GDP 0.6 1 ● ◆
4.2.4 Venture capital recipients, deals/bn PPP$ GDP 0.5 1 ● ◆
4.3 Trade, diversification, and market scale 77.9 36
4.3.1 Applied tariff rate, weighted avg., % 1.8 53
4.3.2 Domestic industry diversification 91.7 46
4.3.3 Domestic market scale, bn PPP$ 361.0 48
NOTES: ● indicates a strength; ○ a weakness; ◆ an income group strength; ◇ an income group weakness; * an index; †
a survey question. indicates that
the
economy’s data are older than the base year; see appendices for details, including the year of the data, at http://globalinnovationindex.org. Square
brackets [ ] indicate
that the data minimum coverage (DMC) requirements were not met at the sub-pillar or pillar level.](https://image.slidesharecdn.com/e-220805033615-e8521670/75/E-INDEX-2021-pdf-117-2048.jpg)
![98 Global Innovation Index 2021
Italy GII 2021 rank
29
Output rank Input rank Income Region Population (mn) GDP, PPP$ (bn) GDP per capita, PPP$ GII 2020 rank
25 33 High EUR 60.5 2,415.4 40,066 28
Score/
Value Rank
Business sophistication 36.7 32
5.1 Knowledge workers 38.9 44
5.1.1 Knowledge-intensive employment, % 36.5 34
5.1.2 Firms offering formal training, % 12.6 93 ○ ◇
5.1.3 GERD performed by business, % GDP 0.9 24
5.1.4 GERD financed by business, % 54.5 20
5.1.5 Females employed w/advanced degrees, % 13.2 54
5.2 Innovation linkages 35.4 27
5.2.1 University-industry RD collaboration†
51.2 38
5.2.2 State of cluster development and depth†
73.5 2 ● ◆
5.2.3 GERD financed by abroad, % GDP 0.1 31
5.2.4 Joint venture/strategic alliance deals/bn PPP$ GDP 0.0 55
5.2.5 Patent families/bn PPP$ GDP 1.7 24
5.3 Knowledge absorption 35.8 38
5.3.1 Intellectual property payments, % total trade 0.8 49
5.3.2 High-tech imports, % total trade 7.5 69
5.3.3 ICT services imports, % total trade 2.0 34
5.3.4 FDI net inflows, % GDP 1.4 96 ○
5.3.5 Research talent, % in businesses 48.6 27
Knowledge and technology outputs 41.7 18
6.1 Knowledge creation 41.8 21
6.1.1 Patents by origin/bn PPP$ GDP 5.1 18
6.1.2 PCT patents by origin/bn PPP$ GDP 1.4 24
6.1.3 Utility models by origin/bn PPP$ GDP 0.7 31
6.1.4 Scientific and technical articles/bn PPP$ GDP 33.0 27
6.1.5 Citable documents H-index 68.6 8 ● ◆
6.2 Knowledge impact 54.0 3 ● ◆
6.2.1 Labor productivity growth, % −2.4 106 ○ ◇
6.2.2 New businesses/th pop. 15–64 3.0 49
6.2.3 Software spending, % GDP 0.5 12 ●
6.2.4 ISO 9001 quality certificates/bn PPP$ GDP 35.9 2 ● ◆
6.2.5 High-tech manufacturing, % 40.9 24
6.3 Knowledge diffusion 29.3 38
6.3.1 Intellectual property receipts, % total trade 0.8 23
6.3.2 Production and export complexity 77.2 14 ●
6.3.3 High-tech exports, % total trade 6.0 31
6.3.4 ICT services exports, % total trade 1.5 68
Creative outputs 35.8 34
7.1 Intangible assets 45.2 28
7.1.1 Trademarks by origin/bn PPP$ GDP 44.6 52
7.1.2 Global brand value, top 5,000, % GDP 90.2 22
7.1.3 Industrial designs by origin/bn PPP$ GDP 15.8 6 ● ◆
7.1.4 ICTs and organizational model creation†
54.6 61 ◇
7.2 Creative goods and services 20.8 48
7.2.1 Cultural and creative services exports, % total trade 0.4 52
7.2.2 National feature films/mn pop. 15–69 4.1 48
7.2.3 Entertainment and media market/th pop. 15–69 28.4 24
7.2.4 Printing and other media, % manufacturing 1.1 48
7.2.5 Creative goods exports, % total trade 2.3 26
7.3 Online creativity 32.0 34
7.3.1 Generic top-level domains (TLDs)/th pop. 15–69 23.1 25
7.3.2 Country-code TLDs/th pop. 15–69 23.9 28
7.3.3 Wikipedia edits/mn pop. 15–69 74.6 24
7.3.4 Mobile app creation/bn PPP$ GDP 3.1 65 ○
Score/
Value Rank
Institutions 75.5 36
1.1 Political environment 63.8 48 ◇
1.1.1 Political and operational stability* 69.6 60 ◇
1.1.2 Government effectiveness* 60.9 46 ◇
1.2 Regulatory environment 80.6 31
1.2.1 Regulatory quality* 68.5 39
1.2.2 Rule of law* 54.1 52 ◇
1.2.3 Cost of redundancy dismissal 8.0 1 ● ◆
1.3 Business environment 82.1 27
1.3.1 Ease of starting a business* 86.8 76 ○ ◇
1.3.2 Ease of resolving insolvency* 77.5 20
Human capital and research 46.0 31
2.1 Education 54.8 50
2.1.1 Expenditure on education, % GDP 4.0 67 ○
2.1.2 Government funding/pupil, secondary, % GDP/cap 22.9 28
2.1.3 School life expectancy, years 16.2 33
2.1.4 PISA scales in reading, maths and science 477.0 34
2.1.5 Pupil-teacher ratio, secondary 10.1 30
2.2 Tertiary education 37.9 49
2.2.1 Tertiary enrolment, % gross 64.3 42
2.2.2 Graduates in science and engineering, % 24.2 44
2.2.3 Tertiary inbound mobility, % 5.6 40
2.3 Research and development (RD) 45.4 22
2.3.1 Researchers, FTE/mn pop. 2,652.7 34
2.3.2 Gross expenditure on RD, % GDP 1.4 25
2.3.3 Global corporate RD investors, top 3, mn US$ 72.1 13 ●
2.3.4 QS university ranking, top 3* 48.9 19
Infrastructure 54.2 26
3.1 Informationandcommunicationtechnologies(ICTs) 78.3 38
3.1.1 ICT access* 76.4 44
3.1.2 ICT use* 71.6 44
3.1.3 Government’s online service* 82.9 36
3.1.4 E-participation* 82.1 41
3.2 General infrastructure 32.3 51
3.2.1 Electricity output, GWh/mn pop. 4,763.4 49
3.2.2 Logistics performance* 78.6 19
3.2.3 Gross capital formation, % GDP 16.3 108 ○ ◇
3.3 Ecological sustainability 52.0 7 ● ◆
3.3.1 GDP/unit of energy use 15.8 18
3.3.2 Environmental performance* 71.0 20
3.3.3 ISO 14001 environmental certificates/bn PPP$ GDP 6.5 14 ● ◆
Market sophistication 50.7 43
4.1 Credit 37.4 80 ○
4.1.1 Ease of getting credit* 45.0 101 ○ ◇
4.1.2 Domestic credit to private sector, % GDP 74.3 43
4.1.3 Microfinance gross loans, % GDP n/a n/a
4.2 Investment 26.2 79 ○
4.2.1 Ease of protecting minority investors* 66.0 50
4.2.2 Market capitalization, % GDP n/a n/a
4.2.3 Venture capital investors, deals/bn PPP$ GDP 0.0 54 ○
4.2.4 Venture capital recipients, deals/bn PPP$ GDP 0.0 56 ○
4.3 Trade, diversification, and market scale 88.6 4 ● ◆
4.3.1 Applied tariff rate, weighted avg., % 1.8 25
4.3.2 Domestic industry diversification 99.4 3 ●
4.3.3 Domestic market scale, bn PPP$ 2,415.4 12 ● ◆
NOTES: ● indicates a strength; ○ a weakness; ◆ an income group strength; ◇ an income group weakness; * an index; †
a survey question. indicates that
the
economy’s data are older than the base year; see appendices for details, including the year of the data, at http://globalinnovationindex.org. Square
brackets [ ] indicate
that the data minimum coverage (DMC) requirements were not met at the sub-pillar or pillar level.](https://image.slidesharecdn.com/e-220805033615-e8521670/75/E-INDEX-2021-pdf-118-2048.jpg)
![99
GII 2021 Economy profiles
Jamaica GII 2021 rank
74
Output rank Input rank Income Region Population (mn) GDP, PPP$ (bn) GDP per capita, PPP$ GII 2020 rank
66 82 Upper middle LCN 3.0 27.9 10,221 72
Score/
Value Rank
Business sophistication 26.0 58
5.1 Knowledge workers 29.6 [70]
5.1.1 Knowledge-intensive employment, % 21.6 74
5.1.2 Firms offering formal training, % 25.9 61
5.1.3 GERD performed by business, % GDP n/a n/a
5.1.4 GERD financed by business, % n/a n/a
5.1.5 Females employed w/advanced degrees, % n/a n/a
5.2 Innovation linkages 26.7 41 ◆
5.2.1 University-industry RD collaboration†
44.8 55
5.2.2 State of cluster development and depth†
46.5 64
5.2.3 GERD financed by abroad, % GDP n/a n/a
5.2.4 Joint venture/strategic alliance deals/bn PPP$ GDP 0.1 24 ● ◆
5.2.5 Patent families/bn PPP$ GDP 0.0 100 ○ ◇
5.3 Knowledge absorption 21.7 81
5.3.1 Intellectual property payments, % total trade 0.8 57
5.3.2 High-tech imports, % total trade 4.2 115 ○
5.3.3 ICT services imports, % total trade 1.2 64
5.3.4 FDI net inflows, % GDP 5.0 21 ●
5.3.5 Research talent, % in businesses n/a n/a
Knowledge and technology outputs 13.5 95
6.1 Knowledge creation 5.9 [103]
6.1.1 Patents by origin/bn PPP$ GDP 0.5 81
6.1.2 PCT patents by origin/bn PPP$ GDP n/a n/a
6.1.3 Utility models by origin/bn PPP$ GDP n/a n/a
6.1.4 Scientific and technical articles/bn PPP$ GDP 6.2 105
6.1.5 Citable documents H-index 5.2 103
6.2 Knowledge impact 23.2 89
6.2.1 Labor productivity growth, % −2.8 111 ○
6.2.2 New businesses/th pop. 15–64 1.6 64
6.2.3 Software spending, % GDP 0.4 23 ● ◆
6.2.4 ISO 9001 quality certificates/bn PPP$ GDP 1.4 101
6.2.5 High-tech manufacturing, % n/a n/a
6.3 Knowledge diffusion 11.4 89
6.3.1 Intellectual property receipts, % total trade 0.1 64
6.3.2 Production and export complexity 30.5 91
6.3.3 High-tech exports, % total trade 0.2 111 ○
6.3.4 ICT services exports, % total trade 2.0 55
Creative outputs 29.6 51
7.1 Intangible assets 50.1 20 ● ◆
7.1.1 Trademarks by origin/bn PPP$ GDP 97.6 9 ● ◆
7.1.2 Global brand value, top 5,000, % GDP 67.6 29 ◆
7.1.3 Industrial designs by origin/bn PPP$ GDP 6.8 21 ●
7.1.4 ICTs and organizational model creation†
55.2 60
7.2 Creative goods and services 1.4 [124]
7.2.1 Cultural and creative services exports, % total trade 0.1 92
7.2.2 National feature films/mn pop. 15–69 n/a n/a
7.2.3 Entertainment and media market/th pop. 15–69 n/a n/a
7.2.4 Printing and other media, % manufacturing n/a n/a
7.2.5 Creative goods exports, % total trade 0.1 96
7.3 Online creativity 16.9 68
7.3.1 Generic top-level domains (TLDs)/th pop. 15–69 1.8 81
7.3.2 Country-code TLDs/th pop. 15–69 1.0 85
7.3.3 Wikipedia edits/mn pop. 15–69 48.2 69
7.3.4 Mobile app creation/bn PPP$ GDP n/a n/a
Score/
Value Rank
Institutions 71.6 43 ◆
1.1 Political environment 65.5 46 ◆
1.1.1 Political and operational stability* 73.2 44
1.1.2 Government effectiveness* 61.7 44 ◆
1.2 Regulatory environment 65.7 63
1.2.1 Regulatory quality* 47.9 60
1.2.2 Rule of law* 38.5 79
1.2.3 Cost of redundancy dismissal 14.0 52
1.3 Business environment 83.7 23 ● ◆
1.3.1 Ease of starting a business* 97.4 6 ● ◆
1.3.2 Ease of resolving insolvency* 70.1 32 ● ◆
Human capital and research 25.0 [86]
2.1 Education 56.5 [45]
2.1.1 Expenditure on education, % GDP 5.2 33
2.1.2 Government funding/pupil, secondary, % GDP/cap 28.6 10 ● ◆
2.1.3 School life expectancy, years n/a n/a
2.1.4 PISA scales in reading, maths and science n/a n/a
2.1.5 Pupil-teacher ratio, secondary 15.7 77
2.2 Tertiary education 18.5 [100]
2.2.1 Tertiary enrolment, % gross 27.1 89 ◇
2.2.2 Graduates in science and engineering, % n/a n/a
2.2.3 Tertiary inbound mobility, % n/a n/a
2.3 Research and development (RD) 0.0 [123]
2.3.1 Researchers, FTE/mn pop. n/a n/a
2.3.2 Gross expenditure on RD, % GDP n/a n/a
2.3.3 Global corporate RD investors, top 3, mn US$ 0.0 41 ○ ◇
2.3.4 QS university ranking, top 3* 0.0 74 ○ ◇
Infrastructure 29.9 104 ◇
3.1 Informationandcommunicationtechnologies(ICTs) 43.6 102 ◇
3.1.1 ICT access* 56.0 83
3.1.2 ICT use* 42.8 96 ◇
3.1.3 Government’s online service* 38.8 118 ○ ◇
3.1.4 E-participation* 36.9 116 ○ ◇
3.2 General infrastructure 19.2 113 ○
3.2.1 Electricity output, GWh/mn pop. 1,499.8 91 ◇
3.2.2 Logistics performance* 21.9 106 ○ ◇
3.2.3 Gross capital formation, % GDP 21.2 78
3.3 Ecological sustainability 27.0 72
3.3.1 GDP/unit of energy use 9.2 79
3.3.2 Environmental performance* 48.2 60
3.3.3 ISO 14001 environmental certificates/bn PPP$ GDP 1.7 52
Market sophistication 36.0 116 ○ ◇
4.1 Credit 40.9 65
4.1.1 Ease of getting credit* 85.0 14 ●
4.1.2 Domestic credit to private sector, % GDP 41.3 81
4.1.3 Microfinance gross loans, % GDP 0.2 52
4.2 Investment 32.8 57
4.2.1 Ease of protecting minority investors* 62.0 60
4.2.2 Market capitalization, % GDP 95.8 13 ●
4.2.3 Venture capital investors, deals/bn PPP$ GDP 0.1 27 ◆
4.2.4 Venture capital recipients, deals/bn PPP$ GDP 0.0 38
4.3 Trade, diversification, and market scale 34.4 129 ○ ◇
4.3.1 Applied tariff rate, weighted avg., % 10.8 120 ○ ◇
4.3.2 Domestic industry diversification n/a n/a
4.3.3 Domestic market scale, bn PPP$ 27.9 124 ○ ◇
NOTES: ● indicates a strength; ○ a weakness; ◆ an income group strength; ◇ an income group weakness; * an index; †
a survey question. indicates that
the
economy’s data are older than the base year; see appendices for details, including the year of the data, at http://globalinnovationindex.org. Square
brackets [ ] indicate
that the data minimum coverage (DMC) requirements were not met at the sub-pillar or pillar level.](https://image.slidesharecdn.com/e-220805033615-e8521670/75/E-INDEX-2021-pdf-119-2048.jpg)
![100 Global Innovation Index 2021
Japan GII 2021 rank
13
Output rank Input rank Income Region Population (mn) GDP, PPP$ (bn) GDP per capita, PPP$ GII 2020 rank
14 11 High SEAO 126.5 5,236.1 41,637 16
Score/
Value Rank
Business sophistication 57.3 10
5.1 Knowledge workers 65.2 11
5.1.1 Knowledge-intensive employment, % 25.2 59 ◇
5.1.2 Firms offering formal training, % n/a n/a
5.1.3 GERD performed by business, % GDP 2.6 3 ●
5.1.4 GERD financed by business, % 78.9 2 ● ◆
5.1.5 Females employed w/advanced degrees, % 22.4 24
5.2 Innovation linkages 46.4 18
5.2.1 University-industry RD collaboration†
60.1 22
5.2.2 State of cluster development and depth†
63.2 18
5.2.3 GERD financed by abroad, % GDP 0.0 68 ○ ◇
5.2.4 Joint venture/strategic alliance deals/bn PPP$ GDP 0.0 40 ◇
5.2.5 Patent families/bn PPP$ GDP 14.1 1 ● ◆
5.3 Knowledge absorption 60.3 3 ● ◆
5.3.1 Intellectual property payments, % total trade 2.6 10
5.3.2 High-tech imports, % total trade 13.9 16
5.3.3 ICT services imports, % total trade 2.2 27
5.3.4 FDI net inflows, % GDP 0.5 118 ○
5.3.5 Research talent, % in businesses 74.4 3 ● ◆
Knowledge and technology outputs 48.3 11
6.1 Knowledge creation 58.3 11
6.1.1 Patents by origin/bn PPP$ GDP 45.0 1 ● ◆
6.1.2 PCT patents by origin/bn PPP$ GDP 9.6 1 ● ◆
6.1.3 Utility models by origin/bn PPP$ GDP 0.7 30
6.1.4 Scientific and technical articles/bn PPP$ GDP 16.8 50 ◇
6.1.5 Citable documents H-index 69.0 6
6.2 Knowledge impact 35.1 43
6.2.1 Labor productivity growth, % −2.0 102 ○ ◇
6.2.2 New businesses/th pop. 15–64 0.4 103 ○ ◇
6.2.3 Software spending, % GDP 0.3 46
6.2.4 ISO 9001 quality certificates/bn PPP$ GDP 6.1 46
6.2.5 High-tech manufacturing, % 55.1 9
6.3 Knowledge diffusion 51.5 11
6.3.1 Intellectual property receipts, % total trade 5.0 1 ● ◆
6.3.2 Production and export complexity 100.0 1 ● ◆
6.3.3 High-tech exports, % total trade 11.6 13
6.3.4 ICT services exports, % total trade 0.8 89 ○
Creative outputs 42.1 18
7.1 Intangible assets 56.9 9
7.1.1 Trademarks by origin/bn PPP$ GDP 86.5 15 ◆
7.1.2 Global brand value, top 5,000, % GDP 150.9 11
7.1.3 Industrial designs by origin/bn PPP$ GDP 4.2 28
7.1.4 ICTs and organizational model creation†
67.8 22
7.2 Creative goods and services 29.6 25
7.2.1 Cultural and creative services exports, % total trade 0.4 58
7.2.2 National feature films/mn pop. 15–69 6.9 31
7.2.3 Entertainment and media market/th pop. 15–69 71.5 5
7.2.4 Printing and other media, % manufacturing 1.7 23
7.2.5 Creative goods exports, % total trade 1.8 33
7.3 Online creativity 24.9 46 ◇
7.3.1 Generic top-level domains (TLDs)/th pop. 15–69 15.5 31 ◇
7.3.2 Country-code TLDs/th pop. 15–69 5.8 50 ◇
7.3.3 Wikipedia edits/mn pop. 15–69 63.5 46 ◇
7.3.4 Mobile app creation/bn PPP$ GDP 12.8 43
Score/
Value Rank
Institutions 88.8 7
1.1 Political environment 87.0 11
1.1.1 Political and operational stability* 89.3 6
1.1.2 Government effectiveness* 85.9 12
1.2 Regulatory environment 91.4 11
1.2.1 Regulatory quality* 78.2 21
1.2.2 Rule of law* 87.2 17
1.2.3 Cost of redundancy dismissal 8.0 1 ● ◆
1.3 Business environment 88.2 9
1.3.1 Ease of starting a business* 86.1 82 ○ ◇
1.3.2 Ease of resolving insolvency* 90.2 3 ● ◆
Human capital and research 50.8 20
2.1 Education 54.1 [53]
2.1.1 Expenditure on education, % GDP 3.2 91 ○ ◇
2.1.2 Government funding/pupil, secondary, % GDP/cap n/a n/a
2.1.3 School life expectancy, years n/a n/a
2.1.4 PISA scales in reading, maths and science 520.0 5
2.1.5 Pupil-teacher ratio, secondary 11.0 38
2.2 Tertiary education 24.1 87 ○ ◇
2.2.1 Tertiary enrolment, % gross n/a n/a
2.2.2 Graduates in science and engineering, % 19.7 74 ○
2.2.3 Tertiary inbound mobility, % 4.7 49
2.3 Research and development (RD) 74.3 4 ●
2.3.1 Researchers, FTE/mn pop. 5,374.6 14
2.3.2 Gross expenditure on RD, % GDP 3.2 4 ●
2.3.3 Global corporate RD investors, top 3, mn US$ 90.0 5 ●
2.3.4 QS university ranking, top 3* 77.6 8
Infrastructure 59.8 9
3.1 Informationandcommunicationtechnologies(ICTs) 90.1 8
3.1.1 ICT access* 88.5 9
3.1.2 ICT use* 82.4 16
3.1.3 Government’s online service* 90.6 12
3.1.4 E-participation* 98.8 4 ●
3.2 General infrastructure 46.0 16
3.2.1 Electricity output, GWh/mn pop. 8,307.1 19
3.2.2 Logistics performance* 91.8 5
3.2.3 Gross capital formation, % GDP 24.9 47
3.3 Ecological sustainability 43.2 28
3.3.1 GDP/unit of energy use 12.7 40
3.3.2 Environmental performance* 75.1 12
3.3.3 ISO 14001 environmental certificates/bn PPP$ GDP 3.3 27
Market sophistication 62.1 15
4.1 Credit 64.2 11
4.1.1 Ease of getting credit* 55.0 88 ○
4.1.2 Domestic credit to private sector, % GDP 174.7 3 ● ◆
4.1.3 Microfinance gross loans, % GDP n/a n/a
4.2 Investment 34.3 51
4.2.1 Ease of protecting minority investors* 64.0 56
4.2.2 Market capitalization, % GDP 118.9 9
4.2.3 Venture capital investors, deals/bn PPP$ GDP 0.1 31 ◇
4.2.4 Venture capital recipients, deals/bn PPP$ GDP 0.0 36
4.3 Trade, diversification, and market scale 87.9 5 ●
4.3.1 Applied tariff rate, weighted avg., % 3.5 70 ○
4.3.2 Domestic industry diversification 94.7 30
4.3.3 Domestic market scale, bn PPP$ 5,236.1 4 ● ◆
NOTES: ● indicates a strength; ○ a weakness; ◆ an income group strength; ◇ an income group weakness; * an index; †
a survey question. indicates that
the
economy’s data are older than the base year; see appendices for details, including the year of the data, at http://globalinnovationindex.org. Square
brackets [ ] indicate
that the data minimum coverage (DMC) requirements were not met at the sub-pillar or pillar level.](https://image.slidesharecdn.com/e-220805033615-e8521670/75/E-INDEX-2021-pdf-120-2048.jpg)
![101
GII 2021 Economy profiles
Jordan GII 2021 rank
81
Output rank Input rank Income Region Population (mn) GDP, PPP$ (bn) GDP per capita, PPP$ GII 2020 rank
81 79 Upper middle NAWA 10.2 102.2 10,007 81
Score/
Value Rank
Business sophistication 21.9 85
5.1 Knowledge workers 23.1 [92]
5.1.1 Knowledge-intensive employment, % 21.4 75
5.1.2 Firms offering formal training, % 16.9 87 ○ ◇
5.1.3 GERD performed by business, % GDP n/a n/a
5.1.4 GERD financed by business, % n/a n/a
5.1.5 Females employed w/advanced degrees, % 7.6 82
5.2 Innovation linkages 26.5 42 ◆
5.2.1 University-industry RD collaboration†
46.8 50
5.2.2 State of cluster development and depth†
57.6 30 ● ◆
5.2.3 GERD financed by abroad, % GDP n/a n/a
5.2.4 Joint venture/strategic alliance deals/bn PPP$ GDP 0.0 47
5.2.5 Patent families/bn PPP$ GDP 0.0 72
5.3 Knowledge absorption 16.2 112 ◇
5.3.1 Intellectual property payments, % total trade 0.1 100
5.3.2 High-tech imports, % total trade 7.0 79
5.3.3 ICT services imports, % total trade 0.2 126 ○ ◇
5.3.4 FDI net inflows, % GDP 3.0 49
5.3.5 Research talent, % in businesses n/a n/a
Knowledge and technology outputs 18.0 76
6.1 Knowledge creation 16.6 63
6.1.1 Patents by origin/bn PPP$ GDP 0.2 98
6.1.2 PCT patents by origin/bn PPP$ GDP 0.2 50
6.1.3 Utility models by origin/bn PPP$ GDP n/a n/a
6.1.4 Scientific and technical articles/bn PPP$ GDP 29.2 30 ● ◆
6.1.5 Citable documents H-index 10.0 78
6.2 Knowledge impact 26.8 78
6.2.1 Labor productivity growth, % −0.8 79
6.2.2 New businesses/th pop. 15–64 0.5 95
6.2.3 Software spending, % GDP 0.3 42
6.2.4 ISO 9001 quality certificates/bn PPP$ GDP 5.6 53
6.2.5 High-tech manufacturing, % 22.1 57
6.3 Knowledge diffusion 10.7 93
6.3.1 Intellectual property receipts, % total trade 0.1 52
6.3.2 Production and export complexity 47.8 51
6.3.3 High-tech exports, % total trade 1.4 66
6.3.4 ICT services exports, % total trade 0.1 129 ○
Creative outputs 18.3 88
7.1 Intangible assets 22.0 92
7.1.1 Trademarks by origin/bn PPP$ GDP 25.7 81
7.1.2 Global brand value, top 5,000, % GDP 7.9 64
7.1.3 Industrial designs by origin/bn PPP$ GDP 0.7 80
7.1.4 ICTs and organizational model creation†
52.6 68
7.2 Creative goods and services 13.8 68
7.2.1 Cultural and creative services exports, % total trade 0.0 108 ○
7.2.2 National feature films/mn pop. 15–69 n/a n/a
7.2.3 Entertainment and media market/th pop. 15–69 1.8 54 ○ ◇
7.2.4 Printing and other media, % manufacturing 2.4 9 ● ◆
7.2.5 Creative goods exports, % total trade 0.9 46
7.3 Online creativity 15.4 73
7.3.1 Generic top-level domains (TLDs)/th pop. 15–69 4.8 54
7.3.2 Country-code TLDs/th pop. 15–69 0.2 108
7.3.3 Wikipedia edits/mn pop. 15–69 45.5 74
7.3.4 Mobile app creation/bn PPP$ GDP 11.6 44
Score/
Value Rank
Institutions 64.4 63
1.1 Political environment 57.3 69
1.1.1 Political and operational stability* 66.1 74
1.1.2 Government effectiveness* 52.9 65
1.2 Regulatory environment 73.7 39 ● ◆
1.2.1 Regulatory quality* 44.4 68
1.2.2 Rule of law* 50.5 56
1.2.3 Cost of redundancy dismissal 8.0 1 ● ◆
1.3 Business environment 62.1 97
1.3.1 Ease of starting a business* 84.5 92
1.3.2 Ease of resolving insolvency* 39.7 98
Human capital and research 26.2 84
2.1 Education 32.9 110 ◇
2.1.1 Expenditure on education, % GDP 3.1 97 ○
2.1.2 Government funding/pupil, secondary, % GDP/cap 15.5 72
2.1.3 School life expectancy, years 10.6 103 ○ ◇
2.1.4 PISA scales in reading, maths and science 416.0 58
2.1.5 Pupil-teacher ratio, secondary 14.4 67
2.2 Tertiary education 36.3 54
2.2.1 Tertiary enrolment, % gross 33.1 81
2.2.2 Graduates in science and engineering, % 26.4 31 ●
2.2.3 Tertiary inbound mobility, % 14.0 13 ● ◆
2.3 Research and development (RD) 9.5 60
2.3.1 Researchers, FTE/mn pop. 596.0 62
2.3.2 Gross expenditure on RD, % GDP 0.7 51
2.3.3 Global corporate RD investors, top 3, mn US$ 0.0 41 ○ ◇
2.3.4 QS university ranking, top 3* 17.0 56
Infrastructure 30.1 102 ◇
3.1 Informationandcommunicationtechnologies(ICTs) 41.4 106 ◇
3.1.1 ICT access* 45.9 97 ◇
3.1.2 ICT use* 50.4 80
3.1.3 Government’s online service* 35.9 121 ○ ◇
3.1.4 E-participation* 33.3 120 ○ ◇
3.2 General infrastructure 20.5 108
3.2.1 Electricity output, GWh/mn pop. 2,057.2 80
3.2.2 Logistics performance* 29.8 83
3.2.3 Gross capital formation, % GDP 19.8 89
3.3 Ecological sustainability 28.5 65
3.3.1 GDP/unit of energy use 9.8 71
3.3.2 Environmental performance* 53.4 46 ◆
3.3.3 ISO 14001 environmental certificates/bn PPP$ GDP 1.2 62
Market sophistication 49.7 47
4.1 Credit 51.7 25 ● ◆
4.1.1 Ease of getting credit* 95.0 4 ● ◆
4.1.2 Domestic credit to private sector, % GDP 76.9 40 ●
4.1.3 Microfinance gross loans, % GDP 0.4 40
4.2 Investment 26.3 76
4.2.1 Ease of protecting minority investors* 50.0 92
4.2.2 Market capitalization, % GDP 52.7 34
4.2.3 Venture capital investors, deals/bn PPP$ GDP 0.1 30 ◆
4.2.4 Venture capital recipients, deals/bn PPP$ GDP 0.0 30 ● ◆
4.3 Trade, diversification, and market scale 71.2 58
4.3.1 Applied tariff rate, weighted avg., % 4.4 79
4.3.2 Domestic industry diversification 94.8 29 ●
4.3.3 Domestic market scale, bn PPP$ 102.2 83
NOTES: ● indicates a strength; ○ a weakness; ◆ an income group strength; ◇ an income group weakness; * an index; †
a survey question. indicates that
the
economy’s data are older than the base year; see appendices for details, including the year of the data, at http://globalinnovationindex.org. Square
brackets [ ] indicate
that the data minimum coverage (DMC) requirements were not met at the sub-pillar or pillar level.](https://image.slidesharecdn.com/e-220805033615-e8521670/75/E-INDEX-2021-pdf-121-2048.jpg)
![102 Global Innovation Index 2021
Kazakhstan GII 2021 rank
79
Output rank Input rank Income Region Population (mn) GDP, PPP$ (bn) GDP per capita, PPP$ GII 2020 rank
101 61 Upper middle CSA 18.8 501.8 26,589 77
Score/
Value Rank
Business sophistication 23.0 78
5.1 Knowledge workers 37.1 52
5.1.1 Knowledge-intensive employment, % 34.3 40 ◆
5.1.2 Firms offering formal training, % 21.8 71
5.1.3 GERD performed by business, % GDP 0.1 74
5.1.4 GERD financed by business, % 47.4 31
5.1.5 Females employed w/advanced degrees, % 20.7 29 ● ◆
5.2 Innovation linkages 12.9 120 ○ ◇
5.2.1 University-industry RD collaboration†
36.0 95
5.2.2 State of cluster development and depth†
32.8 117 ○ ◇
5.2.3 GERD financed by abroad, % GDP 0.0 90
5.2.4 Joint venture/strategic alliance deals/bn PPP$ GDP 0.0 82
5.2.5 Patent families/bn PPP$ GDP 0.1 54
5.3 Knowledge absorption 19.0 97
5.3.1 Intellectual property payments, % total trade 0.3 87
5.3.2 High-tech imports, % total trade 7.4 70
5.3.3 ICT services imports, % total trade 0.7 93
5.3.4 FDI net inflows, % GDP 1.6 91
5.3.5 Research talent, % in businesses n/a n/a
Knowledge and technology outputs 15.0 86
6.1 Knowledge creation 14.9 66
6.1.1 Patents by origin/bn PPP$ GDP 1.9 39
6.1.2 PCT patents by origin/bn PPP$ GDP 0.1 73
6.1.3 Utility models by origin/bn PPP$ GDP 1.6 14 ●
6.1.4 Scientific and technical articles/bn PPP$ GDP 3.2 119 ○ ◇
6.1.5 Citable documents H-index 5.3 102
6.2 Knowledge impact 19.1 110 ◇
6.2.1 Labor productivity growth, % 0.9 48
6.2.2 New businesses/th pop. 15–64 2.0 56
6.2.3 Software spending, % GDP 0.0 118 ○ ◇
6.2.4 ISO 9001 quality certificates/bn PPP$ GDP 1.0 111
6.2.5 High-tech manufacturing, % 13.5 81
6.3 Knowledge diffusion 11.0 91
6.3.1 Intellectual property receipts, % total trade 0.0 102 ○ ◇
6.3.2 Production and export complexity 30.2 92
6.3.3 High-tech exports, % total trade 3.9 42
6.3.4 ICT services exports, % total trade 0.2 122 ○
Creative outputs 14.3 110 ◇
7.1 Intangible assets 19.2 105
7.1.1 Trademarks by origin/bn PPP$ GDP 22.6 87
7.1.2 Global brand value, top 5,000, % GDP 3.8 70
7.1.3 Industrial designs by origin/bn PPP$ GDP 0.2 103
7.1.4 ICTs and organizational model creation†
48.2 88
7.2 Creative goods and services 6.5 96
7.2.1 Cultural and creative services exports, % total trade 0.1 89
7.2.2 National feature films/mn pop. 15–69 6.1 38
7.2.3 Entertainment and media market/th pop. 15–69 n/a n/a
7.2.4 Printing and other media, % manufacturing 0.4 96 ○ ◇
7.2.5 Creative goods exports, % total trade 0.2 80
7.3 Online creativity 12.4 83
7.3.1 Generic top-level domains (TLDs)/th pop. 15–69 0.3 115
7.3.2 Country-code TLDs/th pop. 15–69 3.7 60
7.3.3 Wikipedia edits/mn pop. 15–69 44.8 77
7.3.4 Mobile app creation/bn PPP$ GDP 1.5 72
Score/
Value Rank
Institutions 69.8 45 ◆
1.1 Political environment 58.8 62
1.1.1 Political and operational stability* 69.6 60
1.1.2 Government effectiveness* 53.4 63
1.2 Regulatory environment 69.9 49
1.2.1 Regulatory quality* 47.1 62
1.2.2 Rule of law* 35.3 90
1.2.3 Cost of redundancy dismissal 8.7 18 ●
1.3 Business environment 80.6 31 ● ◆
1.3.1 Ease of starting a business* 94.4 20 ● ◆
1.3.2 Ease of resolving insolvency* 66.7 39
Human capital and research 31.7 66
2.1 Education 45.8 78
2.1.1 Expenditure on education, % GDP 2.9 101 ◇
2.1.2 Government funding/pupil, secondary, % GDP/cap 21.2 41
2.1.3 School life expectancy, years 15.8 40
2.1.4 PISA scales in reading, maths and science 402.4 64
2.1.5 Pupil-teacher ratio, secondary 8.3 12 ● ◆
2.2 Tertiary education 38.3 48
2.2.1 Tertiary enrolment, % gross 70.7 31 ●
2.2.2 Graduates in science and engineering, % 24.1 46
2.2.3 Tertiary inbound mobility, % 3.3 65
2.3 Research and development (RD) 10.9 54
2.3.1 Researchers, FTE/mn pop. 666.9 61
2.3.2 Gross expenditure on RD, % GDP 0.1 103 ○ ◇
2.3.3 Global corporate RD investors, top 3, mn US$ 0.0 41 ○ ◇
2.3.4 QS university ranking, top 3* 33.8 36
Infrastructure 44.4 58
3.1 Informationandcommunicationtechnologies(ICTs) 80.5 29 ● ◆
3.1.1 ICT access* 76.6 43 ◆
3.1.2 ICT use* 64.9 56
3.1.3 Government’s online service* 92.3 11 ● ◆
3.1.4 E-participation* 88.1 26 ●
3.2 General infrastructure 32.6 49
3.2.1 Electricity output, GWh/mn pop. 5,887.8 35 ◆
3.2.2 Logistics performance* 35.4 70
3.2.3 Gross capital formation, % GDP 28.3 24 ●
3.3 Ecological sustainability 20.1 99 ◇
3.3.1 GDP/unit of energy use 6.4 104 ◇
3.3.2 Environmental performance* 44.7 75
3.3.3 ISO 14001 environmental certificates/bn PPP$ GDP 0.4 88
Market sophistication 43.8 80
4.1 Credit 35.9 81
4.1.1 Ease of getting credit* 80.0 23
4.1.2 Domestic credit to private sector, % GDP 24.3 108
4.1.3 Microfinance gross loans, % GDP 0.2 47
4.2 Investment 23.0 101
4.2.1 Ease of protecting minority investors* 84.0 7 ● ◆
4.2.2 Market capitalization, % GDP 23.4 54
4.2.3 Venture capital investors, deals/bn PPP$ GDP 0.0 89 ○ ◇
4.2.4 Venture capital recipients, deals/bn PPP$ GDP 0.0 94 ○ ◇
4.3 Trade, diversification, and market scale 72.6 53
4.3.1 Applied tariff rate, weighted avg., % 2.3 57
4.3.2 Domestic industry diversification 76.3 87
4.3.3 Domestic market scale, bn PPP$ 501.8 40
NOTES: ● indicates a strength; ○ a weakness; ◆ an income group strength; ◇ an income group weakness; * an index; †
a survey question. indicates that
the
economy’s data are older than the base year; see appendices for details, including the year of the data, at http://globalinnovationindex.org. Square
brackets [ ] indicate
that the data minimum coverage (DMC) requirements were not met at the sub-pillar or pillar level.](https://image.slidesharecdn.com/e-220805033615-e8521670/75/E-INDEX-2021-pdf-122-2048.jpg)
![103
GII 2021 Economy profiles
Kenya GII 2021 rank
85
Output rank Input rank Income Region Population (mn) GDP, PPP$ (bn) GDP per capita, PPP$ GII 2020 rank
76 89 Lower middle SSF 53.8 243.1 4,993 86
Score/
Value Rank
Business sophistication 23.4 77
5.1 Knowledge workers 14.8 112
5.1.1 Knowledge-intensive employment, % n/a n/a
5.1.2 Firms offering formal training, % 37.4 36
5.1.3 GERD performed by business, % GDP 0.1 67
5.1.4 GERD financed by business, % 4.3 84
5.1.5 Females employed w/advanced degrees, % 1.5 110 ○
5.2 Innovation linkages 29.4 35 ◆
5.2.1 University-industry RD collaboration†
46.8 49 ◆
5.2.2 State of cluster development and depth†
49.1 53
5.2.3 GERD financed by abroad, % GDP 0.4 6 ● ◆
5.2.4 Joint venture/strategic alliance deals/bn PPP$ GDP 0.0 65
5.2.5 Patent families/bn PPP$ GDP 0.0 85
5.3 Knowledge absorption 25.9 68
5.3.1 Intellectual property payments, % total trade 1.7 16 ● ◆
5.3.2 High-tech imports, % total trade 8.2 58
5.3.3 ICT services imports, % total trade 0.4 111
5.3.4 FDI net inflows, % GDP 1.6 87
5.3.5 Research talent, % in businesses 11.4 62
Knowledge and technology outputs 21.1 65
6.1 Knowledge creation 14.6 67
6.1.1 Patents by origin/bn PPP$ GDP 1.3 58
6.1.2 PCT patents by origin/bn PPP$ GDP 0.0 82
6.1.3 Utility models by origin/bn PPP$ GDP 0.9 24
6.1.4 Scientific and technical articles/bn PPP$ GDP 11.1 77
6.1.5 Citable documents H-index 15.9 52
6.2 Knowledge impact 23.7 86
6.2.1 Labor productivity growth, % 2.7 18 ●
6.2.2 New businesses/th pop. 15–64 1.5 68
6.2.3 Software spending, % GDP 0.1 77
6.2.4 ISO 9001 quality certificates/bn PPP$ GDP 1.9 91
6.2.5 High-tech manufacturing, % 11.1 85
6.3 Knowledge diffusion 25.0 45
6.3.1 Intellectual property receipts, % total trade 0.6 27 ● ◆
6.3.2 Production and export complexity 36.0 76
6.3.3 High-tech exports, % total trade 0.5 89
6.3.4 ICT services exports, % total trade 5.3 14 ● ◆
Creative outputs 16.7 95
7.1 Intangible assets 24.1 89
7.1.1 Trademarks by origin/bn PPP$ GDP 24.6 82
7.1.2 Global brand value, top 5,000, % GDP 11.2 59
7.1.3 Industrial designs by origin/bn PPP$ GDP 0.7 81
7.1.4 ICTs and organizational model creation†
60.0 44 ◆
7.2 Creative goods and services 16.5 62
7.2.1 Cultural and creative services exports, % total trade 0.0 99 ○
7.2.2 National feature films/mn pop. 15–69 n/a n/a
7.2.3 Entertainment and media market/th pop. 15–69 2.0 53
7.2.4 Printing and other media, % manufacturing 3.9 3 ● ◆
7.2.5 Creative goods exports, % total trade 0.1 94
7.3 Online creativity 2.3 131 ○ ◇
7.3.1 Generic top-level domains (TLDs)/th pop. 15–69 0.9 98
7.3.2 Country-code TLDs/th pop. 15–69 0.9 87
7.3.3 Wikipedia edits/mn pop. 15–69 12.5 129 ○ ◇
7.3.4 Mobile app creation/bn PPP$ GDP 0.0 103 ○
Score/
Value Rank
Institutions 59.9 80
1.1 Political environment 47.1 98
1.1.1 Political and operational stability* 57.1 106
1.1.2 Government effectiveness* 42.1 92
1.2 Regulatory environment 60.1 80
1.2.1 Regulatory quality* 36.3 94
1.2.2 Rule of law* 34.8 91
1.2.3 Cost of redundancy dismissal 15.8 61
1.3 Business environment 72.6 60 ◆
1.3.1 Ease of starting a business* 82.7 100
1.3.2 Ease of resolving insolvency* 62.4 45 ◆
Human capital and research 21.9 92
2.1 Education 49.4 [68]
2.1.1 Expenditure on education, % GDP 5.3 27 ●
2.1.2 Government funding/pupil, secondary, % GDP/cap n/a n/a
2.1.3 School life expectancy, years n/a n/a
2.1.4 PISA scales in reading, maths and science n/a n/a
2.1.5 Pupil-teacher ratio, secondary 30.7 119 ○ ◇
2.2 Tertiary education 11.6 111
2.2.1 Tertiary enrolment, % gross 11.5 111
2.2.2 Graduates in science and engineering, % 16.5 91
2.2.3 Tertiary inbound mobility, % 0.9 89
2.3 Research and development (RD) 4.5 78
2.3.1 Researchers, FTE/mn pop. 221.4 79
2.3.2 Gross expenditure on RD, % GDP 0.8 48 ◆
2.3.3 Global corporate RD investors, top 3, mn US$ 0.0 41 ○ ◇
2.3.4 QS university ranking, top 3* 0.0 74 ○ ◇
Infrastructure 25.9 114
3.1 Informationandcommunicationtechnologies(ICTs) 47.7 96
3.1.1 ICT access* 41.8 105
3.1.2 ICT use* 21.7 112
3.1.3 Government’s online service* 67.6 75
3.1.4 E-participation* 59.5 87
3.2 General infrastructure 14.0 120 ○
3.2.1 Electricity output, GWh/mn pop. 229.0 116 ○
3.2.2 Logistics performance* 35.7 67
3.2.3 Gross capital formation, % GDP 12.3 120 ○ ◇
3.3 Ecological sustainability 16.1 120 ○
3.3.1 GDP/unit of energy use 6.1 105
3.3.2 Environmental performance* 34.7 103
3.3.3 ISO 14001 environmental certificates/bn PPP$ GDP 0.3 103
Market sophistication 48.8 54
4.1 Credit 56.7 20 ● ◆
4.1.1 Ease of getting credit* 95.0 4 ● ◆
4.1.2 Domestic credit to private sector, % GDP 27.5 101
4.1.3 Microfinance gross loans, % GDP 4.2 10 ● ◆
4.2 Investment 32.2 61
4.2.1 Ease of protecting minority investors* 92.0 1 ● ◆
4.2.2 Market capitalization, % GDP 26.2 51
4.2.3 Venture capital investors, deals/bn PPP$ GDP 0.0 53
4.2.4 Venture capital recipients, deals/bn PPP$ GDP 0.1 23 ◆
4.3 Trade, diversification, and market scale 57.6 102
4.3.1 Applied tariff rate, weighted avg., % 11.5 123 ○ ◇
4.3.2 Domestic industry diversification 71.8 94
4.3.3 Domestic market scale, bn PPP$ 243.1 61
NOTES: ● indicates a strength; ○ a weakness; ◆ an income group strength; ◇ an income group weakness; * an index; †
a survey question. indicates that
the
economy’s data are older than the base year; see appendices for details, including the year of the data, at http://globalinnovationindex.org. Square
brackets [ ] indicate
that the data minimum coverage (DMC) requirements were not met at the sub-pillar or pillar level.](https://image.slidesharecdn.com/e-220805033615-e8521670/75/E-INDEX-2021-pdf-123-2048.jpg)
![104 Global Innovation Index 2021
Kuwait GII 2021 rank
72
Output rank Input rank Income Region Population (mn) GDP, PPP$ (bn) GDP per capita, PPP$ GII 2020 rank
73 73 High NAWA 4.3 203.8 41,735 78
Score/
Value Rank
Business sophistication 18.7 100 ◇
5.1 Knowledge workers 17.4 [105]
5.1.1 Knowledge-intensive employment, % 22.7 70 ◇
5.1.2 Firms offering formal training, % n/a n/a
5.1.3 GERD performed by business, % GDP n/a n/a
5.1.4 GERD financed by business, % 1.0 94 ○ ◇
5.1.5 Females employed w/advanced degrees, % n/a n/a
5.2 Innovation linkages 25.1 45
5.2.1 University-industry RD collaboration†
42.2 69
5.2.2 State of cluster development and depth†
54.9 37 ●
5.2.3 GERD financed by abroad, % GDP n/a n/a
5.2.4 Joint venture/strategic alliance deals/bn PPP$ GDP 0.0 45
5.2.5 Patent families/bn PPP$ GDP 0.0 93
5.3 Knowledge absorption 13.7 124 ○ ◇
5.3.1 Intellectual property payments, % total trade 0.0 125 ○ ◇
5.3.2 High-tech imports, % total trade 5.5 105
5.3.3 ICT services imports, % total trade 0.6 96 ◇
5.3.4 FDI net inflows, % GDP 0.2 122 ○
5.3.5 Research talent, % in businesses n/a n/a
Knowledge and technology outputs 22.1 60
6.1 Knowledge creation 5.8 108 ◇
6.1.1 Patents by origin/bn PPP$ GDP 0.1 116 ○
6.1.2 PCT patents by origin/bn PPP$ GDP 0.1 72
6.1.3 Utility models by origin/bn PPP$ GDP n/a n/a
6.1.4 Scientific and technical articles/bn PPP$ GDP 6.9 103 ◇
6.1.5 Citable documents H-index 9.1 82 ◇
6.2 Knowledge impact 29.0 67
6.2.1 Labor productivity growth, % −1.1 86
6.2.2 New businesses/th pop. 15–64 5.9 27 ●
6.2.3 Software spending, % GDP 0.4 26 ●
6.2.4 ISO 9001 quality certificates/bn PPP$ GDP 2.7 79
6.2.5 High-tech manufacturing, % 23.9 53
6.3 Knowledge diffusion 31.4 31 ●
6.3.1 Intellectual property receipts, % total trade n/a n/a
6.3.2 Production and export complexity 27.6 99 ◇
6.3.3 High-tech exports, % total trade 0.3 103 ◇
6.3.4 ICT services exports, % total trade 7.4 6 ● ◆
Creative outputs 18.0 89 ◇
7.1 Intangible assets 26.8 80 ◇
7.1.1 Trademarks by origin/bn PPP$ GDP 16.6 98 ◇
7.1.2 Global brand value, top 5,000, % GDP 53.3 34
7.1.3 Industrial designs by origin/bn PPP$ GDP n/a n/a
7.1.4 ICTs and organizational model creation†
50.9 79 ◇
7.2 Creative goods and services 4.7 107 ◇
7.2.1 Cultural and creative services exports, % total trade n/a n/a
7.2.2 National feature films/mn pop. 15–69 1.9 70 ◇
7.2.3 Entertainment and media market/th pop. 15–69 10.6 36 ◇
7.2.4 Printing and other media, % manufacturing 0.3 97 ○ ◇
7.2.5 Creative goods exports, % total trade 0.1 88
7.3 Online creativity 13.6 78 ◇
7.3.1 Generic top-level domains (TLDs)/th pop. 15–69 7.6 44
7.3.2 Country-code TLDs/th pop. 15–69 0.3 105 ◇
7.3.3 Wikipedia edits/mn pop. 15–69 46.3 72 ◇
7.3.4 Mobile app creation/bn PPP$ GDP 0.8 74
Score/
Value Rank
Institutions 57.7 86 ◇
1.1 Political environment 54.9 78 ◇
1.1.1 Political and operational stability* 62.5 89 ◇
1.1.2 Government effectiveness* 51.1 73 ◇
1.2 Regulatory environment 54.5 97 ◇
1.2.1 Regulatory quality* 45.2 67 ◇
1.2.2 Rule of law* 52.4 53 ◇
1.2.3 Cost of redundancy dismissal 28.1 116 ○ ◇
1.3 Business environment 63.8 90 ◇
1.3.1 Ease of starting a business* 88.4 67
1.3.2 Ease of resolving insolvency* 39.2 101 ◇
Human capital and research 31.4 [69]
2.1 Education 52.9 [57]
2.1.1 Expenditure on education, % GDP n/a n/a
2.1.2 Government funding/pupil, secondary, % GDP/cap 17.3 64
2.1.3 School life expectancy, years 14.7 59 ◇
2.1.4 PISA scales in reading, maths and science n/a n/a
2.1.5 Pupil-teacher ratio, secondary 7.6 4 ● ◆
2.2 Tertiary education 38.4 [47]
2.2.1 Tertiary enrolment, % gross 55.3 54
2.2.2 Graduates in science and engineering, % n/a n/a
2.2.3 Tertiary inbound mobility, % n/a n/a
2.3 Research and development (RD) 2.8 89 ◇
2.3.1 Researchers, FTE/mn pop. 513.9 67 ◇
2.3.2 Gross expenditure on RD, % GDP 0.1 111 ○ ◇
2.3.3 Global corporate RD investors, top 3, mn US$ 0.0 41 ○ ◇
2.3.4 QS university ranking, top 3* 4.4 71 ◇
Infrastructure 49.6 43
3.1 Informationandcommunicationtechnologies(ICTs) 80.4 31 ●
3.1.1 ICT access* 79.3 35 ●
3.1.2 ICT use* 67.6 53 ◇
3.1.3 Government’s online service* 84.1 31 ●
3.1.4 E-participation* 90.5 18 ●
3.2 General infrastructure 41.4 27 ●
3.2.1 Electricity output, GWh/mn pop. 17,912.3 4 ● ◆
3.2.2 Logistics performance* 37.8 62 ◇
3.2.3 Gross capital formation, % GDP 25.1 46
3.3 Ecological sustainability 26.9 74 ◇
3.3.1 GDP/unit of energy use 8.4 87
3.3.2 Environmental performance* 53.6 45 ◇
3.3.3 ISO 14001 environmental certificates/bn PPP$ GDP 1.2 64
Market sophistication 41.4 94 ◇
4.1 Credit 40.7 66
4.1.1 Ease of getting credit* 45.0 101 ◇
4.1.2 Domestic credit to private sector, % GDP 89.3 30 ●
4.1.3 Microfinance gross loans, % GDP n/a n/a
4.2 Investment 26.2 78
4.2.1 Ease of protecting minority investors* 66.0 50
4.2.2 Market capitalization, % GDP n/a n/a
4.2.3 Venture capital investors, deals/bn PPP$ GDP 0.0 41
4.2.4 Venture capital recipients, deals/bn PPP$ GDP 0.0 84 ○
4.3 Trade, diversification, and market scale 57.4 104 ◇
4.3.1 Applied tariff rate, weighted avg., % 4.5 80
4.3.2 Domestic industry diversification 53.6 105 ○ ◇
4.3.3 Domestic market scale, bn PPP$ 203.8 64
NOTES: ● indicates a strength; ○ a weakness; ◆ an income group strength; ◇ an income group weakness; * an index; †
a survey question. indicates that
the
economy’s data are older than the base year; see appendices for details, including the year of the data, at http://globalinnovationindex.org. Square
brackets [ ] indicate
that the data minimum coverage (DMC) requirements were not met at the sub-pillar or pillar level.](https://image.slidesharecdn.com/e-220805033615-e8521670/75/E-INDEX-2021-pdf-124-2048.jpg)
![105
GII 2021 Economy profiles
Kyrgyzstan GII 2021 rank
98
Output rank Input rank Income Region Population (mn) GDP, PPP$ (bn) GDP per capita, PPP$ GII 2020 rank
119 81 Lower middle CSA 6.5 31.4 4,824 94
Score/
Value Rank
Business sophistication 17.9 107
5.1 Knowledge workers 22.4 94
5.1.1 Knowledge-intensive employment, % 18.8 82
5.1.2 Firms offering formal training, % 41.4 26 ●
5.1.3 GERD performed by business, % GDP 0.0 80
5.1.4 GERD financed by business, % 6.9 81
5.1.5 Females employed w/advanced degrees, % 10.8 66
5.2 Innovation linkages 11.7 125 ○
5.2.1 University-industry RD collaboration†
28.3 117
5.2.2 State of cluster development and depth†
35.5 112
5.2.3 GERD financed by abroad, % GDP 0.0 84
5.2.4 Joint venture/strategic alliance deals/bn PPP$ GDP 0.0 108
5.2.5 Patent families/bn PPP$ GDP 0.0 100 ○ ◇
5.3 Knowledge absorption 19.7 95
5.3.1 Intellectual property payments, % total trade 0.1 101
5.3.2 High-tech imports, % total trade 9.2 42 ●
5.3.3 ICT services imports, % total trade 0.5 106
5.3.4 FDI net inflows, % GDP 1.7 86
5.3.5 Research talent, % in businesses n/a n/a
Knowledge and technology outputs 12.1 102
6.1 Knowledge creation 11.0 76
6.1.1 Patents by origin/bn PPP$ GDP 2.8 27 ● ◆
6.1.2 PCT patents by origin/bn PPP$ GDP 0.1 61 ◆
6.1.3 Utility models by origin/bn PPP$ GDP 0.5 36
6.1.4 Scientific and technical articles/bn PPP$ GDP 7.4 99
6.1.5 Citable documents H-index 3.4 120
6.2 Knowledge impact 16.0 115
6.2.1 Labor productivity growth, % 0.5 59
6.2.2 New businesses/th pop. 15–64 1.3 77
6.2.3 Software spending, % GDP 0.1 91
6.2.4 ISO 9001 quality certificates/bn PPP$ GDP 0.5 122 ○
6.2.5 High-tech manufacturing, % 2.4 109 ○ ◇
6.3 Knowledge diffusion 9.2 97
6.3.1 Intellectual property receipts, % total trade 0.0 87
6.3.2 Production and export complexity 44.7 59
6.3.3 High-tech exports, % total trade 0.7 84
6.3.4 ICT services exports, % total trade 0.3 114
Creative outputs 10.2 120
7.1 Intangible assets 13.1 123 ○ ◇
7.1.1 Trademarks by origin/bn PPP$ GDP 14.0 103
7.1.2 Global brand value, top 5,000, % GDP 0.0 80 ○ ◇
7.1.3 Industrial designs by origin/bn PPP$ GDP 0.4 95
7.1.4 ICTs and organizational model creation†
34.8 121 ○ ◇
7.2 Creative goods and services 5.5 102
7.2.1 Cultural and creative services exports, % total trade 0.6 43
7.2.2 National feature films/mn pop. 15–69 0.2 104 ○
7.2.3 Entertainment and media market/th pop. 15–69 n/a n/a
7.2.4 Printing and other media, % manufacturing 0.5 85
7.2.5 Creative goods exports, % total trade 0.1 98
7.3 Online creativity 9.3 97
7.3.1 Generic top-level domains (TLDs)/th pop. 15–69 0.2 117
7.3.2 Country-code TLDs/th pop. 15–69 0.8 93
7.3.3 Wikipedia edits/mn pop. 15–69 38.1 88
7.3.4 Mobile app creation/bn PPP$ GDP 0.0 92
Score/
Value Rank
Institutions 55.7 95
1.1 Political environment 40.3 117
1.1.1 Political and operational stability* 50.0 123 ○ ◇
1.1.2 Government effectiveness* 35.5 111
1.2 Regulatory environment 55.2 93
1.2.1 Regulatory quality* 34.4 95
1.2.2 Rule of law* 23.4 116
1.2.3 Cost of redundancy dismissal 17.3 69
1.3 Business environment 71.5 66
1.3.1 Ease of starting a business* 93.0 40 ●
1.3.2 Ease of resolving insolvency* 50.0 70
Human capital and research 30.6 70 ◆
2.1 Education 62.7 [17]
2.1.1 Expenditure on education, % GDP 6.0 16 ● ◆
2.1.2 Government funding/pupil, secondary, % GDP/cap n/a n/a
2.1.3 School life expectancy, years 13.0 82
2.1.4 PISA scales in reading, maths and science n/a n/a
2.1.5 Pupil-teacher ratio, secondary 11.7 46 ● ◆
2.2 Tertiary education 28.5 78
2.2.1 Tertiary enrolment, % gross 42.3 70 ◆
2.2.2 Graduates in science and engineering, % 19.7 73
2.2.3 Tertiary inbound mobility, % 9.0 27 ● ◆
2.3 Research and development (RD) 0.6 111
2.3.1 Researchers, FTE/mn pop. n/a n/a
2.3.2 Gross expenditure on RD, % GDP 0.1 106
2.3.3 Global corporate RD investors, top 3, mn US$ 0.0 41 ○ ◇
2.3.4 QS university ranking, top 3* 0.0 74 ○ ◇
Infrastructure 35.3 87
3.1 Informationandcommunicationtechnologies(ICTs) 60.3 82 ◆
3.1.1 ICT access* 56.8 82
3.1.2 ICT use* 48.4 83
3.1.3 Government’s online service* 64.7 79
3.1.4 E-participation* 71.4 66
3.2 General infrastructure 29.3 63
3.2.1 Electricity output, GWh/mn pop. 2,458.0 76 ◆
3.2.2 Logistics performance* 23.2 102
3.2.3 Gross capital formation, % GDP 31.7 21 ●
3.3 Ecological sustainability 16.4 119
3.3.1 GDP/unit of energy use 5.1 114 ◇
3.3.2 Environmental performance* 39.8 89
3.3.3 ISO 14001 environmental certificates/bn PPP$ GDP 0.1 122 ○
Market sophistication 49.2 52
4.1 Credit 52.7 23 ● ◆
4.1.1 Ease of getting credit* 85.0 14 ● ◆
4.1.2 Domestic credit to private sector, % GDP 25.8 103
4.1.3 Microfinance gross loans, % GDP 4.3 9 ● ◆
4.2 Investment 40.0 [35]
4.2.1 Ease of protecting minority investors* 40.0 110
4.2.2 Market capitalization, % GDP n/a n/a
4.2.3 Venture capital investors, deals/bn PPP$ GDP n/a n/a
4.2.4 Venture capital recipients, deals/bn PPP$ GDP n/a n/a
4.3 Trade, diversification, and market scale 55.0 108
4.3.1 Applied tariff rate, weighted avg., % 3.1 62 ◆
4.3.2 Domestic industry diversification 62.9 101
4.3.3 Domestic market scale, bn PPP$ 31.4 120 ◇
NOTES: ● indicates a strength; ○ a weakness; ◆ an income group strength; ◇ an income group weakness; * an index; †
a survey question. indicates that
the
economy’s data are older than the base year; see appendices for details, including the year of the data, at http://globalinnovationindex.org. Square
brackets [ ] indicate
that the data minimum coverage (DMC) requirements were not met at the sub-pillar or pillar level.](https://image.slidesharecdn.com/e-220805033615-e8521670/75/E-INDEX-2021-pdf-125-2048.jpg)
![106 Global Innovation Index 2021
Lao People’s Democratic Republic GII 2021 rank
117
Output rank Input rank Income Region Population (mn) GDP, PPP$ (bn) GDP per capita, PPP$ GII 2020 rank
112 123 Lower middle SEAO 7.3 59.7 8,221 113
Score/
Value Rank
Business sophistication 24.3 [70]
5.1 Knowledge workers 25.8 [84]
5.1.1 Knowledge-intensive employment, % 21.3 76
5.1.2 Firms offering formal training, % 24.4 63
5.1.3 GERD performed by business, % GDP n/a n/a
5.1.4 GERD financed by business, % n/a n/a
5.1.5 Females employed w/advanced degrees, % 5.4 94
5.2 Innovation linkages 29.0 [37]
5.2.1 University-industry RD collaboration†
44.9 54 ●
5.2.2 State of cluster development and depth†
50.1 46 ●
5.2.3 GERD financed by abroad, % GDP n/a n/a
5.2.4 Joint venture/strategic alliance deals/bn PPP$ GDP n/a n/a
5.2.5 Patent families/bn PPP$ GDP 0.0 100 ○ ◇
5.3 Knowledge absorption 18.1 [102]
5.3.1 Intellectual property payments, % total trade n/a n/a
5.3.2 High-tech imports, % total trade 3.4 122
5.3.3 ICT services imports, % total trade 0.2 125 ◇
5.3.4 FDI net inflows, % GDP 7.3 14 ● ◆
5.3.5 Research talent, % in businesses n/a n/a
Knowledge and technology outputs 6.8 127 ◇
6.1 Knowledge creation 2.3 126
6.1.1 Patents by origin/bn PPP$ GDP 0.0 125
6.1.2 PCT patents by origin/bn PPP$ GDP 0.0 98 ○ ◇
6.1.3 Utility models by origin/bn PPP$ GDP 0.0 68
6.1.4 Scientific and technical articles/bn PPP$ GDP 4.3 117
6.1.5 Citable documents H-index 4.0 114
6.2 Knowledge impact 2.5 [131]
6.2.1 Labor productivity growth, % n/a n/a
6.2.2 New businesses/th pop. 15–64 0.0 121 ○ ◇
6.2.3 Software spending, % GDP n/a n/a
6.2.4 ISO 9001 quality certificates/bn PPP$ GDP 0.8 113
6.2.5 High-tech manufacturing, % 4.7 101
6.3 Knowledge diffusion 15.6 67
6.3.1 Intellectual property receipts, % total trade n/a n/a
6.3.2 Production and export complexity 29.4 95
6.3.3 High-tech exports, % total trade 5.1 35 ●
6.3.4 ICT services exports, % total trade 0.4 105
Creative outputs 17.6 90
7.1 Intangible assets 19.4 104
7.1.1 Trademarks by origin/bn PPP$ GDP 4.5 124
7.1.2 Global brand value, top 5,000, % GDP 11.7 58
7.1.3 Industrial designs by origin/bn PPP$ GDP n/a n/a
7.1.4 ICTs and organizational model creation†
52.5 71
7.2 Creative goods and services 18.7 [59]
7.2.1 Cultural and creative services exports, % total trade n/a n/a
7.2.2 National feature films/mn pop. 15–69 1.3 78
7.2.3 Entertainment and media market/th pop. 15–69 n/a n/a
7.2.4 Printing and other media, % manufacturing 0.1 102 ○ ◇
7.2.5 Creative goods exports, % total trade 3.1 20 ● ◆
7.3 Online creativity 13.0 80
7.3.1 Generic top-level domains (TLDs)/th pop. 15–69 1.9 77
7.3.2 Country-code TLDs/th pop. 15–69 2.5 64 ◆
7.3.3 Wikipedia edits/mn pop. 15–69 36.4 91
7.3.4 Mobile app creation/bn PPP$ GDP n/a n/a
Score/
Value Rank
Institutions 37.9 130 ◇
1.1 Political environment 46.5 100
1.1.1 Political and operational stability* 73.2 44 ● ◆
1.1.2 Government effectiveness* 33.2 117
1.2 Regulatory environment 35.8 125 ◇
1.2.1 Regulatory quality* 24.9 114
1.2.2 Rule of law* 21.9 119
1.2.3 Cost of redundancy dismissal 34.2 123
1.3 Business environment 31.3 132 ○ ◇
1.3.1 Ease of starting a business* 62.7 130 ◇
1.3.2 Ease of resolving insolvency* 0.0 129 ○ ◇
Human capital and research 16.3 113
2.1 Education 29.2 116
2.1.1 Expenditure on education, % GDP 2.9 98
2.1.2 Government funding/pupil, secondary, % GDP/cap 12.5 83
2.1.3 School life expectancy, years 10.5 105
2.1.4 PISA scales in reading, maths and science n/a n/a
2.1.5 Pupil-teacher ratio, secondary 17.3 84
2.2 Tertiary education 19.8 95
2.2.1 Tertiary enrolment, % gross 14.5 103
2.2.2 Graduates in science and engineering, % 23.1 53 ●
2.2.3 Tertiary inbound mobility, % 0.5 99
2.3 Research and development (RD) 0.0 [123]
2.3.1 Researchers, FTE/mn pop. n/a n/a
2.3.2 Gross expenditure on RD, % GDP n/a n/a
2.3.3 Global corporate RD investors, top 3, mn US$ 0.0 41 ○ ◇
2.3.4 QS university ranking, top 3* 0.0 74 ○ ◇
Infrastructure 22.7 123 ◇
3.1 Informationandcommunicationtechnologies(ICTs) 25.4 128 ◇
3.1.1 ICT access* 35.6 115
3.1.2 ICT use* 25.3 107
3.1.3 Government’s online service* 19.4 131 ○ ◇
3.1.4 E-participation* 21.4 130 ○ ◇
3.2 General infrastructure 24.0 88
3.2.1 Electricity output, GWh/mn pop. 4,872.4 47 ● ◆
3.2.2 Logistics performance* 30.4 81
3.2.3 Gross capital formation, % GDP n/a n/a
3.3 Ecological sustainability 18.8 110
3.3.1 GDP/unit of energy use 8.7 85
3.3.2 Environmental performance* 34.8 102
3.3.3 ISO 14001 environmental certificates/bn PPP$ GDP 0.2 119
Market sophistication 39.5 103
4.1 Credit 29.3 110
4.1.1 Ease of getting credit* 60.0 74
4.1.2 Domestic credit to private sector, % GDP 20.9 113
4.1.3 Microfinance gross loans, % GDP 0.7 27 ●
4.2 Investment 20.0 [114]
4.2.1 Ease of protecting minority investors* 20.0 130 ○ ◇
4.2.2 Market capitalization, % GDP n/a n/a
4.2.3 Venture capital investors, deals/bn PPP$ GDP n/a n/a
4.2.4 Venture capital recipients, deals/bn PPP$ GDP n/a n/a
4.3 Trade, diversification, and market scale 69.2 63 ●
4.3.1 Applied tariff rate, weighted avg., % 0.8 7 ● ◆
4.3.2 Domestic industry diversification 85.2 66
4.3.3 Domestic market scale, bn PPP$ 59.7 96
NOTES: ● indicates a strength; ○ a weakness; ◆ an income group strength; ◇ an income group weakness; * an index; †
a survey question. indicates that
the
economy’s data are older than the base year; see appendices for details, including the year of the data, at http://globalinnovationindex.org. Square
brackets [ ] indicate
that the data minimum coverage (DMC) requirements were not met at the sub-pillar or pillar level.](https://image.slidesharecdn.com/e-220805033615-e8521670/75/E-INDEX-2021-pdf-126-2048.jpg)
![107
GII 2021 Economy profiles
Latvia GII 2021 rank
38
Output rank Input rank Income Region Population (mn) GDP, PPP$ (bn) GDP per capita, PPP$ GII 2020 rank
39 38 High EUR 1.9 58.6 30,579 36
Score/
Value Rank
Business sophistication 34.1 40
5.1 Knowledge workers 44.7 34
5.1.1 Knowledge-intensive employment, % 41.8 25
5.1.2 Firms offering formal training, % 52.9 15
5.1.3 GERD performed by business, % GDP 0.2 56 ○
5.1.4 GERD financed by business, % 22.3 64 ◇
5.1.5 Females employed w/advanced degrees, % 25.2 15 ●
5.2 Innovation linkages 27.4 39
5.2.1 University-industry RD collaboration†
50.0 39
5.2.2 State of cluster development and depth†
48.3 56
5.2.3 GERD financed by abroad, % GDP 0.3 10 ●
5.2.4 Joint venture/strategic alliance deals/bn PPP$ GDP 0.0 54
5.2.5 Patent families/bn PPP$ GDP 0.2 48
5.3 Knowledge absorption 30.1 58
5.3.1 Intellectual property payments, % total trade 0.3 86 ○
5.3.2 High-tech imports, % total trade 12.7 18 ●
5.3.3 ICT services imports, % total trade 2.1 31
5.3.4 FDI net inflows, % GDP 2.7 65
5.3.5 Research talent, % in businesses 20.9 53
Knowledge and technology outputs 27.8 45
6.1 Knowledge creation 16.4 64
6.1.1 Patents by origin/bn PPP$ GDP 1.7 42
6.1.2 PCT patents by origin/bn PPP$ GDP 0.5 34
6.1.3 Utility models by origin/bn PPP$ GDP n/a n/a
6.1.4 Scientific and technical articles/bn PPP$ GDP 20.1 45
6.1.5 Citable documents H-index 9.5 80
6.2 Knowledge impact 33.7 46
6.2.1 Labor productivity growth, % 1.1 42 ◆
6.2.2 New businesses/th pop. 15–64 8.0 20
6.2.3 Software spending, % GDP 0.1 84 ○ ◇
6.2.4 ISO 9001 quality certificates/bn PPP$ GDP 14.5 20
6.2.5 High-tech manufacturing, % 20.6 61
6.3 Knowledge diffusion 33.4 29
6.3.1 Intellectual property receipts, % total trade 0.1 68
6.3.2 Production and export complexity 60.2 34
6.3.3 High-tech exports, % total trade 7.2 24
6.3.4 ICT services exports, % total trade 4.6 17 ●
Creative outputs 33.8 39
7.1 Intangible assets 29.9 70
7.1.1 Trademarks by origin/bn PPP$ GDP 42.9 55
7.1.2 Global brand value, top 5,000, % GDP 0.0 80 ○ ◇
7.1.3 Industrial designs by origin/bn PPP$ GDP 3.0 37
7.1.4 ICTs and organizational model creation†
62.7 37
7.2 Creative goods and services 42.7 9 ● ◆
7.2.1 Cultural and creative services exports, % total trade 1.7 16 ●
7.2.2 National feature films/mn pop. 15–69 15.4 8 ●
7.2.3 Entertainment and media market/th pop. 15–69 n/a n/a
7.2.4 Printing and other media, % manufacturing 2.5 7 ● ◆
7.2.5 Creative goods exports, % total trade 2.9 22
7.3 Online creativity 32.8 32
7.3.1 Generic top-level domains (TLDs)/th pop. 15–69 10.0 41
7.3.2 Country-code TLDs/th pop. 15–69 29.4 23
7.3.3 Wikipedia edits/mn pop. 15–69 74.0 25
7.3.4 Mobile app creation/bn PPP$ GDP 14.4 38
Score/
Value Rank
Institutions 78.9 29
1.1 Political environment 77.5 26
1.1.1 Political and operational stability* 82.1 24
1.1.2 Government effectiveness* 75.2 27
1.2 Regulatory environment 82.1 25
1.2.1 Regulatory quality* 74.7 26
1.2.2 Rule of law* 73.4 30
1.2.3 Cost of redundancy dismissal 13.0 40
1.3 Business environment 77.0 42
1.3.1 Ease of starting a business* 94.1 24
1.3.2 Ease of resolving insolvency* 59.8 50
Human capital and research 37.7 46
2.1 Education 57.6 39
2.1.1 Expenditure on education, % GDP 4.4 60
2.1.2 Government funding/pupil, secondary, % GDP/cap 23.6 22
2.1.3 School life expectancy, years 16.2 31
2.1.4 PISA scales in reading, maths and science 487.4 28
2.1.5 Pupil-teacher ratio, secondary 8.4 14 ● ◆
2.2 Tertiary education 43.5 28
2.2.1 Tertiary enrolment, % gross 93.0 5 ● ◆
2.2.2 Graduates in science and engineering, % 20.2 72 ○
2.2.3 Tertiary inbound mobility, % 9.3 26
2.3 Research and development (RD) 12.0 53 ◇
2.3.1 Researchers, FTE/mn pop. 1,891.7 41
2.3.2 Gross expenditure on RD, % GDP 0.6 54
2.3.3 Global corporate RD investors, top 3, mn US$ 0.0 41 ○ ◇
2.3.4 QS university ranking, top 3* 12.8 60
Infrastructure 45.1 55 ◇
3.1 Informationandcommunicationtechnologies(ICTs) 66.5 68 ◇
3.1.1 ICT access* 72.5 55 ◇
3.1.2 ICT use* 76.9 31
3.1.3 Government’s online service* 58.2 90 ○ ◇
3.1.4 E-participation* 58.3 89 ○ ◇
3.2 General infrastructure 25.8 77 ◇
3.2.1 Electricity output, GWh/mn pop. 3,370.7 60
3.2.2 Logistics performance* 35.4 69 ◇
3.2.3 Gross capital formation, % GDP 23.0 58
3.3 Ecological sustainability 42.9 29
3.3.1 GDP/unit of energy use 12.4 45
3.3.2 Environmental performance* 61.6 36
3.3.3 ISO 14001 environmental certificates/bn PPP$ GDP 5.5 19 ●
Market sophistication 50.1 45
4.1 Credit 48.8 36
4.1.1 Ease of getting credit* 85.0 14 ◆
4.1.2 Domestic credit to private sector, % GDP 34.6 89 ○ ◇
4.1.3 Microfinance gross loans, % GDP n/a n/a
4.2 Investment 32.5 58
4.2.1 Ease of protecting minority investors* 68.0 44
4.2.2 Market capitalization, % GDP n/a n/a
4.2.3 Venture capital investors, deals/bn PPP$ GDP 0.1 32
4.2.4 Venture capital recipients, deals/bn PPP$ GDP 0.0 43
4.3 Trade, diversification, and market scale 69.0 66
4.3.1 Applied tariff rate, weighted avg., % 1.8 25
4.3.2 Domestic industry diversification 87.8 61
4.3.3 Domestic market scale, bn PPP$ 58.6 97 ○ ◇
NOTES: ● indicates a strength; ○ a weakness; ◆ an income group strength; ◇ an income group weakness; * an index; †
a survey question. indicates that
the
economy’s data are older than the base year; see appendices for details, including the year of the data, at http://globalinnovationindex.org. Square
brackets [ ] indicate
that the data minimum coverage (DMC) requirements were not met at the sub-pillar or pillar level.](https://image.slidesharecdn.com/e-220805033615-e8521670/75/E-INDEX-2021-pdf-127-2048.jpg)
![108 Global Innovation Index 2021
Lebanon GII 2021 rank
92
Output rank Input rank Income Region Population (mn) GDP, PPP$ (bn) GDP per capita, PPP$ GII 2020 rank
97 94 Upper middle NAWA 6.8 78.9 11,562 87
Score/
Value Rank
Business sophistication 25.4 64
5.1 Knowledge workers 34.0 [58]
5.1.1 Knowledge-intensive employment, % 27.6 54
5.1.2 Firms offering formal training, % 20.8 74
5.1.3 GERD performed by business, % GDP n/a n/a
5.1.4 GERD financed by business, % n/a n/a
5.1.5 Females employed w/advanced degrees, % 14.6 51
5.2 Innovation linkages 21.3 63
5.2.1 University-industry RD collaboration†
42.6 66
5.2.2 State of cluster development and depth†
47.5 59
5.2.3 GERD financed by abroad, % GDP n/a n/a
5.2.4 Joint venture/strategic alliance deals/bn PPP$ GDP 0.0 79
5.2.5 Patent families/bn PPP$ GDP 0.0 68
5.3 Knowledge absorption 21.0 87
5.3.1 Intellectual property payments, % total trade 0.1 108 ◇
5.3.2 High-tech imports, % total trade 4.0 117
5.3.3 ICT services imports, % total trade 2.5 17 ● ◆
5.3.4 FDI net inflows, % GDP 4.6 23 ●
5.3.5 Research talent, % in businesses n/a n/a
Knowledge and technology outputs 14.1 [91]
6.1 Knowledge creation 21.5 [49]
6.1.1 Patents by origin/bn PPP$ GDP 1.1 62
6.1.2 PCT patents by origin/bn PPP$ GDP n/a n/a
6.1.3 Utility models by origin/bn PPP$ GDP n/a n/a
6.1.4 Scientific and technical articles/bn PPP$ GDP 28.4 31 ● ◆
6.1.5 Citable documents H-index 12.8 60
6.2 Knowledge impact 5.7 [125]
6.2.1 Labor productivity growth, % −10.0 120 ○ ◇
6.2.2 New businesses/th pop. 15–64 n/a n/a
6.2.3 Software spending, % GDP 0.0 108 ◇
6.2.4 ISO 9001 quality certificates/bn PPP$ GDP 5.7 47
6.2.5 High-tech manufacturing, % n/a n/a
6.3 Knowledge diffusion 15.2 70
6.3.1 Intellectual property receipts, % total trade 0.1 66
6.3.2 Production and export complexity 52.1 45
6.3.3 High-tech exports, % total trade 0.2 112
6.3.4 ICT services exports, % total trade 2.1 52
Creative outputs 17.2 92
7.1 Intangible assets 18.7 108
7.1.1 Trademarks by origin/bn PPP$ GDP 12.7 105 ◇
7.1.2 Global brand value, top 5,000, % GDP 14.6 55
7.1.3 Industrial designs by origin/bn PPP$ GDP n/a n/a
7.1.4 ICTs and organizational model creation†
42.4 106 ◇
7.2 Creative goods and services 13.7 69
7.2.1 Cultural and creative services exports, % total trade 1.6 17 ● ◆
7.2.2 National feature films/mn pop. 15–69 3.3 55
7.2.3 Entertainment and media market/th pop. 15–69 0.9 60 ○ ◇
7.2.4 Printing and other media, % manufacturing n/a n/a
7.2.5 Creative goods exports, % total trade 0.6 60
7.3 Online creativity 17.6 65
7.3.1 Generic top-level domains (TLDs)/th pop. 15–69 5.9 51
7.3.2 Country-code TLDs/th pop. 15–69 0.3 107
7.3.3 Wikipedia edits/mn pop. 15–69 44.4 78
7.3.4 Mobile app creation/bn PPP$ GDP 20.5 27 ●
Score/
Value Rank
Institutions 50.1 112 ◇
1.1 Political environment 33.3 129 ○ ◇
1.1.1 Political and operational stability* 35.7 131 ○ ◇
1.1.2 Government effectiveness* 32.1 121 ○ ◇
1.2 Regulatory environment 63.5 72
1.2.1 Regulatory quality* 32.4 99
1.2.2 Rule of law* 24.1 115 ◇
1.2.3 Cost of redundancy dismissal 8.7 18 ●
1.3 Business environment 53.6 121 ○ ◇
1.3.1 Ease of starting a business* 78.2 113
1.3.2 Ease of resolving insolvency* 29.1 121 ○ ◇
Human capital and research 24.9 87
2.1 Education 24.8 123 ○ ◇
2.1.1 Expenditure on education, % GDP 2.4 107 ○ ◇
2.1.2 Government funding/pupil, secondary, % GDP/cap 6.4 101 ○ ◇
2.1.3 School life expectancy, years n/a n/a
2.1.4 PISA scales in reading, maths and science 376.8 73 ○
2.1.5 Pupil-teacher ratio, secondary 7.7 5 ● ◆
2.2 Tertiary education 35.7 56
2.2.1 Tertiary enrolment, % gross n/a n/a
2.2.2 Graduates in science and engineering, % 23.4 50
2.2.3 Tertiary inbound mobility, % 9.6 25 ● ◆
2.3 Research and development (RD) 14.3 [49]
2.3.1 Researchers, FTE/mn pop. n/a n/a
2.3.2 Gross expenditure on RD, % GDP n/a n/a
2.3.3 Global corporate RD investors, top 3, mn US$ 0.0 41 ○ ◇
2.3.4 QS university ranking, top 3* 28.6 42
Infrastructure 30.4 100 ◇
3.1 Informationandcommunicationtechnologies(ICTs) 45.4 99 ◇
3.1.1 ICT access* 62.8 72
3.1.2 ICT use* 43.7 94 ◇
3.1.3 Government’s online service* 41.8 116 ◇
3.1.4 E-participation* 33.3 120 ○ ◇
3.2 General infrastructure 21.2 103
3.2.1 Electricity output, GWh/mn pop. 3,100.6 64
3.2.2 Logistics performance* 31.1 78
3.2.3 Gross capital formation, % GDP n/a n/a
3.3 Ecological sustainability 24.6 82
3.3.1 GDP/unit of energy use 9.9 69
3.3.2 Environmental performance* 45.4 70
3.3.3 ISO 14001 environmental certificates/bn PPP$ GDP 0.6 80
Market sophistication 42.0 90
4.1 Credit 34.1 91
4.1.1 Ease of getting credit* 40.0 113 ◇
4.1.2 Domestic credit to private sector, % GDP 106.3 23 ● ◆
4.1.3 Microfinance gross loans, % GDP 0.2 54
4.2 Investment 26.2 77
4.2.1 Ease of protecting minority investors* 44.0 98 ◇
4.2.2 Market capitalization, % GDP 18.0 61
4.2.3 Venture capital investors, deals/bn PPP$ GDP 0.1 22 ● ◆
4.2.4 Venture capital recipients, deals/bn PPP$ GDP 0.1 25 ◆
4.3 Trade, diversification, and market scale 65.7 74
4.3.1 Applied tariff rate, weighted avg., % 3.3 64
4.3.2 Domestic industry diversification 80.7 75
4.3.3 Domestic market scale, bn PPP$ 78.9 89
NOTES: ● indicates a strength; ○ a weakness; ◆ an income group strength; ◇ an income group weakness; * an index; †
a survey question. indicates that
the
economy’s data are older than the base year; see appendices for details, including the year of the data, at http://globalinnovationindex.org. Square
brackets [ ] indicate
that the data minimum coverage (DMC) requirements were not met at the sub-pillar or pillar level.](https://image.slidesharecdn.com/e-220805033615-e8521670/75/E-INDEX-2021-pdf-128-2048.jpg)
![109
GII 2021 Economy profiles
Lithuania GII 2021 rank
39
Output rank Input rank Income Region Population (mn) GDP, PPP$ (bn) GDP per capita, PPP$ GII 2020 rank
43 35 High EUR 2.7 106.9 38,605 40
Score/
Value Rank
Business sophistication 31.5 45
5.1 Knowledge workers 44.2 37
5.1.1 Knowledge-intensive employment, % 42.6 23
5.1.2 Firms offering formal training, % 27.5 56
5.1.3 GERD performed by business, % GDP 0.4 41
5.1.4 GERD financed by business, % 38.0 48
5.1.5 Females employed w/advanced degrees, % 28.9 3 ● ◆
5.2 Innovation linkages 26.3 43
5.2.1 University-industry RD collaboration†
55.4 28
5.2.2 State of cluster development and depth†
42.2 94 ○ ◇
5.2.3 GERD financed by abroad, % GDP 0.2 14 ●
5.2.4 Joint venture/strategic alliance deals/bn PPP$ GDP 0.0 52
5.2.5 Patent families/bn PPP$ GDP 0.2 40
5.3 Knowledge absorption 24.1 71
5.3.1 Intellectual property payments, % total trade 0.2 95 ○
5.3.2 High-tech imports, % total trade 6.6 84 ○
5.3.3 ICT services imports, % total trade 1.0 76
5.3.4 FDI net inflows, % GDP 2.7 62
5.3.5 Research talent, % in businesses 32.7 40
Knowledge and technology outputs 25.8 49
6.1 Knowledge creation 19.4 54
6.1.1 Patents by origin/bn PPP$ GDP 1.1 63
6.1.2 PCT patents by origin/bn PPP$ GDP 0.4 37
6.1.3 Utility models by origin/bn PPP$ GDP n/a n/a
6.1.4 Scientific and technical articles/bn PPP$ GDP 28.1 32
6.1.5 Citable documents H-index 13.0 58
6.2 Knowledge impact 33.3 52
6.2.1 Labor productivity growth, % 2.4 22 ◆
6.2.2 New businesses/th pop. 15–64 3.3 41
6.2.3 Software spending, % GDP 0.1 93 ○ ◇
6.2.4 ISO 9001 quality certificates/bn PPP$ GDP 15.3 19 ●
6.2.5 High-tech manufacturing, % 20.8 60
6.3 Knowledge diffusion 24.9 47
6.3.1 Intellectual property receipts, % total trade 0.1 62
6.3.2 Production and export complexity 63.7 31
6.3.3 High-tech exports, % total trade 6.2 30
6.3.4 ICT services exports, % total trade 1.9 60
Creative outputs 33.6 41
7.1 Intangible assets 31.3 62
7.1.1 Trademarks by origin/bn PPP$ GDP 41.8 57
7.1.2 Global brand value, top 5,000, % GDP 4.0 69 ◇
7.1.3 Industrial designs by origin/bn PPP$ GDP 2.4 42
7.1.4 ICTs and organizational model creation†
68.4 21 ●
7.2 Creative goods and services 19.2 58
7.2.1 Cultural and creative services exports, % total trade 0.7 37
7.2.2 National feature films/mn pop. 15–69 5.4 40
7.2.3 Entertainment and media market/th pop. 15–69 n/a n/a
7.2.4 Printing and other media, % manufacturing 1.1 51
7.2.5 Creative goods exports, % total trade 1.8 34
7.3 Online creativity 52.6 18 ●
7.3.1 Generic top-level domains (TLDs)/th pop. 15–69 14.1 33
7.3.2 Country-code TLDs/th pop. 15–69 33.3 20 ●
7.3.3 Wikipedia edits/mn pop. 15–69 73.7 27
7.3.4 Mobile app creation/bn PPP$ GDP 86.0 5 ● ◆
Score/
Value Rank
Institutions 76.4 33
1.1 Political environment 77.2 27
1.1.1 Political and operational stability* 83.9 13 ●
1.1.2 Government effectiveness* 73.8 30
1.2 Regulatory environment 81.9 27
1.2.1 Regulatory quality* 73.8 27
1.2.2 Rule of law* 73.7 29
1.2.3 Cost of redundancy dismissal 13.0 40
1.3 Business environment 70.0 71
1.3.1 Ease of starting a business* 93.3 32
1.3.2 Ease of resolving insolvency* 46.7 81 ◇
Human capital and research 38.7 43
2.1 Education 52.4 58
2.1.1 Expenditure on education, % GDP 3.8 75 ○
2.1.2 Government funding/pupil, secondary, % GDP/cap 16.9 65 ○
2.1.3 School life expectancy, years 16.6 23
2.1.4 PISA scales in reading, maths and science 479.7 32
2.1.5 Pupil-teacher ratio, secondary 7.8 6 ● ◆
2.2 Tertiary education 43.4 29
2.2.1 Tertiary enrolment, % gross 73.7 25
2.2.2 Graduates in science and engineering, % 26.8 29
2.2.3 Tertiary inbound mobility, % 5.3 46
2.3 Research and development (RD) 20.2 44
2.3.1 Researchers, FTE/mn pop. 3,446.4 29
2.3.2 Gross expenditure on RD, % GDP 1.0 40
2.3.3 Global corporate RD investors, top 3, mn US$ 0.0 41 ○ ◇
2.3.4 QS university ranking, top 3* 19.8 54
Infrastructure 49.9 42
3.1 Informationandcommunicationtechnologies(ICTs) 77.8 40
3.1.1 ICT access* 75.8 47
3.1.2 ICT use* 76.5 32
3.1.3 Government’s online service* 85.3 24
3.1.4 E-participation* 73.8 64
3.2 General infrastructure 20.0 110 ○ ◇
3.2.1 Electricity output, GWh/mn pop. 1,207.5 93 ○ ◇
3.2.2 Logistics performance* 45.1 53 ◇
3.2.3 Gross capital formation, % GDP 15.5 112 ○ ◇
3.3 Ecological sustainability 51.9 8 ● ◆
3.3.1 GDP/unit of energy use 12.6 41
3.3.2 Environmental performance* 62.9 35
3.3.3 ISO 14001 environmental certificates/bn PPP$ GDP 9.5 8 ● ◆
Market sophistication 53.7 35
4.1 Credit 42.2 60
4.1.1 Ease of getting credit* 70.0 44
4.1.2 Domestic credit to private sector, % GDP 38.9 83 ○ ◇
4.1.3 Microfinance gross loans, % GDP n/a n/a
4.2 Investment 44.6 25
4.2.1 Ease of protecting minority investors* 70.0 36
4.2.2 Market capitalization, % GDP n/a n/a
4.2.3 Venture capital investors, deals/bn PPP$ GDP 0.1 26
4.2.4 Venture capital recipients, deals/bn PPP$ GDP 0.1 12 ●
4.3 Trade, diversification, and market scale 74.4 48
4.3.1 Applied tariff rate, weighted avg., % 1.8 25
4.3.2 Domestic industry diversification 95.0 26
4.3.3 Domestic market scale, bn PPP$ 106.9 80
NOTES: ● indicates a strength; ○ a weakness; ◆ an income group strength; ◇ an income group weakness; * an index; †
a survey question. indicates that
the
economy’s data are older than the base year; see appendices for details, including the year of the data, at http://globalinnovationindex.org. Square
brackets [ ] indicate
that the data minimum coverage (DMC) requirements were not met at the sub-pillar or pillar level.](https://image.slidesharecdn.com/e-220805033615-e8521670/75/E-INDEX-2021-pdf-129-2048.jpg)
![110 Global Innovation Index 2021
Luxembourg GII 2021 rank
23
Output rank Input rank Income Region Population (mn) GDP, PPP$ (bn) GDP per capita, PPP$ GII 2020 rank
18 26 High EUR 0.6 70.7 112,875 18
Score/
Value Rank
Business sophistication 57.8 9
5.1 Knowledge workers 65.4 9
5.1.1 Knowledge-intensive employment, % 60.7 1 ● ◆
5.1.2 Firms offering formal training, % 66.1 5
5.1.3 GERD performed by business, % GDP 0.6 35 ◇
5.1.4 GERD financed by business, % 49.6 27
5.1.5 Females employed w/advanced degrees, % 24.3 16
5.2 Innovation linkages 59.2 6
5.2.1 University-industry RD collaboration†
65.8 13
5.2.2 State of cluster development and depth†
67.2 11
5.2.3 GERD financed by abroad, % GDP 0.1 47
5.2.4 Joint venture/strategic alliance deals/bn PPP$ GDP 0.2 8
5.2.5 Patent families/bn PPP$ GDP 5.4 7 ◆
5.3 Knowledge absorption 49.0 14
5.3.1 Intellectual property payments, % total trade 4.5 1 ● ◆
5.3.2 High-tech imports, % total trade 1.6 131 ○ ◇
5.3.3 ICT services imports, % total trade 4.4 1 ● ◆
5.3.4 FDI net inflows, % GDP −16.8 132 ○ ◇
5.3.5 Research talent, % in businesses 37.7 36 ◇
Knowledge and technology outputs 30.1 38 ◇
6.1 Knowledge creation 39.1 24
6.1.1 Patents by origin/bn PPP$ GDP 7.3 14
6.1.2 PCT patents by origin/bn PPP$ GDP 4.5 8
6.1.3 Utility models by origin/bn PPP$ GDP n/a n/a
6.1.4 Scientific and technical articles/bn PPP$ GDP 18.7 48 ◇
6.1.5 Citable documents H-index 11.6 66 ◇
6.2 Knowledge impact 27.0 76 ◇
6.2.1 Labor productivity growth, % −1.7 97 ○
6.2.2 New businesses/th pop. 15–64 17.2 7 ◆
6.2.3 Software spending, % GDP 0.2 73 ◇
6.2.4 ISO 9001 quality certificates/bn PPP$ GDP 3.3 71
6.2.5 High-tech manufacturing, % 16.4 69 ◇
6.3 Knowledge diffusion 24.3 49 ◇
6.3.1 Intellectual property receipts, % total trade 2.1 11
6.3.2 Production and export complexity n/a n/a
6.3.3 High-tech exports, % total trade 0.6 86 ◇
6.3.4 ICT services exports, % total trade 3.0 35
Creative outputs 54.4 3 ● ◆
7.1 Intangible assets 52.2 15
7.1.1 Trademarks by origin/bn PPP$ GDP 69.2 24
7.1.2 Global brand value, top 5,000, % GDP 112.3 17
7.1.3 Industrial designs by origin/bn PPP$ GDP 6.9 19
7.1.4 ICTs and organizational model creation†
72.2 15
7.2 Creative goods and services 42.8 8
7.2.1 Cultural and creative services exports, % total trade 6.6 1 ● ◆
7.2.2 National feature films/mn pop. 15–69 29.6 1 ● ◆
7.2.3 Entertainment and media market/th pop. 15–69 n/a n/a
7.2.4 Printing and other media, % manufacturing 0.7 73
7.2.5 Creative goods exports, % total trade 0.1 102 ○
7.3 Online creativity 70.1 2 ● ◆
7.3.1 Generic top-level domains (TLDs)/th pop. 15–69 84.3 4 ● ◆
7.3.2 Country-code TLDs/th pop. 15–69 68.7 9
7.3.3 Wikipedia edits/mn pop. 15–69 78.8 13
7.3.4 Mobile app creation/bn PPP$ GDP 44.8 11
Score/
Value Rank
Institutions 79.8 27
1.1 Political environment 90.4 6
1.1.1 Political and operational stability* 92.9 4 ● ◆
1.1.2 Government effectiveness* 89.2 9
1.2 Regulatory environment 81.9 26
1.2.1 Regulatory quality* 87.9 11
1.2.2 Rule of law* 94.0 10
1.2.3 Cost of redundancy dismissal 21.7 93 ○ ◇
1.3 Business environment 67.2 77 ◇
1.3.1 Ease of starting a business* 88.8 61
1.3.2 Ease of resolving insolvency* 45.5 84 ◇
Human capital and research 40.0 40 ◇
2.1 Education 48.3 70 ◇
2.1.1 Expenditure on education, % GDP 3.6 83 ○ ◇
2.1.2 Government funding/pupil, secondary, % GDP/cap 19.4 51
2.1.3 School life expectancy, years 14.3 65 ◇
2.1.4 PISA scales in reading, maths and science 476.7 35 ◇
2.1.5 Pupil-teacher ratio, secondary 8.9 19 ◆
2.2 Tertiary education 35.8 55
2.2.1 Tertiary enrolment, % gross 18.6 100 ○ ◇
2.2.2 Graduates in science and engineering, % 18.8 80
2.2.3 Tertiary inbound mobility, % 47.7 1 ● ◆
2.3 Research and development (RD) 36.0 31 ◇
2.3.1 Researchers, FTE/mn pop. 5,128.9 16
2.3.2 Gross expenditure on RD, % GDP 1.2 33 ◇
2.3.3 Global corporate RD investors, top 3, mn US$ 59.2 23
2.3.4 QS university ranking, top 3* 0.0 74 ○ ◇
Infrastructure 52.5 33 ◇
3.1 Informationandcommunicationtechnologies(ICTs) 82.1 26
3.1.1 ICT access* 95.1 1 ● ◆
3.1.2 ICT use* 86.4 8
3.1.3 Government’s online service* 76.5 49 ◇
3.1.4 E-participation* 70.2 70 ◇
3.2 General infrastructure 28.6 66 ◇
3.2.1 Electricity output, GWh/mn pop. 1,719.4 87 ◇
3.2.2 Logistics performance* 73.5 24
3.2.3 Gross capital formation, % GDP 16.8 105 ○ ◇
3.3 Ecological sustainability 46.7 22
3.3.1 GDP/unit of energy use 16.8 15
3.3.2 Environmental performance* 82.3 2 ●
3.3.3 ISO 14001 environmental certificates/bn PPP$ GDP 1.6 54
Market sophistication 49.0 53 ◇
4.1 Credit 29.6 107 ○ ◇
4.1.1 Ease of getting credit* 15.0 127 ○ ◇
4.1.2 Domestic credit to private sector, % GDP 107.3 22
4.1.3 Microfinance gross loans, % GDP n/a n/a
4.2 Investment 49.0 20
4.2.1 Ease of protecting minority investors* 54.0 88 ◇
4.2.2 Market capitalization, % GDP 79.6 20
4.2.3 Venture capital investors, deals/bn PPP$ GDP 1.2 1 ● ◆
4.2.4 Venture capital recipients, deals/bn PPP$ GDP 0.0 35
4.3 Trade, diversification, and market scale 68.3 69 ◇
4.3.1 Applied tariff rate, weighted avg., % 1.8 25
4.3.2 Domestic industry diversification 84.2 68
4.3.3 Domestic market scale, bn PPP$ 70.7 93 ◇
NOTES: ● indicates a strength; ○ a weakness; ◆ an income group strength; ◇ an income group weakness; * an index; †
a survey question. indicates that
the
economy’s data are older than the base year; see appendices for details, including the year of the data, at http://globalinnovationindex.org. Square
brackets [ ] indicate
that the data minimum coverage (DMC) requirements were not met at the sub-pillar or pillar level.](https://image.slidesharecdn.com/e-220805033615-e8521670/75/E-INDEX-2021-pdf-130-2048.jpg)
![111
GII 2021 Economy profiles
Madagascar GII 2021 rank
110
Output rank Input rank Income Region Population (mn) GDP, PPP$ (bn) GDP per capita, PPP$ GII 2020 rank
78 127 Low SSF 27.7 45.4 1,647 115
Score/
Value Rank
Business sophistication 14.6 125
5.1 Knowledge workers 5.0 [131]
5.1.1 Knowledge-intensive employment, % 3.7 123 ○ ◇
5.1.2 Firms offering formal training, % 12.7 92 ◇
5.1.3 GERD performed by business, % GDP n/a n/a
5.1.4 GERD financed by business, % n/a n/a
5.1.5 Females employed w/advanced degrees, % 1.9 107
5.2 Innovation linkages 16.5 100
5.2.1 University-industry RD collaboration†
32.3 104
5.2.2 State of cluster development and depth†
39.1 104
5.2.3 GERD financed by abroad, % GDP n/a n/a
5.2.4 Joint venture/strategic alliance deals/bn PPP$ GDP 0.0 112
5.2.5 Patent families/bn PPP$ GDP 0.0 78 ◆
5.3 Knowledge absorption 22.2 79
5.3.1 Intellectual property payments, % total trade 0.4 75
5.3.2 High-tech imports, % total trade 4.1 116
5.3.3 ICT services imports, % total trade 2.2 29 ● ◆
5.3.4 FDI net inflows, % GDP 3.8 32 ●
5.3.5 Research talent, % in businesses n/a n/a
Knowledge and technology outputs 12.4 99
6.1 Knowledge creation 4.3 115
6.1.1 Patents by origin/bn PPP$ GDP 0.0 128 ○ ◇
6.1.2 PCT patents by origin/bn PPP$ GDP 0.0 98 ○ ◇
6.1.3 Utility models by origin/bn PPP$ GDP n/a n/a
6.1.4 Scientific and technical articles/bn PPP$ GDP 7.1 101
6.1.5 Citable documents H-index 4.7 109
6.2 Knowledge impact 19.8 105
6.2.1 Labor productivity growth, % 1.1 43 ●
6.2.2 New businesses/th pop. 15–64 0.1 116
6.2.3 Software spending, % GDP 0.0 112
6.2.4 ISO 9001 quality certificates/bn PPP$ GDP 1.6 96 ◆
6.2.5 High-tech manufacturing, % n/a n/a
6.3 Knowledge diffusion 13.1 77 ◆
6.3.1 Intellectual property receipts, % total trade 0.1 58 ◆
6.3.2 Production and export complexity 20.6 110
6.3.3 High-tech exports, % total trade 0.2 110
6.3.4 ICT services exports, % total trade 3.2 32 ● ◆
Creative outputs 24.9 [61]
7.1 Intangible assets 45.9 [25]
7.1.1 Trademarks by origin/bn PPP$ GDP 63.6 31 ● ◆
7.1.2 Global brand value, top 5,000, % GDP n/a n/a
7.1.3 Industrial designs by origin/bn PPP$ GDP 6.8 22 ● ◆
7.1.4 ICTs and organizational model creation†
n/a n/a
7.2 Creative goods and services 2.2 [117]
7.2.1 Cultural and creative services exports, % total trade 0.1 83
7.2.2 National feature films/mn pop. 15–69 0.8 90
7.2.3 Entertainment and media market/th pop. 15–69 n/a n/a
7.2.4 Printing and other media, % manufacturing n/a n/a
7.2.5 Creative goods exports, % total trade 0.1 91 ◆
7.3 Online creativity 5.4 120
7.3.1 Generic top-level domains (TLDs)/th pop. 15–69 0.1 123
7.3.2 Country-code TLDs/th pop. 15–69 0.1 119
7.3.3 Wikipedia edits/mn pop. 15–69 20.3 121
7.3.4 Mobile app creation/bn PPP$ GDP n/a n/a
Score/
Value Rank
Institutions 51.1 108
1.1 Political environment 37.1 125
1.1.1 Political and operational stability* 60.7 97
1.1.2 Government effectiveness* 25.3 129 ○
1.2 Regulatory environment 54.5 96
1.2.1 Regulatory quality* 24.4 116
1.2.2 Rule of law* 20.1 120
1.2.3 Cost of redundancy dismissal 14.7 57 ●
1.3 Business environment 61.6 100
1.3.1 Ease of starting a business* 88.5 65 ●
1.3.2 Ease of resolving insolvency* 34.8 113
Human capital and research 14.4 116
2.1 Education 24.5 125
2.1.1 Expenditure on education, % GDP 2.8 103
2.1.2 Government funding/pupil, secondary, % GDP/cap 7.2 98 ◇
2.1.3 School life expectancy, years 10.2 107
2.1.4 PISA scales in reading, maths and science n/a n/a
2.1.5 Pupil-teacher ratio, secondary 18.1 88 ◆
2.2 Tertiary education 18.5 99 ◆
2.2.1 Tertiary enrolment, % gross 5.4 123
2.2.2 Graduates in science and engineering, % 23.8 47 ● ◆
2.2.3 Tertiary inbound mobility, % 1.4 83
2.3 Research and development (RD) 0.1 121
2.3.1 Researchers, FTE/mn pop. 34.0 99
2.3.2 Gross expenditure on RD, % GDP 0.0 116 ○ ◇
2.3.3 Global corporate RD investors, top 3, mn US$ 0.0 41 ○ ◇
2.3.4 QS university ranking, top 3* 0.0 74 ○ ◇
Infrastructure 17.6 132 ○ ◇
3.1 Informationandcommunicationtechnologies(ICTs) 22.4 131 ○ ◇
3.1.1 ICT access* 24.4 129 ○
3.1.2 ICT use* 6.8 131 ○ ◇
3.1.3 Government’s online service* 28.8 126
3.1.4 E-participation* 29.8 127 ○
3.2 General infrastructure 16.5 116
3.2.1 Electricity output, GWh/mn pop. n/a n/a
3.2.2 Logistics performance* 15.9 115
3.2.3 Gross capital formation, % GDP 16.4 106
3.3 Ecological sustainability 13.8 129 ○
3.3.1 GDP/unit of energy use n/a n/a
3.3.2 Environmental performance* 26.5 127 ○ ◇
3.3.3 ISO 14001 environmental certificates/bn PPP$ GDP 0.2 108
Market sophistication 34.2 122
4.1 Credit 22.7 120
4.1.1 Ease of getting credit* 40.0 113
4.1.2 Domestic credit to private sector, % GDP 14.2 121
4.1.3 Microfinance gross loans, % GDP 1.5 20 ●
4.2 Investment 36.0 [43]
4.2.1 Ease of protecting minority investors* 36.0 116
4.2.2 Market capitalization, % GDP n/a n/a
4.2.3 Venture capital investors, deals/bn PPP$ GDP n/a n/a
4.2.4 Venture capital recipients, deals/bn PPP$ GDP n/a n/a
4.3 Trade, diversification, and market scale 44.1 121
4.3.1 Applied tariff rate, weighted avg., % 7.5 100
4.3.2 Domestic industry diversification n/a n/a
4.3.3 Domestic market scale, bn PPP$ 45.4 106
NOTES: ● indicates a strength; ○ a weakness; ◆ an income group strength; ◇ an income group weakness; * an index; †
a survey question. indicates that
the
economy’s data are older than the base year; see appendices for details, including the year of the data, at http://globalinnovationindex.org. Square
brackets [ ] indicate
that the data minimum coverage (DMC) requirements were not met at the sub-pillar or pillar level.](https://image.slidesharecdn.com/e-220805033615-e8521670/75/E-INDEX-2021-pdf-131-2048.jpg)
![112 Global Innovation Index 2021
Malawi GII 2021 rank
107
Output rank Input rank Income Region Population (mn) GDP, PPP$ (bn) GDP per capita, PPP$ GII 2020 rank
93 118 Low SSF 19.1 20.8 995 111
Score/
Value Rank
Business sophistication 20.1 95 ◆
5.1 Knowledge workers 15.3 [111]
5.1.1 Knowledge-intensive employment, % 3.7 122 ○ ◇
5.1.2 Firms offering formal training, % 32.9 45 ◆
5.1.3 GERD performed by business, % GDP n/a n/a
5.1.4 GERD financed by business, % n/a n/a
5.1.5 Females employed w/advanced degrees, % 0.6 119
5.2 Innovation linkages 22.4 57
5.2.1 University-industry RD collaboration†
31.7 106
5.2.2 State of cluster development and depth†
35.5 113
5.2.3 GERD financed by abroad, % GDP n/a n/a
5.2.4 Joint venture/strategic alliance deals/bn PPP$ GDP 0.1 22 ● ◆
5.2.5 Patent families/bn PPP$ GDP 0.0 100 ○ ◇
5.3 Knowledge absorption 22.7 77
5.3.1 Intellectual property payments, % total trade 0.2 96
5.3.2 High-tech imports, % total trade 9.8 38 ●
5.3.3 ICT services imports, % total trade 1.1 70
5.3.4 FDI net inflows, % GDP 1.4 99
5.3.5 Research talent, % in businesses n/a n/a
Knowledge and technology outputs 15.8 84 ◆
6.1 Knowledge creation 18.0 56 ● ◆
6.1.1 Patents by origin/bn PPP$ GDP 0.2 100
6.1.2 PCT patents by origin/bn PPP$ GDP 0.0 98 ○ ◇
6.1.3 Utility models by origin/bn PPP$ GDP n/a n/a
6.1.4 Scientific and technical articles/bn PPP$ GDP 35.1 26 ● ◆
6.1.5 Citable documents H-index 8.0 85 ◆
6.2 Knowledge impact 17.5 114
6.2.1 Labor productivity growth, % 1.2 39 ●
6.2.2 New businesses/th pop. 15–64 0.1 119 ○
6.2.3 Software spending, % GDP 0.0 107
6.2.4 ISO 9001 quality certificates/bn PPP$ GDP 0.9 112
6.2.5 High-tech manufacturing, % 8.6 93
6.3 Knowledge diffusion 11.8 85
6.3.1 Intellectual property receipts, % total trade n/a n/a
6.3.2 Production and export complexity 18.0 113
6.3.3 High-tech exports, % total trade 0.2 106
6.3.4 ICT services exports, % total trade 2.3 48 ●
Creative outputs 16.4 [97]
7.1 Intangible assets 25.4 [86]
7.1.1 Trademarks by origin/bn PPP$ GDP 28.0 78
7.1.2 Global brand value, top 5,000, % GDP n/a n/a
7.1.3 Industrial designs by origin/bn PPP$ GDP n/a n/a
7.1.4 ICTs and organizational model creation†
28.7 124 ○ ◇
7.2 Creative goods and services 7.5 [91]
7.2.1 Cultural and creative services exports, % total trade 0.1 76
7.2.2 National feature films/mn pop. 15–69 n/a n/a
7.2.3 Entertainment and media market/th pop. 15–69 n/a n/a
7.2.4 Printing and other media, % manufacturing 1.2 36 ● ◇
7.2.5 Creative goods exports, % total trade 0.2 85 ◆
7.3 Online creativity 7.4 111
7.3.1 Generic top-level domains (TLDs)/th pop. 15–69 0.2 118
7.3.2 Country-code TLDs/th pop. 15–69 0.0 125
7.3.3 Wikipedia edits/mn pop. 15–69 25.5 112
7.3.4 Mobile app creation/bn PPP$ GDP n/a n/a
Score/
Value Rank
Institutions 51.8 105
1.1 Political environment 41.7 112
1.1.1 Political and operational stability* 57.1 106
1.1.2 Government effectiveness* 34.0 114
1.2 Regulatory environment 57.2 89
1.2.1 Regulatory quality* 25.2 112
1.2.2 Rule of law* 38.0 81
1.2.3 Cost of redundancy dismissal 16.7 65
1.3 Business environment 56.4 115
1.3.1 Ease of starting a business* 77.9 115
1.3.2 Ease of resolving insolvency* 34.9 112
Human capital and research 11.8 122
2.1 Education 34.2 107
2.1.1 Expenditure on education, % GDP 4.7 51
2.1.2 Government funding/pupil, secondary, % GDP/cap 24.0 20 ●
2.1.3 School life expectancy, years 10.9 100
2.1.4 PISA scales in reading, maths and science n/a n/a
2.1.5 Pupil-teacher ratio, secondary 68.1 123 ○ ◇
2.2 Tertiary education 1.0 129 ○ ◇
2.2.1 Tertiary enrolment, % gross 0.8 128 ○ ◇
2.2.2 Graduates in science and engineering, % n/a n/a
2.2.3 Tertiary inbound mobility, % 1.1 86
2.3 Research and development (RD) 0.1 117
2.3.1 Researchers, FTE/mn pop. 50.4 93
2.3.2 Gross expenditure on RD, % GDP n/a n/a
2.3.3 Global corporate RD investors, top 3, mn US$ 0.0 41 ○ ◇
2.3.4 QS university ranking, top 3* 0.0 74 ○ ◇
Infrastructure 21.1 127
3.1 Informationandcommunicationtechnologies(ICTs) 30.5 124
3.1.1 ICT access* 22.8 131 ○
3.1.2 ICT use* 15.2 120
3.1.3 Government’s online service* 42.4 115
3.1.4 E-participation* 41.7 111
3.2 General infrastructure 13.1 122
3.2.1 Electricity output, GWh/mn pop. n/a n/a
3.2.2 Logistics performance* 25.0 93
3.2.3 Gross capital formation, % GDP 10.7 123
3.3 Ecological sustainability 19.6 102
3.3.1 GDP/unit of energy use n/a n/a
3.3.2 Environmental performance* 38.3 93 ◆
3.3.3 ISO 14001 environmental certificates/bn PPP$ GDP 0.2 114
Market sophistication 43.7 81 ◆
4.1 Credit 38.6 74
4.1.1 Ease of getting credit* 90.0 10 ● ◆
4.1.2 Domestic credit to private sector, % GDP 10.5 128 ○
4.1.3 Microfinance gross loans, % GDP 0.5 36 ●
4.2 Investment 37.9 [41]
4.2.1 Ease of protecting minority investors* 58.0 77 ◆
4.2.2 Market capitalization, % GDP n/a n/a
4.2.3 Venture capital investors, deals/bn PPP$ GDP n/a n/a
4.2.4 Venture capital recipients, deals/bn PPP$ GDP 0.0 31 ●
4.3 Trade, diversification, and market scale 54.8 109
4.3.1 Applied tariff rate, weighted avg., % 4.2 78 ◆
4.3.2 Domestic industry diversification 70.2 97
4.3.3 Domestic market scale, bn PPP$ 20.8 128 ◇
NOTES: ● indicates a strength; ○ a weakness; ◆ an income group strength; ◇ an income group weakness; * an index; †
a survey question. indicates that
the
economy’s data are older than the base year; see appendices for details, including the year of the data, at http://globalinnovationindex.org. Square
brackets [ ] indicate
that the data minimum coverage (DMC) requirements were not met at the sub-pillar or pillar level.](https://image.slidesharecdn.com/e-220805033615-e8521670/75/E-INDEX-2021-pdf-132-2048.jpg)
![113
GII 2021 Economy profiles
Malaysia GII 2021 rank
36
Output rank Input rank Income Region Population (mn) GDP, PPP$ (bn) GDP per capita, PPP$ GII 2020 rank
34 36 Upper middle SEAO 32.4 900.4 27,287 33
Score/
Value Rank
Business sophistication 34.1 39 ◆
5.1 Knowledge workers 30.2 68
5.1.1 Knowledge-intensive employment, % 27.5 55
5.1.2 Firms offering formal training, % 18.5 82 ○
5.1.3 GERD performed by business, % GDP 0.5 39
5.1.4 GERD financed by business, % 38.2 46
5.1.5 Females employed w/advanced degrees, % 12.5 59
5.2 Innovation linkages 28.8 38 ◆
5.2.1 University-industry RD collaboration†
58.8 25 ◆
5.2.2 State of cluster development and depth†
65.2 13 ● ◆
5.2.3 GERD financed by abroad, % GDP 0.1 48
5.2.4 Joint venture/strategic alliance deals/bn PPP$ GDP 0.1 25 ◆
5.2.5 Patent families/bn PPP$ GDP 0.2 51
5.3 Knowledge absorption 43.3 24 ◆
5.3.1 Intellectual property payments, % total trade 0.9 42
5.3.2 High-tech imports, % total trade 25.5 4 ● ◆
5.3.3 ICT services imports, % total trade 1.6 49
5.3.4 FDI net inflows, % GDP 2.6 67
5.3.5 Research talent, % in businesses 15.8 59 ○
Knowledge and technology outputs 33.4 31 ◆
6.1 Knowledge creation 12.8 69
6.1.1 Patents by origin/bn PPP$ GDP 1.1 61
6.1.2 PCT patents by origin/bn PPP$ GDP 0.3 43
6.1.3 Utility models by origin/bn PPP$ GDP 0.1 53 ○
6.1.4 Scientific and technical articles/bn PPP$ GDP 15.3 56
6.1.5 Citable documents H-index 20.1 41
6.2 Knowledge impact 38.5 30 ◆
6.2.1 Labor productivity growth, % −0.3 75
6.2.2 New businesses/th pop. 15–64 2.4 52
6.2.3 Software spending, % GDP 0.3 36
6.2.4 ISO 9001 quality certificates/bn PPP$ GDP 10.7 27
6.2.5 High-tech manufacturing, % 44.4 20 ◆
6.3 Knowledge diffusion 48.9 14 ● ◆
6.3.1 Intellectual property receipts, % total trade 0.1 53
6.3.2 Production and export complexity 67.7 26 ◆
6.3.3 High-tech exports, % total trade 38.6 1 ● ◆
6.3.4 ICT services exports, % total trade 1.3 72
Creative outputs 34.5 37 ◆
7.1 Intangible assets 40.5 39
7.1.1 Trademarks by origin/bn PPP$ GDP 23.8 86 ○
7.1.2 Global brand value, top 5,000, % GDP 153.2 10 ● ◆
7.1.3 Industrial designs by origin/bn PPP$ GDP 0.6 82 ○
7.1.4 ICTs and organizational model creation†
71.9 17 ◆
7.2 Creative goods and services 41.1 10 ● ◆
7.2.1 Cultural and creative services exports, % total trade 0.3 64
7.2.2 National feature films/mn pop. 15–69 3.8 50
7.2.3 Entertainment and media market/th pop. 15–69 12.2 33 ◆
7.2.4 Printing and other media, % manufacturing 0.8 69 ○
7.2.5 Creative goods exports, % total trade 8.8 1 ● ◆
7.3 Online creativity 15.8 71
7.3.1 Generic top-level domains (TLDs)/th pop. 15–69 6.3 50
7.3.2 Country-code TLDs/th pop. 15–69 4.0 58
7.3.3 Wikipedia edits/mn pop. 15–69 49.7 65
7.3.4 Mobile app creation/bn PPP$ GDP 3.3 64
Score/
Value Rank
Institutions 72.3 41 ◆
1.1 Political environment 76.5 29 ◆
1.1.1 Political and operational stability* 83.9 13 ◆
1.1.2 Government effectiveness* 72.8 33 ◆
1.2 Regulatory environment 65.1 65
1.2.1 Regulatory quality* 61.1 41 ◆
1.2.2 Rule of law* 62.3 39 ◆
1.2.3 Cost of redundancy dismissal 23.9 103 ○
1.3 Business environment 75.2 50
1.3.1 Ease of starting a business* 83.3 97 ○
1.3.2 Ease of resolving insolvency* 67.0 37
Human capital and research 40.6 39 ◆
2.1 Education 46.0 77
2.1.1 Expenditure on education, % GDP 4.2 63
2.1.2 Government funding/pupil, secondary, % GDP/cap 19.2 53
2.1.3 School life expectancy, years 13.7 73
2.1.4 PISA scales in reading, maths and science 430.9 48
2.1.5 Pupil-teacher ratio, secondary 11.4 43
2.2 Tertiary education 49.6 15 ● ◆
2.2.1 Tertiary enrolment, % gross 43.1 69
2.2.2 Graduates in science and engineering, % 39.2 5 ● ◆
2.2.3 Tertiary inbound mobility, % 6.7 37
2.3 Research and development (RD) 26.3 40 ◆
2.3.1 Researchers, FTE/mn pop. 2,184.7 37 ◆
2.3.2 Gross expenditure on RD, % GDP 1.0 37 ◆
2.3.3 Global corporate RD investors, top 3, mn US$ 0.0 41 ○ ◇
2.3.4 QS university ranking, top 3* 58.3 14 ● ◆
Infrastructure 46.7 51
3.1 Informationandcommunicationtechnologies(ICTs) 79.2 35 ◆
3.1.1 ICT access* 79.2 36 ◆
3.1.2 ICT use* 66.6 55
3.1.3 Government’s online service* 85.3 24
3.1.4 E-participation* 85.7 29
3.2 General infrastructure 31.3 55
3.2.1 Electricity output, GWh/mn pop. 5,406.7 39 ◆
3.2.2 Logistics performance* 54.5 40 ◆
3.2.3 Gross capital formation, % GDP 21.6 73
3.3 Ecological sustainability 29.6 61
3.3.1 GDP/unit of energy use 10.2 65
3.3.2 Environmental performance* 47.9 62
3.3.3 ISO 14001 environmental certificates/bn PPP$ GDP 2.5 34
Market sophistication 55.3 30 ◆
4.1 Credit 50.5 31 ◆
4.1.1 Ease of getting credit* 75.0 34
4.1.2 Domestic credit to private sector, % GDP 120.9 17 ● ◆
4.1.3 Microfinance gross loans, % GDP 0.1 56 ○
4.2 Investment 35.2 49
4.2.1 Ease of protecting minority investors* 88.0 2 ● ◆
4.2.2 Market capitalization, % GDP 121.5 8 ● ◆
4.2.3 Venture capital investors, deals/bn PPP$ GDP 0.0 52
4.2.4 Venture capital recipients, deals/bn PPP$ GDP 0.0 58
4.3 Trade, diversification, and market scale 80.2 28
4.3.1 Applied tariff rate, weighted avg., % 4.0 74
4.3.2 Domestic industry diversification 94.4 32
4.3.3 Domestic market scale, bn PPP$ 900.4 29
NOTES: ● indicates a strength; ○ a weakness; ◆ an income group strength; ◇ an income group weakness; * an index; †
a survey question. indicates that
the
economy’s data are older than the base year; see appendices for details, including the year of the data, at http://globalinnovationindex.org. Square
brackets [ ] indicate
that the data minimum coverage (DMC) requirements were not met at the sub-pillar or pillar level.](https://image.slidesharecdn.com/e-220805033615-e8521670/75/E-INDEX-2021-pdf-133-2048.jpg)
![114 Global Innovation Index 2021
Mali GII 2021 rank
124
Output rank Input rank Income Region Population (mn) GDP, PPP$ (bn) GDP per capita, PPP$ GII 2020 rank
114 126 Low SSF 20.3 47.6 2,421 123
Score/
Value Rank
Business sophistication 17.7 109
5.1 Knowledge workers 5.5 129 ○ ◇
5.1.1 Knowledge-intensive employment, % 4.3 120 ○
5.1.2 Firms offering formal training, % 17.7 85
5.1.3 GERD performed by business, % GDP n/a n/a
5.1.4 GERD financed by business, % 0.8 95
5.1.5 Females employed w/advanced degrees, % 0.5 121 ○
5.2 Innovation linkages 20.0 70
5.2.1 University-industry RD collaboration†
41.1 71
5.2.2 State of cluster development and depth†
43.5 83 ◆
5.2.3 GERD financed by abroad, % GDP 0.1 32 ●
5.2.4 Joint venture/strategic alliance deals/bn PPP$ GDP 0.0 76
5.2.5 Patent families/bn PPP$ GDP 0.0 100 ○ ◇
5.3 Knowledge absorption 27.6 63 ● ◆
5.3.1 Intellectual property payments, % total trade 0.0 116
5.3.2 High-tech imports, % total trade 6.8 81
5.3.3 ICT services imports, % total trade 2.6 16 ● ◆
5.3.4 FDI net inflows, % GDP 3.1 46 ●
5.3.5 Research talent, % in businesses 31.4 41 ● ◆
Knowledge and technology outputs 13.6 94
6.1 Knowledge creation 3.6 118
6.1.1 Patents by origin/bn PPP$ GDP 0.1 117
6.1.2 PCT patents by origin/bn PPP$ GDP 0.0 98 ○ ◇
6.1.3 Utility models by origin/bn PPP$ GDP n/a n/a
6.1.4 Scientific and technical articles/bn PPP$ GDP 4.9 109
6.1.5 Citable documents H-index 5.1 104
6.2 Knowledge impact 18.5 112
6.2.1 Labor productivity growth, % 0.7 51 ●
6.2.2 New businesses/th pop. 15–64 0.3 108
6.2.3 Software spending, % GDP 0.0 115
6.2.4 ISO 9001 quality certificates/bn PPP$ GDP 0.5 123
6.2.5 High-tech manufacturing, % n/a n/a
6.3 Knowledge diffusion 18.6 58 ● ◆
6.3.1 Intellectual property receipts, % total trade 0.0 108
6.3.2 Production and export complexity 32.6 84 ◆
6.3.3 High-tech exports, % total trade 0.1 123
6.3.4 ICT services exports, % total trade 4.6 18 ● ◆
Creative outputs 9.6 122
7.1 Intangible assets 13.9 121
7.1.1 Trademarks by origin/bn PPP$ GDP 5.6 119
7.1.2 Global brand value, top 5,000, % GDP 0.0 80 ○ ◇
7.1.3 Industrial designs by origin/bn PPP$ GDP 0.3 96
7.1.4 ICTs and organizational model creation†
45.0 96
7.2 Creative goods and services 1.0 [129]
7.2.1 Cultural and creative services exports, % total trade 0.1 79
7.2.2 National feature films/mn pop. 15–69 0.1 108 ○ ◇
7.2.3 Entertainment and media market/th pop. 15–69 n/a n/a
7.2.4 Printing and other media, % manufacturing n/a n/a
7.2.5 Creative goods exports, % total trade 0.0 126
7.3 Online creativity 9.7 95
7.3.1 Generic top-level domains (TLDs)/th pop. 15–69 0.1 122
7.3.2 Country-code TLDs/th pop. 15–69 6.7 45 ● ◆
7.3.3 Wikipedia edits/mn pop. 15–69 25.7 111
7.3.4 Mobile app creation/bn PPP$ GDP n/a n/a
Score/
Value Rank
Institutions 51.3 106
1.1 Political environment 32.4 130 ○
1.1.1 Political and operational stability* 42.9 130 ○
1.1.2 Government effectiveness* 27.2 126
1.2 Regulatory environment 57.7 85
1.2.1 Regulatory quality* 28.5 107
1.2.2 Rule of law* 24.7 114
1.2.3 Cost of redundancy dismissal 13.6 50 ●
1.3 Business environment 63.8 89
1.3.1 Ease of starting a business* 84.3 95
1.3.2 Ease of resolving insolvency* 43.4 91
Human capital and research 11.3 123
2.1 Education 29.6 115
2.1.1 Expenditure on education, % GDP 3.8 77
2.1.2 Government funding/pupil, secondary, % GDP/cap 25.4 16 ●
2.1.3 School life expectancy, years 7.5 118 ○ ◇
2.1.4 PISA scales in reading, maths and science n/a n/a
2.1.5 Pupil-teacher ratio, secondary 29.7 117
2.2 Tertiary education 3.0 126 ○
2.2.1 Tertiary enrolment, % gross 5.5 122
2.2.2 Graduates in science and engineering, % n/a n/a
2.2.3 Tertiary inbound mobility, % 0.9 91
2.3 Research and development (RD) 1.5 101
2.3.1 Researchers, FTE/mn pop. 32.9 100
2.3.2 Gross expenditure on RD, % GDP 0.3 80
2.3.3 Global corporate RD investors, top 3, mn US$ 0.0 41 ○ ◇
2.3.4 QS university ranking, top 3* 0.0 74 ○ ◇
Infrastructure 22.5 124
3.1 Informationandcommunicationtechnologies(ICTs) 30.0 125
3.1.1 ICT access* 36.9 113 ◆
3.1.2 ICT use* 16.3 118
3.1.3 Government’s online service* 34.7 122
3.1.4 E-participation* 32.1 123
3.2 General infrastructure 22.0 98
3.2.1 Electricity output, GWh/mn pop. n/a n/a
3.2.2 Logistics performance* 25.2 92
3.2.3 Gross capital formation, % GDP 18.5 98
3.3 Ecological sustainability 15.4 124
3.3.1 GDP/unit of energy use n/a n/a
3.3.2 Environmental performance* 29.4 123
3.3.3 ISO 14001 environmental certificates/bn PPP$ GDP 0.3 104
Market sophistication 34.5 121
4.1 Credit 16.5 125
4.1.1 Ease of getting credit* 30.0 122
4.1.2 Domestic credit to private sector, % GDP 24.5 107
4.1.3 Microfinance gross loans, % GDP 0.4 41 ●
4.2 Investment 42.0 [28]
4.2.1 Ease of protecting minority investors* 42.0 102
4.2.2 Market capitalization, % GDP n/a n/a
4.2.3 Venture capital investors, deals/bn PPP$ GDP n/a n/a
4.2.4 Venture capital recipients, deals/bn PPP$ GDP n/a n/a
4.3 Trade, diversification, and market scale 45.0 120
4.3.1 Applied tariff rate, weighted avg., % 7.2 98
4.3.2 Domestic industry diversification n/a n/a
4.3.3 Domestic market scale, bn PPP$ 47.6 104
NOTES: ● indicates a strength; ○ a weakness; ◆ an income group strength; ◇ an income group weakness; * an index; †
a survey question. indicates that
the
economy’s data are older than the base year; see appendices for details, including the year of the data, at http://globalinnovationindex.org. Square
brackets [ ] indicate
that the data minimum coverage (DMC) requirements were not met at the sub-pillar or pillar level.](https://image.slidesharecdn.com/e-220805033615-e8521670/75/E-INDEX-2021-pdf-134-2048.jpg)
![115
GII 2021 Economy profiles
Malta GII 2021 rank
27
Output rank Input rank Income Region Population (mn) GDP, PPP$ (bn) GDP per capita, PPP$ GII 2020 rank
22 29 High EUR 0.4 21.6 43,087 27
Score/
Value Rank
Business sophistication 53.7 14
5.1 Knowledge workers 52.9 23
5.1.1 Knowledge-intensive employment, % 44.6 19
5.1.2 Firms offering formal training, % 49.9 18
5.1.3 GERD performed by business, % GDP 0.4 45
5.1.4 GERD financed by business, % 59.6 14
5.1.5 Females employed w/advanced degrees, % 16.0 43
5.2 Innovation linkages 48.6 14
5.2.1 University-industry RD collaboration†
43.8 60
5.2.2 State of cluster development and depth†
53.5 40
5.2.3 GERD financed by abroad, % GDP 0.1 50
5.2.4 Joint venture/strategic alliance deals/bn PPP$ GDP 0.5 1 ● ◆
5.2.5 Patent families/bn PPP$ GDP 2.0 18
5.3 Knowledge absorption 59.5 4 ● ◆
5.3.1 Intellectual property payments, % total trade 4.0 4 ● ◆
5.3.2 High-tech imports, % total trade 5.4 107 ○
5.3.3 ICT services imports, % total trade 1.8 40
5.3.4 FDI net inflows, % GDP 28.5 1 ● ◆
5.3.5 Research talent, % in businesses 52.0 19
Knowledge and technology outputs 28.3 44
6.1 Knowledge creation 21.5 50
6.1.1 Patents by origin/bn PPP$ GDP 2.6 30
6.1.2 PCT patents by origin/bn PPP$ GDP 1.9 20
6.1.3 Utility models by origin/bn PPP$ GDP n/a n/a
6.1.4 Scientific and technical articles/bn PPP$ GDP 20.4 44
6.1.5 Citable documents H-index 6.8 91 ○ ◇
6.2 Knowledge impact 37.6 33
6.2.1 Labor productivity growth, % −3.7 115 ○ ◇
6.2.2 New businesses/th pop. 15–64 17.5 6 ◆
6.2.3 Software spending, % GDP 0.3 34
6.2.4 ISO 9001 quality certificates/bn PPP$ GDP 9.5 28
6.2.5 High-tech manufacturing, % 38.4 30
6.3 Knowledge diffusion 25.9 44
6.3.1 Intellectual property receipts, % total trade 2.8 9 ◆
6.3.2 Production and export complexity n/a n/a
6.3.3 High-tech exports, % total trade 3.9 41
6.3.4 ICT services exports, % total trade 0.6 96 ○
Creative outputs 52.0 9 ◆
7.1 Intangible assets 54.5 12 ◆
7.1.1 Trademarks by origin/bn PPP$ GDP 104.7 5 ● ◆
7.1.2 Global brand value, top 5,000, % GDP 86.2 24
7.1.3 Industrial designs by origin/bn PPP$ GDP 4.4 26
7.1.4 ICTs and organizational model creation†
64.4 31
7.2 Creative goods and services 45.4 5 ● ◆
7.2.1 Cultural and creative services exports, % total trade 12.6 1 ● ◆
7.2.2 National feature films/mn pop. 15–69 15.7 7 ◆
7.2.3 Entertainment and media market/th pop. 15–69 14.9 30 ◇
7.2.4 Printing and other media, % manufacturing 6.7 1 ● ◆
7.2.5 Creative goods exports, % total trade 0.2 79 ○
7.3 Online creativity 53.8 16
7.3.1 Generic top-level domains (TLDs)/th pop. 15–69 95.8 3 ● ◆
7.3.2 Country-code TLDs/th pop. 15–69 18.5 31
7.3.3 Wikipedia edits/mn pop. 15–69 76.5 17
7.3.4 Mobile app creation/bn PPP$ GDP 20.6 26
Score/
Value Rank
Institutions 73.9 37
1.1 Political environment 73.3 36
1.1.1 Political and operational stability* 80.4 29
1.1.2 Government effectiveness* 69.7 37
1.2 Regulatory environment 85.1 19
1.2.1 Regulatory quality* 68.5 38
1.2.2 Rule of law* 71.8 32
1.2.3 Cost of redundancy dismissal 8.0 1 ● ◆
1.3 Business environment 63.3 93 ○ ◇
1.3.1 Ease of starting a business* 88.2 69
1.3.2 Ease of resolving insolvency* 38.3 105 ○ ◇
Human capital and research 39.3 41
2.1 Education 62.2 21
2.1.1 Expenditure on education, % GDP 4.8 46
2.1.2 Government funding/pupil, secondary, % GDP/cap 29.2 9 ◆
2.1.3 School life expectancy, years 16.8 19
2.1.4 PISA scales in reading, maths and science 458.8 42
2.1.5 Pupil-teacher ratio, secondary 7.1 2 ● ◆
2.2 Tertiary education 36.5 53
2.2.1 Tertiary enrolment, % gross 64.9 41
2.2.2 Graduates in science and engineering, % 20.6 69 ○
2.2.3 Tertiary inbound mobility, % 10.0 22
2.3 Research and development (RD) 19.2 45
2.3.1 Researchers, FTE/mn pop. 2,116.4 39
2.3.2 Gross expenditure on RD, % GDP 0.6 59
2.3.3 Global corporate RD investors, top 3, mn US$ 40.1 39
2.3.4 QS university ranking, top 3* 0.0 74 ○ ◇
Infrastructure 56.4 18
3.1 Informationandcommunicationtechnologies(ICTs) 85.0 20
3.1.1 ICT access* 92.2 5 ● ◆
3.1.2 ICT use* 83.2 13
3.1.3 Government’s online service* 81.2 40
3.1.4 E-participation* 83.3 38
3.2 General infrastructure 26.9 71 ◇
3.2.1 Electricity output, GWh/mn pop. 4,152.0 54
3.2.2 Logistics performance* 35.6 68 ◇
3.2.3 Gross capital formation, % GDP 23.4 56
3.3 Ecological sustainability 57.4 3 ● ◆
3.3.1 GDP/unit of energy use 28.7 3 ● ◆
3.3.2 Environmental performance* 70.7 23
3.3.3 ISO 14001 environmental certificates/bn PPP$ GDP 2.2 36
Market sophistication 47.0 63
4.1 Credit 32.8 98 ○ ◇
4.1.1 Ease of getting credit* 35.0 118 ○ ◇
4.1.2 Domestic credit to private sector, % GDP 75.9 41
4.1.3 Microfinance gross loans, % GDP n/a n/a
4.2 Investment 41.4 33
4.2.1 Ease of protecting minority investors* 66.0 50
4.2.2 Market capitalization, % GDP 36.4 42
4.2.3 Venture capital investors, deals/bn PPP$ GDP 0.2 13
4.2.4 Venture capital recipients, deals/bn PPP$ GDP 0.1 16
4.3 Trade, diversification, and market scale 66.9 72
4.3.1 Applied tariff rate, weighted avg., % 1.8 25
4.3.2 Domestic industry diversification 93.4 40
4.3.3 Domestic market scale, bn PPP$ 21.6 127 ○ ◇
NOTES: ● indicates a strength; ○ a weakness; ◆ an income group strength; ◇ an income group weakness; * an index; †
a survey question. indicates that
the
economy’s data are older than the base year; see appendices for details, including the year of the data, at http://globalinnovationindex.org. Square
brackets [ ] indicate
that the data minimum coverage (DMC) requirements were not met at the sub-pillar or pillar level.](https://image.slidesharecdn.com/e-220805033615-e8521670/75/E-INDEX-2021-pdf-135-2048.jpg)
![116 Global Innovation Index 2021
Mauritius GII 2021 rank
52
Output rank Input rank Income Region Population (mn) GDP, PPP$ (bn) GDP per capita, PPP$ GII 2020 rank
58 48 High SSF 1.3 26.3 20,719 52
Score/
Value Rank
Business sophistication 17.1 111 ○ ◇
5.1 Knowledge workers 15.9 110 ○ ◇
5.1.1 Knowledge-intensive employment, % 24.1 64 ◇
5.1.2 Firms offering formal training, % n/a n/a
5.1.3 GERD performed by business, % GDP 0.0 81 ○ ◇
5.1.4 GERD financed by business, % 4.1 85 ○ ◇
5.1.5 Females employed w/advanced degrees, % 9.2 74 ◇
5.2 Innovation linkages 17.9 85 ◇
5.2.1 University-industry RD collaboration†
31.1 109 ○ ◇
5.2.2 State of cluster development and depth†
47.4 60
5.2.3 GERD financed by abroad, % GDP 0.0 86 ○ ◇
5.2.4 Joint venture/strategic alliance deals/bn PPP$ GDP 0.0 38
5.2.5 Patent families/bn PPP$ GDP 0.2 46
5.3 Knowledge absorption 17.5 105 ◇
5.3.1 Intellectual property payments, % total trade 0.2 89
5.3.2 High-tech imports, % total trade 6.0 97
5.3.3 ICT services imports, % total trade 1.8 37
5.3.4 FDI net inflows, % GDP 3.2 42
5.3.5 Research talent, % in businesses 4.4 72 ○ ◇
Knowledge and technology outputs 13.6 93 ◇
6.1 Knowledge creation 5.9 [104]
6.1.1 Patents by origin/bn PPP$ GDP 0.1 108 ○
6.1.2 PCT patents by origin/bn PPP$ GDP n/a n/a
6.1.3 Utility models by origin/bn PPP$ GDP n/a n/a
6.1.4 Scientific and technical articles/bn PPP$ GDP 8.9 94 ◇
6.1.5 Citable documents H-index 3.5 118 ○ ◇
6.2 Knowledge impact 21.4 95 ◇
6.2.1 Labor productivity growth, % −1.9 99 ○
6.2.2 New businesses/th pop. 15–64 9.3 18 ●
6.2.3 Software spending, % GDP 0.2 76 ◇
6.2.4 ISO 9001 quality certificates/bn PPP$ GDP 6.6 42
6.2.5 High-tech manufacturing, % 3.3 106 ○ ◇
6.3 Knowledge diffusion 13.5 75 ◇
6.3.1 Intellectual property receipts, % total trade 0.0 93
6.3.2 Production and export complexity 39.9 68 ◇
6.3.3 High-tech exports, % total trade 0.4 95 ◇
6.3.4 ICT services exports, % total trade 2.2 49
Creative outputs 36.3 31
7.1 Intangible assets 53.3 14 ●
7.1.1 Trademarks by origin/bn PPP$ GDP 85.0 17 ● ◆
7.1.2 Global brand value, top 5,000, % GDP n/a n/a
7.1.3 Industrial designs by origin/bn PPP$ GDP 3.8 29
7.1.4 ICTs and organizational model creation†
53.2 65 ◇
7.2 Creative goods and services 19.6 56
7.2.1 Cultural and creative services exports, % total trade 0.6 42
7.2.2 National feature films/mn pop. 15–69 9.5 21
7.2.3 Entertainment and media market/th pop. 15–69 n/a n/a
7.2.4 Printing and other media, % manufacturing 1.8 19
7.2.5 Creative goods exports, % total trade 0.7 56
7.3 Online creativity 19.2 59 ◇
7.3.1 Generic top-level domains (TLDs)/th pop. 15–69 13.0 35
7.3.2 Country-code TLDs/th pop. 15–69 2.4 65 ◇
7.3.3 Wikipedia edits/mn pop. 15–69 59.7 52
7.3.4 Mobile app creation/bn PPP$ GDP 0.4 81
Score/
Value Rank
Institutions 81.2 21 ●
1.1 Political environment 76.4 30
1.1.1 Political and operational stability* 89.3 6 ● ◆
1.1.2 Government effectiveness* 70.0 36
1.2 Regulatory environment 83.2 24
1.2.1 Regulatory quality* 69.5 35
1.2.2 Rule of law* 66.8 34
1.2.3 Cost of redundancy dismissal 8.9 23 ●
1.3 Business environment 84.1 21 ●
1.3.1 Ease of starting a business* 94.5 19 ●
1.3.2 Ease of resolving insolvency* 73.8 26
Human capital and research 30.6 71 ◇
2.1 Education 58.6 35
2.1.1 Expenditure on education, % GDP 4.7 50
2.1.2 Government funding/pupil, secondary, % GDP/cap 30.4 6 ● ◆
2.1.3 School life expectancy, years 15.1 51
2.1.4 PISA scales in reading, maths and science n/a n/a
2.1.5 Pupil-teacher ratio, secondary 12.2 50
2.2 Tertiary education 30.1 75 ◇
2.2.1 Tertiary enrolment, % gross 40.6 72 ◇
2.2.2 Graduates in science and engineering, % 23.3 51
2.2.3 Tertiary inbound mobility, % 5.4 45
2.3 Research and development (RD) 3.1 88 ◇
2.3.1 Researchers, FTE/mn pop. 473.9 70 ◇
2.3.2 Gross expenditure on RD, % GDP 0.3 77 ◇
2.3.3 Global corporate RD investors, top 3, mn US$ 0.0 41 ○ ◇
2.3.4 QS university ranking, top 3* 0.0 74 ○ ◇
Infrastructure 42.4 65 ◇
3.1 Informationandcommunicationtechnologies(ICTs) 68.6 59 ◇
3.1.1 ICT access* 76.2 46
3.1.2 ICT use* 63.9 57 ◇
3.1.3 Government’s online service* 70.0 69 ◇
3.1.4 E-participation* 64.3 80 ◇
3.2 General infrastructure 23.2 92 ◇
3.2.1 Electricity output, GWh/mn pop. 2,475.9 75 ◇
3.2.2 Logistics performance* 31.9 77 ◇
3.2.3 Gross capital formation, % GDP 21.9 69
3.3 Ecological sustainability 35.3 46
3.3.1 GDP/unit of energy use 19.6 8 ● ◆
3.3.2 Environmental performance* 45.1 73 ◇
3.3.3 ISO 14001 environmental certificates/bn PPP$ GDP 0.6 81 ◇
Market sophistication 55.5 29
4.1 Credit 48.7 37
4.1.1 Ease of getting credit* 65.0 61
4.1.2 Domestic credit to private sector, % GDP 80.2 36
4.1.3 Microfinance gross loans, % GDP n/a n/a
4.2 Investment 56.6 14 ●
4.2.1 Ease of protecting minority investors* 78.0 18 ●
4.2.2 Market capitalization, % GDP 68.1 24
4.2.3 Venture capital investors, deals/bn PPP$ GDP 0.9 1 ● ◆
4.2.4 Venture capital recipients, deals/bn PPP$ GDP 0.1 20
4.3 Trade, diversification, and market scale 61.3 89 ◇
4.3.1 Applied tariff rate, weighted avg., % 1.1 13 ●
4.3.2 Domestic industry diversification 75.1 90
4.3.3 Domestic market scale, bn PPP$ 26.2 125 ○ ◇
NOTES: ● indicates a strength; ○ a weakness; ◆ an income group strength; ◇ an income group weakness; * an index; †
a survey question. indicates that
the
economy’s data are older than the base year; see appendices for details, including the year of the data, at http://globalinnovationindex.org. Square
brackets [ ] indicate
that the data minimum coverage (DMC) requirements were not met at the sub-pillar or pillar level.](https://image.slidesharecdn.com/e-220805033615-e8521670/75/E-INDEX-2021-pdf-136-2048.jpg)
![117
GII 2021 Economy profiles
Mexico GII 2021 rank
55
Output rank Input rank Income Region Population (mn) GDP, PPP$ (bn) GDP per capita, PPP$ GII 2020 rank
51 62 Upper middle LCN 128.9 2,424.5 18,804 55
Score/
Value Rank
Business sophistication 27.2 56
5.1 Knowledge workers 28.7 76
5.1.1 Knowledge-intensive employment, % 20.2 79
5.1.2 Firms offering formal training, % 50.8 17 ●
5.1.3 GERD performed by business, % GDP 0.1 68
5.1.4 GERD financed by business, % 18.2 68
5.1.5 Females employed w/advanced degrees, % 9.8 71
5.2 Innovation linkages 17.5 90
5.2.1 University-industry RD collaboration†
38.7 84
5.2.2 State of cluster development and depth†
55.0 36
5.2.3 GERD financed by abroad, % GDP 0.0 91 ○
5.2.4 Joint venture/strategic alliance deals/bn PPP$ GDP 0.0 99
5.2.5 Patent families/bn PPP$ GDP 0.0 64
5.3 Knowledge absorption 35.5 40
5.3.1 Intellectual property payments, % total trade 0.1 110 ◇
5.3.2 High-tech imports, % total trade 18.2 9 ● ◆
5.3.3 ICT services imports, % total trade 0.0 130 ○ ◇
5.3.4 FDI net inflows, % GDP 2.7 61
5.3.5 Research talent, % in businesses 43.7 30
Knowledge and technology outputs 24.8 53
6.1 Knowledge creation 11.3 74
6.1.1 Patents by origin/bn PPP$ GDP 0.5 80
6.1.2 PCT patents by origin/bn PPP$ GDP 0.1 68
6.1.3 Utility models by origin/bn PPP$ GDP 0.2 47
6.1.4 Scientific and technical articles/bn PPP$ GDP 7.8 96
6.1.5 Citable documents H-index 29.1 34 ◆
6.2 Knowledge impact 29.6 64
6.2.1 Labor productivity growth, % −2.7 110 ○
6.2.2 New businesses/th pop. 15–64 1.0 84
6.2.3 Software spending, % GDP 0.2 65
6.2.4 ISO 9001 quality certificates/bn PPP$ GDP 3.0 75
6.2.5 High-tech manufacturing, % 48.9 12 ● ◆
6.3 Knowledge diffusion 33.5 28 ◆
6.3.1 Intellectual property receipts, % total trade 0.0 107 ○ ◇
6.3.2 Production and export complexity 73.7 19 ● ◆
6.3.3 High-tech exports, % total trade 15.3 8 ● ◆
6.3.4 ICT services exports, % total trade 0.0 131 ○ ◇
Creative outputs 28.5 52
7.1 Intangible assets 32.8 56
7.1.1 Trademarks by origin/bn PPP$ GDP 43.0 54
7.1.2 Global brand value, top 5,000, % GDP 63.9 30
7.1.3 Industrial designs by origin/bn PPP$ GDP 0.5 86
7.1.4 ICTs and organizational model creation†
57.9 53
7.2 Creative goods and services 36.9 16 ● ◆
7.2.1 Cultural and creative services exports, % total trade 0.0 111 ○
7.2.2 National feature films/mn pop. 15–69 2.1 65
7.2.3 Entertainment and media market/th pop. 15–69 8.5 38
7.2.4 Printing and other media, % manufacturing 0.4 93 ○ ◇
7.2.5 Creative goods exports, % total trade 10.4 1 ● ◆
7.3 Online creativity 11.6 86
7.3.1 Generic top-level domains (TLDs)/th pop. 15–69 2.6 70
7.3.2 Country-code TLDs/th pop. 15–69 4.1 57
7.3.3 Wikipedia edits/mn pop. 15–69 39.7 84
7.3.4 Mobile app creation/bn PPP$ GDP 1.4 73
Score/
Value Rank
Institutions 61.0 77
1.1 Political environment 49.9 90
1.1.1 Political and operational stability* 55.4 112 ○ ◇
1.1.2 Government effectiveness* 47.2 84
1.2 Regulatory environment 55.0 94
1.2.1 Regulatory quality* 46.2 65
1.2.2 Rule of law* 29.4 105
1.2.3 Cost of redundancy dismissal 22.0 96
1.3 Business environment 78.2 37
1.3.1 Ease of starting a business* 86.1 83
1.3.2 Ease of resolving insolvency* 70.3 31 ◆
Human capital and research 33.2 56
2.1 Education 43.6 82
2.1.1 Expenditure on education, % GDP 4.5 57
2.1.2 Government funding/pupil, secondary, % GDP/cap 13.3 81
2.1.3 School life expectancy, years 14.9 54
2.1.4 PISA scales in reading, maths and science 416.2 57
2.1.5 Pupil-teacher ratio, secondary 17.0 83
2.2 Tertiary education 30.4 74
2.2.1 Tertiary enrolment, % gross 41.5 71
2.2.2 Graduates in science and engineering, % 26.0 34
2.2.3 Tertiary inbound mobility, % 0.2 107 ○ ◇
2.3 Research and development (RD) 25.6 41
2.3.1 Researchers, FTE/mn pop. 327.2 76
2.3.2 Gross expenditure on RD, % GDP 0.3 81
2.3.3 Global corporate RD investors, top 3, mn US$ 49.9 31 ◆
2.3.4 QS university ranking, top 3* 43.2 27 ● ◆
Infrastructure 41.8 67
3.1 Informationandcommunicationtechnologies(ICTs) 70.0 58
3.1.1 ICT access* 58.4 79
3.1.2 ICT use* 57.2 68
3.1.3 Government’s online service* 82.3 38
3.1.4 E-participation* 82.1 41
3.2 General infrastructure 24.9 84
3.2.1 Electricity output, GWh/mn pop. 2,693.7 70
3.2.2 Logistics performance* 46.6 50
3.2.3 Gross capital formation, % GDP 19.3 92
3.3 Ecological sustainability 30.6 56
3.3.1 GDP/unit of energy use 13.0 39
3.3.2 Environmental performance* 52.6 49
3.3.3 ISO 14001 environmental certificates/bn PPP$ GDP 0.7 75
Market sophistication 48.8 55
4.1 Credit 42.2 59
4.1.1 Ease of getting credit* 90.0 10 ● ◆
4.1.2 Domestic credit to private sector, % GDP 36.6 86
4.1.3 Microfinance gross loans, % GDP 0.2 45
4.2 Investment 19.1 118 ○
4.2.1 Ease of protecting minority investors* 62.0 60
4.2.2 Market capitalization, % GDP 33.4 43
4.2.3 Venture capital investors, deals/bn PPP$ GDP 0.0 80 ○
4.2.4 Venture capital recipients, deals/bn PPP$ GDP 0.0 79
4.3 Trade, diversification, and market scale 85.1 14 ● ◆
4.3.1 Applied tariff rate, weighted avg., % 1.2 15 ●
4.3.2 Domestic industry diversification 88.9 55
4.3.3 Domestic market scale, bn PPP$ 2,424.5 11 ● ◆
NOTES: ● indicates a strength; ○ a weakness; ◆ an income group strength; ◇ an income group weakness; * an index; †
a survey question. indicates that
the
economy’s data are older than the base year; see appendices for details, including the year of the data, at http://globalinnovationindex.org. Square
brackets [ ] indicate
that the data minimum coverage (DMC) requirements were not met at the sub-pillar or pillar level.](https://image.slidesharecdn.com/e-220805033615-e8521670/75/E-INDEX-2021-pdf-137-2048.jpg)
![118 Global Innovation Index 2021
Mongolia GII 2021 rank
58
Output rank Input rank Income Region Population (mn) GDP, PPP$ (bn) GDP per capita, PPP$ GII 2020 rank
55 65 Lower middle SEAO 3.3 41.1 12,259 58
Score/
Value Rank
Business sophistication 24.2 71
5.1 Knowledge workers 37.3 50 ◆
5.1.1 Knowledge-intensive employment, % 26.2 57 ◆
5.1.2 Firms offering formal training, % 66.2 4 ● ◆
5.1.3 GERD performed by business, % GDP 0.0 87 ○
5.1.4 GERD financed by business, % 8.1 79
5.1.5 Females employed w/advanced degrees, % 23.4 18 ● ◆
5.2 Innovation linkages 12.4 123 ○
5.2.1 University-industry RD collaboration†
33.3 98
5.2.2 State of cluster development and depth†
36.1 111
5.2.3 GERD financed by abroad, % GDP 0.0 85
5.2.4 Joint venture/strategic alliance deals/bn PPP$ GDP 0.0 114 ○
5.2.5 Patent families/bn PPP$ GDP 0.0 75
5.3 Knowledge absorption 22.8 76
5.3.1 Intellectual property payments, % total trade 0.2 88
5.3.2 High-tech imports, % total trade 5.2 108
5.3.3 ICT services imports, % total trade 1.2 62
5.3.4 FDI net inflows, % GDP 15.1 6 ● ◆
5.3.5 Research talent, % in businesses n/a n/a
Knowledge and technology outputs 15.0 85
6.1 Knowledge creation 30.5 33 ◆
6.1.1 Patents by origin/bn PPP$ GDP 2.0 37 ◆
6.1.2 PCT patents by origin/bn PPP$ GDP 0.0 98 ○ ◇
6.1.3 Utility models by origin/bn PPP$ GDP 5.4 1 ● ◆
6.1.4 Scientific and technical articles/bn PPP$ GDP 11.5 74
6.1.5 Citable documents H-index 4.8 108
6.2 Knowledge impact 8.7 124 ○ ◇
6.2.1 Labor productivity growth, % n/a n/a
6.2.2 New businesses/th pop. 15–64 5.5 29 ◆
6.2.3 Software spending, % GDP 0.1 80
6.2.4 ISO 9001 quality certificates/bn PPP$ GDP 1.5 97
6.2.5 High-tech manufacturing, % 5.0 99 ○
6.3 Knowledge diffusion 5.9 114
6.3.1 Intellectual property receipts, % total trade 0.0 85
6.3.2 Production and export complexity 23.6 104
6.3.3 High-tech exports, % total trade 0.5 92
6.3.4 ICT services exports, % total trade 0.5 101
Creative outputs 37.5 28 ◆
7.1 Intangible assets 55.1 11 ● ◆
7.1.1 Trademarks by origin/bn PPP$ GDP 261.5 1 ● ◆
7.1.2 Global brand value, top 5,000, % GDP 0.0 80 ○ ◇
7.1.3 Industrial designs by origin/bn PPP$ GDP 20.7 1 ● ◆
7.1.4 ICTs and organizational model creation†
42.8 102
7.2 Creative goods and services 27.3 [31]
7.2.1 Cultural and creative services exports, % total trade n/a n/a
7.2.2 National feature films/mn pop. 15–69 26.1 3 ● ◆
7.2.3 Entertainment and media market/th pop. 15–69 n/a n/a
7.2.4 Printing and other media, % manufacturing 1.1 42
7.2.5 Creative goods exports, % total trade 0.0 115
7.3 Online creativity 12.6 82
7.3.1 Generic top-level domains (TLDs)/th pop. 15–69 0.6 102
7.3.2 Country-code TLDs/th pop. 15–69 2.3 67 ◆
7.3.3 Wikipedia edits/mn pop. 15–69 47.6 70 ◆
7.3.4 Mobile app creation/bn PPP$ GDP 0.1 90
Score/
Value Rank
Institutions 61.2 76 ◆
1.1 Political environment 55.3 76 ◆
1.1.1 Political and operational stability* 73.2 44 ◆
1.1.2 Government effectiveness* 46.3 87
1.2 Regulatory environment 70.1 48 ◆
1.2.1 Regulatory quality* 43.2 73 ◆
1.2.2 Rule of law* 39.7 76
1.2.3 Cost of redundancy dismissal 8.7 18 ● ◆
1.3 Business environment 58.4 110
1.3.1 Ease of starting a business* 86.7 78
1.3.2 Ease of resolving insolvency* 30.1 120 ○
Human capital and research 27.7 81
2.1 Education 45.4 79
2.1.1 Expenditure on education, % GDP 4.1 66
2.1.2 Government funding/pupil, secondary, % GDP/cap 15.4 73
2.1.3 School life expectancy, years 14.6 61 ◆
2.1.4 PISA scales in reading, maths and science n/a n/a
2.1.5 Pupil-teacher ratio, secondary 13.3 57
2.2 Tertiary education 37.0 50 ◆
2.2.1 Tertiary enrolment, % gross 65.6 40 ◆
2.2.2 Graduates in science and engineering, % 25.3 37
2.2.3 Tertiary inbound mobility, % 1.1 87
2.3 Research and development (RD) 0.6 109
2.3.1 Researchers, FTE/mn pop. n/a n/a
2.3.2 Gross expenditure on RD, % GDP 0.1 104 ○
2.3.3 Global corporate RD investors, top 3, mn US$ 0.0 41 ○ ◇
2.3.4 QS university ranking, top 3* 0.0 74 ○ ◇
Infrastructure 33.7 91
3.1 Informationandcommunicationtechnologies(ICTs) 55.8 89
3.1.1 ICT access* 54.2 86
3.1.2 ICT use* 55.2 72 ◆
3.1.3 Government’s online service* 52.9 98
3.1.4 E-participation* 60.7 85
3.2 General infrastructure 28.6 67
3.2.1 Electricity output, GWh/mn pop. 2,061.5 79
3.2.2 Logistics performance* 15.2 116 ○
3.2.3 Gross capital formation, % GDP 33.8 14 ●
3.3 Ecological sustainability 16.6 118
3.3.1 GDP/unit of energy use 7.2 100
3.3.2 Environmental performance* 32.2 114
3.3.3 ISO 14001 environmental certificates/bn PPP$ GDP 0.3 95
Market sophistication 63.4 13 ● ◆
4.1 Credit 59.6 15 ● ◆
4.1.1 Ease of getting credit* 80.0 23
4.1.2 Domestic credit to private sector, % GDP 49.6 72
4.1.3 Microfinance gross loans, % GDP 12.9 1 ● ◆
4.2 Investment 74.0 [8]
4.2.1 Ease of protecting minority investors* 74.0 24 ◆
4.2.2 Market capitalization, % GDP n/a n/a
4.2.3 Venture capital investors, deals/bn PPP$ GDP n/a n/a
4.2.4 Venture capital recipients, deals/bn PPP$ GDP n/a n/a
4.3 Trade, diversification, and market scale 56.5 105
4.3.1 Applied tariff rate, weighted avg., % 5.3 88
4.3.2 Domestic industry diversification 70.1 98
4.3.3 Domestic market scale, bn PPP$ 41.1 108
NOTES: ● indicates a strength; ○ a weakness; ◆ an income group strength; ◇ an income group weakness; * an index; †
a survey question. indicates that
the
economy’s data are older than the base year; see appendices for details, including the year of the data, at http://globalinnovationindex.org. Square
brackets [ ] indicate
that the data minimum coverage (DMC) requirements were not met at the sub-pillar or pillar level.](https://image.slidesharecdn.com/e-220805033615-e8521670/75/E-INDEX-2021-pdf-138-2048.jpg)
![119
GII 2021 Economy profiles
Montenegro GII 2021 rank
50
Output rank Input rank Income Region Population (mn) GDP, PPP$ (bn) GDP per capita, PPP$ GII 2020 rank
53 53 Upper middle EUR 0.6 12.4 19,931 49
Score/
Value Rank
Business sophistication 25.3 67
5.1 Knowledge workers 33.1 61
5.1.1 Knowledge-intensive employment, % 36.4 35 ◆
5.1.2 Firms offering formal training, % 15.8 90 ○ ◇
5.1.3 GERD performed by business, % GDP 0.2 54
5.1.4 GERD financed by business, % 37.8 50
5.1.5 Females employed w/advanced degrees, % 17.4 39
5.2 Innovation linkages 18.2 82
5.2.1 University-industry RD collaboration†
45.5 52
5.2.2 State of cluster development and depth†
43.0 85
5.2.3 GERD financed by abroad, % GDP 0.0 57
5.2.4 Joint venture/strategic alliance deals/bn PPP$ GDP 0.0 48
5.2.5 Patent families/bn PPP$ GDP 0.0 100 ○ ◇
5.3 Knowledge absorption 24.6 70
5.3.1 Intellectual property payments, % total trade 0.2 92
5.3.2 High-tech imports, % total trade 6.4 92
5.3.3 ICT services imports, % total trade 2.3 25 ● ◆
5.3.4 FDI net inflows, % GDP 9.6 8 ● ◆
5.3.5 Research talent, % in businesses 15.9 58
Knowledge and technology outputs 17.1 78
6.1 Knowledge creation 16.8 62
6.1.1 Patents by origin/bn PPP$ GDP 1.2 60
6.1.2 PCT patents by origin/bn PPP$ GDP 0.0 98 ○ ◇
6.1.3 Utility models by origin/bn PPP$ GDP n/a n/a
6.1.4 Scientific and technical articles/bn PPP$ GDP 31.2 28 ◆
6.1.5 Citable documents H-index 2.3 127 ○ ◇
6.2 Knowledge impact 26.9 77
6.2.1 Labor productivity growth, % n/a n/a
6.2.2 New businesses/th pop. 15–64 11.3 10 ● ◆
6.2.3 Software spending, % GDP 0.4 28 ◆
6.2.4 ISO 9001 quality certificates/bn PPP$ GDP 11.7 25 ●
6.2.5 High-tech manufacturing, % 10.3 87 ○
6.3 Knowledge diffusion 7.5 104
6.3.1 Intellectual property receipts, % total trade 0.0 86
6.3.2 Production and export complexity n/a n/a
6.3.3 High-tech exports, % total trade 0.1 113 ○
6.3.4 ICT services exports, % total trade 2.1 51
Creative outputs 35.9 33 ◆
7.1 Intangible assets 30.5 66
7.1.1 Trademarks by origin/bn PPP$ GDP 29.8 75
7.1.2 Global brand value, top 5,000, % GDP n/a n/a
7.1.3 Industrial designs by origin/bn PPP$ GDP 0.1 113 ○
7.1.4 ICTs and organizational model creation†
52.6 70
7.2 Creative goods and services 24.3 39
7.2.1 Cultural and creative services exports, % total trade 0.5 49
7.2.2 National feature films/mn pop. 15–69 13.3 11 ● ◆
7.2.3 Entertainment and media market/th pop. 15–69 n/a n/a
7.2.4 Printing and other media, % manufacturing 3.0 4 ● ◆
7.2.5 Creative goods exports, % total trade 0.1 95
7.3 Online creativity 58.4 12 ● ◆
7.3.1 Generic top-level domains (TLDs)/th pop. 15–69 1.4 90
7.3.2 Country-code TLDs/th pop. 15–69 100.0 1 ● ◆
7.3.3 Wikipedia edits/mn pop. 15–69 70.9 33 ◆
7.3.4 Mobile app creation/bn PPP$ GDP n/a n/a
Score/
Value Rank
Institutions 69.6 48
1.1 Political environment 59.9 59
1.1.1 Political and operational stability* 71.4 54
1.1.2 Government effectiveness* 54.1 61
1.2 Regulatory environment 72.4 42
1.2.1 Regulatory quality* 53.0 55
1.2.2 Rule of law* 49.2 58
1.2.3 Cost of redundancy dismissal 11.2 35
1.3 Business environment 76.4 44
1.3.1 Ease of starting a business* 86.7 79
1.3.2 Ease of resolving insolvency* 66.1 40
Human capital and research 32.7 59
2.1 Education 58.8 [34]
2.1.1 Expenditure on education, % GDP n/a n/a
2.1.2 Government funding/pupil, secondary, % GDP/cap n/a n/a
2.1.3 School life expectancy, years 14.9 53
2.1.4 PISA scales in reading, maths and science 421.9 55
2.1.5 Pupil-teacher ratio, secondary 14.4 69
2.2 Tertiary education 34.5 63
2.2.1 Tertiary enrolment, % gross 54.2 56
2.2.2 Graduates in science and engineering, % 20.5 70
2.2.3 Tertiary inbound mobility, % n/a n/a
2.3 Research and development (RD) 4.7 77
2.3.1 Researchers, FTE/mn pop. 763.0 56
2.3.2 Gross expenditure on RD, % GDP 0.5 67
2.3.3 Global corporate RD investors, top 3, mn US$ 0.0 41 ○ ◇
2.3.4 QS university ranking, top 3* 0.0 74 ○ ◇
Infrastructure 43.2 60
3.1 Informationandcommunicationtechnologies(ICTs) 63.6 75
3.1.1 ICT access* 78.2 40 ◆
3.1.2 ICT use* 67.1 54 ◆
3.1.3 Government’s online service* 54.1 96
3.1.4 E-participation* 54.8 94
3.2 General infrastructure 27.6 68
3.2.1 Electricity output, GWh/mn pop. 6,127.0 34 ◆
3.2.2 Logistics performance* 32.5 76
3.2.3 Gross capital formation, % GDP 23.0 57
3.3 Ecological sustainability 38.6 39
3.3.1 GDP/unit of energy use 10.9 61
3.3.2 Environmental performance* 46.3 68
3.3.3 ISO 14001 environmental certificates/bn PPP$ GDP 6.7 13 ● ◆
Market sophistication 50.9 41
4.1 Credit 45.0 49
4.1.1 Ease of getting credit* 85.0 14 ●
4.1.2 Domestic credit to private sector, % GDP 49.0 73
4.1.3 Microfinance gross loans, % GDP 1.0 24
4.2 Investment 44.9 [23]
4.2.1 Ease of protecting minority investors* 62.0 60
4.2.2 Market capitalization, % GDP 82.6 18
4.2.3 Venture capital investors, deals/bn PPP$ GDP n/a n/a
4.2.4 Venture capital recipients, deals/bn PPP$ GDP n/a n/a
4.3 Trade, diversification, and market scale 62.8 84
4.3.1 Applied tariff rate, weighted avg., % 1.0 11 ●
4.3.2 Domestic industry diversification 87.5 62
4.3.3 Domestic market scale, bn PPP$ 12.4 131 ○ ◇
NOTES: ● indicates a strength; ○ a weakness; ◆ an income group strength; ◇ an income group weakness; * an index; †
a survey question. indicates that
the
economy’s data are older than the base year; see appendices for details, including the year of the data, at http://globalinnovationindex.org. Square
brackets [ ] indicate
that the data minimum coverage (DMC) requirements were not met at the sub-pillar or pillar level.](https://image.slidesharecdn.com/e-220805033615-e8521670/75/E-INDEX-2021-pdf-139-2048.jpg)
![120 Global Innovation Index 2021
Morocco GII 2021 rank
77
Output rank Input rank Income Region Population (mn) GDP, PPP$ (bn) GDP per capita, PPP$ GII 2020 rank
67 84 Lower middle NAWA 36.9 273.6 7,609 75
Score/
Value Rank
Business sophistication 18.1 105
5.1 Knowledge workers 22.1 97
5.1.1 Knowledge-intensive employment, % 6.9 115 ○ ◇
5.1.2 Firms offering formal training, % 35.7 40
5.1.3 GERD performed by business, % GDP 0.2 52
5.1.4 GERD financed by business, % 29.9 61
5.1.5 Females employed w/advanced degrees, % n/a n/a
5.2 Innovation linkages 14.0 112 ○
5.2.1 University-industry RD collaboration†
29.2 114 ○
5.2.2 State of cluster development and depth†
42.9 88
5.2.3 GERD financed by abroad, % GDP 0.0 76
5.2.4 Joint venture/strategic alliance deals/bn PPP$ GDP 0.0 97
5.2.5 Patent families/bn PPP$ GDP 0.0 87
5.3 Knowledge absorption 18.0 103
5.3.1 Intellectual property payments, % total trade 0.3 79
5.3.2 High-tech imports, % total trade 8.5 54
5.3.3 ICT services imports, % total trade 0.7 90
5.3.4 FDI net inflows, % GDP 2.3 72
5.3.5 Research talent, % in businesses 7.0 66
Knowledge and technology outputs 20.1 67
6.1 Knowledge creation 11.3 75
6.1.1 Patents by origin/bn PPP$ GDP 0.7 74
6.1.2 PCT patents by origin/bn PPP$ GDP 0.2 56 ◆
6.1.3 Utility models by origin/bn PPP$ GDP n/a n/a
6.1.4 Scientific and technical articles/bn PPP$ GDP 14.4 60
6.1.5 Citable documents H-index 11.4 67
6.2 Knowledge impact 31.6 60 ◆
6.2.1 Labor productivity growth, % 0.1 63
6.2.2 New businesses/th pop. 15–64 1.9 57
6.2.3 Software spending, % GDP 0.2 57
6.2.4 ISO 9001 quality certificates/bn PPP$ GDP 3.7 66
6.2.5 High-tech manufacturing, % 38.5 29 ● ◆
6.3 Knowledge diffusion 17.4 63
6.3.1 Intellectual property receipts, % total trade 0.0 91 ○
6.3.2 Production and export complexity 30.9 90
6.3.3 High-tech exports, % total trade 2.1 56
6.3.4 ICT services exports, % total trade 3.3 30 ●
Creative outputs 22.8 70
7.1 Intangible assets 38.7 41 ● ◆
7.1.1 Trademarks by origin/bn PPP$ GDP 58.7 37 ●
7.1.2 Global brand value, top 5,000, % GDP 17.8 50
7.1.3 Industrial designs by origin/bn PPP$ GDP 12.5 10 ● ◆
7.1.4 ICTs and organizational model creation†
51.3 77
7.2 Creative goods and services 5.1 104
7.2.1 Cultural and creative services exports, % total trade 0.4 57
7.2.2 National feature films/mn pop. 15–69 1.5 75
7.2.3 Entertainment and media market/th pop. 15–69 1.1 58 ○
7.2.4 Printing and other media, % manufacturing 0.7 77
7.2.5 Creative goods exports, % total trade 0.1 101
7.3 Online creativity 8.8 104
7.3.1 Generic top-level domains (TLDs)/th pop. 15–69 1.5 88
7.3.2 Country-code TLDs/th pop. 15–69 1.1 83
7.3.3 Wikipedia edits/mn pop. 15–69 31.8 98
7.3.4 Mobile app creation/bn PPP$ GDP 3.3 63
Score/
Value Rank
Institutions 61.6 74 ◆
1.1 Political environment 54.0 80
1.1.1 Political and operational stability* 66.1 74
1.1.2 Government effectiveness* 48.0 82
1.2 Regulatory environment 57.7 86
1.2.1 Regulatory quality* 38.0 86
1.2.2 Rule of law* 43.1 71 ◆
1.2.3 Cost of redundancy dismissal 20.7 88
1.3 Business environment 73.0 59 ◆
1.3.1 Ease of starting a business* 93.0 41 ●
1.3.2 Ease of resolving insolvency* 52.9 67
Human capital and research 27.5 82
2.1 Education 53.2 56
2.1.1 Expenditure on education, % GDP n/a n/a
2.1.2 Government funding/pupil, secondary, % GDP/cap 36.4 4 ● ◆
2.1.3 School life expectancy, years 14.0 72 ◆
2.1.4 PISA scales in reading, maths and science 367.9 75 ○
2.1.5 Pupil-teacher ratio, secondary 18.8 92
2.2 Tertiary education 22.6 91
2.2.1 Tertiary enrolment, % gross 38.5 77
2.2.2 Graduates in science and engineering, % 19.0 79
2.2.3 Tertiary inbound mobility, % 2.0 77
2.3 Research and development (RD) 6.7 71
2.3.1 Researchers, FTE/mn pop. 1,073.5 50 ◆
2.3.2 Gross expenditure on RD, % GDP 0.7 50 ◆
2.3.3 Global corporate RD investors, top 3, mn US$ 0.0 41 ○ ◇
2.3.4 QS university ranking, top 3* 0.0 74 ○ ◇
Infrastructure 36.3 84
3.1 Informationandcommunicationtechnologies(ICTs) 54.8 90
3.1.1 ICT access* 66.6 67 ◆
3.1.2 ICT use* 49.1 81
3.1.3 Government’s online service* 52.3 99
3.1.4 E-participation* 51.2 99
3.2 General infrastructure 25.0 83
3.2.1 Electricity output, GWh/mn pop. 1,131.3 95
3.2.2 Logistics performance* 22.9 103 ○
3.2.3 Gross capital formation, % GDP 28.1 27 ●
3.3 Ecological sustainability 29.1 62 ◆
3.3.1 GDP/unit of energy use 14.5 26 ● ◆
3.3.2 Environmental performance* 42.3 85
3.3.3 ISO 14001 environmental certificates/bn PPP$ GDP 0.8 71
Market sophistication 41.9 91
4.1 Credit 33.1 97
4.1.1 Ease of getting credit* 45.0 101 ○
4.1.2 Domestic credit to private sector, % GDP 87.8 32 ● ◆
4.1.3 Microfinance gross loans, % GDP 0.2 46
4.2 Investment 23.3 98
4.2.1 Ease of protecting minority investors* 70.0 36 ●
4.2.2 Market capitalization, % GDP 55.8 30
4.2.3 Venture capital investors, deals/bn PPP$ GDP 0.0 81 ○
4.2.4 Venture capital recipients, deals/bn PPP$ GDP 0.0 70
4.3 Trade, diversification, and market scale 69.2 64
4.3.1 Applied tariff rate, weighted avg., % 3.6 72
4.3.2 Domestic industry diversification 77.5 84
4.3.3 Domestic market scale, bn PPP$ 273.5 56
NOTES: ● indicates a strength; ○ a weakness; ◆ an income group strength; ◇ an income group weakness; * an index; †
a survey question. indicates that
the
economy’s data are older than the base year; see appendices for details, including the year of the data, at http://globalinnovationindex.org. Square
brackets [ ] indicate
that the data minimum coverage (DMC) requirements were not met at the sub-pillar or pillar level.](https://image.slidesharecdn.com/e-220805033615-e8521670/75/E-INDEX-2021-pdf-140-2048.jpg)
![121
GII 2021 Economy profiles
Mozambique GII 2021 rank
122
Output rank Input rank Income Region Population (mn) GDP, PPP$ (bn) GDP per capita, PPP$ GII 2020 rank
118 122 Low SSF 31.3 40.9 1,279 124
Score/
Value Rank
Business sophistication 13.8 127
5.1 Knowledge workers 6.4 128
5.1.1 Knowledge-intensive employment, % 3.9 121 ○ ◇
5.1.2 Firms offering formal training, % 20.7 76
5.1.3 GERD performed by business, % GDP n/a n/a
5.1.4 GERD financed by business, % 0.5 97
5.1.5 Females employed w/advanced degrees, % 0.7 117
5.2 Innovation linkages 18.0 83
5.2.1 University-industry RD collaboration†
34.0 97
5.2.2 State of cluster development and depth†
35.0 115
5.2.3 GERD financed by abroad, % GDP 0.1 34 ●
5.2.4 Joint venture/strategic alliance deals/bn PPP$ GDP 0.0 46 ●
5.2.5 Patent families/bn PPP$ GDP 0.0 100 ○ ◇
5.3 Knowledge absorption 16.9 106
5.3.1 Intellectual property payments, % total trade 0.5 70 ●
5.3.2 High-tech imports, % total trade 4.3 114
5.3.3 ICT services imports, % total trade 0.9 85
5.3.4 FDI net inflows, % GDP 16.6 5 ● ◆
5.3.5 Research talent, % in businesses 0.3 86 ○
Knowledge and technology outputs 10.3 116
6.1 Knowledge creation 6.0 101
6.1.1 Patents by origin/bn PPP$ GDP 0.6 77 ◆
6.1.2 PCT patents by origin/bn PPP$ GDP 0.0 98 ○ ◇
6.1.3 Utility models by origin/bn PPP$ GDP 0.0 67
6.1.4 Scientific and technical articles/bn PPP$ GDP 11.4 75
6.1.5 Citable documents H-index 5.4 101
6.2 Knowledge impact 21.1 [98]
6.2.1 Labor productivity growth, % 0.0 64 ●
6.2.2 New businesses/th pop. 15–64 n/a n/a
6.2.3 Software spending, % GDP 0.0 111
6.2.4 ISO 9001 quality certificates/bn PPP$ GDP 1.5 99 ◆
6.2.5 High-tech manufacturing, % n/a n/a
6.3 Knowledge diffusion 3.8 124 ◇
6.3.1 Intellectual property receipts, % total trade 0.0 101
6.3.2 Production and export complexity 15.0 114
6.3.3 High-tech exports, % total trade 0.3 99
6.3.4 ICT services exports, % total trade 0.3 108
Creative outputs 12.0 115
7.1 Intangible assets 20.3 99
7.1.1 Trademarks by origin/bn PPP$ GDP 40.8 58 ●
7.1.2 Global brand value, top 5,000, % GDP 0.0 80 ○ ◇
7.1.3 Industrial designs by origin/bn PPP$ GDP 1.0 71
7.1.4 ICTs and organizational model creation†
35.8 120
7.2 Creative goods and services 2.3 [116]
7.2.1 Cultural and creative services exports, % total trade n/a n/a
7.2.2 National feature films/mn pop. 15–69 2.0 66
7.2.3 Entertainment and media market/th pop. 15–69 n/a n/a
7.2.4 Printing and other media, % manufacturing n/a n/a
7.2.5 Creative goods exports, % total trade 0.0 125
7.3 Online creativity 5.2 123
7.3.1 Generic top-level domains (TLDs)/th pop. 15–69 0.0 129 ○
7.3.2 Country-code TLDs/th pop. 15–69 0.2 109
7.3.3 Wikipedia edits/mn pop. 15–69 19.7 122
7.3.4 Mobile app creation/bn PPP$ GDP n/a n/a
Score/
Value Rank
Institutions 43.5 127
1.1 Political environment 40.0 120
1.1.1 Political and operational stability* 55.4 112
1.1.2 Government effectiveness* 32.4 120
1.2 Regulatory environment 31.9 126 ◇
1.2.1 Regulatory quality* 24.6 115
1.2.2 Rule of law* 19.8 122
1.2.3 Cost of redundancy dismissal 37.5 126 ◇
1.3 Business environment 58.5 108
1.3.1 Ease of starting a business* 69.3 127 ◇
1.3.2 Ease of resolving insolvency* 47.8 78
Human capital and research 17.3 112
2.1 Education 48.0 72 ● ◆
2.1.1 Expenditure on education, % GDP 5.5 19 ● ◆
2.1.2 Government funding/pupil, secondary, % GDP/cap 40.1 2 ● ◆
2.1.3 School life expectancy, years 10.0 108
2.1.4 PISA scales in reading, maths and science n/a n/a
2.1.5 Pupil-teacher ratio, secondary 36.5 121 ○
2.2 Tertiary education 2.2 128 ○ ◇
2.2.1 Tertiary enrolment, % gross 7.3 119
2.2.2 Graduates in science and engineering, % 9.6 108 ○ ◇
2.2.3 Tertiary inbound mobility, % 0.4 103
2.3 Research and development (RD) 1.6 99
2.3.1 Researchers, FTE/mn pop. 43.0 96
2.3.2 Gross expenditure on RD, % GDP 0.3 78
2.3.3 Global corporate RD investors, top 3, mn US$ 0.0 41 ○ ◇
2.3.4 QS university ranking, top 3* 0.0 74 ○ ◇
Infrastructure 38.9 76 ◆
3.1 Informationandcommunicationtechnologies(ICTs) 35.4 119
3.1.1 ICT access* 24.7 128
3.1.2 ICT use* 12.9 125
3.1.3 Government’s online service* 51.8 102
3.1.4 E-participation* 52.4 97
3.2 General infrastructure 67.3 1 ● ◆
3.2.1 Electricity output, GWh/mn pop. 564.8 106
3.2.2 Logistics performance* n/a n/a
3.2.3 Gross capital formation, % GDP 66.0 1 ● ◆
3.3 Ecological sustainability 13.9 128
3.3.1 GDP/unit of energy use 3.9 121 ○
3.3.2 Environmental performance* 33.9 106
3.3.3 ISO 14001 environmental certificates/bn PPP$ GDP 0.5 84 ◆
Market sophistication 27.8 126 ◇
4.1 Credit 13.4 126
4.1.1 Ease of getting credit* 25.0 126
4.1.2 Domestic credit to private sector, % GDP 21.7 111
4.1.3 Microfinance gross loans, % GDP 0.2 53
4.2 Investment 20.3 [113]
4.2.1 Ease of protecting minority investors* 32.0 120
4.2.2 Market capitalization, % GDP n/a n/a
4.2.3 Venture capital investors, deals/bn PPP$ GDP n/a n/a
4.2.4 Venture capital recipients, deals/bn PPP$ GDP 0.0 50 ●
4.3 Trade, diversification, and market scale 49.6 116
4.3.1 Applied tariff rate, weighted avg., % 4.2 76 ◆
4.3.2 Domestic industry diversification n/a n/a
4.3.3 Domestic market scale, bn PPP$ 40.9 109
NOTES: ● indicates a strength; ○ a weakness; ◆ an income group strength; ◇ an income group weakness; * an index; †
a survey question. indicates that
the
economy’s data are older than the base year; see appendices for details, including the year of the data, at http://globalinnovationindex.org. Square
brackets [ ] indicate
that the data minimum coverage (DMC) requirements were not met at the sub-pillar or pillar level.](https://image.slidesharecdn.com/e-220805033615-e8521670/75/E-INDEX-2021-pdf-141-2048.jpg)
![122 Global Innovation Index 2021
Myanmar GII 2021 rank
127
Output rank Input rank Income Region Population (mn) GDP, PPP$ (bn) GDP per capita, PPP$ GII 2020 rank
120 128 Lower middle SEAO 54.4 275.5 5,179 129
Score/
Value Rank
Business sophistication 8.7 132 ○ ◇
5.1 Knowledge workers 3.3 132 ○ ◇
5.1.1 Knowledge-intensive employment, % 4.9 118 ◇
5.1.2 Firms offering formal training, % 5.9 98 ○ ◇
5.1.3 GERD performed by business, % GDP n/a n/a
5.1.4 GERD financed by business, % 0.0 102 ○ ◇
5.1.5 Females employed w/advanced degrees, % 6.0 91
5.2 Innovation linkages 1.6 [131]
5.2.1 University-industry RD collaboration†
n/a n/a
5.2.2 State of cluster development and depth†
n/a n/a
5.2.3 GERD financed by abroad, % GDP 0.0 82
5.2.4 Joint venture/strategic alliance deals/bn PPP$ GDP 0.0 90
5.2.5 Patent families/bn PPP$ GDP 0.0 100 ○ ◇
5.3 Knowledge absorption 21.1 86
5.3.1 Intellectual property payments, % total trade 0.2 90
5.3.2 High-tech imports, % total trade 7.3 72
5.3.3 ICT services imports, % total trade 1.1 68
5.3.4 FDI net inflows, % GDP 4.0 29 ●
5.3.5 Research talent, % in businesses n/a n/a
Knowledge and technology outputs 14.4 89
6.1 Knowledge creation 2.7 [123]
6.1.1 Patents by origin/bn PPP$ GDP n/a n/a
6.1.2 PCT patents by origin/bn PPP$ GDP n/a n/a
6.1.3 Utility models by origin/bn PPP$ GDP n/a n/a
6.1.4 Scientific and technical articles/bn PPP$ GDP 1.9 126
6.1.5 Citable documents H-index 3.2 122
6.2 Knowledge impact 33.5 48 ● ◆
6.2.1 Labor productivity growth, % 7.3 1 ● ◆
6.2.2 New businesses/th pop. 15–64 0.4 104
6.2.3 Software spending, % GDP n/a n/a
6.2.4 ISO 9001 quality certificates/bn PPP$ GDP 0.8 115
6.2.5 High-tech manufacturing, % 12.4 84
6.3 Knowledge diffusion 7.1 110
6.3.1 Intellectual property receipts, % total trade 0.0 88
6.3.2 Production and export complexity 21.4 108
6.3.3 High-tech exports, % total trade 1.3 68
6.3.4 ICT services exports, % total trade 0.6 99
Creative outputs 7.9 131 ○ ◇
7.1 Intangible assets 10.6 [128]
7.1.1 Trademarks by origin/bn PPP$ GDP 24.2 83
7.1.2 Global brand value, top 5,000, % GDP 7.6 65
7.1.3 Industrial designs by origin/bn PPP$ GDP n/a n/a
7.1.4 ICTs and organizational model creation†
n/a n/a
7.2 Creative goods and services 7.2 92
7.2.1 Cultural and creative services exports, % total trade 0.2 67
7.2.2 National feature films/mn pop. 15–69 0.9 87
7.2.3 Entertainment and media market/th pop. 15–69 n/a n/a
7.2.4 Printing and other media, % manufacturing 0.4 94
7.2.5 Creative goods exports, % total trade 0.9 47 ●
7.3 Online creativity 3.0 129 ◇
7.3.1 Generic top-level domains (TLDs)/th pop. 15–69 0.1 127
7.3.2 Country-code TLDs/th pop. 15–69 0.0 127
7.3.3 Wikipedia edits/mn pop. 15–69 16.5 127 ◇
7.3.4 Mobile app creation/bn PPP$ GDP 0.0 91
Score/
Value Rank
Institutions 45.4 123
1.1 Political environment 35.8 127 ◇
1.1.1 Political and operational stability* 57.1 106
1.1.2 Government effectiveness* 25.1 130 ○ ◇
1.2 Regulatory environment 45.6 113
1.2.1 Regulatory quality* 23.6 117
1.2.2 Rule of law* 18.7 126 ◇
1.2.3 Cost of redundancy dismissal 23.1 98
1.3 Business environment 54.9 119
1.3.1 Ease of starting a business* 89.3 58 ●
1.3.2 Ease of resolving insolvency* 20.4 128 ◇
Human capital and research 17.7 108
2.1 Education 20.1 127 ◇
2.1.1 Expenditure on education, % GDP 1.9 113 ○ ◇
2.1.2 Government funding/pupil, secondary, % GDP/cap 10.0 92
2.1.3 School life expectancy, years 10.7 102
2.1.4 PISA scales in reading, maths and science n/a n/a
2.1.5 Pupil-teacher ratio, secondary 27.2 112 ◇
2.2 Tertiary education 32.7 66
2.2.1 Tertiary enrolment, % gross 18.8 99
2.2.2 Graduates in science and engineering, % 33.7 9 ● ◆
2.2.3 Tertiary inbound mobility, % 0.0 110 ○
2.3 Research and development (RD) 0.1 118
2.3.1 Researchers, FTE/mn pop. 29.1 102
2.3.2 Gross expenditure on RD, % GDP 0.0 114 ◇
2.3.3 Global corporate RD investors, top 3, mn US$ 0.0 41 ○ ◇
2.3.4 QS university ranking, top 3* 0.0 74 ○ ◇
Infrastructure 26.3 113
3.1 Informationandcommunicationtechnologies(ICTs) 32.3 122 ◇
3.1.1 ICT access* 38.0 112
3.1.2 ICT use* 38.9 99
3.1.3 Government’s online service* 25.9 128 ○ ◇
3.1.4 E-participation* 26.2 129 ○ ◇
3.2 General infrastructure 25.1 79
3.2.1 Electricity output, GWh/mn pop. 457.2 110
3.2.2 Logistics performance* 11.7 119 ◇
3.2.3 Gross capital formation, % GDP 32.4 20 ●
3.3 Ecological sustainability 21.6 91
3.3.1 GDP/unit of energy use 14.3 29 ● ◆
3.3.2 Environmental performance* 25.1 130 ○ ◇
3.3.3 ISO 14001 environmental certificates/bn PPP$ GDP 0.1 127
Market sophistication 29.8 124 ◇
4.1 Credit 8.6 130 ○ ◇
4.1.1 Ease of getting credit* 10.0 129 ○ ◇
4.1.2 Domestic credit to private sector, % GDP 25.7 104
4.1.3 Microfinance gross loans, % GDP 0.3 42 ●
4.2 Investment 10.1 130 ○ ◇
4.2.1 Ease of protecting minority investors* 22.0 129 ◇
4.2.2 Market capitalization, % GDP n/a n/a
4.2.3 Venture capital investors, deals/bn PPP$ GDP 0.0 72
4.2.4 Venture capital recipients, deals/bn PPP$ GDP 0.0 57
4.3 Trade, diversification, and market scale 70.8 60 ●
4.3.1 Applied tariff rate, weighted avg., % 1.8 24 ● ◆
4.3.2 Domestic industry diversification 76.4 86
4.3.3 Domestic market scale, bn PPP$ 275.5 55 ●
NOTES: ● indicates a strength; ○ a weakness; ◆ an income group strength; ◇ an income group weakness; * an index; †
a survey question. indicates that
the
economy’s data are older than the base year; see appendices for details, including the year of the data, at http://globalinnovationindex.org. Square
brackets [ ] indicate
that the data minimum coverage (DMC) requirements were not met at the sub-pillar or pillar level.](https://image.slidesharecdn.com/e-220805033615-e8521670/75/E-INDEX-2021-pdf-142-2048.jpg)
![123
GII 2021 Economy profiles
Namibia GII 2021 rank
100
Output rank Input rank Income Region Population (mn) GDP, PPP$ (bn) GDP per capita, PPP$ GII 2020 rank
110 88 Upper middle SSF 2.5 24.1 9,537 104
Score/
Value Rank
Business sophistication 17.0 112 ◇
5.1 Knowledge workers 17.3 107 ◇
5.1.1 Knowledge-intensive employment, % 18.1 87
5.1.2 Firms offering formal training, % 25.4 62
5.1.3 GERD performed by business, % GDP 0.0 77
5.1.4 GERD financed by business, % 11.1 75
5.1.5 Females employed w/advanced degrees, % 7.4 85
5.2 Innovation linkages 19.1 74
5.2.1 University-industry RD collaboration†
42.8 64
5.2.2 State of cluster development and depth†
44.6 79
5.2.3 GERD financed by abroad, % GDP 0.1 49
5.2.4 Joint venture/strategic alliance deals/bn PPP$ GDP 0.0 50
5.2.5 Patent families/bn PPP$ GDP 0.1 55
5.3 Knowledge absorption 14.6 120 ○ ◇
5.3.1 Intellectual property payments, % total trade 0.0 115 ○ ◇
5.3.2 High-tech imports, % total trade 7.4 71
5.3.3 ICT services imports, % total trade 0.6 98
5.3.4 FDI net inflows, % GDP 0.8 109 ◇
5.3.5 Research talent, % in businesses 6.9 67
Knowledge and technology outputs 9.4 119 ◇
6.1 Knowledge creation 7.9 89
6.1.1 Patents by origin/bn PPP$ GDP 0.4 84
6.1.2 PCT patents by origin/bn PPP$ GDP 0.2 49
6.1.3 Utility models by origin/bn PPP$ GDP 0.3 43
6.1.4 Scientific and technical articles/bn PPP$ GDP 12.0 71
6.1.5 Citable documents H-index 4.9 107
6.2 Knowledge impact 13.0 120 ○ ◇
6.2.1 Labor productivity growth, % −3.1 113 ○ ◇
6.2.2 New businesses/th pop. 15–64 1.2 79
6.2.3 Software spending, % GDP 0.1 88
6.2.4 ISO 9001 quality certificates/bn PPP$ GDP 1.7 92
6.2.5 High-tech manufacturing, % 4.7 100 ○ ◇
6.3 Knowledge diffusion 7.4 105
6.3.1 Intellectual property receipts, % total trade 0.0 94
6.3.2 Production and export complexity 33.9 80
6.3.3 High-tech exports, % total trade 0.9 73
6.3.4 ICT services exports, % total trade 0.2 124 ○
Creative outputs 15.2 105 ◇
7.1 Intangible assets 19.6 101
7.1.1 Trademarks by origin/bn PPP$ GDP 18.9 94
7.1.2 Global brand value, top 5,000, % GDP 0.0 80 ○ ◇
7.1.3 Industrial designs by origin/bn PPP$ GDP 3.1 36 ●
7.1.4 ICTs and organizational model creation†
46.7 95
7.2 Creative goods and services 2.3 [115]
7.2.1 Cultural and creative services exports, % total trade 0.1 90
7.2.2 National feature films/mn pop. 15–69 n/a n/a
7.2.3 Entertainment and media market/th pop. 15–69 n/a n/a
7.2.4 Printing and other media, % manufacturing n/a n/a
7.2.5 Creative goods exports, % total trade 0.2 77
7.3 Online creativity 19.4 58
7.3.1 Generic top-level domains (TLDs)/th pop. 15–69 8.9 42 ● ◆
7.3.2 Country-code TLDs/th pop. 15–69 0.9 90
7.3.3 Wikipedia edits/mn pop. 15–69 52.6 62
7.3.4 Mobile app creation/bn PPP$ GDP 15.0 34 ●
Score/
Value Rank
Institutions 61.9 73
1.1 Political environment 59.0 61
1.1.1 Political and operational stability* 71.4 54
1.1.2 Government effectiveness* 52.8 66
1.2 Regulatory environment 72.2 43 ●
1.2.1 Regulatory quality* 40.7 77
1.2.2 Rule of law* 54.9 50 ● ◆
1.2.3 Cost of redundancy dismissal 9.7 28 ●
1.3 Business environment 54.6 120 ○ ◇
1.3.1 Ease of starting a business* 72.2 120 ○ ◇
1.3.2 Ease of resolving insolvency* 36.9 109 ◇
Human capital and research 32.9 57
2.1 Education 82.5 [1]
2.1.1 Expenditure on education, % GDP 8.3 1 ● ◆
2.1.2 Government funding/pupil, secondary, % GDP/cap n/a n/a
2.1.3 School life expectancy, years n/a n/a
2.1.4 PISA scales in reading, maths and science n/a n/a
2.1.5 Pupil-teacher ratio, secondary 25.9 106 ◇
2.2 Tertiary education 14.0 104 ◇
2.2.1 Tertiary enrolment, % gross 24.1 92 ◇
2.2.2 Graduates in science and engineering, % 12.9 101 ○ ◇
2.2.3 Tertiary inbound mobility, % 6.1 39 ●
2.3 Research and development (RD) 2.1 92
2.3.1 Researchers, FTE/mn pop. 149.5 83 ◇
2.3.2 Gross expenditure on RD, % GDP 0.4 75
2.3.3 Global corporate RD investors, top 3, mn US$ 0.0 41 ○ ◇
2.3.4 QS university ranking, top 3* 0.0 74 ○ ◇
Infrastructure 27.2 112 ◇
3.1 Informationandcommunicationtechnologies(ICTs) 46.0 98 ◇
3.1.1 ICT access* 46.0 96 ◇
3.1.2 ICT use* 35.8 101 ◇
3.1.3 Government’s online service* 52.3 99 ◇
3.1.4 E-participation* 50.0 103 ◇
3.2 General infrastructure 9.7 129 ○ ◇
3.2.1 Electricity output, GWh/mn pop. 488.6 108 ◇
3.2.2 Logistics performance* n/a n/a
3.2.3 Gross capital formation, % GDP 14.6 117 ○ ◇
3.3 Ecological sustainability 26.0 78
3.3.1 GDP/unit of energy use 12.5 42 ●
3.3.2 Environmental performance* 40.2 88 ◇
3.3.3 ISO 14001 environmental certificates/bn PPP$ GDP 0.7 76
Market sophistication 41.8 92
4.1 Credit 35.6 85
4.1.1 Ease of getting credit* 60.0 74
4.1.2 Domestic credit to private sector, % GDP 72.0 45 ●
4.1.3 Microfinance gross loans, % GDP 0.0 65
4.2 Investment 31.5 [66]
4.2.1 Ease of protecting minority investors* 56.0 82
4.2.2 Market capitalization, % GDP 20.8 58
4.2.3 Venture capital investors, deals/bn PPP$ GDP n/a n/a
4.2.4 Venture capital recipients, deals/bn PPP$ GDP n/a n/a
4.3 Trade, diversification, and market scale 58.4 99
4.3.1 Applied tariff rate, weighted avg., % 1.1 13 ●
4.3.2 Domestic industry diversification 68.7 99 ◇
4.3.3 Domestic market scale, bn PPP$ 24.1 126 ○ ◇
NOTES: ● indicates a strength; ○ a weakness; ◆ an income group strength; ◇ an income group weakness; * an index; †
a survey question. indicates that
the
economy’s data are older than the base year; see appendices for details, including the year of the data, at http://globalinnovationindex.org. Square
brackets [ ] indicate
that the data minimum coverage (DMC) requirements were not met at the sub-pillar or pillar level.](https://image.slidesharecdn.com/e-220805033615-e8521670/75/E-INDEX-2021-pdf-143-2048.jpg)
![124 Global Innovation Index 2021
Nepal GII 2021 rank
111
Output rank Input rank Income Region Population (mn) GDP, PPP$ (bn) GDP per capita, PPP$ GII 2020 rank
116 99 Lower middle CSA 29.1 103.4 3,586 95
Score/
Value Rank
Business sophistication 25.9 [59]
5.1 Knowledge workers 23.2 [90]
5.1.1 Knowledge-intensive employment, % 13.8 97
5.1.2 Firms offering formal training, % 31.9 48 ●
5.1.3 GERD performed by business, % GDP n/a n/a
5.1.4 GERD financed by business, % n/a n/a
5.1.5 Females employed w/advanced degrees, % 3.0 101
5.2 Innovation linkages 24.1 [49]
5.2.1 University-industry RD collaboration†
33.1 100
5.2.2 State of cluster development and depth†
38.1 109
5.2.3 GERD financed by abroad, % GDP n/a n/a
5.2.4 Joint venture/strategic alliance deals/bn PPP$ GDP 0.0 73
5.2.5 Patent families/bn PPP$ GDP n/a n/a
5.3 Knowledge absorption 30.3 [56]
5.3.1 Intellectual property payments, % total trade n/a n/a
5.3.2 High-tech imports, % total trade 11.4 21 ●
5.3.3 ICT services imports, % total trade 0.2 124 ○ ◇
5.3.4 FDI net inflows, % GDP 0.5 117
5.3.5 Research talent, % in businesses n/a n/a
Knowledge and technology outputs 8.7[121]
6.1 Knowledge creation 10.3 [78]
6.1.1 Patents by origin/bn PPP$ GDP 0.2 92
6.1.2 PCT patents by origin/bn PPP$ GDP n/a n/a
6.1.3 Utility models by origin/bn PPP$ GDP n/a n/a
6.1.4 Scientific and technical articles/bn PPP$ GDP 14.1 64 ●
6.1.5 Citable documents H-index 7.9 86
6.2 Knowledge impact 3.8 129 ○ ◇
6.2.1 Labor productivity growth, % n/a n/a
6.2.2 New businesses/th pop. 15–64 1.3 75
6.2.3 Software spending, % GDP 0.0 117 ○ ◇
6.2.4 ISO 9001 quality certificates/bn PPP$ GDP 1.1 108
6.2.5 High-tech manufacturing, % 6.7 98
6.3 Knowledge diffusion 11.8 [84]
6.3.1 Intellectual property receipts, % total trade n/a n/a
6.3.2 Production and export complexity n/a n/a
6.3.3 High-tech exports, % total trade 0.1 122
6.3.4 ICT services exports, % total trade 2.7 40 ●
Creative outputs 14.5 108
7.1 Intangible assets 21.8 93
7.1.1 Trademarks by origin/bn PPP$ GDP 46.8 49 ●
7.1.2 Global brand value, top 5,000, % GDP 0.0 80 ○ ◇
7.1.3 Industrial designs by origin/bn PPP$ GDP 0.2 102
7.1.4 ICTs and organizational model creation†
37.9 118 ○ ◇
7.2 Creative goods and services 3.8 [109]
7.2.1 Cultural and creative services exports, % total trade n/a n/a
7.2.2 National feature films/mn pop. 15–69 n/a n/a
7.2.3 Entertainment and media market/th pop. 15–69 n/a n/a
7.2.4 Printing and other media, % manufacturing 0.4 92
7.2.5 Creative goods exports, % total trade 0.2 73
7.3 Online creativity 10.5 91
7.3.1 Generic top-level domains (TLDs)/th pop. 15–69 0.5 110
7.3.2 Country-code TLDs/th pop. 15–69 1.0 86
7.3.3 Wikipedia edits/mn pop. 15–69 29.6 106
7.3.4 Mobile app creation/bn PPP$ GDP 13.7 39 ●
Score/
Value Rank
Institutions 49.3 115
1.1 Political environment 37.9 123 ◇
1.1.1 Political and operational stability* 58.9 100
1.1.2 Government effectiveness* 27.4 124 ○ ◇
1.2 Regulatory environment 45.4 114
1.2.1 Regulatory quality* 25.2 113
1.2.2 Rule of law* 32.6 97
1.2.3 Cost of redundancy dismissal 27.2 108
1.3 Business environment 64.4 86
1.3.1 Ease of starting a business* 81.7 104
1.3.2 Ease of resolving insolvency* 47.2 79
Human capital and research 15.2 115
2.1 Education 37.9 96
2.1.1 Expenditure on education, % GDP 5.1 36 ●
2.1.2 Government funding/pupil, secondary, % GDP/cap 10.5 91
2.1.3 School life expectancy, years 13.2 79
2.1.4 PISA scales in reading, maths and science n/a n/a
2.1.5 Pupil-teacher ratio, secondary 28.3 114 ◇
2.2 Tertiary education 5.9 123 ○ ◇
2.2.1 Tertiary enrolment, % gross 13.3 106
2.2.2 Graduates in science and engineering, % n/a n/a
2.2.3 Tertiary inbound mobility, % 0.0 111 ○ ◇
2.3 Research and development (RD) 2.0 96
2.3.1 Researchers, FTE/mn pop. n/a n/a
2.3.2 Gross expenditure on RD, % GDP 0.3 79
2.3.3 Global corporate RD investors, top 3, mn US$ 0.0 41 ○ ◇
2.3.4 QS university ranking, top 3* 0.0 74 ○ ◇
Infrastructure 30.7 98
3.1 Informationandcommunicationtechnologies(ICTs) 35.8 118
3.1.1 ICT access* 41.9 104
3.1.2 ICT use* 24.5 109
3.1.3 Government’s online service* 40.0 117
3.1.4 E-participation* 36.9 116
3.2 General infrastructure 41.3 28 ● ◆
3.2.1 Electricity output, GWh/mn pop. 174.9 118 ○
3.2.2 Logistics performance* 21.7 107
3.2.3 Gross capital formation, % GDP 49.1 2 ● ◆
3.3 Ecological sustainability 15.0 126 ○ ◇
3.3.1 GDP/unit of energy use 5.9 109
3.3.2 Environmental performance* 32.7 113
3.3.3 ISO 14001 environmental certificates/bn PPP$ GDP 0.2 110
Market sophistication 45.8 68
4.1 Credit 50.5 30 ● ◆
4.1.1 Ease of getting credit* 75.0 34 ●
4.1.2 Domestic credit to private sector, % GDP 88.1 31 ● ◆
4.1.3 Microfinance gross loans, % GDP 1.7 16 ●
4.2 Investment 30.5 [68]
4.2.1 Ease of protecting minority investors* 58.0 77
4.2.2 Market capitalization, % GDP n/a n/a
4.2.3 Venture capital investors, deals/bn PPP$ GDP n/a n/a
4.2.4 Venture capital recipients, deals/bn PPP$ GDP 0.0 75
4.3 Trade, diversification, and market scale 56.5 106
4.3.1 Applied tariff rate, weighted avg., % 14.2 129 ○ ◇
4.3.2 Domestic industry diversification 85.3 65
4.3.3 Domestic market scale, bn PPP$ 103.4 82
NOTES: ● indicates a strength; ○ a weakness; ◆ an income group strength; ◇ an income group weakness; * an index; †
a survey question. indicates that
the
economy’s data are older than the base year; see appendices for details, including the year of the data, at http://globalinnovationindex.org. Square
brackets [ ] indicate
that the data minimum coverage (DMC) requirements were not met at the sub-pillar or pillar level.](https://image.slidesharecdn.com/e-220805033615-e8521670/75/E-INDEX-2021-pdf-144-2048.jpg)
![125
GII 2021 Economy profiles
Netherlands GII 2021 rank
6
Output rank Input rank Income Region Population (mn) GDP, PPP$ (bn) GDP per capita, PPP$ GII 2020 rank
3 12 High EUR 17.1 986.8 57,101 5
Score/
Value Rank
Business sophistication 61.0 5 ●
5.1 Knowledge workers 61.4 13
5.1.1 Knowledge-intensive employment, % 48.9 9
5.1.2 Firms offering formal training, % n/a n/a
5.1.3 GERD performed by business, % GDP 1.5 15
5.1.4 GERD financed by business, % 56.7 16
5.1.5 Females employed w/advanced degrees, % 21.1 28
5.2 Innovation linkages 54.8 10
5.2.1 University-industry RD collaboration†
72.4 5 ●
5.2.2 State of cluster development and depth†
69.0 7
5.2.3 GERD financed by abroad, % GDP 0.2 15
5.2.4 Joint venture/strategic alliance deals/bn PPP$ GDP 0.1 23
5.2.5 Patent families/bn PPP$ GDP 4.7 10
5.3 Knowledge absorption 66.9 2 ● ◆
5.3.1 Intellectual property payments, % total trade 8.4 1 ● ◆
5.3.2 High-tech imports, % total trade 11.6 20
5.3.3 ICT services imports, % total trade 2.4 22
5.3.4 FDI net inflows, % GDP −2.9 127 ○
5.3.5 Research talent, % in businesses 70.4 6 ◆
Knowledge and technology outputs 54.8 7 ●
6.1 Knowledge creation 67.7 6 ●
6.1.1 Patents by origin/bn PPP$ GDP 8.9 11
6.1.2 PCT patents by origin/bn PPP$ GDP 4.1 10
6.1.3 Utility models by origin/bn PPP$ GDP n/a n/a
6.1.4 Scientific and technical articles/bn PPP$ GDP 41.3 16
6.1.5 Citable documents H-index 68.8 7 ●
6.2 Knowledge impact 43.1 18
6.2.1 Labor productivity growth, % −1.2 88 ○
6.2.2 New businesses/th pop. 15–64 6.4 25
6.2.3 Software spending, % GDP 0.5 15
6.2.4 ISO 9001 quality certificates/bn PPP$ GDP 7.9 34
6.2.5 High-tech manufacturing, % 50.3 11
6.3 Knowledge diffusion 53.5 8
6.3.1 Intellectual property receipts, % total trade 7.7 1 ● ◆
6.3.2 Production and export complexity 66.5 27
6.3.3 High-tech exports, % total trade 11.2 15
6.3.4 ICT services exports, % total trade 3.6 23
Creative outputs 52.2 7 ●
7.1 Intangible assets 51.4 16
7.1.1 Trademarks by origin/bn PPP$ GDP 42.7 56 ○
7.1.2 Global brand value, top 5,000, % GDP 164.6 7
7.1.3 Industrial designs by origin/bn PPP$ GDP 4.8 25
7.1.4 ICTs and organizational model creation†
80.2 4 ● ◆
7.2 Creative goods and services 36.0 18
7.2.1 Cultural and creative services exports, % total trade 1.9 9
7.2.2 National feature films/mn pop. 15–69 7.6 25
7.2.3 Entertainment and media market/th pop. 15–69 48.9 18
7.2.4 Printing and other media, % manufacturing 0.9 57 ○
7.2.5 Creative goods exports, % total trade 3.2 18
7.3 Online creativity 70.1 3 ● ◆
7.3.1 Generic top-level domains (TLDs)/th pop. 15–69 78.9 5 ● ◆
7.3.2 Country-code TLDs/th pop. 15–69 100.0 1 ● ◆
7.3.3 Wikipedia edits/mn pop. 15–69 81.1 9
7.3.4 Mobile app creation/bn PPP$ GDP 16.3 30
Score/
Value Rank
Institutions 88.9 6 ●
1.1 Political environment 88.4 9
1.1.1 Political and operational stability* 83.9 13
1.1.2 Government effectiveness* 90.6 7 ●
1.2 Regulatory environment 88.9 14
1.2.1 Regulatory quality* 92.1 5 ●
1.2.2 Rule of law* 94.4 9
1.2.3 Cost of redundancy dismissal 15.8 63 ○
1.3 Business environment 89.4 5 ●
1.3.1 Ease of starting a business* 94.3 22
1.3.2 Ease of resolving insolvency* 84.4 7 ●
Human capital and research 55.9 14
2.1 Education 62.4 20
2.1.1 Expenditure on education, % GDP 5.2 32
2.1.2 Government funding/pupil, secondary, % GDP/cap 21.9 34
2.1.3 School life expectancy, years 18.6 10
2.1.4 PISA scales in reading, maths and science 502.5 15
2.1.5 Pupil-teacher ratio, secondary 14.3 66 ○ ◇
2.2 Tertiary education 40.1 39
2.2.1 Tertiary enrolment, % gross 87.1 13
2.2.2 Graduates in science and engineering, % 17.5 87 ○ ◇
2.2.3 Tertiary inbound mobility, % 11.7 16
2.3 Research and development (RD) 65.0 11
2.3.1 Researchers, FTE/mn pop. 5,796.1 9
2.3.2 Gross expenditure on RD, % GDP 2.2 15
2.3.3 Global corporate RD investors, top 3, mn US$ 82.4 9
2.3.4 QS university ranking, top 3* 65.1 13
Infrastructure 57.7 16
3.1 Informationandcommunicationtechnologies(ICTs) 90.8 4 ●
3.1.1 ICT access* 87.3 12
3.1.2 ICT use* 88.7 6 ● ◆
3.1.3 Government’s online service* 90.6 12
3.1.4 E-participation* 96.4 9
3.2 General infrastructure 41.1 29
3.2.1 Electricity output, GWh/mn pop. 6,642.8 30
3.2.2 Logistics performance* 91.5 6 ●
3.2.3 Gross capital formation, % GDP 20.9 79 ○
3.3 Ecological sustainability 41.3 34
3.3.1 GDP/unit of energy use 13.2 37
3.3.2 Environmental performance* 75.3 11
3.3.3 ISO 14001 environmental certificates/bn PPP$ GDP 2.1 39
Market sophistication 55.2 31
4.1 Credit 43.0 57
4.1.1 Ease of getting credit* 45.0 101 ○ ◇
4.1.2 Domestic credit to private sector, % GDP 100.0 25
4.1.3 Microfinance gross loans, % GDP n/a n/a
4.2 Investment 39.5 37
4.2.1 Ease of protecting minority investors* 58.0 77 ○ ◇
4.2.2 Market capitalization, % GDP 110.0 10
4.2.3 Venture capital investors, deals/bn PPP$ GDP 0.2 16
4.2.4 Venture capital recipients, deals/bn PPP$ GDP 0.0 29
4.3 Trade, diversification, and market scale 83.0 20
4.3.1 Applied tariff rate, weighted avg., % 1.8 25
4.3.2 Domestic industry diversification 94.3 33
4.3.3 Domestic market scale, bn PPP$ 986.8 26
NOTES: ● indicates a strength; ○ a weakness; ◆ an income group strength; ◇ an income group weakness; * an index; †
a survey question. indicates that
the
economy’s data are older than the base year; see appendices for details, including the year of the data, at http://globalinnovationindex.org. Square
brackets [ ] indicate
that the data minimum coverage (DMC) requirements were not met at the sub-pillar or pillar level.](https://image.slidesharecdn.com/e-220805033615-e8521670/75/E-INDEX-2021-pdf-145-2048.jpg)
![126 Global Innovation Index 2021
New Zealand GII 2021 rank
26
Output rank Input rank Income Region Population (mn) GDP, PPP$ (bn) GDP per capita, PPP$ GII 2020 rank
32 19 High SEAO 4.8 205.5 41,072 26
Score/
Value Rank
Business sophistication 37.7 30
5.1 Knowledge workers 42.2 [41]
5.1.1 Knowledge-intensive employment, % n/a n/a
5.1.2 Firms offering formal training, % n/a n/a
5.1.3 GERD performed by business, % GDP 0.8 28
5.1.4 GERD financed by business, % 46.4 33
5.1.5 Females employed w/advanced degrees, % 19.5 32
5.2 Innovation linkages 33.6 28
5.2.1 University-industry RD collaboration†
59.0 24
5.2.2 State of cluster development and depth†
46.0 69 ○
5.2.3 GERD financed by abroad, % GDP 0.1 37
5.2.4 Joint venture/strategic alliance deals/bn PPP$ GDP 0.1 19
5.2.5 Patent families/bn PPP$ GDP 1.5 25
5.3 Knowledge absorption 37.4 32
5.3.1 Intellectual property payments, % total trade 1.6 20
5.3.2 High-tech imports, % total trade 10.8 25
5.3.3 ICT services imports, % total trade 1.7 44
5.3.4 FDI net inflows, % GDP 1.2 103 ○
5.3.5 Research talent, % in businesses 31.2 42
Knowledge and technology outputs 29.7 39
6.1 Knowledge creation 39.4 23
6.1.1 Patents by origin/bn PPP$ GDP 1.5 49
6.1.2 PCT patents by origin/bn PPP$ GDP 1.5 22
6.1.3 Utility models by origin/bn PPP$ GDP n/a n/a
6.1.4 Scientific and technical articles/bn PPP$ GDP 50.6 9 ◆
6.1.5 Citable documents H-index 34.8 28
6.2 Knowledge impact 32.5 56
6.2.1 Labor productivity growth, % 0.5 58
6.2.2 New businesses/th pop. 15–64 17.8 4 ● ◆
6.2.3 Software spending, % GDP 0.3 45
6.2.4 ISO 9001 quality certificates/bn PPP$ GDP 4.5 60
6.2.5 High-tech manufacturing, % 16.0 71 ○ ◇
6.3 Knowledge diffusion 17.3 64
6.3.1 Intellectual property receipts, % total trade 0.7 24
6.3.2 Production and export complexity 46.9 54
6.3.3 High-tech exports, % total trade 1.7 65
6.3.4 ICT services exports, % total trade 1.2 77 ○
Creative outputs 39.8 23
7.1 Intangible assets 45.6 26
7.1.1 Trademarks by origin/bn PPP$ GDP 83.8 19 ◆
7.1.2 Global brand value, top 5,000, % GDP 46.0 37
7.1.3 Industrial designs by origin/bn PPP$ GDP 1.5 56
7.1.4 ICTs and organizational model creation†
71.3 18
7.2 Creative goods and services 20.1 52
7.2.1 Cultural and creative services exports, % total trade 0.4 59 ○
7.2.2 National feature films/mn pop. 15–69 6.1 37
7.2.3 Entertainment and media market/th pop. 15–69 52.5 13
7.2.4 Printing and other media, % manufacturing 1.5 27
7.2.5 Creative goods exports, % total trade 0.5 64
7.3 Online creativity 47.9 23
7.3.1 Generic top-level domains (TLDs)/th pop. 15–69 32.2 20
7.3.2 Country-code TLDs/th pop. 15–69 64.6 10 ◆
7.3.3 Wikipedia edits/mn pop. 15–69 80.8 10
7.3.4 Mobile app creation/bn PPP$ GDP 9.7 46
Score/
Value Rank
Institutions 90.7 4 ● ◆
1.1 Political environment 90.1 7 ● ◆
1.1.1 Political and operational stability* 94.6 2 ● ◆
1.1.2 Government effectiveness* 87.8 11
1.2 Regulatory environment 97.3 2 ● ◆
1.2.1 Regulatory quality* 92.7 3 ● ◆
1.2.2 Rule of law* 96.4 6 ● ◆
1.2.3 Cost of redundancy dismissal 8.0 1 ● ◆
1.3 Business environment 84.7 19
1.3.1 Ease of starting a business* 100.0 1 ● ◆
1.3.2 Ease of resolving insolvency* 69.5 33
Human capital and research 54.2 17
2.1 Education 66.9 11
2.1.1 Expenditure on education, % GDP 6.3 12 ◆
2.1.2 Government funding/pupil, secondary, % GDP/cap 21.3 40
2.1.3 School life expectancy, years 18.9 8 ◆
2.1.4 PISA scales in reading, maths and science 502.9 13
2.1.5 Pupil-teacher ratio, secondary 13.6 63 ○
2.2 Tertiary education 47.9 17
2.2.1 Tertiary enrolment, % gross 83.0 17
2.2.2 Graduates in science and engineering, % 21.4 65 ○
2.2.3 Tertiary inbound mobility, % 19.7 6 ●
2.3 Research and development (RD) 47.6 21
2.3.1 Researchers, FTE/mn pop. 5,529.5 10
2.3.2 Gross expenditure on RD, % GDP 1.3 27
2.3.3 Global corporate RD investors, top 3, mn US$ 48.0 32
2.3.4 QS university ranking, top 3* 49.8 18
Infrastructure 55.5 22
3.1 Informationandcommunicationtechnologies(ICTs) 90.6 6 ● ◆
3.1.1 ICT access* 87.9 10
3.1.2 ICT use* 82.9 15
3.1.3 Government’s online service* 92.9 10 ◆
3.1.4 E-participation* 98.8 4 ● ◆
3.2 General infrastructure 41.5 26
3.2.1 Electricity output, GWh/mn pop. 9,126.1 17
3.2.2 Logistics performance* 84.9 15
3.2.3 Gross capital formation, % GDP 20.7 85 ○
3.3 Ecological sustainability 34.3 48
3.3.1 GDP/unit of energy use 9.5 73 ○
3.3.2 Environmental performance* 71.3 19
3.3.3 ISO 14001 environmental certificates/bn PPP$ GDP 1.3 60
Market sophistication 63.0 14
4.1 Credit 83.5 4 ● ◆
4.1.1 Ease of getting credit* 100.0 1 ● ◆
4.1.2 Domestic credit to private sector, % GDP 160.0 6 ● ◆
4.1.3 Microfinance gross loans, % GDP n/a n/a
4.2 Investment 34.1 52
4.2.1 Ease of protecting minority investors* 86.0 3 ● ◆
4.2.2 Market capitalization, % GDP 46.6 36
4.2.3 Venture capital investors, deals/bn PPP$ GDP 0.1 35
4.2.4 Venture capital recipients, deals/bn PPP$ GDP 0.1 27
4.3 Trade, diversification, and market scale 71.2 57
4.3.1 Applied tariff rate, weighted avg., % 0.9 9
4.3.2 Domestic industry diversification 78.0 83 ○
4.3.3 Domestic market scale, bn PPP$ 205.5 63
NOTES: ● indicates a strength; ○ a weakness; ◆ an income group strength; ◇ an income group weakness; * an index; †
a survey question. indicates that
the
economy’s data are older than the base year; see appendices for details, including the year of the data, at http://globalinnovationindex.org. Square
brackets [ ] indicate
that the data minimum coverage (DMC) requirements were not met at the sub-pillar or pillar level.](https://image.slidesharecdn.com/e-220805033615-e8521670/75/E-INDEX-2021-pdf-146-2048.jpg)
![127
GII 2021 Economy profiles
Niger GII 2021 rank
129
Output rank Input rank Income Region Population (mn) GDP, PPP$ (bn) GDP per capita, PPP$ GII 2020 rank
130 125 Low SSF 24.2 30.3 1,253 128
Score/
Value Rank
Business sophistication 16.2[116]
5.1 Knowledge workers 20.4 [100]
5.1.1 Knowledge-intensive employment, % 15.3 93 ◆
5.1.2 Firms offering formal training, % 27.5 56
5.1.3 GERD performed by business, % GDP n/a n/a
5.1.4 GERD financed by business, % n/a n/a
5.1.5 Females employed w/advanced degrees, % 0.7 118
5.2 Innovation linkages 1.2 [132]
5.2.1 University-industry RD collaboration†
n/a n/a
5.2.2 State of cluster development and depth†
n/a n/a
5.2.3 GERD financed by abroad, % GDP n/a n/a
5.2.4 Joint venture/strategic alliance deals/bn PPP$ GDP 0.0 110
5.2.5 Patent families/bn PPP$ GDP 0.0 100 ○ ◇
5.3 Knowledge absorption 27.0 65 ◆
5.3.1 Intellectual property payments, % total trade 0.0 120
5.3.2 High-tech imports, % total trade 9.5 39 ●
5.3.3 ICT services imports, % total trade 2.4 23 ● ◆
5.3.4 FDI net inflows, % GDP 3.7 33 ●
5.3.5 Research talent, % in businesses n/a n/a
Knowledge and technology outputs 10.8 114
6.1 Knowledge creation 2.4 125
6.1.1 Patents by origin/bn PPP$ GDP 0.1 112
6.1.2 PCT patents by origin/bn PPP$ GDP 0.0 98 ○ ◇
6.1.3 Utility models by origin/bn PPP$ GDP 0.0 76 ○ ◇
6.1.4 Scientific and technical articles/bn PPP$ GDP 4.6 115
6.1.5 Citable documents H-index 3.5 118
6.2 Knowledge impact 18.6 111
6.2.1 Labor productivity growth, % 0.9 50 ●
6.2.2 New businesses/th pop. 15–64 0.1 118
6.2.3 Software spending, % GDP 0.0 114
6.2.4 ISO 9001 quality certificates/bn PPP$ GDP 0.3 129
6.2.5 High-tech manufacturing, % 15.3 72 ◆
6.3 Knowledge diffusion 11.5 87
6.3.1 Intellectual property receipts, % total trade 0.0 111
6.3.2 Production and export complexity n/a n/a
6.3.3 High-tech exports, % total trade 0.2 109
6.3.4 ICT services exports, % total trade 3.3 29 ● ◆
Creative outputs 4.5[132]
7.1 Intangible assets 5.6 [132]
7.1.1 Trademarks by origin/bn PPP$ GDP 12.1 107
7.1.2 Global brand value, top 5,000, % GDP n/a n/a
7.1.3 Industrial designs by origin/bn PPP$ GDP 0.0 119 ○ ◇
7.1.4 ICTs and organizational model creation†
n/a n/a
7.2 Creative goods and services 1.3 [125]
7.2.1 Cultural and creative services exports, % total trade 0.1 87
7.2.2 National feature films/mn pop. 15–69 0.7 92
7.2.3 Entertainment and media market/th pop. 15–69 n/a n/a
7.2.4 Printing and other media, % manufacturing n/a n/a
7.2.5 Creative goods exports, % total trade 0.0 123
7.3 Online creativity 5.4 121
7.3.1 Generic top-level domains (TLDs)/th pop. 15–69 0.9 99 ◆
7.3.2 Country-code TLDs/th pop. 15–69 0.0 129
7.3.3 Wikipedia edits/mn pop. 15–69 24.1 115
7.3.4 Mobile app creation/bn PPP$ GDP 0.0 94
Score/
Value Rank
Institutions 54.8 97
1.1 Political environment 40.4 116
1.1.1 Political and operational stability* 55.4 112
1.1.2 Government effectiveness* 32.8 118
1.2 Regulatory environment 58.7 83
1.2.1 Regulatory quality* 26.0 110
1.2.2 Rule of law* 32.7 96
1.2.3 Cost of redundancy dismissal 14.0 53 ●
1.3 Business environment 65.4 83
1.3.1 Ease of starting a business* 91.5 49 ●
1.3.2 Ease of resolving insolvency* 39.3 100
Human capital and research 8.5 129
2.1 Education 18.1 128
2.1.1 Expenditure on education, % GDP 3.5 84
2.1.2 Government funding/pupil, secondary, % GDP/cap 11.7 87
2.1.3 School life expectancy, years 6.4 119 ○ ◇
2.1.4 PISA scales in reading, maths and science n/a n/a
2.1.5 Pupil-teacher ratio, secondary 29.7 118
2.2 Tertiary education 7.4 118
2.2.1 Tertiary enrolment, % gross 4.2 125
2.2.2 Graduates in science and engineering, % 12.3 102
2.2.3 Tertiary inbound mobility, % 5.4 43 ●
2.3 Research and development (RD) 0.1 122
2.3.1 Researchers, FTE/mn pop. 26.5 104
2.3.2 Gross expenditure on RD, % GDP n/a n/a
2.3.3 Global corporate RD investors, top 3, mn US$ 0.0 41 ○ ◇
2.3.4 QS university ranking, top 3* 0.0 74 ○ ◇
Infrastructure 19.6 130
3.1 Informationandcommunicationtechnologies(ICTs) 21.3 132 ○ ◇
3.1.1 ICT access* 23.0 130
3.1.2 ICT use* 3.1 132 ○ ◇
3.1.3 Government’s online service* 29.4 125
3.1.4 E-participation* 29.8 127
3.2 General infrastructure 22.1 97
3.2.1 Electricity output, GWh/mn pop. 27.0 123 ○
3.2.2 Logistics performance* 1.1 124 ○ ◇
3.2.3 Gross capital formation, % GDP 32.4 19 ●
3.3 Ecological sustainability 15.4 123
3.3.1 GDP/unit of energy use 6.8 102
3.3.2 Environmental performance* 30.8 118
3.3.3 ISO 14001 environmental certificates/bn PPP$ GDP 0.2 120
Market sophistication 40.2 100
4.1 Credit 29.3 109
4.1.1 Ease of getting credit* 70.0 44
4.1.2 Domestic credit to private sector, % GDP 11.2 126
4.1.3 Microfinance gross loans, % GDP 0.1 59
4.2 Investment 33.3 [55]
4.2.1 Ease of protecting minority investors* 42.0 102
4.2.2 Market capitalization, % GDP n/a n/a
4.2.3 Venture capital investors, deals/bn PPP$ GDP n/a n/a
4.2.4 Venture capital recipients, deals/bn PPP$ GDP 0.1 21 ● ◆
4.3 Trade, diversification, and market scale 58.0 100
4.3.1 Applied tariff rate, weighted avg., % 9.3 112
4.3.2 Domestic industry diversification 88.2 57
4.3.3 Domestic market scale, bn PPP$ 30.3 121
NOTES: ● indicates a strength; ○ a weakness; ◆ an income group strength; ◇ an income group weakness; * an index; †
a survey question. indicates that
the
economy’s data are older than the base year; see appendices for details, including the year of the data, at http://globalinnovationindex.org. Square
brackets [ ] indicate
that the data minimum coverage (DMC) requirements were not met at the sub-pillar or pillar level.](https://image.slidesharecdn.com/e-220805033615-e8521670/75/E-INDEX-2021-pdf-147-2048.jpg)
![128 Global Innovation Index 2021
Nigeria GII 2021 rank
118
Output rank Input rank Income Region Population (mn) GDP, PPP$ (bn) GDP per capita, PPP$ GII 2020 rank
124 115 Lower middle SSF 206.1 1,044.2 5,066 117
Score/
Value Rank
Business sophistication 23.4 76
5.1 Knowledge workers 34.7 [57]
5.1.1 Knowledge-intensive employment, % 28.4 52 ● ◆
5.1.2 Firms offering formal training, % 30.7 50 ●
5.1.3 GERD performed by business, % GDP n/a n/a
5.1.4 GERD financed by business, % n/a n/a
5.1.5 Females employed w/advanced degrees, % 6.2 90
5.2 Innovation linkages 17.8 87
5.2.1 University-industry RD collaboration†
26.0 122 ◇
5.2.2 State of cluster development and depth†
45.4 75
5.2.3 GERD financed by abroad, % GDP n/a n/a
5.2.4 Joint venture/strategic alliance deals/bn PPP$ GDP 0.0 92
5.2.5 Patent families/bn PPP$ GDP 0.0 98
5.3 Knowledge absorption 17.8 104
5.3.1 Intellectual property payments, % total trade 0.4 76
5.3.2 High-tech imports, % total trade 7.1 76
5.3.3 ICT services imports, % total trade 0.3 114
5.3.4 FDI net inflows, % GDP 0.7 114
5.3.5 Research talent, % in businesses n/a n/a
Knowledge and technology outputs 8.3 123
6.1 Knowledge creation 5.8 107
6.1.1 Patents by origin/bn PPP$ GDP 0.1 110
6.1.2 PCT patents by origin/bn PPP$ GDP 0.0 97
6.1.3 Utility models by origin/bn PPP$ GDP n/a n/a
6.1.4 Scientific and technical articles/bn PPP$ GDP 5.1 108
6.1.5 Citable documents H-index 12.2 63 ●
6.2 Knowledge impact 18.2 113
6.2.1 Labor productivity growth, % −1.0 83
6.2.2 New businesses/th pop. 15–64 0.8 87
6.2.3 Software spending, % GDP 0.1 83
6.2.4 ISO 9001 quality certificates/bn PPP$ GDP 0.3 128 ○
6.2.5 High-tech manufacturing, % n/a n/a
6.3 Knowledge diffusion 1.0 131 ○ ◇
6.3.1 Intellectual property receipts, % total trade n/a n/a
6.3.2 Production and export complexity 0.0 121 ○ ◇
6.3.3 High-tech exports, % total trade 0.1 120
6.3.4 ICT services exports, % total trade 0.2 116
Creative outputs 11.7 116
7.1 Intangible assets 16.7 112
7.1.1 Trademarks by origin/bn PPP$ GDP 10.5 111
7.1.2 Global brand value, top 5,000, % GDP 3.5 72
7.1.3 Industrial designs by origin/bn PPP$ GDP 1.1 64 ●
7.1.4 ICTs and organizational model creation†
47.5 89
7.2 Creative goods and services 9.8 [80]
7.2.1 Cultural and creative services exports, % total trade n/a n/a
7.2.2 National feature films/mn pop. 15–69 11.3 15 ● ◆
7.2.3 Entertainment and media market/th pop. 15–69 1.5 55
7.2.4 Printing and other media, % manufacturing n/a n/a
7.2.5 Creative goods exports, % total trade 0.0 131 ○ ◇
7.3 Online creativity 3.7 127 ○
7.3.1 Generic top-level domains (TLDs)/th pop. 15–69 0.5 109
7.3.2 Country-code TLDs/th pop. 15–69 0.4 99
7.3.3 Wikipedia edits/mn pop. 15–69 18.1 126 ○ ◇
7.3.4 Mobile app creation/bn PPP$ GDP 0.4 82
Score/
Value Rank
Institutions 51.0 109
1.1 Political environment 33.7 128 ○ ◇
1.1.1 Political and operational stability* 48.2 127 ○ ◇
1.1.2 Government effectiveness* 26.5 127 ○ ◇
1.2 Regulatory environment 61.0 79
1.2.1 Regulatory quality* 21.0 122
1.2.2 Rule of law* 23.1 117
1.2.3 Cost of redundancy dismissal 8.0 1 ● ◆
1.3 Business environment 58.4 109
1.3.1 Ease of starting a business* 86.2 81
1.3.2 Ease of resolving insolvency* 30.6 118
Human capital and research 11.9[121]
2.1 Education 29.0 [118]
2.1.1 Expenditure on education, % GDP n/a n/a
2.1.2 Government funding/pupil, secondary, % GDP/cap n/a n/a
2.1.3 School life expectancy, years 8.7 115 ○ ◇
2.1.4 PISA scales in reading, maths and science n/a n/a
2.1.5 Pupil-teacher ratio, secondary 23.2 104
2.2 Tertiary education 6.6 [120]
2.2.1 Tertiary enrolment, % gross 10.2 112
2.2.2 Graduates in science and engineering, % n/a n/a
2.2.3 Tertiary inbound mobility, % n/a n/a
2.3 Research and development (RD) 0.0 [123]
2.3.1 Researchers, FTE/mn pop. n/a n/a
2.3.2 Gross expenditure on RD, % GDP n/a n/a
2.3.3 Global corporate RD investors, top 3, mn US$ 0.0 41 ○ ◇
2.3.4 QS university ranking, top 3* 0.0 74 ○ ◇
Infrastructure 24.6 120 ◇
3.1 Informationandcommunicationtechnologies(ICTs) 36.7 116
3.1.1 ICT access* 31.7 121 ◇
3.1.2 ICT use* 14.5 123 ◇
3.1.3 Government’s online service* 51.8 102
3.1.4 E-participation* 48.8 105
3.2 General infrastructure 21.8 99
3.2.1 Electricity output, GWh/mn pop. 185.2 117
3.2.2 Logistics performance* 22.5 104
3.2.3 Gross capital formation, % GDP 25.4 43 ●
3.3 Ecological sustainability 15.4 122 ◇
3.3.1 GDP/unit of energy use 7.0 101
3.3.2 Environmental performance* 31.0 117
3.3.3 ISO 14001 environmental certificates/bn PPP$ GDP 0.1 128 ○
Market sophistication 39.7 102
4.1 Credit 35.2 88
4.1.1 Ease of getting credit* 85.0 14 ● ◆
4.1.2 Domestic credit to private sector, % GDP 10.5 127 ○ ◇
4.1.3 Microfinance gross loans, % GDP 0.1 60
4.2 Investment 20.7 110
4.2.1 Ease of protecting minority investors* 72.0 27 ● ◆
4.2.2 Market capitalization, % GDP 9.2 69
4.2.3 Venture capital investors, deals/bn PPP$ GDP 0.0 70
4.2.4 Venture capital recipients, deals/bn PPP$ GDP 0.0 61
4.3 Trade, diversification, and market scale 63.4 82
4.3.1 Applied tariff rate, weighted avg., % 8.5 106
4.3.2 Domestic industry diversification n/a n/a
4.3.3 Domestic market scale, bn PPP$ 1,044.2 24 ● ◆
NOTES: ● indicates a strength; ○ a weakness; ◆ an income group strength; ◇ an income group weakness; * an index; †
a survey question. indicates that
the
economy’s data are older than the base year; see appendices for details, including the year of the data, at http://globalinnovationindex.org. Square
brackets [ ] indicate
that the data minimum coverage (DMC) requirements were not met at the sub-pillar or pillar level.](https://image.slidesharecdn.com/e-220805033615-e8521670/75/E-INDEX-2021-pdf-148-2048.jpg)
![129
GII 2021 Economy profiles
North Macedonia GII 2021 rank
59
Output rank Input rank Income Region Population (mn) GDP, PPP$ (bn) GDP per capita, PPP$ GII 2020 rank
69 40 Upper middle EUR 2.1 34.5 16,609 57
Score/
Value Rank
Business sophistication 25.4 65
5.1 Knowledge workers 32.5 62
5.1.1 Knowledge-intensive employment, % 29.9 48
5.1.2 Firms offering formal training, % 39.0 31
5.1.3 GERD performed by business, % GDP 0.1 62
5.1.4 GERD financed by business, % 23.6 63
5.1.5 Females employed w/advanced degrees, % 15.3 48
5.2 Innovation linkages 13.5 116 ○
5.2.1 University-industry RD collaboration†
30.2 112 ○ ◇
5.2.2 State of cluster development and depth†
38.6 108 ○
5.2.3 GERD financed by abroad, % GDP 0.0 65
5.2.4 Joint venture/strategic alliance deals/bn PPP$ GDP 0.0 94 ○
5.2.5 Patent families/bn PPP$ GDP 0.0 71
5.3 Knowledge absorption 30.2 57
5.3.1 Intellectual property payments, % total trade 1.6 21 ● ◆
5.3.2 High-tech imports, % total trade 5.7 103 ○
5.3.3 ICT services imports, % total trade 1.1 66
5.3.4 FDI net inflows, % GDP 4.3 26 ●
5.3.5 Research talent, % in businesses 26.6 47
Knowledge and technology outputs 22.7 57
6.1 Knowledge creation 11.5 73
6.1.1 Patents by origin/bn PPP$ GDP 1.6 43
6.1.2 PCT patents by origin/bn PPP$ GDP 0.2 54
6.1.3 Utility models by origin/bn PPP$ GDP n/a n/a
6.1.4 Scientific and technical articles/bn PPP$ GDP 13.4 66
6.1.5 Citable documents H-index 6.2 94
6.2 Knowledge impact 36.8 35
6.2.1 Labor productivity growth, % −1.1 85
6.2.2 New businesses/th pop. 15–64 3.6 39
6.2.3 Software spending, % GDP 0.1 79
6.2.4 ISO 9001 quality certificates/bn PPP$ GDP 15.5 17 ●
6.2.5 High-tech manufacturing, % 42.4 22 ● ◆
6.3 Knowledge diffusion 20.0 55
6.3.1 Intellectual property receipts, % total trade 0.1 47
6.3.2 Production and export complexity 45.5 57
6.3.3 High-tech exports, % total trade 2.9 50
6.3.4 ICT services exports, % total trade 2.7 41
Creative outputs 19.5 83
7.1 Intangible assets 18.4 109 ○
7.1.1 Trademarks by origin/bn PPP$ GDP n/a n/a
7.1.2 Global brand value, top 5,000, % GDP 0.0 80 ○ ◇
7.1.3 Industrial designs by origin/bn PPP$ GDP 2.0 48
7.1.4 ICTs and organizational model creation†
41.1 112 ○ ◇
7.2 Creative goods and services 17.9 60
7.2.1 Cultural and creative services exports, % total trade 0.9 30
7.2.2 National feature films/mn pop. 15–69 5.1 44
7.2.3 Entertainment and media market/th pop. 15–69 n/a n/a
7.2.4 Printing and other media, % manufacturing 2.2 12 ● ◆
7.2.5 Creative goods exports, % total trade 0.2 84
7.3 Online creativity 23.2 52
7.3.1 Generic top-level domains (TLDs)/th pop. 15–69 6.8 47
7.3.2 Country-code TLDs/th pop. 15–69 5.6 52
7.3.3 Wikipedia edits/mn pop. 15–69 68.6 41 ◆
7.3.4 Mobile app creation/bn PPP$ GDP 9.3 48
Score/
Value Rank
Institutions 68.9 52
1.1 Political environment 58.1 65
1.1.1 Political and operational stability* 73.2 44
1.1.2 Government effectiveness* 50.6 74
1.2 Regulatory environment 67.9 58
1.2.1 Regulatory quality* 56.8 49 ◆
1.2.2 Rule of law* 40.3 75
1.2.3 Cost of redundancy dismissal 14.4 55
1.3 Business environment 80.7 30 ● ◆
1.3.1 Ease of starting a business* 88.6 63
1.3.2 Ease of resolving insolvency* 72.7 28 ● ◆
Human capital and research 30.2 73
2.1 Education 55.6 [47]
2.1.1 Expenditure on education, % GDP n/a n/a
2.1.2 Government funding/pupil, secondary, % GDP/cap n/a n/a
2.1.3 School life expectancy, years 13.5 77
2.1.4 PISA scales in reading, maths and science 400.1 67 ○
2.1.5 Pupil-teacher ratio, secondary 8.3 13 ● ◆
2.2 Tertiary education 31.0 72
2.2.1 Tertiary enrolment, % gross 43.1 68
2.2.2 Graduates in science and engineering, % 23.6 48
2.2.3 Tertiary inbound mobility, % 5.2 48
2.3 Research and development (RD) 4.1 83
2.3.1 Researchers, FTE/mn pop. 786.7 55
2.3.2 Gross expenditure on RD, % GDP 0.4 74
2.3.3 Global corporate RD investors, top 3, mn US$ 0.0 41 ○ ◇
2.3.4 QS university ranking, top 3* 0.0 74 ○ ◇
Infrastructure 46.9 49
3.1 Informationandcommunicationtechnologies(ICTs) 71.2 56
3.1.1 ICT access* 67.4 65
3.1.2 ICT use* 60.1 61
3.1.3 Government’s online service* 74.1 58
3.1.4 E-participation* 83.3 38
3.2 General infrastructure 20.1 109 ○
3.2.1 Electricity output, GWh/mn pop. 2,691.8 71
3.2.2 Logistics performance* 30.6 80
3.2.3 Gross capital formation, % GDP n/a n/a
3.3 Ecological sustainability 49.2 18 ● ◆
3.3.1 GDP/unit of energy use 11.8 52
3.3.2 Environmental performance* 55.4 41 ◆
3.3.3 ISO 14001 environmental certificates/bn PPP$ GDP 9.9 5 ● ◆
Market sophistication 63.7 12 ● ◆
4.1 Credit 41.0 64
4.1.1 Ease of getting credit* 80.0 23 ●
4.1.2 Domestic credit to private sector, % GDP 51.5 65
4.1.3 Microfinance gross loans, % GDP 0.3 43
4.2 Investment 82.0 [2]
4.2.1 Ease of protecting minority investors* 82.0 12 ● ◆
4.2.2 Market capitalization, % GDP n/a n/a
4.2.3 Venture capital investors, deals/bn PPP$ GDP n/a n/a
4.2.4 Venture capital recipients, deals/bn PPP$ GDP n/a n/a
4.3 Trade, diversification, and market scale 68.1 70
4.3.1 Applied tariff rate, weighted avg., % 1.9 54
4.3.2 Domestic industry diversification 91.5 47
4.3.3 Domestic market scale, bn PPP$ 34.5 118 ○ ◇
NOTES: ● indicates a strength; ○ a weakness; ◆ an income group strength; ◇ an income group weakness; * an index; †
a survey question. indicates that
the
economy’s data are older than the base year; see appendices for details, including the year of the data, at http://globalinnovationindex.org. Square
brackets [ ] indicate
that the data minimum coverage (DMC) requirements were not met at the sub-pillar or pillar level.](https://image.slidesharecdn.com/e-220805033615-e8521670/75/E-INDEX-2021-pdf-149-2048.jpg)
![130 Global Innovation Index 2021
Norway GII 2021 rank
20
Output rank Input rank Income Region Population (mn) GDP, PPP$ (bn) GDP per capita, PPP$ GII 2020 rank
28 13 High EUR 5.4 349.5 64,856 20
Score/
Value Rank
Business sophistication 45.7 23 ◇
5.1 Knowledge workers 57.6 21
5.1.1 Knowledge-intensive employment, % 51.7 5 ●
5.1.2 Firms offering formal training, % n/a n/a
5.1.3 GERD performed by business, % GDP 1.1 19
5.1.4 GERD financed by business, % 42.0 39 ◇
5.1.5 Females employed w/advanced degrees, % 25.9 12
5.2 Innovation linkages 42.6 20
5.2.1 University-industry RD collaboration†
61.7 20
5.2.2 State of cluster development and depth†
64.6 15
5.2.3 GERD financed by abroad, % GDP 0.2 27
5.2.4 Joint venture/strategic alliance deals/bn PPP$ GDP 0.1 18
5.2.5 Patent families/bn PPP$ GDP 2.1 17
5.3 Knowledge absorption 36.9 35 ◇
5.3.1 Intellectual property payments, % total trade 0.5 69 ○
5.3.2 High-tech imports, % total trade 7.0 78 ○
5.3.3 ICT services imports, % total trade 3.2 7
5.3.4 FDI net inflows, % GDP 1.1 106 ○
5.3.5 Research talent, % in businesses 48.9 26
Knowledge and technology outputs 35.4 28 ◇
6.1 Knowledge creation 46.7 17
6.1.1 Patents by origin/bn PPP$ GDP 4.5 20
6.1.2 PCT patents by origin/bn PPP$ GDP 2.0 18
6.1.3 Utility models by origin/bn PPP$ GDP n/a n/a
6.1.4 Scientific and technical articles/bn PPP$ GDP 45.4 12
6.1.5 Citable documents H-index 41.7 20
6.2 Knowledge impact 39.5 25
6.2.1 Labor productivity growth, % −0.2 72 ○
6.2.2 New businesses/th pop. 15–64 8.6 19
6.2.3 Software spending, % GDP 0.5 18
6.2.4 ISO 9001 quality certificates/bn PPP$ GDP 7.8 35
6.2.5 High-tech manufacturing, % 32.9 38
6.3 Knowledge diffusion 20.1 54 ◇
6.3.1 Intellectual property receipts, % total trade 0.3 31 ◇
6.3.2 Production and export complexity 54.0 43 ◇
6.3.3 High-tech exports, % total trade 3.2 46
6.3.4 ICT services exports, % total trade 1.8 62
Creative outputs 39.3 25
7.1 Intangible assets 37.4 45 ◇
7.1.1 Trademarks by origin/bn PPP$ GDP 33.2 69 ○
7.1.2 Global brand value, top 5,000, % GDP 73.2 27
7.1.3 Industrial designs by origin/bn PPP$ GDP 1.3 60 ○
7.1.4 ICTs and organizational model creation†
77.4 10
7.2 Creative goods and services 27.1 32
7.2.1 Cultural and creative services exports, % total trade 0.5 50
7.2.2 National feature films/mn pop. 15–69 10.1 19
7.2.3 Entertainment and media market/th pop. 15–69 82.8 3 ● ◆
7.2.4 Printing and other media, % manufacturing 1.1 45
7.2.5 Creative goods exports, % total trade 0.5 63 ○
7.3 Online creativity 55.5 15
7.3.1 Generic top-level domains (TLDs)/th pop. 15–69 50.6 15
7.3.2 Country-code TLDs/th pop. 15–69 63.0 13
7.3.3 Wikipedia edits/mn pop. 15–69 84.3 6 ●
7.3.4 Mobile app creation/bn PPP$ GDP 19.5 28
Score/
Value Rank
Institutions 92.6 3 ● ◆
1.1 Political environment 91.1 4 ●
1.1.1 Political and operational stability* 89.3 6
1.1.2 Government effectiveness* 92.0 5 ●
1.2 Regulatory environment 96.8 3 ●
1.2.1 Regulatory quality* 90.7 7 ●
1.2.2 Rule of law* 99.0 2 ●
1.2.3 Cost of redundancy dismissal 8.7 18
1.3 Business environment 89.9 3 ●
1.3.1 Ease of starting a business* 94.3 23
1.3.2 Ease of resolving insolvency* 85.4 5 ●
Human capital and research 56.8 13
2.1 Education 75.3 3 ● ◆
2.1.1 Expenditure on education, % GDP 7.9 2 ● ◆
2.1.2 Government funding/pupil, secondary, % GDP/cap 26.1 14 ◆
2.1.3 School life expectancy, years 18.1 12
2.1.4 PISA scales in reading, maths and science 496.9 22
2.1.5 Pupil-teacher ratio, secondary 8.5 16 ◆
2.2 Tertiary education 39.7 42
2.2.1 Tertiary enrolment, % gross 83.0 16
2.2.2 Graduates in science and engineering, % 21.8 62 ○
2.2.3 Tertiary inbound mobility, % 4.2 57 ○
2.3 Research and development (RD) 55.5 19
2.3.1 Researchers, FTE/mn pop. 6,673.7 6
2.3.2 Gross expenditure on RD, % GDP 2.1 16
2.3.3 Global corporate RD investors, top 3, mn US$ 56.1 24
2.3.4 QS university ranking, top 3* 42.9 28
Infrastructure 64.8 1 ● ◆
3.1 Informationandcommunicationtechnologies(ICTs) 86.0 18
3.1.1 ICT access* 76.3 45 ◇
3.1.2 ICT use* 89.3 3 ● ◆
3.1.3 Government’s online service* 87.6 19
3.1.4 E-participation* 90.5 18
3.2 General infrastructure 61.2 3 ● ◆
3.2.1 Electricity output, GWh/mn pop. 27,518.4 1 ● ◆
3.2.2 Logistics performance* 76.6 21
3.2.3 Gross capital formation, % GDP 26.7 34
3.3 Ecological sustainability 47.2 20
3.3.1 GDP/unit of energy use 13.9 33
3.3.2 Environmental performance* 77.7 9
3.3.3 ISO 14001 environmental certificates/bn PPP$ GDP 4.1 22
Market sophistication 57.6 21
4.1 Credit 59.2 16
4.1.1 Ease of getting credit* 55.0 88 ○
4.1.2 Domestic credit to private sector, % GDP 151.4 9
4.1.3 Microfinance gross loans, % GDP n/a n/a
4.2 Investment 37.1 42
4.2.1 Ease of protecting minority investors* 76.0 21
4.2.2 Market capitalization, % GDP 69.0 23
4.2.3 Venture capital investors, deals/bn PPP$ GDP 0.1 21
4.2.4 Venture capital recipients, deals/bn PPP$ GDP 0.0 34
4.3 Trade, diversification, and market scale 76.5 40
4.3.1 Applied tariff rate, weighted avg., % 2.6 59
4.3.2 Domestic industry diversification 90.6 48
4.3.3 Domestic market scale, bn PPP$ 349.5 49
NOTES: ● indicates a strength; ○ a weakness; ◆ an income group strength; ◇ an income group weakness; * an index; †
a survey question. indicates that
the
economy’s data are older than the base year; see appendices for details, including the year of the data, at http://globalinnovationindex.org. Square
brackets [ ] indicate
that the data minimum coverage (DMC) requirements were not met at the sub-pillar or pillar level.](https://image.slidesharecdn.com/e-220805033615-e8521670/75/E-INDEX-2021-pdf-150-2048.jpg)
![131
GII 2021 Economy profiles
Oman GII 2021 rank
76
Output rank Input rank Income Region Population (mn) GDP, PPP$ (bn) GDP per capita, PPP$ GII 2020 rank
90 67 High NAWA 5.1 129.2 29,908 84
Score/
Value Rank
Business sophistication 20.2 94 ◇
5.1 Knowledge workers 22.4 [95]
5.1.1 Knowledge-intensive employment, % 18.5 84 ◇
5.1.2 Firms offering formal training, % n/a n/a
5.1.3 GERD performed by business, % GDP 0.1 66 ◇
5.1.4 GERD financed by business, % 31.8 57
5.1.5 Females employed w/advanced degrees, % n/a n/a
5.2 Innovation linkages 23.7 52
5.2.1 University-industry RD collaboration†
51.5 37
5.2.2 State of cluster development and depth†
62.5 21 ●
5.2.3 GERD financed by abroad, % GDP 0.0 88 ○ ◇
5.2.4 Joint venture/strategic alliance deals/bn PPP$ GDP 0.1 30
5.2.5 Patent families/bn PPP$ GDP 0.0 97
5.3 Knowledge absorption 14.5 121 ○ ◇
5.3.1 Intellectual property payments, % total trade n/a n/a
5.3.2 High-tech imports, % total trade 5.5 106 ○
5.3.3 ICT services imports, % total trade 0.3 117 ○ ◇
5.3.4 FDI net inflows, % GDP 5.4 18 ●
5.3.5 Research talent, % in businesses 0.3 85 ○ ◇
Knowledge and technology outputs 11.7 107 ○ ◇
6.1 Knowledge creation 7.1 96 ◇
6.1.1 Patents by origin/bn PPP$ GDP 0.2 94
6.1.2 PCT patents by origin/bn PPP$ GDP 0.1 67
6.1.3 Utility models by origin/bn PPP$ GDP n/a n/a
6.1.4 Scientific and technical articles/bn PPP$ GDP 9.9 86 ◇
6.1.5 Citable documents H-index 7.5 87 ◇
6.2 Knowledge impact 19.4 107 ○ ◇
6.2.1 Labor productivity growth, % −1.7 96
6.2.2 New businesses/th pop. 15–64 1.4 72
6.2.3 Software spending, % GDP 0.0 102 ○ ◇
6.2.4 ISO 9001 quality certificates/bn PPP$ GDP 4.5 59
6.2.5 High-tech manufacturing, % 17.5 67 ◇
6.3 Knowledge diffusion 8.8 99 ◇
6.3.1 Intellectual property receipts, % total trade n/a n/a
6.3.2 Production and export complexity 32.7 82 ◇
6.3.3 High-tech exports, % total trade 0.8 78
6.3.4 ICT services exports, % total trade 0.3 113 ○
Creative outputs 22.5 71 ◇
7.1 Intangible assets 34.5 53
7.1.1 Trademarks by origin/bn PPP$ GDP 78.2 22 ● ◆
7.1.2 Global brand value, top 5,000, % GDP 10.4 60
7.1.3 Industrial designs by origin/bn PPP$ GDP 0.1 114 ○
7.1.4 ICTs and organizational model creation†
52.5 72 ◇
7.2 Creative goods and services 5.0 105 ◇
7.2.1 Cultural and creative services exports, % total trade n/a n/a
7.2.2 National feature films/mn pop. 15–69 1.1 82 ◇
7.2.3 Entertainment and media market/th pop. 15–69 5.0 48 ◇
7.2.4 Printing and other media, % manufacturing 0.5 89 ○
7.2.5 Creative goods exports, % total trade 0.4 65
7.3 Online creativity 15.8 70 ◇
7.3.1 Generic top-level domains (TLDs)/th pop. 15–69 1.6 86 ◇
7.3.2 Country-code TLDs/th pop. 15–69 0.3 106 ◇
7.3.3 Wikipedia edits/mn pop. 15–69 39.3 85 ◇
7.3.4 Mobile app creation/bn PPP$ GDP 23.7 23 ●
Score/
Value Rank
Institutions 62.3 71 ◇
1.1 Political environment 62.0 52 ◇
1.1.1 Political and operational stability* 73.2 44
1.1.2 Government effectiveness* 56.4 57 ◇
1.2 Regulatory environment 56.2 91 ◇
1.2.1 Regulatory quality* 51.1 57 ◇
1.2.2 Rule of law* 61.3 41
1.2.3 Cost of redundancy dismissal n/a n/a
1.3 Business environment 68.7 73 ◇
1.3.1 Ease of starting a business* 93.5 30 ●
1.3.2 Ease of resolving insolvency* 44.0 88 ◇
Human capital and research 37.9 45
2.1 Education 56.6 44
2.1.1 Expenditure on education, % GDP 5.0 41
2.1.2 Government funding/pupil, secondary, % GDP/cap 27.0 13 ● ◆
2.1.3 School life expectancy, years 14.3 66 ◇
2.1.4 PISA scales in reading, maths and science n/a n/a
2.1.5 Pupil-teacher ratio, secondary 10.6 35
2.2 Tertiary education 52.8 10 ● ◆
2.2.1 Tertiary enrolment, % gross 40.4 73 ◇
2.2.2 Graduates in science and engineering, % 44.5 1 ● ◆
2.2.3 Tertiary inbound mobility, % 2.8 67
2.3 Research and development (RD) 4.3 81 ◇
2.3.1 Researchers, FTE/mn pop. 281.2 77 ◇
2.3.2 Gross expenditure on RD, % GDP 0.2 90 ◇
2.3.3 Global corporate RD investors, top 3, mn US$ 0.0 41 ○ ◇
2.3.4 QS university ranking, top 3* 9.7 65
Infrastructure 45.1 56 ◇
3.1 Informationandcommunicationtechnologies(ICTs) 79.7 33
3.1.1 ICT access* 80.3 30 ●
3.1.2 ICT use* 69.8 47 ◇
3.1.3 Government’s online service* 85.3 24 ●
3.1.4 E-participation* 83.3 38
3.2 General infrastructure 33.5 46
3.2.1 Electricity output, GWh/mn pop. 7,801.0 24 ●
3.2.2 Logistics performance* 53.4 42
3.2.3 Gross capital formation, % GDP 22.0 68
3.3 Ecological sustainability 21.9 87 ◇
3.3.1 GDP/unit of energy use 7.5 98
3.3.2 Environmental performance* 38.5 91 ◇
3.3.3 ISO 14001 environmental certificates/bn PPP$ GDP 1.7 50
Market sophistication 43.2 84
4.1 Credit 32.6 99 ◇
4.1.1 Ease of getting credit* 35.0 118 ○ ◇
4.1.2 Domestic credit to private sector, % GDP 75.1 42
4.1.3 Microfinance gross loans, % GDP n/a n/a
4.2 Investment 24.4 88
4.2.1 Ease of protecting minority investors* 56.0 82
4.2.2 Market capitalization, % GDP 25.4 52
4.2.3 Venture capital investors, deals/bn PPP$ GDP 0.0 45
4.2.4 Venture capital recipients, deals/bn PPP$ GDP n/a n/a
4.3 Trade, diversification, and market scale 72.5 54
4.3.1 Applied tariff rate, weighted avg., % 1.7 23 ●
4.3.2 Domestic industry diversification 88.0 59
4.3.3 Domestic market scale, bn PPP$ 129.2 76
NOTES: ● indicates a strength; ○ a weakness; ◆ an income group strength; ◇ an income group weakness; * an index; †
a survey question. indicates that
the
economy’s data are older than the base year; see appendices for details, including the year of the data, at http://globalinnovationindex.org. Square
brackets [ ] indicate
that the data minimum coverage (DMC) requirements were not met at the sub-pillar or pillar level.](https://image.slidesharecdn.com/e-220805033615-e8521670/75/E-INDEX-2021-pdf-151-2048.jpg)
![132 Global Innovation Index 2021
Pakistan GII 2021 rank
99
Output rank Input rank Income Region Population (mn) GDP, PPP$ (bn) GDP per capita, PPP$ GII 2020 rank
77 117 Lower middle CSA 220.9 1,076.3 5,160 107
Score/
Value Rank
Business sophistication 21.4 88
5.1 Knowledge workers 20.8 [99]
5.1.1 Knowledge-intensive employment, % 11.6 105
5.1.2 Firms offering formal training, % 32.0 46
5.1.3 GERD performed by business, % GDP n/a n/a
5.1.4 GERD financed by business, % n/a n/a
5.1.5 Females employed w/advanced degrees, % 1.6 109
5.2 Innovation linkages 18.4 78
5.2.1 University-industry RD collaboration†
49.0 42 ● ◆
5.2.2 State of cluster development and depth†
48.6 55
5.2.3 GERD financed by abroad, % GDP 0.0 89
5.2.4 Joint venture/strategic alliance deals/bn PPP$ GDP 0.0 57
5.2.5 Patent families/bn PPP$ GDP 0.0 94
5.3 Knowledge absorption 25.1 69
5.3.1 Intellectual property payments, % total trade 0.4 71
5.3.2 High-tech imports, % total trade 10.3 29 ●
5.3.3 ICT services imports, % total trade 1.0 79
5.3.4 FDI net inflows, % GDP 0.7 115
5.3.5 Research talent, % in businesses n/a n/a
Knowledge and technology outputs 19.2 71
6.1 Knowledge creation 15.6 [65]
6.1.1 Patents by origin/bn PPP$ GDP 0.3 88
6.1.2 PCT patents by origin/bn PPP$ GDP n/a n/a
6.1.3 Utility models by origin/bn PPP$ GDP n/a n/a
6.1.4 Scientific and technical articles/bn PPP$ GDP 18.1 49 ● ◆
6.1.5 Citable documents H-index 17.2 50 ● ◆
6.2 Knowledge impact 27.4 74
6.2.1 Labor productivity growth, % 0.7 52
6.2.2 New businesses/th pop. 15–64 0.1 117 ○
6.2.3 Software spending, % GDP 0.3 33 ● ◆
6.2.4 ISO 9001 quality certificates/bn PPP$ GDP 2.3 84
6.2.5 High-tech manufacturing, % n/a n/a
6.3 Knowledge diffusion 14.6 71
6.3.1 Intellectual property receipts, % total trade 0.0 84
6.3.2 Production and export complexity 28.2 98
6.3.3 High-tech exports, % total trade 1.3 70
6.3.4 ICT services exports, % total trade 2.8 36 ●
Creative outputs 18.4 87
7.1 Intangible assets 30.8 64
7.1.1 Trademarks by origin/bn PPP$ GDP 30.7 74
7.1.2 Global brand value, top 5,000, % GDP n/a n/a
7.1.3 Industrial designs by origin/bn PPP$ GDP 0.4 90
7.1.4 ICTs and organizational model creation†
51.6 76
7.2 Creative goods and services 1.1 126 ○ ◇
7.2.1 Cultural and creative services exports, % total trade 0.1 84
7.2.2 National feature films/mn pop. 15–69 0.1 107 ○
7.2.3 Entertainment and media market/th pop. 15–69 0.1 62 ○ ◇
7.2.4 Printing and other media, % manufacturing n/a n/a
7.2.5 Creative goods exports, % total trade 0.1 107
7.3 Online creativity 11.2 89
7.3.1 Generic top-level domains (TLDs)/th pop. 15–69 0.5 106
7.3.2 Country-code TLDs/th pop. 15–69 0.2 110
7.3.3 Wikipedia edits/mn pop. 15–69 19.6 123 ○
7.3.4 Mobile app creation/bn PPP$ GDP 28.5 19 ● ◆
Score/
Value Rank
Institutions 54.0 99
1.1 Political environment 42.8 107
1.1.1 Political and operational stability* 57.1 106
1.1.2 Government effectiveness* 35.6 110
1.2 Regulatory environment 44.9 116
1.2.1 Regulatory quality* 26.7 109
1.2.2 Rule of law* 29.1 107
1.2.3 Cost of redundancy dismissal 27.2 108
1.3 Business environment 74.1 55 ◆
1.3.1 Ease of starting a business* 89.3 59
1.3.2 Ease of resolving insolvency* 59.0 53 ◆
Human capital and research 14.0 117
2.1 Education 27.0 121 ○ ◇
2.1.1 Expenditure on education, % GDP 2.9 100
2.1.2 Government funding/pupil, secondary, % GDP/cap 16.0 70
2.1.3 School life expectancy, years 8.3 117 ○ ◇
2.1.4 PISA scales in reading, maths and science n/a n/a
2.1.5 Pupil-teacher ratio, secondary 16.3 79
2.2 Tertiary education 5.7 [124]
2.2.1 Tertiary enrolment, % gross 9.0 117 ○
2.2.2 Graduates in science and engineering, % n/a n/a
2.2.3 Tertiary inbound mobility, % n/a n/a
2.3 Research and development (RD) 9.2 63
2.3.1 Researchers, FTE/mn pop. 335.6 75
2.3.2 Gross expenditure on RD, % GDP 0.2 88
2.3.3 Global corporate RD investors, top 3, mn US$ 0.0 41 ○ ◇
2.3.4 QS university ranking, top 3* 28.4 43 ● ◆
Infrastructure 25.4 117
3.1 Informationandcommunicationtechnologies(ICTs) 43.0 104
3.1.1 ICT access* 39.0 109
3.1.2 ICT use* 17.9 117 ◇
3.1.3 Government’s online service* 62.9 82
3.1.4 E-participation* 52.4 97
3.2 General infrastructure 12.5 125 ○ ◇
3.2.1 Electricity output, GWh/mn pop. 703.0 104
3.2.2 Logistics performance* 17.3 112 ○
3.2.3 Gross capital formation, % GDP 15.4 113 ○ ◇
3.3 Ecological sustainability 20.5 96
3.3.1 GDP/unit of energy use 10.1 67
3.3.2 Environmental performance* 33.1 111
3.3.3 ISO 14001 environmental certificates/bn PPP$ GDP 0.5 85
Market sophistication 35.1 120 ○
4.1 Credit 20.9 123 ○
4.1.1 Ease of getting credit* 45.0 101
4.1.2 Domestic credit to private sector, % GDP 18.1 115
4.1.3 Microfinance gross loans, % GDP 0.2 50
4.2 Investment 21.1 107
4.2.1 Ease of protecting minority investors* 72.0 27 ● ◆
4.2.2 Market capitalization, % GDP 29.2 49
4.2.3 Venture capital investors, deals/bn PPP$ GDP 0.0 88 ○
4.2.4 Venture capital recipients, deals/bn PPP$ GDP 0.0 78
4.3 Trade, diversification, and market scale 63.2 83
4.3.1 Applied tariff rate, weighted avg., % 8.7 109
4.3.2 Domestic industry diversification n/a n/a
4.3.3 Domestic market scale, bn PPP$ 1,076.3 22 ● ◆
NOTES: ● indicates a strength; ○ a weakness; ◆ an income group strength; ◇ an income group weakness; * an index; †
a survey question. indicates that
the
economy’s data are older than the base year; see appendices for details, including the year of the data, at http://globalinnovationindex.org. Square
brackets [ ] indicate
that the data minimum coverage (DMC) requirements were not met at the sub-pillar or pillar level.](https://image.slidesharecdn.com/e-220805033615-e8521670/75/E-INDEX-2021-pdf-152-2048.jpg)
![133
GII 2021 Economy profiles
Panama GII 2021 rank
83
Output rank Input rank Income Region Population (mn) GDP, PPP$ (bn) GDP per capita, PPP$ GII 2020 rank
79 83 High LCN 4.3 128.5 30,034 73
Score/
Value Rank
Business sophistication 18.6 103 ◇
5.1 Knowledge workers 17.4 106 ◇
5.1.1 Knowledge-intensive employment, % 24.0 66 ◇
5.1.2 Firms offering formal training, % 11.0 95 ○ ◇
5.1.3 GERD performed by business, % GDP n/a n/a
5.1.4 GERD financed by business, % 1.5 91 ◇
5.1.5 Females employed w/advanced degrees, % 10.5 67 ◇
5.2 Innovation linkages 18.6 75 ◇
5.2.1 University-industry RD collaboration†
37.1 94 ◇
5.2.2 State of cluster development and depth†
47.5 58
5.2.3 GERD financed by abroad, % GDP 0.1 53
5.2.4 Joint venture/strategic alliance deals/bn PPP$ GDP 0.0 78
5.2.5 Patent families/bn PPP$ GDP 0.3 37
5.3 Knowledge absorption 19.7 94 ◇
5.3.1 Intellectual property payments, % total trade 0.2 94
5.3.2 High-tech imports, % total trade 7.7 66
5.3.3 ICT services imports, % total trade 0.3 118 ○ ◇
5.3.4 FDI net inflows, % GDP 8.2 10 ●
5.3.5 Research talent, % in businesses n/a n/a
Knowledge and technology outputs 10.9 113 ◇
6.1 Knowledge creation 5.0 112 ◇
6.1.1 Patents by origin/bn PPP$ GDP 0.2 91
6.1.2 PCT patents by origin/bn PPP$ GDP 0.2 55
6.1.3 Utility models by origin/bn PPP$ GDP 0.0 73 ○
6.1.4 Scientific and technical articles/bn PPP$ GDP 4.8 110 ◇
6.1.5 Citable documents H-index 12.2 63
6.2 Knowledge impact 11.1 122 ○ ◇
6.2.1 Labor productivity growth, % n/a n/a
6.2.2 New businesses/th pop. 15–64 4.8 32 ●
6.2.3 Software spending, % GDP 0.2 67
6.2.4 ISO 9001 quality certificates/bn PPP$ GDP 1.6 93 ◇
6.2.5 High-tech manufacturing, % 7.3 96 ◇
6.3 Knowledge diffusion 16.7 66
6.3.1 Intellectual property receipts, % total trade 0.0 74
6.3.2 Production and export complexity 38.3 73 ◇
6.3.3 High-tech exports, % total trade 5.1 36 ●
6.3.4 ICT services exports, % total trade 1.1 81
Creative outputs 25.8 58
7.1 Intangible assets 25.0 87 ◇
7.1.1 Trademarks by origin/bn PPP$ GDP 33.0 70
7.1.2 Global brand value, top 5,000, % GDP 12.2 57
7.1.3 Industrial designs by origin/bn PPP$ GDP 0.0 119 ○ ◇
7.1.4 ICTs and organizational model creation†
57.4 55
7.2 Creative goods and services 25.3 37
7.2.1 Cultural and creative services exports, % total trade 0.4 53
7.2.2 National feature films/mn pop. 15–69 0.4 100 ○ ◇
7.2.3 Entertainment and media market/th pop. 15–69 n/a n/a
7.2.4 Printing and other media, % manufacturing 2.5 6 ● ◆
7.2.5 Creative goods exports, % total trade 2.9 23 ●
7.3 Online creativity 28.0 38
7.3.1 Generic top-level domains (TLDs)/th pop. 15–69 56.4 13 ●
7.3.2 Country-code TLDs/th pop. 15–69 1.3 79 ◇
7.3.3 Wikipedia edits/mn pop. 15–69 48.6 68 ◇
7.3.4 Mobile app creation/bn PPP$ GDP 6.0 54
Score/
Value Rank
Institutions 62.8 69 ◇
1.1 Political environment 58.5 63 ◇
1.1.1 Political and operational stability* 71.4 54 ◇
1.1.2 Government effectiveness* 52.1 68 ◇
1.2 Regulatory environment 64.1 68 ◇
1.2.1 Regulatory quality* 53.0 56 ◇
1.2.2 Rule of law* 43.6 67 ◇
1.2.3 Cost of redundancy dismissal 18.1 76
1.3 Business environment 65.8 82 ◇
1.3.1 Ease of starting a business* 92.0 46
1.3.2 Ease of resolving insolvency* 39.5 99 ◇
Human capital and research 19.5 99 ◇
2.1 Education 31.6 111 ◇
2.1.1 Expenditure on education, % GDP 3.2 92 ◇
2.1.2 Government funding/pupil, secondary, % GDP/cap 9.2 93 ○ ◇
2.1.3 School life expectancy, years 12.9 83 ◇
2.1.4 PISA scales in reading, maths and science 364.8 76 ○ ◇
2.1.5 Pupil-teacher ratio, secondary 13.6 62
2.2 Tertiary education 25.1 84 ◇
2.2.1 Tertiary enrolment, % gross 47.8 65 ◇
2.2.2 Graduates in science and engineering, % 15.4 97 ◇
2.2.3 Tertiary inbound mobility, % n/a n/a
2.3 Research and development (RD) 1.7 98 ◇
2.3.1 Researchers, FTE/mn pop. 39.1 97 ○ ◇
2.3.2 Gross expenditure on RD, % GDP 0.1 96 ◇
2.3.3 Global corporate RD investors, top 3, mn US$ 0.0 41 ○ ◇
2.3.4 QS university ranking, top 3* 3.7 72 ◇
Infrastructure 46.8 50 ◇
3.1 Informationandcommunicationtechnologies(ICTs) 60.8 81 ◇
3.1.1 ICT access* 64.9 70 ◇
3.1.2 ICT use* 57.7 66 ◇
3.1.3 Government’s online service* 62.4 83 ◇
3.1.4 E-participation* 58.3 89 ◇
3.2 General infrastructure 39.7 30 ●
3.2.1 Electricity output, GWh/mn pop. 2,740.2 68 ◇
3.2.2 Logistics performance* 57.1 37
3.2.3 Gross capital formation, % GDP 33.8 13 ● ◆
3.3 Ecological sustainability 39.8 36 ●
3.3.1 GDP/unit of energy use 23.5 5 ● ◆
3.3.2 Environmental performance* 47.3 64 ◇
3.3.3 ISO 14001 environmental certificates/bn PPP$ GDP 0.2 105 ◇
Market sophistication 40.7 97 ◇
4.1 Credit 47.6 40
4.1.1 Ease of getting credit* 80.0 23 ●
4.1.2 Domestic credit to private sector, % GDP 86.8 33 ●
4.1.3 Microfinance gross loans, % GDP 0.4 39
4.2 Investment 16.9 126 ○ ◇
4.2.1 Ease of protecting minority investors* 56.0 82
4.2.2 Market capitalization, % GDP 24.5 53
4.2.3 Venture capital investors, deals/bn PPP$ GDP 0.0 79 ◇
4.2.4 Venture capital recipients, deals/bn PPP$ GDP 0.0 77
4.3 Trade, diversification, and market scale 57.7 101 ◇
4.3.1 Applied tariff rate, weighted avg., % 5.4 93 ◇
4.3.2 Domestic industry diversification 61.5 102 ○ ◇
4.3.3 Domestic market scale, bn PPP$ 128.5 77
NOTES: ● indicates a strength; ○ a weakness; ◆ an income group strength; ◇ an income group weakness; * an index; †
a survey question. indicates that
the
economy’s data are older than the base year; see appendices for details, including the year of the data, at http://globalinnovationindex.org. Square
brackets [ ] indicate
that the data minimum coverage (DMC) requirements were not met at the sub-pillar or pillar level.](https://image.slidesharecdn.com/e-220805033615-e8521670/75/E-INDEX-2021-pdf-153-2048.jpg)
![134 Global Innovation Index 2021
Paraguay GII 2021 rank
88
Output rank Input rank Income Region Population (mn) GDP, PPP$ (bn) GDP per capita, PPP$ GII 2020 rank
87 90 Upper middle LCN 7.1 90.7 12,503 97
Score/
Value Rank
Business sophistication 25.4 66
5.1 Knowledge workers 27.7 80
5.1.1 Knowledge-intensive employment, % 18.6 83
5.1.2 Firms offering formal training, % 46.4 21 ●
5.1.3 GERD performed by business, % GDP n/a n/a
5.1.4 GERD financed by business, % 0.4 98 ○ ◇
5.1.5 Females employed w/advanced degrees, % 9.5 72
5.2 Innovation linkages 12.7 121 ◇
5.2.1 University-industry RD collaboration†
24.5 124 ○ ◇
5.2.2 State of cluster development and depth†
40.4 99
5.2.3 GERD financed by abroad, % GDP 0.0 67
5.2.4 Joint venture/strategic alliance deals/bn PPP$ GDP 0.0 118
5.2.5 Patent families/bn PPP$ GDP 0.0 100 ○ ◇
5.3 Knowledge absorption 35.7 39 ●
5.3.1 Intellectual property payments, % total trade 0.1 98
5.3.2 High-tech imports, % total trade 22.8 6 ● ◆
5.3.3 ICT services imports, % total trade 0.0 131 ○ ◇
5.3.4 FDI net inflows, % GDP 1.2 104
5.3.5 Research talent, % in businesses n/a n/a
Knowledge and technology outputs 10.0 117 ◇
6.1 Knowledge creation 3.0 [122]
6.1.1 Patents by origin/bn PPP$ GDP 0.3 89
6.1.2 PCT patents by origin/bn PPP$ GDP n/a n/a
6.1.3 Utility models by origin/bn PPP$ GDP n/a n/a
6.1.4 Scientific and technical articles/bn PPP$ GDP 2.4 123 ○ ◇
6.1.5 Citable documents H-index 4.0 114
6.2 Knowledge impact 19.4 108
6.2.1 Labor productivity growth, % −0.7 77
6.2.2 New businesses/th pop. 15–64 0.2 110
6.2.3 Software spending, % GDP 0.0 105 ◇
6.2.4 ISO 9001 quality certificates/bn PPP$ GDP 4.5 61 ●
6.2.5 High-tech manufacturing, % 15.0 76
6.3 Knowledge diffusion 7.6 103
6.3.1 Intellectual property receipts, % total trade n/a n/a
6.3.2 Production and export complexity 31.1 88
6.3.3 High-tech exports, % total trade 0.6 87
6.3.4 ICT services exports, % total trade 0.1 126 ○
Creative outputs 24.8 62
7.1 Intangible assets 41.7 36 ●
7.1.1 Trademarks by origin/bn PPP$ GDP 119.2 1 ● ◆
7.1.2 Global brand value, top 5,000, % GDP 0.0 80 ○ ◇
7.1.3 Industrial designs by origin/bn PPP$ GDP 1.7 50 ●
7.1.4 ICTs and organizational model creation†
41.8 110 ◇
7.2 Creative goods and services 6.4 [98]
7.2.1 Cultural and creative services exports, % total trade 0.0 107 ○
7.2.2 National feature films/mn pop. 15–69 n/a n/a
7.2.3 Entertainment and media market/th pop. 15–69 n/a n/a
7.2.4 Printing and other media, % manufacturing 1.3 34 ●
7.2.5 Creative goods exports, % total trade 0.1 111
7.3 Online creativity 9.5 96
7.3.1 Generic top-level domains (TLDs)/th pop. 15–69 1.7 85
7.3.2 Country-code TLDs/th pop. 15–69 1.5 74
7.3.3 Wikipedia edits/mn pop. 15–69 36.7 90 ◇
7.3.4 Mobile app creation/bn PPP$ GDP 0.0 97 ○
Score/
Value Rank
Institutions 50.9 110 ◇
1.1 Political environment 47.3 97 ◇
1.1.1 Political and operational stability* 64.3 80
1.1.2 Government effectiveness* 38.8 101 ◇
1.2 Regulatory environment 46.4 111 ◇
1.2.1 Regulatory quality* 38.2 85
1.2.2 Rule of law* 32.1 98
1.2.3 Cost of redundancy dismissal 29.4 117
1.3 Business environment 59.0 107
1.3.1 Ease of starting a business* 76.0 118
1.3.2 Ease of resolving insolvency* 42.1 94
Human capital and research 19.8 98 ◇
2.1 Education 33.8 108 ◇
2.1.1 Expenditure on education, % GDP 3.4 87
2.1.2 Government funding/pupil, secondary, % GDP/cap 11.9 84
2.1.3 School life expectancy, years 12.2 90 ◇
2.1.4 PISA scales in reading, maths and science n/a n/a
2.1.5 Pupil-teacher ratio, secondary 18.4 89
2.2 Tertiary education 23.8 [88]
2.2.1 Tertiary enrolment, % gross 34.6 80
2.2.2 Graduates in science and engineering, % n/a n/a
2.2.3 Tertiary inbound mobility, % n/a n/a
2.3 Research and development (RD) 1.8 97
2.3.1 Researchers, FTE/mn pop. 139.7 84 ◇
2.3.2 Gross expenditure on RD, % GDP 0.1 97
2.3.3 Global corporate RD investors, top 3, mn US$ 0.0 41 ○ ◇
2.3.4 QS university ranking, top 3* 3.0 73
Infrastructure 38.9 77
3.1 Informationandcommunicationtechnologies(ICTs) 59.2 85
3.1.1 ICT access* 45.0 99 ◇
3.1.2 ICT use* 46.2 88
3.1.3 Government’s online service* 70.6 65
3.1.4 E-participation* 75.0 57
3.2 General infrastructure 30.4 61 ●
3.2.1 Electricity output, GWh/mn pop. 7,013.9 29 ● ◆
3.2.2 Logistics performance* 34.2 73
3.2.3 Gross capital formation, % GDP 24.8 48 ●
3.3 Ecological sustainability 27.1 71
3.3.1 GDP/unit of energy use 12.4 46 ●
3.3.2 Environmental performance* 46.4 67
3.3.3 ISO 14001 environmental certificates/bn PPP$ GDP 0.3 92
Market sophistication 42.0 89
4.1 Credit 38.5 75
4.1.1 Ease of getting credit* 40.0 113 ◇
4.1.2 Domestic credit to private sector, % GDP 46.7 75
4.1.3 Microfinance gross loans, % GDP 4.3 8 ● ◆
4.2 Investment 34.0 [53]
4.2.1 Ease of protecting minority investors* 34.0 118 ◇
4.2.2 Market capitalization, % GDP n/a n/a
4.2.3 Venture capital investors, deals/bn PPP$ GDP n/a n/a
4.2.4 Venture capital recipients, deals/bn PPP$ GDP n/a n/a
4.3 Trade, diversification, and market scale 53.6 111 ◇
4.3.1 Applied tariff rate, weighted avg., % 5.0 84
4.3.2 Domestic industry diversification n/a n/a
4.3.3 Domestic market scale, bn PPP$ 90.7 87
NOTES: ● indicates a strength; ○ a weakness; ◆ an income group strength; ◇ an income group weakness; * an index; †
a survey question. indicates that
the
economy’s data are older than the base year; see appendices for details, including the year of the data, at http://globalinnovationindex.org. Square
brackets [ ] indicate
that the data minimum coverage (DMC) requirements were not met at the sub-pillar or pillar level.](https://image.slidesharecdn.com/e-220805033615-e8521670/75/E-INDEX-2021-pdf-154-2048.jpg)
![135
GII 2021 Economy profiles
Peru GII 2021 rank
70
Output rank Input rank Income Region Population (mn) GDP, PPP$ (bn) GDP per capita, PPP$ GII 2020 rank
82 52 Upper middle LCN 33.0 385.7 11,516 76
Score/
Value Rank
Business sophistication 34.3 37 ◆
5.1 Knowledge workers 58.0 [20]
5.1.1 Knowledge-intensive employment, % 24.4 62
5.1.2 Firms offering formal training, % 65.9 6 ● ◆
5.1.3 GERD performed by business, % GDP n/a n/a
5.1.4 GERD financed by business, % n/a n/a
5.1.5 Females employed w/advanced degrees, % 17.4 40
5.2 Innovation linkages 16.5 99
5.2.1 University-industry RD collaboration†
31.4 107 ○ ◇
5.2.2 State of cluster development and depth†
39.8 101
5.2.3 GERD financed by abroad, % GDP n/a n/a
5.2.4 Joint venture/strategic alliance deals/bn PPP$ GDP 0.0 120 ○
5.2.5 Patent families/bn PPP$ GDP 0.0 65
5.3 Knowledge absorption 28.3 60
5.3.1 Intellectual property payments, % total trade 0.7 61
5.3.2 High-tech imports, % total trade 8.6 52
5.3.3 ICT services imports, % total trade 1.8 39 ◆
5.3.4 FDI net inflows, % GDP 3.4 41
5.3.5 Research talent, % in businesses n/a n/a
Knowledge and technology outputs 14.9 87
6.1 Knowledge creation 9.4 82
6.1.1 Patents by origin/bn PPP$ GDP 0.3 87
6.1.2 PCT patents by origin/bn PPP$ GDP 0.1 65
6.1.3 Utility models by origin/bn PPP$ GDP 0.6 33
6.1.4 Scientific and technical articles/bn PPP$ GDP 5.4 107 ○
6.1.5 Citable documents H-index 14.3 57
6.2 Knowledge impact 29.5 66
6.2.1 Labor productivity growth, % 3.3 14 ● ◆
6.2.2 New businesses/th pop. 15–64 3.8 37
6.2.3 Software spending, % GDP 0.3 50
6.2.4 ISO 9001 quality certificates/bn PPP$ GDP 4.0 64
6.2.5 High-tech manufacturing, % 13.6 80
6.3 Knowledge diffusion 5.9 116 ○
6.3.1 Intellectual property receipts, % total trade 0.1 70
6.3.2 Production and export complexity 25.2 103 ○ ◇
6.3.3 High-tech exports, % total trade 0.3 98
6.3.4 ICT services exports, % total trade 0.3 107 ○
Creative outputs 21.2 77
7.1 Intangible assets 30.3 67
7.1.1 Trademarks by origin/bn PPP$ GDP 66.1 30 ●
7.1.2 Global brand value, top 5,000, % GDP 6.5 67
7.1.3 Industrial designs by origin/bn PPP$ GDP 0.3 98
7.1.4 ICTs and organizational model creation†
48.6 86
7.2 Creative goods and services 9.9 79
7.2.1 Cultural and creative services exports, % total trade 0.1 85
7.2.2 National feature films/mn pop. 15–69 1.1 83
7.2.3 Entertainment and media market/th pop. 15–69 7.6 41
7.2.4 Printing and other media, % manufacturing 2.1 14 ● ◆
7.2.5 Creative goods exports, % total trade 0.3 71
7.3 Online creativity 14.1 76
7.3.1 Generic top-level domains (TLDs)/th pop. 15–69 5.1 53
7.3.2 Country-code TLDs/th pop. 15–69 1.7 72
7.3.3 Wikipedia edits/mn pop. 15–69 49.3 67
7.3.4 Mobile app creation/bn PPP$ GDP 0.5 79
Score/
Value Rank
Institutions 62.5 70
1.1 Political environment 53.6 83
1.1.1 Political and operational stability* 62.5 89
1.1.2 Government effectiveness* 49.1 78
1.2 Regulatory environment 69.6 50
1.2.1 Regulatory quality* 58.2 45 ◆
1.2.2 Rule of law* 33.9 95
1.2.3 Cost of redundancy dismissal 11.4 36 ●
1.3 Business environment 64.3 87
1.3.1 Ease of starting a business* 82.1 102
1.3.2 Ease of resolving insolvency* 46.6 82
Human capital and research 34.3 53
2.1 Education 42.7 85
2.1.1 Expenditure on education, % GDP 3.8 73
2.1.2 Government funding/pupil, secondary, % GDP/cap 14.8 77
2.1.3 School life expectancy, years 15.0 52
2.1.4 PISA scales in reading, maths and science 401.5 66 ○
2.1.5 Pupil-teacher ratio, secondary 13.5 60
2.2 Tertiary education 53.5 8 ● ◆
2.2.1 Tertiary enrolment, % gross 70.7 30 ●
2.2.2 Graduates in science and engineering, % 29.6 17 ●
2.2.3 Tertiary inbound mobility, % n/a n/a
2.3 Research and development (RD) 6.8 69
2.3.1 Researchers, FTE/mn pop. n/a n/a
2.3.2 Gross expenditure on RD, % GDP 0.1 101 ○
2.3.3 Global corporate RD investors, top 3, mn US$ 0.0 41 ○ ◇
2.3.4 QS university ranking, top 3* 18.1 55
Infrastructure 38.8 78
3.1 Informationandcommunicationtechnologies(ICTs) 62.5 77
3.1.1 ICT access* 52.1 88
3.1.2 ICT use* 46.3 87
3.1.3 Government’s online service* 75.3 52
3.1.4 E-participation* 76.2 55
3.2 General infrastructure 19.8 112 ○
3.2.1 Electricity output, GWh/mn pop. 1,717.9 88
3.2.2 Logistics performance* 30.0 82
3.2.3 Gross capital formation, % GDP 19.2 93
3.3 Ecological sustainability 34.2 49
3.3.1 GDP/unit of energy use 17.2 13 ● ◆
3.3.2 Environmental performance* 44.0 79
3.3.3 ISO 14001 environmental certificates/bn PPP$ GDP 1.5 58
Market sophistication 52.2 38
4.1 Credit 56.8 19 ● ◆
4.1.1 Ease of getting credit* 75.0 34
4.1.2 Domestic credit to private sector, % GDP 45.0 77
4.1.3 Microfinance gross loans, % GDP 5.8 1 ● ◆
4.2 Investment 21.1 106
4.2.1 Ease of protecting minority investors* 68.0 44
4.2.2 Market capitalization, % GDP 44.2 37
4.2.3 Venture capital investors, deals/bn PPP$ GDP 0.0 83 ○
4.2.4 Venture capital recipients, deals/bn PPP$ GDP 0.0 90 ○
4.3 Trade, diversification, and market scale 78.6 31 ●
4.3.1 Applied tariff rate, weighted avg., % 0.7 6 ●
4.3.2 Domestic industry diversification 89.6 52
4.3.3 Domestic market scale, bn PPP$ 385.7 47
NOTES: ● indicates a strength; ○ a weakness; ◆ an income group strength; ◇ an income group weakness; * an index; †
a survey question. indicates that
the
economy’s data are older than the base year; see appendices for details, including the year of the data, at http://globalinnovationindex.org. Square
brackets [ ] indicate
that the data minimum coverage (DMC) requirements were not met at the sub-pillar or pillar level.](https://image.slidesharecdn.com/e-220805033615-e8521670/75/E-INDEX-2021-pdf-155-2048.jpg)
![136 Global Innovation Index 2021
Philippines GII 2021 rank
51
Output rank Input rank Income Region Population (mn) GDP, PPP$ (bn) GDP per capita, PPP$ GII 2020 rank
40 72 Lower middle SEAO 109.6 933.9 8,574 50
Score/
Value Rank
Business sophistication 36.3 33 ◆
5.1 Knowledge workers 38.1 47 ◆
5.1.1 Knowledge-intensive employment, % 21.1 77
5.1.2 Firms offering formal training, % 59.8 8 ● ◆
5.1.3 GERD performed by business, % GDP 0.1 70
5.1.4 GERD financed by business, % 38.0 49 ◆
5.1.5 Females employed w/advanced degrees, % 12.4 60
5.2 Innovation linkages 17.1 94
5.2.1 University-industry RD collaboration†
43.7 61
5.2.2 State of cluster development and depth†
42.3 92
5.2.3 GERD financed by abroad, % GDP 0.0 92 ○
5.2.4 Joint venture/strategic alliance deals/bn PPP$ GDP 0.0 44 ◆
5.2.5 Patent families/bn PPP$ GDP 0.0 80
5.3 Knowledge absorption 53.8 10 ● ◆
5.3.1 Intellectual property payments, % total trade 0.8 58
5.3.2 High-tech imports, % total trade 26.8 1 ● ◆
5.3.3 ICT services imports, % total trade 1.2 63
5.3.4 FDI net inflows, % GDP 2.7 66
5.3.5 Research talent, % in businesses 51.8 20 ◆
Knowledge and technology outputs 37.1 24 ● ◆
6.1 Knowledge creation 19.1 55
6.1.1 Patents by origin/bn PPP$ GDP 0.5 79
6.1.2 PCT patents by origin/bn PPP$ GDP 0.0 80
6.1.3 Utility models by origin/bn PPP$ GDP 2.5 8 ● ◆
6.1.4 Scientific and technical articles/bn PPP$ GDP 2.1 124 ○
6.1.5 Citable documents H-index 14.8 55
6.2 Knowledge impact 33.6 47 ◆
6.2.1 Labor productivity growth, % 1.6 31
6.2.2 New businesses/th pop. 15–64 0.3 109 ○
6.2.3 Software spending, % GDP 0.2 59
6.2.4 ISO 9001 quality certificates/bn PPP$ GDP 4.2 63
6.2.5 High-tech manufacturing, % 40.3 27 ◆
6.3 Knowledge diffusion 58.7 5 ● ◆
6.3.1 Intellectual property receipts, % total trade 0.0 80
6.3.2 Production and export complexity 59.5 35 ◆
6.3.3 High-tech exports, % total trade 32.3 1 ● ◆
6.3.4 ICT services exports, % total trade 5.4 13 ● ◆
Creative outputs 24.2 65
7.1 Intangible assets 29.9 71
7.1.1 Trademarks by origin/bn PPP$ GDP 34.0 66
7.1.2 Global brand value, top 5,000, % GDP 40.3 39 ◆
7.1.3 Industrial designs by origin/bn PPP$ GDP 1.1 65
7.1.4 ICTs and organizational model creation†
61.7 39 ◆
7.2 Creative goods and services 27.0 33 ◆
7.2.1 Cultural and creative services exports, % total trade 0.2 74
7.2.2 National feature films/mn pop. 15–69 0.8 89
7.2.3 Entertainment and media market/th pop. 15–69 4.0 49 ◆
7.2.4 Printing and other media, % manufacturing 0.5 87 ○
7.2.5 Creative goods exports, % total trade 6.3 10 ● ◆
7.3 Online creativity 10.0 92
7.3.1 Generic top-level domains (TLDs)/th pop. 15–69 1.1 93
7.3.2 Country-code TLDs/th pop. 15–69 0.4 100
7.3.3 Wikipedia edits/mn pop. 15–69 37.5 89
7.3.4 Mobile app creation/bn PPP$ GDP 2.8 67
Score/
Value Rank
Institutions 56.3 90
1.1 Political environment 55.4 74 ◆
1.1.1 Political and operational stability* 62.5 89
1.1.2 Government effectiveness* 51.8 69 ◆
1.2 Regulatory environment 50.2 104
1.2.1 Regulatory quality* 43.7 71 ◆
1.2.2 Rule of law* 34.1 94
1.2.3 Cost of redundancy dismissal 27.4 114 ○
1.3 Business environment 63.2 94
1.3.1 Ease of starting a business* 71.3 125 ○ ◇
1.3.2 Ease of resolving insolvency* 55.1 60
Human capital and research 27.9 80
2.1 Education 37.9 [97]
2.1.1 Expenditure on education, % GDP n/a n/a
2.1.2 Government funding/pupil, secondary, % GDP/cap n/a n/a
2.1.3 School life expectancy, years 13.1 80
2.1.4 PISA scales in reading, maths and science 349.7 78 ○
2.1.5 Pupil-teacher ratio, secondary 25.2 105
2.2 Tertiary education 39.8 41 ◆
2.2.1 Tertiary enrolment, % gross 35.5 79
2.2.2 Graduates in science and engineering, % 28.7 19 ●
2.2.3 Tertiary inbound mobility, % n/a n/a
2.3 Research and development (RD) 6.1 74
2.3.1 Researchers, FTE/mn pop. 105.7 87
2.3.2 Gross expenditure on RD, % GDP 0.2 95
2.3.3 Global corporate RD investors, top 3, mn US$ 0.0 41 ○ ◇
2.3.4 QS university ranking, top 3* 20.3 53 ◆
Infrastructure 36.1 86
3.1 Informationandcommunicationtechnologies(ICTs) 58.1 87
3.1.1 ICT access* 44.1 100
3.1.2 ICT use* 40.2 98
3.1.3 Government’s online service* 72.9 60 ◆
3.1.4 E-participation* 75.0 57 ◆
3.2 General infrastructure 21.5 101
3.2.1 Electricity output, GWh/mn pop. 930.1 100
3.2.2 Logistics performance* 39.8 59 ◆
3.2.3 Gross capital formation, % GDP 19.1 95
3.3 Ecological sustainability 28.9 63 ◆
3.3.1 GDP/unit of energy use 15.1 21 ● ◆
3.3.2 Environmental performance* 38.4 92
3.3.3 ISO 14001 environmental certificates/bn PPP$ GDP 1.0 67 ◆
Market sophistication 42.9 86
4.1 Credit 23.4 119 ○
4.1.1 Ease of getting credit* 40.0 113 ○
4.1.2 Domestic credit to private sector, % GDP 48.0 74
4.1.3 Microfinance gross loans, % GDP 0.0 70
4.2 Investment 22.7 102
4.2.1 Ease of protecting minority investors* 60.0 71
4.2.2 Market capitalization, % GDP 78.6 21 ◆
4.2.3 Venture capital investors, deals/bn PPP$ GDP 0.0 77 ○
4.2.4 Venture capital recipients, deals/bn PPP$ GDP 0.0 74
4.3 Trade, diversification, and market scale 82.6 21 ● ◆
4.3.1 Applied tariff rate, weighted avg., % 1.7 22 ● ◆
4.3.2 Domestic industry diversification 93.4 39
4.3.3 Domestic market scale, bn PPP$ 933.9 27 ● ◆
NOTES: ● indicates a strength; ○ a weakness; ◆ an income group strength; ◇ an income group weakness; * an index; †
a survey question. indicates that
the
economy’s data are older than the base year; see appendices for details, including the year of the data, at http://globalinnovationindex.org. Square
brackets [ ] indicate
that the data minimum coverage (DMC) requirements were not met at the sub-pillar or pillar level.](https://image.slidesharecdn.com/e-220805033615-e8521670/75/E-INDEX-2021-pdf-156-2048.jpg)
![137
GII 2021 Economy profiles
Poland GII 2021 rank
40
Output rank Input rank Income Region Population (mn) GDP, PPP$ (bn) GDP per capita, PPP$ GII 2020 rank
42 37 High EUR 37.8 1,280.7 33,739 38
Score/
Value Rank
Business sophistication 34.2 38
5.1 Knowledge workers 45.1 32
5.1.1 Knowledge-intensive employment, % 39.9 27
5.1.2 Firms offering formal training, % 21.7 72 ○
5.1.3 GERD performed by business, % GDP 0.8 26
5.1.4 GERD financed by business, % 53.2 23
5.1.5 Females employed w/advanced degrees, % 21.6 27
5.2 Innovation linkages 20.0 71 ◇
5.2.1 University-industry RD collaboration†
38.3 86 ○ ◇
5.2.2 State of cluster development and depth†
46.7 63
5.2.3 GERD financed by abroad, % GDP 0.1 42
5.2.4 Joint venture/strategic alliance deals/bn PPP$ GDP 0.0 68
5.2.5 Patent families/bn PPP$ GDP 0.3 35
5.3 Knowledge absorption 37.4 33
5.3.1 Intellectual property payments, % total trade 1.2 32
5.3.2 High-tech imports, % total trade 8.8 50
5.3.3 ICT services imports, % total trade 1.4 56
5.3.4 FDI net inflows, % GDP 2.6 69
5.3.5 Research talent, % in businesses 47.9 29
Knowledge and technology outputs 30.6 36
6.1 Knowledge creation 27.2 35
6.1.1 Patents by origin/bn PPP$ GDP 3.3 25 ●
6.1.2 PCT patents by origin/bn PPP$ GDP 0.3 42
6.1.3 Utility models by origin/bn PPP$ GDP 0.7 32
6.1.4 Scientific and technical articles/bn PPP$ GDP 27.0 34
6.1.5 Citable documents H-index 36.5 26
6.2 Knowledge impact 35.3 41
6.2.1 Labor productivity growth, % 2.3 23 ● ◆
6.2.2 New businesses/th pop. 15–64 1.4 70
6.2.3 Software spending, % GDP 0.2 60
6.2.4 ISO 9001 quality certificates/bn PPP$ GDP 8.8 31
6.2.5 High-tech manufacturing, % 32.6 39
6.3 Knowledge diffusion 29.3 37
6.3.1 Intellectual property receipts, % total trade 0.2 42
6.3.2 Production and export complexity 69.3 23 ●
6.3.3 High-tech exports, % total trade 6.3 29
6.3.4 ICT services exports, % total trade 2.8 37
Creative outputs 29.6 50
7.1 Intangible assets 29.5 73
7.1.1 Trademarks by origin/bn PPP$ GDP 32.0 73
7.1.2 Global brand value, top 5,000, % GDP 33.8 42
7.1.3 Industrial designs by origin/bn PPP$ GDP n/a n/a
7.1.4 ICTs and organizational model creation†
51.9 74 ◇
7.2 Creative goods and services 29.4 26
7.2.1 Cultural and creative services exports, % total trade 1.2 24
7.2.2 National feature films/mn pop. 15–69 1.8 71 ○ ◇
7.2.3 Entertainment and media market/th pop. 15–69 12.1 34 ◇
7.2.4 Printing and other media, % manufacturing 1.2 37
7.2.5 Creative goods exports, % total trade 4.5 12 ● ◆
7.3 Online creativity 30.1 35
7.3.1 Generic top-level domains (TLDs)/th pop. 15–69 7.1 46
7.3.2 Country-code TLDs/th pop. 15–69 26.9 26
7.3.3 Wikipedia edits/mn pop. 15–69 68.5 42
7.3.4 Mobile app creation/bn PPP$ GDP 15.5 32
Score/
Value Rank
Institutions 73.2 38
1.1 Political environment 68.3 43
1.1.1 Political and operational stability* 76.8 37
1.1.2 Government effectiveness* 64.0 42
1.2 Regulatory environment 71.5 47
1.2.1 Regulatory quality* 70.0 31
1.2.2 Rule of law* 58.6 47 ◇
1.2.3 Cost of redundancy dismissal 18.8 78 ○
1.3 Business environment 79.7 35
1.3.1 Ease of starting a business* 82.9 99 ○ ◇
1.3.2 Ease of resolving insolvency* 76.5 23 ●
Human capital and research 42.3 37
2.1 Education 57.0 43
2.1.1 Expenditure on education, % GDP 4.6 56
2.1.2 Government funding/pupil, secondary, % GDP/cap 20.9 43
2.1.3 School life expectancy, years 16.0 37
2.1.4 PISA scales in reading, maths and science 512.8 9 ●
2.1.5 Pupil-teacher ratio, secondary 10.5 34
2.2 Tertiary education 35.1 60
2.2.1 Tertiary enrolment, % gross 68.6 35
2.2.2 Graduates in science and engineering, % 21.7 63
2.2.3 Tertiary inbound mobility, % 3.6 58
2.3 Research and development (RD) 34.7 33
2.3.1 Researchers, FTE/mn pop. 3,187.8 30
2.3.2 Gross expenditure on RD, % GDP 1.3 28
2.3.3 Global corporate RD investors, top 3, mn US$ 45.4 35
2.3.4 QS university ranking, top 3* 29.1 40
Infrastructure 50.1 41
3.1 Informationandcommunicationtechnologies(ICTs) 82.7 24 ●
3.1.1 ICT access* 75.7 48
3.1.2 ICT use* 72.9 38
3.1.3 Government’s online service* 85.9 22 ●
3.1.4 E-participation* 96.4 9 ● ◆
3.2 General infrastructure 31.0 57
3.2.1 Electricity output, GWh/mn pop. 4,253.2 52
3.2.2 Logistics performance* 69.3 27
3.2.3 Gross capital formation, % GDP 18.1 99 ○
3.3 Ecological sustainability 36.5 40
3.3.1 GDP/unit of energy use 11.7 54
3.3.2 Environmental performance* 60.9 37
3.3.3 ISO 14001 environmental certificates/bn PPP$ GDP 2.9 30
Market sophistication 48.3 60
4.1 Credit 38.3 77
4.1.1 Ease of getting credit* 75.0 34
4.1.2 Domestic credit to private sector, % GDP 50.8 67
4.1.3 Microfinance gross loans, % GDP 0.1 57 ○
4.2 Investment 20.8 108 ○
4.2.1 Ease of protecting minority investors* 66.0 50
4.2.2 Market capitalization, % GDP 30.3 47 ○
4.2.3 Venture capital investors, deals/bn PPP$ GDP 0.0 63 ○
4.2.4 Venture capital recipients, deals/bn PPP$ GDP 0.0 68 ○
4.3 Trade, diversification, and market scale 85.7 11 ●
4.3.1 Applied tariff rate, weighted avg., % 1.8 25
4.3.2 Domestic industry diversification 98.6 7 ●
4.3.3 Domestic market scale, bn PPP$ 1,280.7 20 ●
NOTES: ● indicates a strength; ○ a weakness; ◆ an income group strength; ◇ an income group weakness; * an index; †
a survey question. indicates that
the
economy’s data are older than the base year; see appendices for details, including the year of the data, at http://globalinnovationindex.org. Square
brackets [ ] indicate
that the data minimum coverage (DMC) requirements were not met at the sub-pillar or pillar level.](https://image.slidesharecdn.com/e-220805033615-e8521670/75/E-INDEX-2021-pdf-157-2048.jpg)
![138 Global Innovation Index 2021
Portugal GII 2021 rank
31
Output rank Input rank Income Region Population (mn) GDP, PPP$ (bn) GDP per capita, PPP$ GII 2020 rank
30 32 High EUR 10.2 339.9 33,131 31
Score/
Value Rank
Business sophistication 33.6 41
5.1 Knowledge workers 42.5 39
5.1.1 Knowledge-intensive employment, % 36.3 36
5.1.2 Firms offering formal training, % 29.0 54 ○
5.1.3 GERD performed by business, % GDP 0.7 31
5.1.4 GERD financed by business, % 48.3 30
5.1.5 Females employed w/advanced degrees, % 17.1 41
5.2 Innovation linkages 25.1 46
5.2.1 University-industry RD collaboration†
55.1 29
5.2.2 State of cluster development and depth†
54.1 39
5.2.3 GERD financed by abroad, % GDP 0.1 40
5.2.4 Joint venture/strategic alliance deals/bn PPP$ GDP 0.0 64
5.2.5 Patent families/bn PPP$ GDP 0.6 31
5.3 Knowledge absorption 33.3 47
5.3.1 Intellectual property payments, % total trade 0.8 45
5.3.2 High-tech imports, % total trade 9.9 37
5.3.3 ICT services imports, % total trade 1.1 71 ○
5.3.4 FDI net inflows, % GDP 3.8 31
5.3.5 Research talent, % in businesses 38.3 34
Knowledge and technology outputs 31.9 34
6.1 Knowledge creation 31.2 31
6.1.1 Patents by origin/bn PPP$ GDP 2.6 29
6.1.2 PCT patents by origin/bn PPP$ GDP 0.8 30
6.1.3 Utility models by origin/bn PPP$ GDP 0.1 51 ○
6.1.4 Scientific and technical articles/bn PPP$ GDP 50.2 10 ● ◆
6.1.5 Citable documents H-index 32.7 30
6.2 Knowledge impact 43.3 17 ●
6.2.1 Labor productivity growth, % −1.2 90 ○
6.2.2 New businesses/th pop. 15–64 6.5 24
6.2.3 Software spending, % GDP 0.5 8 ●
6.2.4 ISO 9001 quality certificates/bn PPP$ GDP 18.1 15 ●
6.2.5 High-tech manufacturing, % 29.7 43
6.3 Knowledge diffusion 21.0 52
6.3.1 Intellectual property receipts, % total trade 0.1 49
6.3.2 Production and export complexity 62.4 33
6.3.3 High-tech exports, % total trade 3.4 45
6.3.4 ICT services exports, % total trade 1.8 61
Creative outputs 39.3 26
7.1 Intangible assets 50.1 19 ●
7.1.1 Trademarks by origin/bn PPP$ GDP 91.7 12 ● ◆
7.1.2 Global brand value, top 5,000, % GDP 50.7 36
7.1.3 Industrial designs by origin/bn PPP$ GDP 7.3 18 ●
7.1.4 ICTs and organizational model creation†
64.8 30
7.2 Creative goods and services 20.1 53
7.2.1 Cultural and creative services exports, % total trade 0.6 41
7.2.2 National feature films/mn pop. 15–69 5.2 42
7.2.3 Entertainment and media market/th pop. 15–69 36.1 21
7.2.4 Printing and other media, % manufacturing 1.1 47
7.2.5 Creative goods exports, % total trade 1.3 39
7.3 Online creativity 36.7 30
7.3.1 Generic top-level domains (TLDs)/th pop. 15–69 19.6 29
7.3.2 Country-code TLDs/th pop. 15–69 55.9 14 ●
7.3.3 Wikipedia edits/mn pop. 15–69 64.9 45
7.3.4 Mobile app creation/bn PPP$ GDP 4.4 59 ○
Score/
Value Rank
Institutions 80.4 25
1.1 Political environment 78.2 25
1.1.1 Political and operational stability* 82.1 24
1.1.2 Government effectiveness* 76.3 26
1.2 Regulatory environment 77.5 34
1.2.1 Regulatory quality* 68.8 37
1.2.2 Rule of law* 76.6 24
1.2.3 Cost of redundancy dismissal 17.0 67 ○
1.3 Business environment 85.5 18 ●
1.3.1 Ease of starting a business* 90.9 53
1.3.2 Ease of resolving insolvency* 80.2 14 ●
Human capital and research 49.3 24
2.1 Education 63.9 15 ●
2.1.1 Expenditure on education, % GDP 5.0 38
2.1.2 Government funding/pupil, secondary, % GDP/cap 29.6 8 ● ◆
2.1.3 School life expectancy, years 16.7 21
2.1.4 PISA scales in reading, maths and science 492.0 26
2.1.5 Pupil-teacher ratio, secondary 9.3 21
2.2 Tertiary education 43.8 26
2.2.1 Tertiary enrolment, % gross 65.7 39
2.2.2 Graduates in science and engineering, % 27.9 24
2.2.3 Tertiary inbound mobility, % 7.9 33
2.3 Research and development (RD) 40.3 27
2.3.1 Researchers, FTE/mn pop. 4,905.6 18
2.3.2 Gross expenditure on RD, % GDP 1.4 26
2.3.3 Global corporate RD investors, top 3, mn US$ 45.6 34
2.3.4 QS university ranking, top 3* 29.0 41
Infrastructure 52.6 31
3.1 Informationandcommunicationtechnologies(ICTs) 81.2 27
3.1.1 ICT access* 86.0 18 ●
3.1.2 ICT use* 73.0 37
3.1.3 Government’s online service* 83.5 35
3.1.4 E-participation* 82.1 41
3.2 General infrastructure 33.8 44
3.2.1 Electricity output, GWh/mn pop. 5,032.0 43
3.2.2 Logistics performance* 74.1 23
3.2.3 Gross capital formation, % GDP 19.2 94 ○
3.3 Ecological sustainability 42.8 31
3.3.1 GDP/unit of energy use 15.7 20
3.3.2 Environmental performance* 67.0 27
3.3.3 ISO 14001 environmental certificates/bn PPP$ GDP 2.8 31
Market sophistication 48.6 56
4.1 Credit 41.0 63
4.1.1 Ease of getting credit* 45.0 101 ○ ◇
4.1.2 Domestic credit to private sector, % GDP 90.7 28
4.1.3 Microfinance gross loans, % GDP n/a n/a
4.2 Investment 23.9 93 ○
4.2.1 Ease of protecting minority investors* 62.0 60 ○
4.2.2 Market capitalization, % GDP 29.2 48 ○
4.2.3 Venture capital investors, deals/bn PPP$ GDP 0.1 40
4.2.4 Venture capital recipients, deals/bn PPP$ GDP 0.0 39
4.3 Trade, diversification, and market scale 81.0 25
4.3.1 Applied tariff rate, weighted avg., % 1.8 25
4.3.2 Domestic industry diversification 100.0 1 ●
4.3.3 Domestic market scale, bn PPP$ 340.0 50
NOTES: ● indicates a strength; ○ a weakness; ◆ an income group strength; ◇ an income group weakness; * an index; †
a survey question. indicates that
the
economy’s data are older than the base year; see appendices for details, including the year of the data, at http://globalinnovationindex.org. Square
brackets [ ] indicate
that the data minimum coverage (DMC) requirements were not met at the sub-pillar or pillar level.](https://image.slidesharecdn.com/e-220805033615-e8521670/75/E-INDEX-2021-pdf-158-2048.jpg)
![139
GII 2021 Economy profiles
Qatar GII 2021 rank
68
Output rank Input rank Income Region Population (mn) GDP, PPP$ (bn) GDP per capita, PPP$ GII 2020 rank
70 64 High NAWA 2.9 257.5 91,897 70
Score/
Value Rank
Business sophistication 19.9 96 ◇
5.1 Knowledge workers 12.9 118 ○ ◇
5.1.1 Knowledge-intensive employment, % 18.1 86 ◇
5.1.2 Firms offering formal training, % n/a n/a
5.1.3 GERD performed by business, % GDP 0.1 69 ◇
5.1.4 GERD financed by business, % 9.3 77 ◇
5.1.5 Females employed w/advanced degrees, % 4.5 96 ◇
5.2 Innovation linkages 22.8 55
5.2.1 University-industry RD collaboration†
65.4 14 ●
5.2.2 State of cluster development and depth†
54.1 38
5.2.3 GERD financed by abroad, % GDP 0.0 93 ○ ◇
5.2.4 Joint venture/strategic alliance deals/bn PPP$ GDP 0.1 34
5.2.5 Patent families/bn PPP$ GDP 0.0 69
5.3 Knowledge absorption 24.1 72
5.3.1 Intellectual property payments, % total trade 0.1 102 ○ ◇
5.3.2 High-tech imports, % total trade 7.5 68
5.3.3 ICT services imports, % total trade 2.9 9 ●
5.3.4 FDI net inflows, % GDP −0.7 123 ○
5.3.5 Research talent, % in businesses 16.1 57 ◇
Knowledge and technology outputs 16.8 79 ◇
6.1 Knowledge creation 8.7 87 ◇
6.1.1 Patents by origin/bn PPP$ GDP 0.2 102
6.1.2 PCT patents by origin/bn PPP$ GDP 0.1 66
6.1.3 Utility models by origin/bn PPP$ GDP n/a n/a
6.1.4 Scientific and technical articles/bn PPP$ GDP 12.2 70 ◇
6.1.5 Citable documents H-index 10.2 76
6.2 Knowledge impact 30.0 62
6.2.1 Labor productivity growth, % −2.6 109 ○ ◇
6.2.2 New businesses/th pop. 15–64 6.3 26 ●
6.2.3 Software spending, % GDP 0.3 32
6.2.4 ISO 9001 quality certificates/bn PPP$ GDP 3.1 73
6.2.5 High-tech manufacturing, % 34.7 35
6.3 Knowledge diffusion 11.8 86 ◇
6.3.1 Intellectual property receipts, % total trade n/a n/a
6.3.2 Production and export complexity 36.7 74 ◇
6.3.3 High-tech exports, % total trade 0.3 96 ◇
6.3.4 ICT services exports, % total trade 1.1 79
Creative outputs 24.7 63 ◇
7.1 Intangible assets 32.7 58
7.1.1 Trademarks by origin/bn PPP$ GDP 5.0 121 ○ ◇
7.1.2 Global brand value, top 5,000, % GDP 97.5 20 ●
7.1.3 Industrial designs by origin/bn PPP$ GDP n/a n/a
7.1.4 ICTs and organizational model creation†
63.9 33
7.2 Creative goods and services 20.4 50
7.2.1 Cultural and creative services exports, % total trade 0.3 62
7.2.2 National feature films/mn pop. 15–69 23.0 4 ● ◆
7.2.3 Entertainment and media market/th pop. 15–69 19.6 28
7.2.4 Printing and other media, % manufacturing 0.7 72
7.2.5 Creative goods exports, % total trade 0.2 82
7.3 Online creativity 12.9 81 ◇
7.3.1 Generic top-level domains (TLDs)/th pop. 15–69 3.4 60
7.3.2 Country-code TLDs/th pop. 15–69 2.6 63
7.3.3 Wikipedia edits/mn pop. 15–69 45.8 73 ◇
7.3.4 Mobile app creation/bn PPP$ GDP 0.4 83
Score/
Value Rank
Institutions 66.0 57 ◇
1.1 Political environment 69.2 41
1.1.1 Political and operational stability* 75.0 40
1.1.2 Government effectiveness* 66.3 39
1.2 Regulatory environment 66.8 61 ◇
1.2.1 Regulatory quality* 61.3 40
1.2.2 Rule of law* 66.1 36
1.2.3 Cost of redundancy dismissal 23.2 100 ◇
1.3 Business environment 62.0 98 ◇
1.3.1 Ease of starting a business* 86.1 84 ◇
1.3.2 Ease of resolving insolvency* 38.0 107 ◇
Human capital and research 29.8 75 ◇
2.1 Education 40.1 94 ◇
2.1.1 Expenditure on education, % GDP 2.7 105 ○ ◇
2.1.2 Government funding/pupil, secondary, % GDP/cap n/a n/a
2.1.3 School life expectancy, years 12.3 89 ◇
2.1.4 PISA scales in reading, maths and science 413.5 60 ◇
2.1.5 Pupil-teacher ratio, secondary 11.8 47
2.2 Tertiary education 42.0 37
2.2.1 Tertiary enrolment, % gross 18.9 98 ◇
2.2.2 Graduates in science and engineering, % 24.2 43
2.2.3 Tertiary inbound mobility, % 35.3 1 ● ◆
2.3 Research and development (RD) 7.4 67 ◇
2.3.1 Researchers, FTE/mn pop. 577.3 63 ◇
2.3.2 Gross expenditure on RD, % GDP 0.5 66
2.3.3 Global corporate RD investors, top 3, mn US$ 0.0 41 ○ ◇
2.3.4 QS university ranking, top 3* 12.6 61
Infrastructure 52.3 34
3.1 Informationandcommunicationtechnologies(ICTs) 70.8 57 ◇
3.1.1 ICT access* 79.8 34
3.1.2 ICT use* 72.1 41
3.1.3 Government’s online service* 65.9 76 ◇
3.1.4 E-participation* 65.5 77 ◇
3.2 General infrastructure 64.4 2 ● ◆
3.2.1 Electricity output, GWh/mn pop. 17,222.5 6 ● ◆
3.2.2 Logistics performance* 66.3 29 ●
3.2.3 Gross capital formation, % GDP n/a n/a
3.3 Ecological sustainability 21.7 89 ◇
3.3.1 GDP/unit of energy use 7.7 94
3.3.2 Environmental performance* 37.1 99 ◇
3.3.3 ISO 14001 environmental certificates/bn PPP$ GDP 1.7 51
Market sophistication 43.2 83
4.1 Credit 43.2 55
4.1.1 Ease of getting credit* 45.0 101 ○ ◇
4.1.2 Domestic credit to private sector, % GDP 100.9 24 ●
4.1.3 Microfinance gross loans, % GDP n/a n/a
4.2 Investment 15.6 128 ○ ◇
4.2.1 Ease of protecting minority investors* 28.0 124 ○ ◇
4.2.2 Market capitalization, % GDP 87.0 17 ●
4.2.3 Venture capital investors, deals/bn PPP$ GDP 0.0 60
4.2.4 Venture capital recipients, deals/bn PPP$ GDP 0.0 89 ○
4.3 Trade, diversification, and market scale 70.8 59
4.3.1 Applied tariff rate, weighted avg., % 3.5 67
4.3.2 Domestic industry diversification 81.8 72
4.3.3 Domestic market scale, bn PPP$ 257.5 59
NOTES: ● indicates a strength; ○ a weakness; ◆ an income group strength; ◇ an income group weakness; * an index; †
a survey question. indicates that
the
economy’s data are older than the base year; see appendices for details, including the year of the data, at http://globalinnovationindex.org. Square
brackets [ ] indicate
that the data minimum coverage (DMC) requirements were not met at the sub-pillar or pillar level.](https://image.slidesharecdn.com/e-220805033615-e8521670/75/E-INDEX-2021-pdf-159-2048.jpg)
![140 Global Innovation Index 2021
Republic of Korea GII 2021 rank
5
Output rank Input rank Income Region Population (mn) GDP, PPP$ (bn) GDP per capita, PPP$ GII 2020 rank
5 9 High SEAO 51.3 2,293.5 44,292 10
Score/
Value Rank
Business sophistication 60.1 7
5.1 Knowledge workers 78.1 1 ● ◆
5.1.1 Knowledge-intensive employment, % 39.1 28 ◇
5.1.2 Firms offering formal training, % n/a n/a
5.1.3 GERD performed by business, % GDP 3.7 2 ● ◆
5.1.4 GERD financed by business, % 76.9 3 ● ◆
5.1.5 Females employed w/advanced degrees, % 20.2 30
5.2 Innovation linkages 48.3 15
5.2.1 University-industry RD collaboration†
62.5 18
5.2.2 State of cluster development and depth†
61.6 24
5.2.3 GERD financed by abroad, % GDP 0.1 46
5.2.4 Joint venture/strategic alliance deals/bn PPP$ GDP 0.0 37 ◇
5.2.5 Patent families/bn PPP$ GDP 11.0 1 ● ◆
5.3 Knowledge absorption 54.0 8
5.3.1 Intellectual property payments, % total trade 1.5 25
5.3.2 High-tech imports, % total trade 15.9 11
5.3.3 ICT services imports, % total trade 0.5 104 ○ ◇
5.3.4 FDI net inflows, % GDP 0.8 111 ○
5.3.5 Research talent, % in businesses 82.3 1 ● ◆
Knowledge and technology outputs 54.5 8
6.1 Knowledge creation 66.1 7
6.1.1 Patents by origin/bn PPP$ GDP 74.5 1 ● ◆
6.1.2 PCT patents by origin/bn PPP$ GDP 8.7 1 ● ◆
6.1.3 Utility models by origin/bn PPP$ GDP 2.2 11
6.1.4 Scientific and technical articles/bn PPP$ GDP 30.0 29
6.1.5 Citable documents H-index 45.1 17
6.2 Knowledge impact 40.0 23
6.2.1 Labor productivity growth, % 1.1 41
6.2.2 New businesses/th pop. 15–64 2.6 51
6.2.3 Software spending, % GDP 0.2 66 ◇
6.2.4 ISO 9001 quality certificates/bn PPP$ GDP 6.2 45
6.2.5 High-tech manufacturing, % 59.1 5
6.3 Knowledge diffusion 57.2 7
6.3.1 Intellectual property receipts, % total trade 1.2 18
6.3.2 Production and export complexity 92.6 3 ● ◆
6.3.3 High-tech exports, % total trade 24.1 1 ● ◆
6.3.4 ICT services exports, % total trade 0.9 85 ○
Creative outputs 52.1 8
7.1 Intangible assets 74.1 1 ● ◆
7.1.1 Trademarks by origin/bn PPP$ GDP 99.1 8 ◆
7.1.2 Global brand value, top 5,000, % GDP 191.6 5
7.1.3 Industrial designs by origin/bn PPP$ GDP 26.6 1 ● ◆
7.1.4 ICTs and organizational model creation†
64.0 32 ◇
7.2 Creative goods and services 32.4 20
7.2.1 Cultural and creative services exports, % total trade 0.6 40
7.2.2 National feature films/mn pop. 15–69 12.5 13
7.2.3 Entertainment and media market/th pop. 15–69 51.7 16
7.2.4 Printing and other media, % manufacturing 0.3 100 ○ ◇
7.2.5 Creative goods exports, % total trade 3.6 14
7.3 Online creativity 28.1 37 ◇
7.3.1 Generic top-level domains (TLDs)/th pop. 15–69 8.2 43 ◇
7.3.2 Country-code TLDs/th pop. 15–69 8.2 43 ◇
7.3.3 Wikipedia edits/mn pop. 15–69 61.8 48 ◇
7.3.4 Mobile app creation/bn PPP$ GDP 32.5 14
Score/
Value Rank
Institutions 79.5 28
1.1 Political environment 82.1 18
1.1.1 Political and operational stability* 83.9 13
1.1.2 Government effectiveness* 81.2 21
1.2 Regulatory environment 68.2 57 ◇
1.2.1 Regulatory quality* 71.5 29 ◇
1.2.2 Rule of law* 78.2 23
1.2.3 Cost of redundancy dismissal 27.4 110 ○ ◇
1.3 Business environment 88.1 10
1.3.1 Ease of starting a business* 93.4 31
1.3.2 Ease of resolving insolvency* 82.9 10
Human capital and research 67.4 1 ● ◆
2.1 Education 61.5 22
2.1.1 Expenditure on education, % GDP 4.6 55
2.1.2 Government funding/pupil, secondary, % GDP/cap 28.4 11 ◆
2.1.3 School life expectancy, years 16.5 26
2.1.4 PISA scales in reading, maths and science 519.7 6
2.1.5 Pupil-teacher ratio, secondary 12.6 53
2.2 Tertiary education 51.0 13
2.2.1 Tertiary enrolment, % gross 95.9 4 ◆
2.2.2 Graduates in science and engineering, % 29.3 18
2.2.3 Tertiary inbound mobility, % 2.7 71 ○ ◇
2.3 Research and development (RD) 89.8 1 ● ◆
2.3.1 Researchers, FTE/mn pop. 8,407.8 1 ● ◆
2.3.2 Gross expenditure on RD, % GDP 4.6 2 ● ◆
2.3.3 Global corporate RD investors, top 3, mn US$ 90.2 4 ●
2.3.4 QS university ranking, top 3* 74.9 9
Infrastructure 59.2 12
3.1 Informationandcommunicationtechnologies(ICTs) 94.8 1 ● ◆
3.1.1 ICT access* 90.0 8
3.1.2 ICT use* 89.1 5 ◆
3.1.3 Government’s online service* 100.0 1 ● ◆
3.1.4 E-participation* 100.0 1 ●
3.2 General infrastructure 49.4 11
3.2.1 Electricity output, GWh/mn pop. 11,358.9 11
3.2.2 Logistics performance* 72.7 25
3.2.3 Gross capital formation, % GDP 31.3 23 ◆
3.3 Ecological sustainability 33.4 50 ◇
3.3.1 GDP/unit of energy use 7.7 95 ○
3.3.2 Environmental performance* 66.5 28
3.3.3 ISO 14001 environmental certificates/bn PPP$ GDP 2.6 33
Market sophistication 60.0 18
4.1 Credit 64.2 12
4.1.1 Ease of getting credit* 65.0 61 ○
4.1.2 Domestic credit to private sector, % GDP 151.7 8
4.1.3 Microfinance gross loans, % GDP n/a n/a
4.2 Investment 31.5 65 ◇
4.2.1 Ease of protecting minority investors* 74.0 24
4.2.2 Market capitalization, % GDP 91.6 15
4.2.3 Venture capital investors, deals/bn PPP$ GDP 0.1 34 ◇
4.2.4 Venture capital recipients, deals/bn PPP$ GDP 0.0 63 ○ ◇
4.3 Trade, diversification, and market scale 84.2 16
4.3.1 Applied tariff rate, weighted avg., % 4.8 82 ○
4.3.2 Domestic industry diversification 97.3 14
4.3.3 Domestic market scale, bn PPP$ 2,293.5 14
NOTES: ● indicates a strength; ○ a weakness; ◆ an income group strength; ◇ an income group weakness; * an index; †
a survey question. indicates that
the
economy’s data are older than the base year; see appendices for details, including the year of the data, at http://globalinnovationindex.org. Square
brackets [ ] indicate
that the data minimum coverage (DMC) requirements were not met at the sub-pillar or pillar level.](https://image.slidesharecdn.com/e-220805033615-e8521670/75/E-INDEX-2021-pdf-160-2048.jpg)
![141
GII 2021 Economy profiles
Republic of Moldova GII 2021 rank
64
Output rank Input rank Income Region Population (mn) GDP, PPP$ (bn) GDP per capita, PPP$ GII 2020 rank
54 80 Lower middle EUR 4.0 34.9 13,253 59
Score/
Value Rank
Business sophistication 21.7 87
5.1 Knowledge workers 30.5 67
5.1.1 Knowledge-intensive employment, % 31.1 46 ◆
5.1.2 Firms offering formal training, % 38.1 33
5.1.3 GERD performed by business, % GDP 0.0 76 ○
5.1.4 GERD financed by business, % 15.5 72
5.1.5 Females employed w/advanced degrees, % 16.4 42 ◆
5.2 Innovation linkages 13.0 119 ○
5.2.1 University-industry RD collaboration†
28.7 116 ○
5.2.2 State of cluster development and depth†
26.1 126 ○ ◇
5.2.3 GERD financed by abroad, % GDP 0.0 75
5.2.4 Joint venture/strategic alliance deals/bn PPP$ GDP n/a n/a
5.2.5 Patent families/bn PPP$ GDP 0.2 45 ◆
5.3 Knowledge absorption 21.6 82
5.3.1 Intellectual property payments, % total trade 0.5 66
5.3.2 High-tech imports, % total trade 7.6 67
5.3.3 ICT services imports, % total trade 1.9 35 ◆
5.3.4 FDI net inflows, % GDP 2.8 60
5.3.5 Research talent, % in businesses 6.2 69
Knowledge and technology outputs 24.2 54 ◆
6.1 Knowledge creation 30.2 34 ◆
6.1.1 Patents by origin/bn PPP$ GDP 2.4 31 ● ◆
6.1.2 PCT patents by origin/bn PPP$ GDP 0.1 59 ◆
6.1.3 Utility models by origin/bn PPP$ GDP 3.8 1 ● ◆
6.1.4 Scientific and technical articles/bn PPP$ GDP 7.4 98
6.1.5 Citable documents H-index 6.0 96
6.2 Knowledge impact 19.9 104
6.2.1 Labor productivity growth, % −1.1 84
6.2.2 New businesses/th pop. 15–64 1.9 59
6.2.3 Software spending, % GDP 0.1 87
6.2.4 ISO 9001 quality certificates/bn PPP$ GDP 2.6 81
6.2.5 High-tech manufacturing, % 16.2 70
6.3 Knowledge diffusion 22.4 51
6.3.1 Intellectual property receipts, % total trade 0.1 63
6.3.2 Production and export complexity 39.7 70
6.3.3 High-tech exports, % total trade 0.9 74
6.3.4 ICT services exports, % total trade 5.0 15 ● ◆
Creative outputs 28.5 53 ◆
7.1 Intangible assets 43.3 34 ◆
7.1.1 Trademarks by origin/bn PPP$ GDP 87.8 14 ● ◆
7.1.2 Global brand value, top 5,000, % GDP 0.0 80 ○ ◇
7.1.3 Industrial designs by origin/bn PPP$ GDP 12.5 9 ● ◆
7.1.4 ICTs and organizational model creation†
48.3 87
7.2 Creative goods and services 8.2 88
7.2.1 Cultural and creative services exports, % total trade 0.9 32 ◆
7.2.2 National feature films/mn pop. 15–69 0.3 101 ○
7.2.3 Entertainment and media market/th pop. 15–69 n/a n/a
7.2.4 Printing and other media, % manufacturing 0.7 74
7.2.5 Creative goods exports, % total trade 0.1 97
7.3 Online creativity 19.1 60 ◆
7.3.1 Generic top-level domains (TLDs)/th pop. 15–69 2.1 75 ◆
7.3.2 Country-code TLDs/th pop. 15–69 2.3 66 ◆
7.3.3 Wikipedia edits/mn pop. 15–69 45.2 75 ◆
7.3.4 Mobile app creation/bn PPP$ GDP 27.4 20 ● ◆
Score/
Value Rank
Institutions 59.8 81
1.1 Political environment 49.5 92
1.1.1 Political and operational stability* 64.3 80
1.1.2 Government effectiveness* 42.1 93
1.2 Regulatory environment 54.6 95
1.2.1 Regulatory quality* 43.8 70 ◆
1.2.2 Rule of law* 36.9 84
1.2.3 Cost of redundancy dismissal 23.7 101
1.3 Business environment 75.2 49 ◆
1.3.1 Ease of starting a business* 95.7 12 ● ◆
1.3.2 Ease of resolving insolvency* 54.8 62
Human capital and research 28.8 77
2.1 Education 51.7 63
2.1.1 Expenditure on education, % GDP 6.1 13 ● ◆
2.1.2 Government funding/pupil, secondary, % GDP/cap 24.2 18 ●
2.1.3 School life expectancy, years 11.4 96
2.1.4 PISA scales in reading, maths and science 424.4 51
2.1.5 Pupil-teacher ratio, secondary 10.3 31 ● ◆
2.2 Tertiary education 31.5 70
2.2.1 Tertiary enrolment, % gross 39.2 75
2.2.2 Graduates in science and engineering, % 24.8 40
2.2.3 Tertiary inbound mobility, % 5.6 41 ◆
2.3 Research and development (RD) 3.2 84
2.3.1 Researchers, FTE/mn pop. 696.1 59
2.3.2 Gross expenditure on RD, % GDP 0.3 87
2.3.3 Global corporate RD investors, top 3, mn US$ 0.0 41 ○ ◇
2.3.4 QS university ranking, top 3* 0.0 74 ○ ◇
Infrastructure 36.5 82 ◆
3.1 Informationandcommunicationtechnologies(ICTs) 68.0 62 ◆
3.1.1 ICT access* 66.4 68 ◆
3.1.2 ICT use* 54.2 73 ◆
3.1.3 Government’s online service* 75.3 52 ◆
3.1.4 E-participation* 76.2 55 ◆
3.2 General infrastructure 22.2 95
3.2.1 Electricity output, GWh/mn pop. 1,520.3 90
3.2.2 Logistics performance* 19.0 108 ○
3.2.3 Gross capital formation, % GDP 25.5 41
3.3 Ecological sustainability 19.3 105
3.3.1 GDP/unit of energy use 6.0 107 ○
3.3.2 Environmental performance* 44.4 76 ◆
3.3.3 ISO 14001 environmental certificates/bn PPP$ GDP 0.3 97
Market sophistication 44.9 74
4.1 Credit 33.6 94
4.1.1 Ease of getting credit* 70.0 44
4.1.2 Domestic credit to private sector, % GDP 24.8 105
4.1.3 Microfinance gross loans, % GDP 0.7 30
4.2 Investment 39.1 [38]
4.2.1 Ease of protecting minority investors* 68.0 44
4.2.2 Market capitalization, % GDP n/a n/a
4.2.3 Venture capital investors, deals/bn PPP$ GDP n/a n/a
4.2.4 Venture capital recipients, deals/bn PPP$ GDP 0.0 42
4.3 Trade, diversification, and market scale 61.8 86
4.3.1 Applied tariff rate, weighted avg., % 3.5 71
4.3.2 Domestic industry diversification 80.1 78
4.3.3 Domestic market scale, bn PPP$ 34.9 116 ○
NOTES: ● indicates a strength; ○ a weakness; ◆ an income group strength; ◇ an income group weakness; * an index; †
a survey question. indicates that
the
economy’s data are older than the base year; see appendices for details, including the year of the data, at http://globalinnovationindex.org. Square
brackets [ ] indicate
that the data minimum coverage (DMC) requirements were not met at the sub-pillar or pillar level.](https://image.slidesharecdn.com/e-220805033615-e8521670/75/E-INDEX-2021-pdf-161-2048.jpg)
![142 Global Innovation Index 2021
Romania GII 2021 rank
48
Output rank Input rank Income Region Population (mn) GDP, PPP$ (bn) GDP per capita, PPP$ GII 2020 rank
50 54 High EUR 19.2 584.9 30,141 46
Score/
Value Rank
Business sophistication 28.0 54
5.1 Knowledge workers 33.4 60
5.1.1 Knowledge-intensive employment, % 24.0 65 ◇
5.1.2 Firms offering formal training, % 20.5 77 ○ ◇
5.1.3 GERD performed by business, % GDP 0.3 48
5.1.4 GERD financed by business, % 57.1 15 ●
5.1.5 Females employed w/advanced degrees, % 11.4 64 ◇
5.2 Innovation linkages 16.1 103 ○ ◇
5.2.1 University-industry RD collaboration†
38.2 88 ◇
5.2.2 State of cluster development and depth†
42.4 90 ◇
5.2.3 GERD financed by abroad, % GDP 0.0 55
5.2.4 Joint venture/strategic alliance deals/bn PPP$ GDP 0.0 93 ○
5.2.5 Patent families/bn PPP$ GDP 0.0 66
5.3 Knowledge absorption 34.5 44
5.3.1 Intellectual property payments, % total trade 0.9 40
5.3.2 High-tech imports, % total trade 10.0 34
5.3.3 ICT services imports, % total trade 2.6 14 ●
5.3.4 FDI net inflows, % GDP 2.9 52
5.3.5 Research talent, % in businesses 26.5 48
Knowledge and technology outputs 31.8 35
6.1 Knowledge creation 12.0 71 ◇
6.1.1 Patents by origin/bn PPP$ GDP 1.5 48
6.1.2 PCT patents by origin/bn PPP$ GDP 0.1 71
6.1.3 Utility models by origin/bn PPP$ GDP 0.1 59 ○
6.1.4 Scientific and technical articles/bn PPP$ GDP 14.2 62
6.1.5 Citable documents H-index 18.8 44
6.2 Knowledge impact 45.3 12 ●
6.2.1 Labor productivity growth, % 2.1 26 ◆
6.2.2 New businesses/th pop. 15–64 7.3 21 ●
6.2.3 Software spending, % GDP 0.2 58
6.2.4 ISO 9001 quality certificates/bn PPP$ GDP 16.3 16 ●
6.2.5 High-tech manufacturing, % 44.1 21 ●
6.3 Knowledge diffusion 38.0 23 ●
6.3.1 Intellectual property receipts, % total trade 0.1 60
6.3.2 Production and export complexity 69.0 25
6.3.3 High-tech exports, % total trade 6.6 27
6.3.4 ICT services exports, % total trade 5.9 10 ●
Creative outputs 22.2 72 ◇
7.1 Intangible assets 26.1 83 ◇
7.1.1 Trademarks by origin/bn PPP$ GDP 38.2 61
7.1.2 Global brand value, top 5,000, % GDP 20.7 48
7.1.3 Industrial designs by origin/bn PPP$ GDP 1.6 55
7.1.4 ICTs and organizational model creation†
50.0 82 ◇
7.2 Creative goods and services 16.1 63
7.2.1 Cultural and creative services exports, % total trade 1.8 12 ●
7.2.2 National feature films/mn pop. 15–69 2.0 69 ◇
7.2.3 Entertainment and media market/th pop. 15–69 7.1 44 ◇
7.2.4 Printing and other media, % manufacturing 0.9 58
7.2.5 Creative goods exports, % total trade 0.8 54
7.3 Online creativity 20.6 56 ◇
7.3.1 Generic top-level domains (TLDs)/th pop. 15–69 4.5 56
7.3.2 Country-code TLDs/th pop. 15–69 13.5 36
7.3.3 Wikipedia edits/mn pop. 15–69 54.3 59 ◇
7.3.4 Mobile app creation/bn PPP$ GDP 9.6 47
Score/
Value Rank
Institutions 68.1 53 ◇
1.1 Political environment 52.8 86 ◇
1.1.1 Political and operational stability* 69.6 60 ◇
1.1.2 Government effectiveness* 44.4 89 ◇
1.2 Regulatory environment 78.0 33
1.2.1 Regulatory quality* 55.6 52 ◇
1.2.2 Rule of law* 56.3 49 ◇
1.2.3 Cost of redundancy dismissal 8.0 1 ● ◆
1.3 Business environment 73.4 57
1.3.1 Ease of starting a business* 87.7 73
1.3.2 Ease of resolving insolvency* 59.1 51
Human capital and research 28.9 76 ◇
2.1 Education 41.5 90 ◇
2.1.1 Expenditure on education, % GDP 3.1 95 ○ ◇
2.1.2 Government funding/pupil, secondary, % GDP/cap 16.4 68 ◇
2.1.3 School life expectancy, years 14.3 67 ◇
2.1.4 PISA scales in reading, maths and science 427.8 49 ◇
2.1.5 Pupil-teacher ratio, secondary 11.8 48
2.2 Tertiary education 38.5 46
2.2.1 Tertiary enrolment, % gross 51.0 62
2.2.2 Graduates in science and engineering, % 28.1 23
2.2.3 Tertiary inbound mobility, % 5.4 44
2.3 Research and development (RD) 6.8 70 ◇
2.3.1 Researchers, FTE/mn pop. 896.0 52 ◇
2.3.2 Gross expenditure on RD, % GDP 0.5 68
2.3.3 Global corporate RD investors, top 3, mn US$ 0.0 41 ○ ◇
2.3.4 QS university ranking, top 3* 7.1 69 ◇
Infrastructure 51.5 37
3.1 Informationandcommunicationtechnologies(ICTs) 73.9 52
3.1.1 ICT access* 73.4 51 ◇
3.1.2 ICT use* 68.9 50 ◇
3.1.3 Government’s online service* 72.4 61
3.1.4 E-participation* 81.0 46
3.2 General infrastructure 29.0 65
3.2.1 Electricity output, GWh/mn pop. 3,309.2 61
3.2.2 Logistics performance* 49.8 47
3.2.3 Gross capital formation, % GDP 22.6 62
3.3 Ecological sustainability 51.7 9 ●
3.3.1 GDP/unit of energy use 14.9 23 ●
3.3.2 Environmental performance* 64.7 32
3.3.3 ISO 14001 environmental certificates/bn PPP$ GDP 7.9 10 ● ◆
Market sophistication 44.7 76
4.1 Credit 35.3 87
4.1.1 Ease of getting credit* 80.0 23
4.1.2 Domestic credit to private sector, % GDP 24.7 106 ○ ◇
4.1.3 Microfinance gross loans, % GDP 0.0 73 ○
4.2 Investment 17.4 123 ○ ◇
4.2.1 Ease of protecting minority investors* 62.0 60
4.2.2 Market capitalization, % GDP 10.4 68 ○ ◇
4.2.3 Venture capital investors, deals/bn PPP$ GDP 0.0 74 ○ ◇
4.2.4 Venture capital recipients, deals/bn PPP$ GDP 0.0 76 ○
4.3 Trade, diversification, and market scale 81.5 23 ●
4.3.1 Applied tariff rate, weighted avg., % 1.8 25
4.3.2 Domestic industry diversification 95.7 24
4.3.3 Domestic market scale, bn PPP$ 584.8 35
NOTES: ● indicates a strength; ○ a weakness; ◆ an income group strength; ◇ an income group weakness; * an index; †
a survey question. indicates that
the
economy’s data are older than the base year; see appendices for details, including the year of the data, at http://globalinnovationindex.org. Square
brackets [ ] indicate
that the data minimum coverage (DMC) requirements were not met at the sub-pillar or pillar level.](https://image.slidesharecdn.com/e-220805033615-e8521670/75/E-INDEX-2021-pdf-162-2048.jpg)
![143
GII 2021 Economy profiles
Russian Federation GII 2021 rank
45
Output rank Input rank Income Region Population (mn) GDP, PPP$ (bn) GDP per capita, PPP$ GII 2020 rank
52 43 Upper middle EUR 145.9 4,021.7 27,394 47
Score/
Value Rank
Business sophistication 31.8 44
5.1 Knowledge workers 38.2 46
5.1.1 Knowledge-intensive employment, % 44.9 18 ● ◆
5.1.2 Firms offering formal training, % 11.8 94 ○ ◇
5.1.3 GERD performed by business, % GDP 0.6 34
5.1.4 GERD financed by business, % 30.2 60
5.1.5 Females employed w/advanced degrees, % 26.2 10 ● ◆
5.2 Innovation linkages 17.7 88
5.2.1 University-industry RD collaboration†
44.0 58
5.2.2 State of cluster development and depth†
45.5 73
5.2.3 GERD financed by abroad, % GDP 0.0 63
5.2.4 Joint venture/strategic alliance deals/bn PPP$ GDP 0.0 72
5.2.5 Patent families/bn PPP$ GDP 0.2 50
5.3 Knowledge absorption 39.5 29 ◆
5.3.1 Intellectual property payments, % total trade 1.6 23 ●
5.3.2 High-tech imports, % total trade 9.1 43
5.3.3 ICT services imports, % total trade 1.3 60
5.3.4 FDI net inflows, % GDP 1.4 97 ○
5.3.5 Research talent, % in businesses 48.0 28 ◆
Knowledge and technology outputs 26.7 48
6.1 Knowledge creation 35.8 26 ◆
6.1.1 Patents by origin/bn PPP$ GDP 5.7 15 ● ◆
6.1.2 PCT patents by origin/bn PPP$ GDP 0.3 45
6.1.3 Utility models by origin/bn PPP$ GDP 2.3 10 ● ◆
6.1.4 Scientific and technical articles/bn PPP$ GDP 10.6 80
6.1.5 Citable documents H-index 37.7 23 ● ◆
6.2 Knowledge impact 28.6 68
6.2.1 Labor productivity growth, % 1.1 44
6.2.2 New businesses/th pop. 15–64 3.3 43
6.2.3 Software spending, % GDP 0.3 43
6.2.4 ISO 9001 quality certificates/bn PPP$ GDP 1.1 105 ○
6.2.5 High-tech manufacturing, % 25.7 48
6.3 Knowledge diffusion 15.6 68
6.3.1 Intellectual property receipts, % total trade 0.2 38 ◆
6.3.2 Production and export complexity 43.0 64
6.3.3 High-tech exports, % total trade 2.6 52
6.3.4 ICT services exports, % total trade 1.3 71
Creative outputs 26.4 56
7.1 Intangible assets 35.6 50
7.1.1 Trademarks by origin/bn PPP$ GDP 59.7 35
7.1.2 Global brand value, top 5,000, % GDP 44.8 38
7.1.3 Industrial designs by origin/bn PPP$ GDP 1.1 67
7.1.4 ICTs and organizational model creation†
58.4 49
7.2 Creative goods and services 9.7 81
7.2.1 Cultural and creative services exports, % total trade 1.0 27
7.2.2 National feature films/mn pop. 15–69 1.2 79
7.2.3 Entertainment and media market/th pop. 15–69 7.0 45
7.2.4 Printing and other media, % manufacturing 0.6 80 ○
7.2.5 Creative goods exports, % total trade 0.4 68
7.3 Online creativity 24.8 47
7.3.1 Generic top-level domains (TLDs)/th pop. 15–69 3.4 61
7.3.2 Country-code TLDs/th pop. 15–69 14.1 35
7.3.3 Wikipedia edits/mn pop. 15–69 58.8 54
7.3.4 Mobile app creation/bn PPP$ GDP 21.6 25
Score/
Value Rank
Institutions 63.1 67
1.1 Political environment 57.4 67
1.1.1 Political and operational stability* 64.3 80
1.1.2 Government effectiveness* 54.0 62
1.2 Regulatory environment 55.7 92
1.2.1 Regulatory quality* 32.2 100 ○
1.2.2 Rule of law* 27.7 109 ○ ◇
1.2.3 Cost of redundancy dismissal 17.3 69
1.3 Business environment 76.1 45
1.3.1 Ease of starting a business* 93.1 38
1.3.2 Ease of resolving insolvency* 59.1 52
Human capital and research 47.9 29 ◆
2.1 Education 57.6 [40]
2.1.1 Expenditure on education, % GDP 4.7 52
2.1.2 Government funding/pupil, secondary, % GDP/cap n/a n/a
2.1.3 School life expectancy, years 15.7 41
2.1.4 PISA scales in reading, maths and science 481.3 31 ◆
2.1.5 Pupil-teacher ratio, secondary n/a n/a
2.2 Tertiary education 50.8 14 ● ◆
2.2.1 Tertiary enrolment, % gross 84.6 15 ● ◆
2.2.2 Graduates in science and engineering, % 31.1 13 ● ◆
2.2.3 Tertiary inbound mobility, % 4.5 51
2.3 Research and development (RD) 35.2 32 ◆
2.3.1 Researchers, FTE/mn pop. 2,746.7 33 ◆
2.3.2 Gross expenditure on RD, % GDP 1.0 38
2.3.3 Global corporate RD investors, top 3, mn US$ 39.0 40 ◆
2.3.4 QS university ranking, top 3* 48.4 21 ● ◆
Infrastructure 42.5 63
3.1 Informationandcommunicationtechnologies(ICTs) 78.5 36 ◆
3.1.1 ICT access* 72.8 54
3.1.2 ICT use* 72.5 39 ◆
3.1.3 Government’s online service* 81.8 39
3.1.4 E-participation* 86.9 27
3.2 General infrastructure 29.0 64
3.2.1 Electricity output, GWh/mn pop. 7,705.0 26 ◆
3.2.2 Logistics performance* 33.0 74
3.2.3 Gross capital formation, % GDP 22.9 59
3.3 Ecological sustainability 19.9 101 ○ ◇
3.3.1 GDP/unit of energy use 4.8 117 ○ ◇
3.3.2 Environmental performance* 50.5 56
3.3.3 ISO 14001 environmental certificates/bn PPP$ GDP 0.2 107 ○
Market sophistication 48.0 61
4.1 Credit 40.1 70
4.1.1 Ease of getting credit* 80.0 23
4.1.2 Domestic credit to private sector, % GDP 52.4 63
4.1.3 Microfinance gross loans, % GDP 0.0 78 ○
4.2 Investment 19.8 116 ○
4.2.1 Ease of protecting minority investors* 60.0 71
4.2.2 Market capitalization, % GDP 40.9 38
4.2.3 Venture capital investors, deals/bn PPP$ GDP 0.0 55
4.2.4 Venture capital recipients, deals/bn PPP$ GDP 0.0 92 ○
4.3 Trade, diversification, and market scale 83.9 17 ● ◆
4.3.1 Applied tariff rate, weighted avg., % 5.3 91
4.3.2 Domestic industry diversification 92.5 44
4.3.3 Domestic market scale, bn PPP$ 4,021.7 6 ● ◆
NOTES: ● indicates a strength; ○ a weakness; ◆ an income group strength; ◇ an income group weakness; * an index; †
a survey question. indicates that
the
economy’s data are older than the base year; see appendices for details, including the year of the data, at http://globalinnovationindex.org. Square
brackets [ ] indicate
that the data minimum coverage (DMC) requirements were not met at the sub-pillar or pillar level.](https://image.slidesharecdn.com/e-220805033615-e8521670/75/E-INDEX-2021-pdf-163-2048.jpg)
![144 Global Innovation Index 2021
Rwanda GII 2021 rank
102
Output rank Input rank Income Region Population (mn) GDP, PPP$ (bn) GDP per capita, PPP$ GII 2020 rank
108 91 Low SSF 13.0 30.3 2,393 91
Score/
Value Rank
Business sophistication 22.0 82 ◆
5.1 Knowledge workers 12.9 117
5.1.1 Knowledge-intensive employment, % 8.9 112
5.1.2 Firms offering formal training, % 35.9 38 ◆
5.1.3 GERD performed by business, % GDP 0.0 75 ◆
5.1.4 GERD financed by business, % 0.6 96 ○
5.1.5 Females employed w/advanced degrees, % 4.0 98 ◆
5.2 Innovation linkages 32.4 31 ● ◆
5.2.1 University-industry RD collaboration†
33.0 101
5.2.2 State of cluster development and depth†
46.3 66 ◆
5.2.3 GERD financed by abroad, % GDP 0.2 18 ● ◆
5.2.4 Joint venture/strategic alliance deals/bn PPP$ GDP 0.1 26 ● ◆
5.2.5 Patent families/bn PPP$ GDP n/a n/a
5.3 Knowledge absorption 20.8 89
5.3.1 Intellectual property payments, % total trade n/a n/a
5.3.2 High-tech imports, % total trade 8.5 55
5.3.3 ICT services imports, % total trade 0.5 101
5.3.4 FDI net inflows, % GDP 3.5 39 ●
5.3.5 Research talent, % in businesses 5.6 70
Knowledge and technology outputs 13.4 96
6.1 Knowledge creation 8.0 88
6.1.1 Patents by origin/bn PPP$ GDP 0.2 93
6.1.2 PCT patents by origin/bn PPP$ GDP 0.0 98 ○ ◇
6.1.3 Utility models by origin/bn PPP$ GDP 0.3 41
6.1.4 Scientific and technical articles/bn PPP$ GDP 14.1 63
6.1.5 Citable documents H-index 4.0 114
6.2 Knowledge impact 28.2 70 ◆
6.2.1 Labor productivity growth, % 5.8 4 ● ◆
6.2.2 New businesses/th pop. 15–64 1.5 67 ◆
6.2.3 Software spending, % GDP 0.0 101
6.2.4 ISO 9001 quality certificates/bn PPP$ GDP 0.5 119
6.2.5 High-tech manufacturing, % n/a n/a
6.3 Knowledge diffusion 4.0 [123]
6.3.1 Intellectual property receipts, % total trade n/a n/a
6.3.2 Production and export complexity n/a n/a
6.3.3 High-tech exports, % total trade 0.5 91 ◆
6.3.4 ICT services exports, % total trade 0.7 91
Creative outputs 11.5 117
7.1 Intangible assets 16.7 111
7.1.1 Trademarks by origin/bn PPP$ GDP 10.8 110
7.1.2 Global brand value, top 5,000, % GDP 0.0 80 ○ ◇
7.1.3 Industrial designs by origin/bn PPP$ GDP 0.1 106
7.1.4 ICTs and organizational model creation†
51.0 78
7.2 Creative goods and services 3.3 [110]
7.2.1 Cultural and creative services exports, % total trade 0.0 101
7.2.2 National feature films/mn pop. 15–69 3.2 59 ◆
7.2.3 Entertainment and media market/th pop. 15–69 n/a n/a
7.2.4 Printing and other media, % manufacturing n/a n/a
7.2.5 Creative goods exports, % total trade 0.1 100
7.3 Online creativity 9.1 100
7.3.1 Generic top-level domains (TLDs)/th pop. 15–69 0.1 121
7.3.2 Country-code TLDs/th pop. 15–69 0.1 114
7.3.3 Wikipedia edits/mn pop. 15–69 29.9 105
7.3.4 Mobile app creation/bn PPP$ GDP n/a n/a
Score/
Value Rank
Institutions 67.0 54 ◆
1.1 Political environment 61.5 55 ◆
1.1.1 Political and operational stability* 75.0 40 ● ◆
1.1.2 Government effectiveness* 54.8 58 ◆
1.2 Regulatory environment 64.4 67
1.2.1 Regulatory quality* 45.5 66 ◆
1.2.2 Rule of law* 48.7 59 ◆
1.2.3 Cost of redundancy dismissal 17.3 68
1.3 Business environment 75.2 48 ● ◆
1.3.1 Ease of starting a business* 93.2 33 ● ◆
1.3.2 Ease of resolving insolvency* 57.2 57 ◆
Human capital and research 15.5 114
2.1 Education 35.6 104
2.1.1 Expenditure on education, % GDP 3.1 96
2.1.2 Government funding/pupil, secondary, % GDP/cap 21.4 38 ●
2.1.3 School life expectancy, years 11.2 99
2.1.4 PISA scales in reading, maths and science n/a n/a
2.1.5 Pupil-teacher ratio, secondary 20.1 95
2.2 Tertiary education 7.6 117
2.2.1 Tertiary enrolment, % gross 6.2 121 ○
2.2.2 Graduates in science and engineering, % 13.0 100
2.2.3 Tertiary inbound mobility, % 3.6 59
2.3 Research and development (RD) 3.2 85 ◆
2.3.1 Researchers, FTE/mn pop. 13.9 107 ○ ◇
2.3.2 Gross expenditure on RD, % GDP 0.6 53 ◆
2.3.3 Global corporate RD investors, top 3, mn US$ 0.0 41 ○ ◇
2.3.4 QS university ranking, top 3* 0.0 74 ○ ◇
Infrastructure 30.4 101
3.1 Informationandcommunicationtechnologies(ICTs) 43.6 101 ◆
3.1.1 ICT access* 28.3 123 ○
3.1.2 ICT use* 21.4 113 ◆
3.1.3 Government’s online service* 61.8 85 ◆
3.1.4 E-participation* 63.1 82 ◆
3.2 General infrastructure 30.5 60
3.2.1 Electricity output, GWh/mn pop. n/a n/a
3.2.2 Logistics performance* 43.1 56 ◆
3.2.3 Gross capital formation, % GDP 20.8 83
3.3 Ecological sustainability 17.0 115
3.3.1 GDP/unit of energy use n/a n/a
3.3.2 Environmental performance* 33.8 107
3.3.3 ISO 14001 environmental certificates/bn PPP$ GDP 0.1 131 ○
Market sophistication 41.7 93
4.1 Credit 60.7 14 ● ◆
4.1.1 Ease of getting credit* 95.0 4 ● ◆
4.1.2 Domestic credit to private sector, % GDP 21.4 112
4.1.3 Microfinance gross loans, % GDP 6.7 1 ● ◆
4.2 Investment 24.5 87
4.2.1 Ease of protecting minority investors* 44.0 98
4.2.2 Market capitalization, % GDP 31.0 45
4.2.3 Venture capital investors, deals/bn PPP$ GDP n/a n/a
4.2.4 Venture capital recipients, deals/bn PPP$ GDP 0.1 28 ●
4.3 Trade, diversification, and market scale 39.9 125 ○
4.3.1 Applied tariff rate, weighted avg., % 9.6 114
4.3.2 Domestic industry diversification 43.6 109 ○ ◇
4.3.3 Domestic market scale, bn PPP$ 30.3 122
NOTES: ● indicates a strength; ○ a weakness; ◆ an income group strength; ◇ an income group weakness; * an index; †
a survey question. indicates that
the
economy’s data are older than the base year; see appendices for details, including the year of the data, at http://globalinnovationindex.org. Square
brackets [ ] indicate
that the data minimum coverage (DMC) requirements were not met at the sub-pillar or pillar level.](https://image.slidesharecdn.com/e-220805033615-e8521670/75/E-INDEX-2021-pdf-164-2048.jpg)
![145
GII 2021 Economy profiles
Saudi Arabia GII 2021 rank
66
Output rank Input rank Income Region Population (mn) GDP, PPP$ (bn) GDP per capita, PPP$ GII 2020 rank
72 59 High NAWA 34.8 1,608.6 46,273 66
Score/
Value Rank
Business sophistication 21.1 89 ◇
5.1 Knowledge workers 16.6 [108]
5.1.1 Knowledge-intensive employment, % n/a n/a
5.1.2 Firms offering formal training, % n/a n/a
5.1.3 GERD performed by business, % GDP n/a n/a
5.1.4 GERD financed by business, % n/a n/a
5.1.5 Females employed w/advanced degrees, % 5.5 93 ◇
5.2 Innovation linkages 30.5 34
5.2.1 University-industry RD collaboration†
52.9 35
5.2.2 State of cluster development and depth†
68.5 8 ● ◆
5.2.3 GERD financed by abroad, % GDP n/a n/a
5.2.4 Joint venture/strategic alliance deals/bn PPP$ GDP 0.0 70
5.2.5 Patent families/bn PPP$ GDP 0.3 36
5.3 Knowledge absorption 16.3 110 ◇
5.3.1 Intellectual property payments, % total trade 0.0 122 ○ ◇
5.3.2 High-tech imports, % total trade 7.1 77
5.3.3 ICT services imports, % total trade 0.7 89 ◇
5.3.4 FDI net inflows, % GDP 0.4 119 ○
5.3.5 Research talent, % in businesses n/a n/a
Knowledge and technology outputs 19.6 69 ◇
6.1 Knowledge creation 17.1 60
6.1.1 Patents by origin/bn PPP$ GDP 1.0 64
6.1.2 PCT patents by origin/bn PPP$ GDP 0.6 32
6.1.3 Utility models by origin/bn PPP$ GDP n/a n/a
6.1.4 Scientific and technical articles/bn PPP$ GDP 15.9 53
6.1.5 Citable documents H-index 22.7 38
6.2 Knowledge impact 27.5 72
6.2.1 Labor productivity growth, % −2.0 101 ○
6.2.2 New businesses/th pop. 15–64 0.5 99 ◇
6.2.3 Software spending, % GDP 0.3 37
6.2.4 ISO 9001 quality certificates/bn PPP$ GDP 1.3 102 ◇
6.2.5 High-tech manufacturing, % 35.6 33
6.3 Knowledge diffusion 14.3 72 ◇
6.3.1 Intellectual property receipts, % total trade n/a n/a
6.3.2 Production and export complexity 59.4 36
6.3.3 High-tech exports, % total trade 0.1 118 ○ ◇
6.3.4 ICT services exports, % total trade 0.7 92
Creative outputs 20.9 78 ◇
7.1 Intangible assets 30.9 63
7.1.1 Trademarks by origin/bn PPP$ GDP 14.0 104 ◇
7.1.2 Global brand value, top 5,000, % GDP 110.9 19 ●
7.1.3 Industrial designs by origin/bn PPP$ GDP 0.2 101 ○
7.1.4 ICTs and organizational model creation†
61.5 40
7.2 Creative goods and services 8.3 86 ◇
7.2.1 Cultural and creative services exports, % total trade 0.0 100 ○ ◇
7.2.2 National feature films/mn pop. 15–69 n/a n/a
7.2.3 Entertainment and media market/th pop. 15–69 15.9 29 ◇
7.2.4 Printing and other media, % manufacturing 1.2 40
7.2.5 Creative goods exports, % total trade 0.2 81
7.3 Online creativity 13.3 79 ◇
7.3.1 Generic top-level domains (TLDs)/th pop. 15–69 2.7 69 ◇
7.3.2 Country-code TLDs/th pop. 15–69 0.8 92 ◇
7.3.3 Wikipedia edits/mn pop. 15–69 49.4 66 ◇
7.3.4 Mobile app creation/bn PPP$ GDP 0.5 80
Score/
Value Rank
Institutions 53.3 101 ◇
1.1 Political environment 55.6 73 ◇
1.1.1 Political and operational stability* 51.8 119 ○ ◇
1.1.2 Government effectiveness* 57.5 54 ◇
1.2 Regulatory environment 57.6 87 ◇
1.2.1 Regulatory quality* 41.7 75 ◇
1.2.2 Rule of law* 51.2 55 ◇
1.2.3 Cost of redundancy dismissal 23.7 102 ◇
1.3 Business environment 46.6 129 ○ ◇
1.3.1 Ease of starting a business* 93.1 36
1.3.2 Ease of resolving insolvency* 0.0 129 ○ ◇
Human capital and research 45.7 32
2.1 Education 59.6 [30]
2.1.1 Expenditure on education, % GDP n/a n/a
2.1.2 Government funding/pupil, secondary, % GDP/cap n/a n/a
2.1.3 School life expectancy, years 16.0 36
2.1.4 PISA scales in reading, maths and science 386.2 71 ○ ◇
2.1.5 Pupil-teacher ratio, secondary 13.6 61
2.2 Tertiary education 36.6 51
2.2.1 Tertiary enrolment, % gross 70.9 29 ●
2.2.2 Graduates in science and engineering, % 22.0 61
2.2.3 Tertiary inbound mobility, % 4.4 54
2.3 Research and development (RD) 40.9 26 ●
2.3.1 Researchers, FTE/mn pop. n/a n/a
2.3.2 Gross expenditure on RD, % GDP 0.8 47
2.3.3 Global corporate RD investors, top 3, mn US$ 62.7 22 ●
2.3.4 QS university ranking, top 3* 43.7 24 ●
Infrastructure 45.1 54 ◇
3.1 Informationandcommunicationtechnologies(ICTs) 74.5 48
3.1.1 ICT access* 81.5 28 ●
3.1.2 ICT use* 76.3 34
3.1.3 Government’s online service* 68.8 71 ◇
3.1.4 E-participation* 71.4 66
3.2 General infrastructure 39.1 32
3.2.1 Electricity output, GWh/mn pop. 11,221.2 12 ●
3.2.2 Logistics performance* 44.8 54 ◇
3.2.3 Gross capital formation, % GDP 27.6 31
3.3 Ecological sustainability 21.7 90 ◇
3.3.1 GDP/unit of energy use 8.3 88
3.3.2 Environmental performance* 44.0 79 ◇
3.3.3 ISO 14001 environmental certificates/bn PPP$ GDP 0.3 96 ◇
Market sophistication 51.9 39
4.1 Credit 40.5 67
4.1.1 Ease of getting credit* 60.0 74
4.1.2 Domestic credit to private sector, % GDP 54.0 62
4.1.3 Microfinance gross loans, % GDP n/a n/a
4.2 Investment 35.7 46
4.2.1 Ease of protecting minority investors* 86.0 3 ● ◆
4.2.2 Market capitalization, % GDP 144.1 6 ● ◆
4.2.3 Venture capital investors, deals/bn PPP$ GDP 0.0 49
4.2.4 Venture capital recipients, deals/bn PPP$ GDP 0.0 80 ○
4.3 Trade, diversification, and market scale 79.6 29 ●
4.3.1 Applied tariff rate, weighted avg., % 4.8 83 ◇
4.3.2 Domestic industry diversification 89.5 53
4.3.3 Domestic market scale, bn PPP$ 1,608.6 17 ●
NOTES: ● indicates a strength; ○ a weakness; ◆ an income group strength; ◇ an income group weakness; * an index; †
a survey question. indicates that
the
economy’s data are older than the base year; see appendices for details, including the year of the data, at http://globalinnovationindex.org. Square
brackets [ ] indicate
that the data minimum coverage (DMC) requirements were not met at the sub-pillar or pillar level.](https://image.slidesharecdn.com/e-220805033615-e8521670/75/E-INDEX-2021-pdf-165-2048.jpg)
![146 Global Innovation Index 2021
Senegal GII 2021 rank
105
Output rank Input rank Income Region Population (mn) GDP, PPP$ (bn) GDP per capita, PPP$ GII 2020 rank
102 105 Lower middle SSF 16.7 58.1 3,463 102
Score/
Value Rank
Business sophistication 12.5 131 ○ ◇
5.1 Knowledge workers 6.9 127 ○ ◇
5.1.1 Knowledge-intensive employment, % 6.4 116 ○ ◇
5.1.2 Firms offering formal training, % 17.4 86 ◇
5.1.3 GERD performed by business, % GDP n/a n/a
5.1.4 GERD financed by business, % 2.1 88
5.1.5 Females employed w/advanced degrees, % 0.6 120 ○
5.2 Innovation linkages 15.3 106
5.2.1 University-industry RD collaboration†
40.0 74
5.2.2 State of cluster development and depth†
41.2 97
5.2.3 GERD financed by abroad, % GDP 0.0 54
5.2.4 Joint venture/strategic alliance deals/bn PPP$ GDP 0.0 122 ○
5.2.5 Patent families/bn PPP$ GDP 0.0 100 ○ ◇
5.3 Knowledge absorption 15.3 116
5.3.1 Intellectual property payments, % total trade 0.1 99
5.3.2 High-tech imports, % total trade 4.9 113
5.3.3 ICT services imports, % total trade 2.0 33 ● ◆
5.3.4 FDI net inflows, % GDP 3.5 38 ●
5.3.5 Research talent, % in businesses 0.1 87 ○ ◇
Knowledge and technology outputs 14.6 88
6.1 Knowledge creation 5.3 110
6.1.1 Patents by origin/bn PPP$ GDP 0.2 95
6.1.2 PCT patents by origin/bn PPP$ GDP 0.0 79
6.1.3 Utility models by origin/bn PPP$ GDP 0.0 64
6.1.4 Scientific and technical articles/bn PPP$ GDP 9.5 88
6.1.5 Citable documents H-index 6.8 91
6.2 Knowledge impact 25.2 84
6.2.1 Labor productivity growth, % 2.4 21 ●
6.2.2 New businesses/th pop. 15–64 0.5 100
6.2.3 Software spending, % GDP 0.2 71
6.2.4 ISO 9001 quality certificates/bn PPP$ GDP 1.4 100
6.2.5 High-tech manufacturing, % 16.6 68
6.3 Knowledge diffusion 13.4 76
6.3.1 Intellectual property receipts, % total trade 0.1 65
6.3.2 Production and export complexity 29.4 94
6.3.3 High-tech exports, % total trade 0.1 116
6.3.4 ICT services exports, % total trade 2.8 38 ●
Creative outputs 14.4 109
7.1 Intangible assets 20.2 100
7.1.1 Trademarks by origin/bn PPP$ GDP 9.6 112
7.1.2 Global brand value, top 5,000, % GDP 16.4 52
7.1.3 Industrial designs by origin/bn PPP$ GDP 0.3 97
7.1.4 ICTs and organizational model creation†
58.1 52 ◆
7.2 Creative goods and services 8.9 84
7.2.1 Cultural and creative services exports, % total trade 1.0 28 ● ◆
7.2.2 National feature films/mn pop. 15–69 0.2 105 ○
7.2.3 Entertainment and media market/th pop. 15–69 n/a n/a
7.2.4 Printing and other media, % manufacturing 0.8 67
7.2.5 Creative goods exports, % total trade 0.1 109
7.3 Online creativity 8.4 106
7.3.1 Generic top-level domains (TLDs)/th pop. 15–69 1.0 95
7.3.2 Country-code TLDs/th pop. 15–69 0.2 112
7.3.3 Wikipedia edits/mn pop. 15–69 27.2 109
7.3.4 Mobile app creation/bn PPP$ GDP n/a n/a
Score/
Value Rank
Institutions 63.0 68 ◆
1.1 Political environment 57.3 68 ◆
1.1.1 Political and operational stability* 73.2 44 ◆
1.1.2 Government effectiveness* 49.4 75 ◆
1.2 Regulatory environment 63.8 69 ◆
1.2.1 Regulatory quality* 40.6 79 ◆
1.2.2 Rule of law* 41.7 73
1.2.3 Cost of redundancy dismissal 14.8 58
1.3 Business environment 67.7 76
1.3.1 Ease of starting a business* 91.2 51 ●
1.3.2 Ease of resolving insolvency* 44.3 87
Human capital and research 18.2 104
2.1 Education 37.3 99
2.1.1 Expenditure on education, % GDP 4.8 45
2.1.2 Government funding/pupil, secondary, % GDP/cap 20.5 47
2.1.3 School life expectancy, years 8.8 114 ○ ◇
2.1.4 PISA scales in reading, maths and science n/a n/a
2.1.5 Pupil-teacher ratio, secondary 20.4 96
2.2 Tertiary education 12.9 109
2.2.1 Tertiary enrolment, % gross 13.1 107
2.2.2 Graduates in science and engineering, % n/a n/a
2.2.3 Tertiary inbound mobility, % 7.6 34 ● ◆
2.3 Research and development (RD) 4.5 79
2.3.1 Researchers, FTE/mn pop. 564.3 65
2.3.2 Gross expenditure on RD, % GDP 0.6 60 ◆
2.3.3 Global corporate RD investors, top 3, mn US$ 0.0 41 ○ ◇
2.3.4 QS university ranking, top 3* 0.0 74 ○ ◇
Infrastructure 28.8 108
3.1 Informationandcommunicationtechnologies(ICTs) 39.5 111
3.1.1 ICT access* 36.0 114
3.1.2 ICT use* 28.5 105
3.1.3 Government’s online service* 49.4 108
3.1.4 E-participation* 44.0 110
3.2 General infrastructure 25.1 80
3.2.1 Electricity output, GWh/mn pop. 306.6 115
3.2.2 Logistics performance* 9.6 121 ○ ◇
3.2.3 Gross capital formation, % GDP 33.1 16 ●
3.3 Ecological sustainability 21.8 88
3.3.1 GDP/unit of energy use 12.4 44 ●
3.3.2 Environmental performance* 30.7 119
3.3.3 ISO 14001 environmental certificates/bn PPP$ GDP 0.2 106
Market sophistication 37.7 107
4.1 Credit 35.7 84
4.1.1 Ease of getting credit* 65.0 61
4.1.2 Domestic credit to private sector, % GDP 29.3 97
4.1.3 Microfinance gross loans, % GDP 1.6 18 ●
4.2 Investment 17.8 121
4.2.1 Ease of protecting minority investors* 44.0 98
4.2.2 Market capitalization, % GDP n/a n/a
4.2.3 Venture capital investors, deals/bn PPP$ GDP 0.0 64
4.2.4 Venture capital recipients, deals/bn PPP$ GDP 0.0 62
4.3 Trade, diversification, and market scale 59.6 97
4.3.1 Applied tariff rate, weighted avg., % 9.1 111
4.3.2 Domestic industry diversification 84.8 67
4.3.3 Domestic market scale, bn PPP$ 58.1 98
NOTES: ● indicates a strength; ○ a weakness; ◆ an income group strength; ◇ an income group weakness; * an index; †
a survey question. indicates that
the
economy’s data are older than the base year; see appendices for details, including the year of the data, at http://globalinnovationindex.org. Square
brackets [ ] indicate
that the data minimum coverage (DMC) requirements were not met at the sub-pillar or pillar level.](https://image.slidesharecdn.com/e-220805033615-e8521670/75/E-INDEX-2021-pdf-166-2048.jpg)
![147
GII 2021 Economy profiles
Serbia GII 2021 rank
54
Output rank Input rank Income Region Population (mn) GDP, PPP$ (bn) GDP per capita, PPP$ GII 2020 rank
57 50 Upper middle EUR 8.7 130.7 18,840 53
Score/
Value Rank
Business sophistication 25.5 63
5.1 Knowledge workers 28.7 77
5.1.1 Knowledge-intensive employment, % 28.0 53
5.1.2 Firms offering formal training, % 38.3 32
5.1.3 GERD performed by business, % GDP 0.4 46
5.1.4 GERD financed by business, % 9.1 78 ○
5.1.5 Females employed w/advanced degrees, % 15.0 50
5.2 Innovation linkages 19.8 72
5.2.1 University-industry RD collaboration†
38.5 85
5.2.2 State of cluster development and depth†
38.6 107 ○
5.2.3 GERD financed by abroad, % GDP 0.2 24 ◆
5.2.4 Joint venture/strategic alliance deals/bn PPP$ GDP 0.0 80
5.2.5 Patent families/bn PPP$ GDP 0.1 58
5.3 Knowledge absorption 27.9 61
5.3.1 Intellectual property payments, % total trade 1.0 38
5.3.2 High-tech imports, % total trade 7.2 75
5.3.3 ICT services imports, % total trade 2.4 21 ◆
5.3.4 FDI net inflows, % GDP 7.6 13 ● ◆
5.3.5 Research talent, % in businesses 9.6 64 ○
Knowledge and technology outputs 29.1 43
6.1 Knowledge creation 23.4 42
6.1.1 Patents by origin/bn PPP$ GDP 1.3 54
6.1.2 PCT patents by origin/bn PPP$ GDP 0.2 51
6.1.3 Utility models by origin/bn PPP$ GDP 0.6 35
6.1.4 Scientific and technical articles/bn PPP$ GDP 41.0 17 ● ◆
6.1.5 Citable documents H-index 14.9 54
6.2 Knowledge impact 34.8 45
6.2.1 Labor productivity growth, % 0.7 53
6.2.2 New businesses/th pop. 15–64 1.9 58
6.2.3 Software spending, % GDP 0.0 104 ○ ◇
6.2.4 ISO 9001 quality certificates/bn PPP$ GDP 21.4 10 ● ◆
6.2.5 High-tech manufacturing, % 25.4 49
6.3 Knowledge diffusion 29.1 39
6.3.1 Intellectual property receipts, % total trade 0.2 41
6.3.2 Production and export complexity 59.3 38
6.3.3 High-tech exports, % total trade 1.8 64
6.3.4 ICT services exports, % total trade 5.5 12 ● ◆
Creative outputs 21.4 76
7.1 Intangible assets 20.8 98 ○
7.1.1 Trademarks by origin/bn PPP$ GDP 24.2 84
7.1.2 Global brand value, top 5,000, % GDP 0.0 80 ○ ◇
7.1.3 Industrial designs by origin/bn PPP$ GDP 1.0 70
7.1.4 ICTs and organizational model creation†
51.7 75
7.2 Creative goods and services 20.2 51
7.2.1 Cultural and creative services exports, % total trade 1.8 10 ● ◆
7.2.2 National feature films/mn pop. 15–69 5.6 39
7.2.3 Entertainment and media market/th pop. 15–69 n/a n/a
7.2.4 Printing and other media, % manufacturing 1.0 55
7.2.5 Creative goods exports, % total trade 0.6 59
7.3 Online creativity 23.8 51
7.3.1 Generic top-level domains (TLDs)/th pop. 15–69 1.3 91
7.3.2 Country-code TLDs/th pop. 15–69 5.5 53
7.3.3 Wikipedia edits/mn pop. 15–69 69.8 36 ◆
7.3.4 Mobile app creation/bn PPP$ GDP 15.8 31
Score/
Value Rank
Institutions 69.3 50
1.1 Political environment 57.3 70
1.1.1 Political and operational stability* 69.6 60
1.1.2 Government effectiveness* 51.1 72
1.2 Regulatory environment 72.5 41
1.2.1 Regulatory quality* 46.5 64
1.2.2 Rule of law* 43.6 68
1.2.3 Cost of redundancy dismissal 8.0 1 ● ◆
1.3 Business environment 78.1 38
1.3.1 Ease of starting a business* 89.3 60
1.3.2 Ease of resolving insolvency* 67.0 38
Human capital and research 32.3 62
2.1 Education 43.2 83
2.1.1 Expenditure on education, % GDP 3.6 81
2.1.2 Government funding/pupil, secondary, % GDP/cap 11.1 88 ○
2.1.3 School life expectancy, years 14.7 60
2.1.4 PISA scales in reading, maths and science 442.5 44
2.1.5 Pupil-teacher ratio, secondary 7.9 9 ● ◆
2.2 Tertiary education 43.1 32
2.2.1 Tertiary enrolment, % gross 67.8 36
2.2.2 Graduates in science and engineering, % 28.4 20
2.2.3 Tertiary inbound mobility, % 4.6 50
2.3 Research and development (RD) 10.6 56
2.3.1 Researchers, FTE/mn pop. 2,087.2 40 ◆
2.3.2 Gross expenditure on RD, % GDP 0.9 41
2.3.3 Global corporate RD investors, top 3, mn US$ 0.0 41 ○ ◇
2.3.4 QS university ranking, top 3* 0.0 74 ○ ◇
Infrastructure 48.7 44 ◆
3.1 Informationandcommunicationtechnologies(ICTs) 74.1 50
3.1.1 ICT access* 75.2 49 ◆
3.1.2 ICT use* 59.8 62
3.1.3 Government’s online service* 79.4 42
3.1.4 E-participation* 82.1 41
3.2 General infrastructure 27.1 70
3.2.1 Electricity output, GWh/mn pop. 5,252.4 41
3.2.2 Logistics performance* 36.9 64
3.2.3 Gross capital formation, % GDP 22.1 65
3.3 Ecological sustainability 45.0 25 ◆
3.3.1 GDP/unit of energy use 7.6 96 ○
3.3.2 Environmental performance* 55.2 43 ◆
3.3.3 ISO 14001 environmental certificates/bn PPP$ GDP 10.1 3 ● ◆
Market sophistication 48.4 58
4.1 Credit 33.2 96
4.1.1 Ease of getting credit* 65.0 61
4.1.2 Domestic credit to private sector, % GDP 42.0 80
4.1.3 Microfinance gross loans, % GDP 0.2 44
4.2 Investment 35.6 [47]
4.2.1 Ease of protecting minority investors* 70.0 36
4.2.2 Market capitalization, % GDP 3.7 74 ○
4.2.3 Venture capital investors, deals/bn PPP$ GDP n/a n/a
4.2.4 Venture capital recipients, deals/bn PPP$ GDP n/a n/a
4.3 Trade, diversification, and market scale 76.4 41
4.3.1 Applied tariff rate, weighted avg., % 1.4 17 ●
4.3.2 Domestic industry diversification 96.9 17 ●
4.3.3 Domestic market scale, bn PPP$ 130.7 75
NOTES: ● indicates a strength; ○ a weakness; ◆ an income group strength; ◇ an income group weakness; * an index; †
a survey question. indicates that
the
economy’s data are older than the base year; see appendices for details, including the year of the data, at http://globalinnovationindex.org. Square
brackets [ ] indicate
that the data minimum coverage (DMC) requirements were not met at the sub-pillar or pillar level.](https://image.slidesharecdn.com/e-220805033615-e8521670/75/E-INDEX-2021-pdf-167-2048.jpg)
![148 Global Innovation Index 2021
Singapore GII 2021 rank
8
Output rank Input rank Income Region Population (mn) GDP, PPP$ (bn) GDP per capita, PPP$ GII 2020 rank
13 1 High SEAO 5.9 551.6 95,603 8
Score/
Value Rank
Business sophistication 62.7 3 ● ◆
5.1 Knowledge workers 65.3 10
5.1.1 Knowledge-intensive employment, % 58.3 2 ● ◆
5.1.2 Firms offering formal training, % n/a n/a
5.1.3 GERD performed by business, % GDP 1.1 20
5.1.4 GERD financed by business, % 53.1 24
5.1.5 Females employed w/advanced degrees, % 27.1 6 ◆
5.2 Innovation linkages 52.0 13
5.2.1 University-industry RD collaboration†
69.8 8
5.2.2 State of cluster development and depth†
69.4 6
5.2.3 GERD financed by abroad, % GDP 0.1 33
5.2.4 Joint venture/strategic alliance deals/bn PPP$ GDP 0.2 5 ◆
5.2.5 Patent families/bn PPP$ GDP 2.4 15
5.3 Knowledge absorption 70.7 1 ● ◆
5.3.1 Intellectual property payments, % total trade 2.8 8
5.3.2 High-tech imports, % total trade 22.2 7 ◆
5.3.3 ICT services imports, % total trade 2.4 20
5.3.4 FDI net inflows, % GDP 27.1 3 ● ◆
5.3.5 Research talent, % in businesses 51.5 21
Knowledge and technology outputs 48.1 13
6.1 Knowledge creation 35.5 28 ◇
6.1.1 Patents by origin/bn PPP$ GDP 3.0 26
6.1.2 PCT patents by origin/bn PPP$ GDP 2.3 16
6.1.3 Utility models by origin/bn PPP$ GDP n/a n/a
6.1.4 Scientific and technical articles/bn PPP$ GDP 27.6 33
6.1.5 Citable documents H-index 38.4 22
6.2 Knowledge impact 46.7 11
6.2.1 Labor productivity growth, % −0.3 73 ○
6.2.2 New businesses/th pop. 15–64 10.0 15
6.2.3 Software spending, % GDP 0.3 52 ○
6.2.4 ISO 9001 quality certificates/bn PPP$ GDP 5.5 55 ○
6.2.5 High-tech manufacturing, % 76.2 1 ● ◆
6.3 Knowledge diffusion 62.1 4 ● ◆
6.3.1 Intellectual property receipts, % total trade 1.4 15
6.3.2 Production and export complexity 86.7 5
6.3.3 High-tech exports, % total trade 25.3 1 ● ◆
6.3.4 ICT services exports, % total trade 2.5 46
Creative outputs 42.9 17
7.1 Intangible assets 40.2 40
7.1.1 Trademarks by origin/bn PPP$ GDP 19.2 92 ○ ◇
7.1.2 Global brand value, top 5,000, % GDP 153.8 9
7.1.3 Industrial designs by origin/bn PPP$ GDP 0.7 79 ○
7.1.4 ICTs and organizational model creation†
74.6 14
7.2 Creative goods and services 39.0 13
7.2.1 Cultural and creative services exports, % total trade 3.5 1 ● ◆
7.2.2 National feature films/mn pop. 15–69 2.8 61 ○
7.2.3 Entertainment and media market/th pop. 15–69 38.8 20
7.2.4 Printing and other media, % manufacturing 0.5 91 ○
7.2.5 Creative goods exports, % total trade 3.5 17
7.3 Online creativity 52.1 19
7.3.1 Generic top-level domains (TLDs)/th pop. 15–69 24.5 23
7.3.2 Country-code TLDs/th pop. 15–69 11.8 38 ◇
7.3.3 Wikipedia edits/mn pop. 15–69 69.6 38 ◇
7.3.4 Mobile app creation/bn PPP$ GDP 100.0 1 ● ◆
Score/
Value Rank
Institutions 95.1 1 ● ◆
1.1 Political environment 100.0 1 ● ◆
1.1.1 Political and operational stability* 100.0 1 ● ◆
1.1.2 Government effectiveness* 100.0 1 ● ◆
1.2 Regulatory environment 99.1 1 ● ◆
1.2.1 Regulatory quality* 100.0 1 ● ◆
1.2.2 Rule of law* 96.2 8
1.2.3 Cost of redundancy dismissal 8.0 1 ● ◆
1.3 Business environment 86.3 17
1.3.1 Ease of starting a business* 98.2 4 ● ◆
1.3.2 Ease of resolving insolvency* 74.3 25
Human capital and research 58.7 9
2.1 Education 54.0 54 ○
2.1.1 Expenditure on education, % GDP 2.9 102 ○ ◇
2.1.2 Government funding/pupil, secondary, % GDP/cap 21.4 39
2.1.3 School life expectancy, years 16.5 25
2.1.4 PISA scales in reading, maths and science 556.5 2 ● ◆
2.1.5 Pupil-teacher ratio, secondary 11.3 42
2.2 Tertiary education 63.1 2 ● ◆
2.2.1 Tertiary enrolment, % gross 88.9 10
2.2.2 Graduates in science and engineering, % 33.5 10 ◆
2.2.3 Tertiary inbound mobility, % 19.2 7
2.3 Research and development (RD) 59.1 15
2.3.1 Researchers, FTE/mn pop. 6,821.1 5
2.3.2 Gross expenditure on RD, % GDP 1.8 19
2.3.3 Global corporate RD investors, top 3, mn US$ 50.0 30
2.3.4 QS university ranking, top 3* 68.1 12
Infrastructure 57.8 15
3.1 Informationandcommunicationtechnologies(ICTs) 90.5 7
3.1.1 ICT access* 90.5 7
3.1.2 ICT use* 77.4 28 ◇
3.1.3 Government’s online service* 96.5 5
3.1.4 E-participation* 97.6 6
3.2 General infrastructure 46.7 15
3.2.1 Electricity output, GWh/mn pop. 9,556.1 15
3.2.2 Logistics performance* 90.5 7
3.2.3 Gross capital formation, % GDP 24.8 49 ○
3.3 Ecological sustainability 36.3 42
3.3.1 GDP/unit of energy use 14.4 27
3.3.2 Environmental performance* 58.1 38 ◇
3.3.3 ISO 14001 environmental certificates/bn PPP$ GDP 1.8 49
Market sophistication 75.9 5 ◆
4.1 Credit 62.5 13
4.1.1 Ease of getting credit* 75.0 34
4.1.2 Domestic credit to private sector, % GDP 120.8 18
4.1.3 Microfinance gross loans, % GDP n/a n/a
4.2 Investment 88.4 1 ● ◆
4.2.1 Ease of protecting minority investors* 86.0 3 ● ◆
4.2.2 Market capitalization, % GDP 200.6 4 ◆
4.2.3 Venture capital investors, deals/bn PPP$ GDP 0.7 1 ● ◆
4.2.4 Venture capital recipients, deals/bn PPP$ GDP 0.3 1 ● ◆
4.3 Trade, diversification, and market scale 76.6 39
4.3.1 Applied tariff rate, weighted avg., % 0.4 3 ●
4.3.2 Domestic industry diversification 80.1 79 ○ ◇
4.3.3 Domestic market scale, bn PPP$ 551.6 37
NOTES: ● indicates a strength; ○ a weakness; ◆ an income group strength; ◇ an income group weakness; * an index; †
a survey question. indicates that
the
economy’s data are older than the base year; see appendices for details, including the year of the data, at http://globalinnovationindex.org. Square
brackets [ ] indicate
that the data minimum coverage (DMC) requirements were not met at the sub-pillar or pillar level.](https://image.slidesharecdn.com/e-220805033615-e8521670/75/E-INDEX-2021-pdf-168-2048.jpg)
![149
GII 2021 Economy profiles
Slovakia GII 2021 rank
37
Output rank Input rank Income Region Population (mn) GDP, PPP$ (bn) GDP per capita, PPP$ GII 2020 rank
35 42 High EUR 5.5 175.7 32,184 39
Score/
Value Rank
Business sophistication 32.5 43
5.1 Knowledge workers 43.6 38
5.1.1 Knowledge-intensive employment, % 34.2 41
5.1.2 Firms offering formal training, % 43.3 25
5.1.3 GERD performed by business, % GDP 0.5 40
5.1.4 GERD financed by business, % 46.8 32
5.1.5 Females employed w/advanced degrees, % 15.3 47
5.2 Innovation linkages 23.2 54
5.2.1 University-industry RD collaboration†
37.7 90 ○ ◇
5.2.2 State of cluster development and depth†
46.2 68
5.2.3 GERD financed by abroad, % GDP 0.1 41
5.2.4 Joint venture/strategic alliance deals/bn PPP$ GDP n/a n/a
5.2.5 Patent families/bn PPP$ GDP 0.2 42
5.3 Knowledge absorption 30.7 55
5.3.1 Intellectual property payments, % total trade 0.8 59
5.3.2 High-tech imports, % total trade 12.1 19 ●
5.3.3 ICT services imports, % total trade 1.1 69
5.3.4 FDI net inflows, % GDP 2.9 53
5.3.5 Research talent, % in businesses 24.8 50
Knowledge and technology outputs 34.3 30
6.1 Knowledge creation 24.2 39
6.1.1 Patents by origin/bn PPP$ GDP 1.3 55
6.1.2 PCT patents by origin/bn PPP$ GDP 0.3 41
6.1.3 Utility models by origin/bn PPP$ GDP 1.5 15 ● ◆
6.1.4 Scientific and technical articles/bn PPP$ GDP 25.8 37
6.1.5 Citable documents H-index 17.4 47
6.2 Knowledge impact 49.7 8 ● ◆
6.2.1 Labor productivity growth, % −0.1 68
6.2.2 New businesses/th pop. 15–64 5.3 30
6.2.3 Software spending, % GDP 0.3 41
6.2.4 ISO 9001 quality certificates/bn PPP$ GDP 21.0 11 ● ◆
6.2.5 High-tech manufacturing, % 60.1 4 ● ◆
6.3 Knowledge diffusion 29.0 40
6.3.1 Intellectual property receipts, % total trade 0.0 75
6.3.2 Production and export complexity 76.5 15 ●
6.3.3 High-tech exports, % total trade 8.1 22 ●
6.3.4 ICT services exports, % total trade 1.7 63
Creative outputs 33.0 43
7.1 Intangible assets 32.7 57
7.1.1 Trademarks by origin/bn PPP$ GDP 54.2 39
7.1.2 Global brand value, top 5,000, % GDP 1.7 77 ○ ◇
7.1.3 Industrial designs by origin/bn PPP$ GDP 1.9 49
7.1.4 ICTs and organizational model creation†
65.0 28
7.2 Creative goods and services 38.9 14 ●
7.2.1 Cultural and creative services exports, % total trade 0.3 60
7.2.2 National feature films/mn pop. 15–69 6.6 35
7.2.3 Entertainment and media market/th pop. 15–69 n/a n/a
7.2.4 Printing and other media, % manufacturing 0.6 81 ○
7.2.5 Creative goods exports, % total trade 6.8 9 ● ◆
7.3 Online creativity 27.7 39
7.3.1 Generic top-level domains (TLDs)/th pop. 15–69 3.0 64 ◇
7.3.2 Country-code TLDs/th pop. 15–69 31.4 22 ●
7.3.3 Wikipedia edits/mn pop. 15–69 63.2 47
7.3.4 Mobile app creation/bn PPP$ GDP 11.5 45
Score/
Value Rank
Institutions 72.8 39
1.1 Political environment 71.1 39
1.1.1 Political and operational stability* 82.1 24
1.1.2 Government effectiveness* 65.6 41
1.2 Regulatory environment 72.1 44
1.2.1 Regulatory quality* 69.8 34
1.2.2 Rule of law* 61.4 40
1.2.3 Cost of redundancy dismissal 18.8 78
1.3 Business environment 75.1 51
1.3.1 Ease of starting a business* 84.8 91 ○ ◇
1.3.2 Ease of resolving insolvency* 65.5 42
Human capital and research 32.8 58 ◇
2.1 Education 49.5 67
2.1.1 Expenditure on education, % GDP 3.9 70
2.1.2 Government funding/pupil, secondary, % GDP/cap 20.7 45
2.1.3 School life expectancy, years 14.5 63 ◇
2.1.4 PISA scales in reading, maths and science 469.4 38
2.1.5 Pupil-teacher ratio, secondary 11.2 41
2.2 Tertiary education 31.5 69 ◇
2.2.1 Tertiary enrolment, % gross 45.4 67 ◇
2.2.2 Graduates in science and engineering, % 22.1 59
2.2.3 Tertiary inbound mobility, % 8.0 31
2.3 Research and development (RD) 17.5 46
2.3.1 Researchers, FTE/mn pop. 3,111.0 31
2.3.2 Gross expenditure on RD, % GDP 0.8 46
2.3.3 Global corporate RD investors, top 3, mn US$ 0.0 41 ○ ◇
2.3.4 QS university ranking, top 3* 16.5 57
Infrastructure 50.5 39
3.1 Informationandcommunicationtechnologies(ICTs) 73.1 54 ◇
3.1.1 ICT access* 73.3 52 ◇
3.1.2 ICT use* 77.1 30
3.1.3 Government’s online service* 71.8 63
3.1.4 E-participation* 70.2 70 ◇
3.2 General infrastructure 26.9 72 ◇
3.2.1 Electricity output, GWh/mn pop. 4,899.4 46
3.2.2 Logistics performance* 45.5 52
3.2.3 Gross capital formation, % GDP 19.6 91 ○
3.3 Ecological sustainability 51.4 12 ●
3.3.1 GDP/unit of energy use 11.0 59
3.3.2 Environmental performance* 68.3 26 ●
3.3.3 ISO 14001 environmental certificates/bn PPP$ GDP 9.3 9 ● ◆
Market sophistication 44.9 73
4.1 Credit 47.4 41
4.1.1 Ease of getting credit* 70.0 44
4.1.2 Domestic credit to private sector, % GDP 62.9 54
4.1.3 Microfinance gross loans, % GDP n/a n/a
4.2 Investment 15.2 129 ○ ◇
4.2.1 Ease of protecting minority investors* 56.0 82 ○
4.2.2 Market capitalization, % GDP 5.1 71 ○ ◇
4.2.3 Venture capital investors, deals/bn PPP$ GDP 0.0 69 ○ ◇
4.2.4 Venture capital recipients, deals/bn PPP$ GDP 0.0 88 ○
4.3 Trade, diversification, and market scale 72.0 55
4.3.1 Applied tariff rate, weighted avg., % 1.8 25
4.3.2 Domestic industry diversification 84.2 69
4.3.3 Domestic market scale, bn PPP$ 175.6 68
NOTES: ● indicates a strength; ○ a weakness; ◆ an income group strength; ◇ an income group weakness; * an index; †
a survey question. indicates that
the
economy’s data are older than the base year; see appendices for details, including the year of the data, at http://globalinnovationindex.org. Square
brackets [ ] indicate
that the data minimum coverage (DMC) requirements were not met at the sub-pillar or pillar level.](https://image.slidesharecdn.com/e-220805033615-e8521670/75/E-INDEX-2021-pdf-169-2048.jpg)
![150 Global Innovation Index 2021
Slovenia GII 2021 rank
32
Output rank Input rank Income Region Population (mn) GDP, PPP$ (bn) GDP per capita, PPP$ GII 2020 rank
36 27 High EUR 2.1 79.7 38,506 32
Score/
Value Rank
Business sophistication 42.8 27
5.1 Knowledge workers 59.2 18
5.1.1 Knowledge-intensive employment, % 43.2 22
5.1.2 Firms offering formal training, % 44.0 23
5.1.3 GERD performed by business, % GDP 1.5 14
5.1.4 GERD financed by business, % 62.6 11 ●
5.1.5 Females employed w/advanced degrees, % 21.8 26
5.2 Innovation linkages 32.6 30
5.2.1 University-industry RD collaboration†
49.6 40
5.2.2 State of cluster development and depth†
45.4 74 ○
5.2.3 GERD financed by abroad, % GDP 0.3 12 ●
5.2.4 Joint venture/strategic alliance deals/bn PPP$ GDP 0.0 49
5.2.5 Patent families/bn PPP$ GDP 1.7 23
5.3 Knowledge absorption 36.6 37
5.3.1 Intellectual property payments, % total trade 0.6 63
5.3.2 High-tech imports, % total trade 6.6 86 ○
5.3.3 ICT services imports, % total trade 1.5 50
5.3.4 FDI net inflows, % GDP 2.8 56
5.3.5 Research talent, % in businesses 60.7 11 ●
Knowledge and technology outputs 33.0 32
6.1 Knowledge creation 33.9 29
6.1.1 Patents by origin/bn PPP$ GDP 4.4 21
6.1.2 PCT patents by origin/bn PPP$ GDP 1.1 28
6.1.3 Utility models by origin/bn PPP$ GDP 0.2 50 ○
6.1.4 Scientific and technical articles/bn PPP$ GDP 56.1 4 ● ◆
6.1.5 Citable documents H-index 19.2 43
6.2 Knowledge impact 38.5 28
6.2.1 Labor productivity growth, % −0.9 81 ○
6.2.2 New businesses/th pop. 15–64 3.1 45
6.2.3 Software spending, % GDP 0.1 89 ○ ◇
6.2.4 ISO 9001 quality certificates/bn PPP$ GDP 21.0 12 ● ◆
6.2.5 High-tech manufacturing, % 41.2 23
6.3 Knowledge diffusion 26.5 43
6.3.1 Intellectual property receipts, % total trade 0.2 43
6.3.2 Production and export complexity 81.3 10 ●
6.3.3 High-tech exports, % total trade 5.4 33
6.3.4 ICT services exports, % total trade 1.7 66
Creative outputs 34.3 38
7.1 Intangible assets 36.3 48
7.1.1 Trademarks by origin/bn PPP$ GDP 68.4 26
7.1.2 Global brand value, top 5,000, % GDP 6.7 66 ○
7.1.3 Industrial designs by origin/bn PPP$ GDP 2.7 39
7.1.4 ICTs and organizational model creation†
61.9 38
7.2 Creative goods and services 23.6 42
7.2.1 Cultural and creative services exports, % total trade 0.9 34
7.2.2 National feature films/mn pop. 15–69 14.1 9 ●
7.2.3 Entertainment and media market/th pop. 15–69 n/a n/a
7.2.4 Printing and other media, % manufacturing 1.5 28
7.2.5 Creative goods exports, % total trade 0.8 49
7.3 Online creativity 41.1 29
7.3.1 Generic top-level domains (TLDs)/th pop. 15–69 20.9 28
7.3.2 Country-code TLDs/th pop. 15–69 28.5 24
7.3.3 Wikipedia edits/mn pop. 15–69 74.9 23
7.3.4 Mobile app creation/bn PPP$ GDP 36.7 12 ●
Score/
Value Rank
Institutions 82.9 20
1.1 Political environment 76.0 31
1.1.1 Political and operational stability* 78.6 34
1.1.2 Government effectiveness* 74.7 28
1.2 Regulatory environment 83.9 23
1.2.1 Regulatory quality* 69.9 33
1.2.2 Rule of law* 76.2 25
1.2.3 Cost of redundancy dismissal 10.7 34
1.3 Business environment 88.7 7 ● ◆
1.3.1 Ease of starting a business* 93.0 39
1.3.2 Ease of resolving insolvency* 84.4 8 ●
Human capital and research 48.3 28
2.1 Education 59.6 31
2.1.1 Expenditure on education, % GDP 4.8 48
2.1.2 Government funding/pupil, secondary, % GDP/cap 22.8 29
2.1.3 School life expectancy, years 17.6 15
2.1.4 PISA scales in reading, maths and science 503.7 11
2.1.5 Pupil-teacher ratio, secondary 15.1 72 ◇
2.2 Tertiary education 44.3 23
2.2.1 Tertiary enrolment, % gross 77.1 24
2.2.2 Graduates in science and engineering, % 27.2 27
2.2.3 Tertiary inbound mobility, % 4.5 53
2.3 Research and development (RD) 41.1 25
2.3.1 Researchers, FTE/mn pop. 5,052.3 17
2.3.2 Gross expenditure on RD, % GDP 2.0 17
2.3.3 Global corporate RD investors, top 3, mn US$ 51.9 27
2.3.4 QS university ranking, top 3* 11.3 63
Infrastructure 53.9 27
3.1 Informationandcommunicationtechnologies(ICTs) 82.1 25
3.1.1 ICT access* 84.8 20
3.1.2 ICT use* 72.5 40
3.1.3 Government’s online service* 85.3 24
3.1.4 E-participation* 85.7 29
3.2 General infrastructure 34.6 41
3.2.1 Electricity output, GWh/mn pop. 7,605.7 27
3.2.2 Logistics performance* 58.9 34
3.2.3 Gross capital formation, % GDP 21.9 70
3.3 Ecological sustainability 45.1 24
3.3.1 GDP/unit of energy use 11.1 57
3.3.2 Environmental performance* 72.0 18
3.3.3 ISO 14001 environmental certificates/bn PPP$ GDP 5.6 18
Market sophistication 45.1 71
4.1 Credit 30.5 102 ○ ◇
4.1.1 Ease of getting credit* 45.0 101 ○ ◇
4.1.2 Domestic credit to private sector, % GDP 42.5 79 ○ ◇
4.1.3 Microfinance gross loans, % GDP n/a n/a
4.2 Investment 30.5 67
4.2.1 Ease of protecting minority investors* 78.0 18
4.2.2 Market capitalization, % GDP 13.7 65 ○
4.2.3 Venture capital investors, deals/bn PPP$ GDP n/a n/a
4.2.4 Venture capital recipients, deals/bn PPP$ GDP 0.0 49
4.3 Trade, diversification, and market scale 74.4 47
4.3.1 Applied tariff rate, weighted avg., % 1.8 25
4.3.2 Domestic industry diversification 98.2 10 ●
4.3.3 Domestic market scale, bn PPP$ 79.7 88 ○
NOTES: ● indicates a strength; ○ a weakness; ◆ an income group strength; ◇ an income group weakness; * an index; †
a survey question. indicates that
the
economy’s data are older than the base year; see appendices for details, including the year of the data, at http://globalinnovationindex.org. Square
brackets [ ] indicate
that the data minimum coverage (DMC) requirements were not met at the sub-pillar or pillar level.](https://image.slidesharecdn.com/e-220805033615-e8521670/75/E-INDEX-2021-pdf-170-2048.jpg)
![151
GII 2021 Economy profiles
South Africa GII 2021 rank
61
Output rank Input rank Income Region Population (mn) GDP, PPP$ (bn) GDP per capita, PPP$ GII 2020 rank
68 55 Upper middle SSF 59.3 710.8 11,911 60
Score/
Value Rank
Business sophistication 29.3 51
5.1 Knowledge workers 32.2 64
5.1.1 Knowledge-intensive employment, % 24.5 61
5.1.2 Firms offering formal training, % n/a n/a
5.1.3 GERD performed by business, % GDP 0.3 47
5.1.4 GERD financed by business, % 41.5 41
5.1.5 Females employed w/advanced degrees, % 11.1 65
5.2 Innovation linkages 23.4 53
5.2.1 University-industry RD collaboration†
52.5 36
5.2.2 State of cluster development and depth†
49.1 52
5.2.3 GERD financed by abroad, % GDP 0.1 43
5.2.4 Joint venture/strategic alliance deals/bn PPP$ GDP 0.1 36 ◆
5.2.5 Patent families/bn PPP$ GDP 0.2 41
5.3 Knowledge absorption 32.3 51
5.3.1 Intellectual property payments, % total trade 1.8 15 ● ◆
5.3.2 High-tech imports, % total trade 10.1 32
5.3.3 ICT services imports, % total trade 1.2 65
5.3.4 FDI net inflows, % GDP 1.1 105 ○
5.3.5 Research talent, % in businesses 18.6 56
Knowledge and technology outputs 21.9 61
6.1 Knowledge creation 20.5 52
6.1.1 Patents by origin/bn PPP$ GDP 0.7 71
6.1.2 PCT patents by origin/bn PPP$ GDP 0.4 38
6.1.3 Utility models by origin/bn PPP$ GDP n/a n/a
6.1.4 Scientific and technical articles/bn PPP$ GDP 21.6 40
6.1.5 Citable documents H-index 30.1 32 ● ◆
6.2 Knowledge impact 32.7 55
6.2.1 Labor productivity growth, % 0.3 60
6.2.2 New businesses/th pop. 15–64 10.2 13 ● ◆
6.2.3 Software spending, % GDP 0.4 24 ● ◆
6.2.4 ISO 9001 quality certificates/bn PPP$ GDP 4.6 58
6.2.5 High-tech manufacturing, % 20.5 62
6.3 Knowledge diffusion 12.5 81
6.3.1 Intellectual property receipts, % total trade 0.1 55
6.3.2 Production and export complexity 43.3 63
6.3.3 High-tech exports, % total trade 2.2 54
6.3.4 ICT services exports, % total trade 0.6 98 ○
Creative outputs 20.6 79
7.1 Intangible assets 32.2 60
7.1.1 Trademarks by origin/bn PPP$ GDP 28.3 77
7.1.2 Global brand value, top 5,000, % GDP 88.3 23 ● ◆
7.1.3 Industrial designs by origin/bn PPP$ GDP 1.3 62
7.1.4 ICTs and organizational model creation†
58.7 48
7.2 Creative goods and services 6.5 97
7.2.1 Cultural and creative services exports, % total trade 0.2 71
7.2.2 National feature films/mn pop. 15–69 0.6 96 ○
7.2.3 Entertainment and media market/th pop. 15–69 7.5 43
7.2.4 Printing and other media, % manufacturing n/a n/a
7.2.5 Creative goods exports, % total trade 0.8 55
7.3 Online creativity 11.3 88
7.3.1 Generic top-level domains (TLDs)/th pop. 15–69 3.0 65
7.3.2 Country-code TLDs/th pop. 15–69 9.7 41
7.3.3 Wikipedia edits/mn pop. 15–69 34.2 94 ◇
7.3.4 Mobile app creation/bn PPP$ GDP 0.6 78 ○
Score/
Value Rank
Institutions 66.8 55
1.1 Political environment 60.6 57
1.1.1 Political and operational stability* 64.3 80
1.1.2 Government effectiveness* 58.8 51
1.2 Regulatory environment 71.8 46
1.2.1 Regulatory quality* 47.6 61
1.2.2 Rule of law* 44.7 66
1.2.3 Cost of redundancy dismissal 9.3 25 ●
1.3 Business environment 67.9 75
1.3.1 Ease of starting a business* 81.2 107 ○
1.3.2 Ease of resolving insolvency* 54.6 63
Human capital and research 31.4 67
2.1 Education 51.9 62
2.1.1 Expenditure on education, % GDP 6.5 8 ● ◆
2.1.2 Government funding/pupil, secondary, % GDP/cap 22.9 26
2.1.3 School life expectancy, years 13.5 76
2.1.4 PISA scales in reading, maths and science n/a n/a
2.1.5 Pupil-teacher ratio, secondary 28.6 115 ○ ◇
2.2 Tertiary education 18.6 98 ○ ◇
2.2.1 Tertiary enrolment, % gross 23.8 94 ◇
2.2.2 Graduates in science and engineering, % 18.3 84 ○
2.2.3 Tertiary inbound mobility, % 3.6 60
2.3 Research and development (RD) 23.7 43
2.3.1 Researchers, FTE/mn pop. 517.7 66
2.3.2 Gross expenditure on RD, % GDP 0.8 44
2.3.3 Global corporate RD investors, top 3, mn US$ 40.7 38 ◆
2.3.4 QS university ranking, top 3* 31.4 39
Infrastructure 36.3 83
3.1 Informationandcommunicationtechnologies(ICTs) 63.6 74
3.1.1 ICT access* 51.5 89
3.1.2 ICT use* 53.2 75
3.1.3 Government’s online service* 74.7 55
3.1.4 E-participation* 75.0 57
3.2 General infrastructure 25.0 82
3.2.1 Electricity output, GWh/mn pop. 4,227.6 53
3.2.2 Logistics performance* 61.7 32 ◆
3.2.3 Gross capital formation, % GDP 13.2 119 ○ ◇
3.3 Ecological sustainability 20.4 97 ◇
3.3.1 GDP/unit of energy use 5.6 112 ○ ◇
3.3.2 Environmental performance* 43.1 82
3.3.3 ISO 14001 environmental certificates/bn PPP$ GDP 1.3 61
Market sophistication 57.0 23 ● ◆
4.1 Credit 47.3 42
4.1.1 Ease of getting credit* 60.0 74
4.1.2 Domestic credit to private sector, % GDP 139.5 11 ● ◆
4.1.3 Microfinance gross loans, % GDP 0.0 69 ○
4.2 Investment 51.0 18 ● ◆
4.2.1 Ease of protecting minority investors* 80.0 13 ● ◆
4.2.2 Market capitalization, % GDP 295.9 1 ● ◆
4.2.3 Venture capital investors, deals/bn PPP$ GDP 0.1 37
4.2.4 Venture capital recipients, deals/bn PPP$ GDP 0.0 44
4.3 Trade, diversification, and market scale 72.7 52
4.3.1 Applied tariff rate, weighted avg., % 5.4 92
4.3.2 Domestic industry diversification 81.7 73
4.3.3 Domestic market scale, bn PPP$ 710.8 32 ●
NOTES: ● indicates a strength; ○ a weakness; ◆ an income group strength; ◇ an income group weakness; * an index; †
a survey question. indicates that
the
economy’s data are older than the base year; see appendices for details, including the year of the data, at http://globalinnovationindex.org. Square
brackets [ ] indicate
that the data minimum coverage (DMC) requirements were not met at the sub-pillar or pillar level.](https://image.slidesharecdn.com/e-220805033615-e8521670/75/E-INDEX-2021-pdf-171-2048.jpg)
![152 Global Innovation Index 2021
Spain GII 2021 rank
30
Output rank Input rank Income Region Population (mn) GDP, PPP$ (bn) GDP per capita, PPP$ GII 2020 rank
29 28 High EUR 46.8 1,773.4 38,143 30
Score/
Value Rank
Business sophistication 35.5 35
5.1 Knowledge workers 47.3 29
5.1.1 Knowledge-intensive employment, % 33.8 42
5.1.2 Firms offering formal training, % n/a n/a
5.1.3 GERD performed by business, % GDP 0.7 32
5.1.4 GERD financed by business, % 49.5 28
5.1.5 Females employed w/advanced degrees, % 23.1 20
5.2 Innovation linkages 25.0 47
5.2.1 University-industry RD collaboration†
41.8 70 ○
5.2.2 State of cluster development and depth†
57.8 29
5.2.3 GERD financed by abroad, % GDP 0.1 39
5.2.4 Joint venture/strategic alliance deals/bn PPP$ GDP 0.0 53
5.2.5 Patent families/bn PPP$ GDP 0.6 32
5.3 Knowledge absorption 34.3 45
5.3.1 Intellectual property payments, % total trade 1.3 28
5.3.2 High-tech imports, % total trade 6.7 82 ○
5.3.3 ICT services imports, % total trade 1.7 42
5.3.4 FDI net inflows, % GDP 2.5 70
5.3.5 Research talent, % in businesses 38.1 35
Knowledge and technology outputs 36.2 26
6.1 Knowledge creation 38.1 25
6.1.1 Patents by origin/bn PPP$ GDP 1.6 45
6.1.2 PCT patents by origin/bn PPP$ GDP 0.8 29
6.1.3 Utility models by origin/bn PPP$ GDP 1.3 17
6.1.4 Scientific and technical articles/bn PPP$ GDP 37.7 22
6.1.5 Citable documents H-index 60.0 11 ●
6.2 Knowledge impact 42.6 20
6.2.1 Labor productivity growth, % −2.4 107 ○ ◇
6.2.2 New businesses/th pop. 15–64 3.1 46
6.2.3 Software spending, % GDP 0.6 4 ● ◆
6.2.4 ISO 9001 quality certificates/bn PPP$ GDP 15.4 18
6.2.5 High-tech manufacturing, % 35.3 34
6.3 Knowledge diffusion 28.0 42
6.3.1 Intellectual property receipts, % total trade 0.6 26
6.3.2 Production and export complexity 63.0 32
6.3.3 High-tech exports, % total trade 3.8 43
6.3.4 ICT services exports, % total trade 3.2 31
Creative outputs 36.2 32
7.1 Intangible assets 44.6 30
7.1.1 Trademarks by origin/bn PPP$ GDP 47.2 48
7.1.2 Global brand value, top 5,000, % GDP 95.4 21
7.1.3 Industrial designs by origin/bn PPP$ GDP 9.6 12 ● ◆
7.1.4 ICTs and organizational model creation†
63.4 34
7.2 Creative goods and services 21.2 47
7.2.1 Cultural and creative services exports, % total trade 1.2 25
7.2.2 National feature films/mn pop. 15–69 7.3 28
7.2.3 Entertainment and media market/th pop. 15–69 31.0 23
7.2.4 Printing and other media, % manufacturing 1.2 39
7.2.5 Creative goods exports, % total trade 0.8 52
7.3 Online creativity 34.3 31
7.3.1 Generic top-level domains (TLDs)/th pop. 15–69 28.3 22
7.3.2 Country-code TLDs/th pop. 15–69 17.7 32
7.3.3 Wikipedia edits/mn pop. 15–69 73.0 31
7.3.4 Mobile app creation/bn PPP$ GDP 15.0 35
Score/
Value Rank
Institutions 77.5 31
1.1 Political environment 73.0 37
1.1.1 Political and operational stability* 73.2 44
1.1.2 Government effectiveness* 72.8 32
1.2 Regulatory environment 76.6 35
1.2.1 Regulatory quality* 71.0 30
1.2.2 Rule of law* 72.5 31
1.2.3 Cost of redundancy dismissal 17.4 73 ○
1.3 Business environment 83.1 25
1.3.1 Ease of starting a business* 86.9 75 ○ ◇
1.3.2 Ease of resolving insolvency* 79.2 17 ●
Human capital and research 47.4 30
2.1 Education 56.0 46
2.1.1 Expenditure on education, % GDP 4.2 61 ○
2.1.2 Government funding/pupil, secondary, % GDP/cap 19.1 55 ○
2.1.3 School life expectancy, years 17.8 13 ●
2.1.4 PISA scales in reading, maths and science 482.3 29
2.1.5 Pupil-teacher ratio, secondary 11.5 44
2.2 Tertiary education 42.1 36
2.2.1 Tertiary enrolment, % gross 91.1 7 ●
2.2.2 Graduates in science and engineering, % 22.3 57
2.2.3 Tertiary inbound mobility, % 3.5 61 ○
2.3 Research and development (RD) 44.1 23
2.3.1 Researchers, FTE/mn pop. 3,080.5 32
2.3.2 Gross expenditure on RD, % GDP 1.2 31
2.3.3 Global corporate RD investors, top 3, mn US$ 71.5 14 ●
2.3.4 QS university ranking, top 3* 43.4 26
Infrastructure 58.2 13 ●
3.1 Informationandcommunicationtechnologies(ICTs) 85.3 19
3.1.1 ICT access* 85.7 19
3.1.2 ICT use* 82.1 17 ●
3.1.3 Government’s online service* 88.8 17
3.1.4 E-participation* 84.5 36
3.2 General infrastructure 37.6 34
3.2.1 Electricity output, GWh/mn pop. 5,820.4 37
3.2.2 Logistics performance* 82.8 17
3.2.3 Gross capital formation, % GDP 20.3 87 ○
3.3 Ecological sustainability 51.7 10 ●
3.3.1 GDP/unit of energy use 14.7 24
3.3.2 Environmental performance* 74.3 14 ●
3.3.3 ISO 14001 environmental certificates/bn PPP$ GDP 6.4 15 ● ◆
Market sophistication 54.2 32
4.1 Credit 49.3 35
4.1.1 Ease of getting credit* 60.0 74 ○
4.1.2 Domestic credit to private sector, % GDP 94.7 27
4.1.3 Microfinance gross loans, % GDP n/a n/a
4.2 Investment 28.0 72 ○
4.2.1 Ease of protecting minority investors* 72.0 27
4.2.2 Market capitalization, % GDP 58.6 27
4.2.3 Venture capital investors, deals/bn PPP$ GDP 0.0 42
4.2.4 Venture capital recipients, deals/bn PPP$ GDP 0.0 47
4.3 Trade, diversification, and market scale 85.2 12 ●
4.3.1 Applied tariff rate, weighted avg., % 1.8 25
4.3.2 Domestic industry diversification 94.1 34
4.3.3 Domestic market scale, bn PPP$ 1,773.4 16 ● ◆
NOTES: ● indicates a strength; ○ a weakness; ◆ an income group strength; ◇ an income group weakness; * an index; †
a survey question. indicates that
the
economy’s data are older than the base year; see appendices for details, including the year of the data, at http://globalinnovationindex.org. Square
brackets [ ] indicate
that the data minimum coverage (DMC) requirements were not met at the sub-pillar or pillar level.](https://image.slidesharecdn.com/e-220805033615-e8521670/75/E-INDEX-2021-pdf-172-2048.jpg)
![153
GII 2021 Economy profiles
Sri Lanka GII 2021 rank
95
Output rank Input rank Income Region Population (mn) GDP, PPP$ (bn) GDP per capita, PPP$ GII 2020 rank
85 103 Lower middle CSA 21.4 287.7 13,114 101
Score/
Value Rank
Business sophistication 25.6 62
5.1 Knowledge workers 23.7 87
5.1.1 Knowledge-intensive employment, % 23.0 68
5.1.2 Firms offering formal training, % 18.4 83
5.1.3 GERD performed by business, % GDP 0.1 73
5.1.4 GERD financed by business, % 40.3 44 ◆
5.1.5 Females employed w/advanced degrees, % 3.2 100
5.2 Innovation linkages 21.3 62
5.2.1 University-industry RD collaboration†
48.7 44 ● ◆
5.2.2 State of cluster development and depth†
50.4 44 ●
5.2.3 GERD financed by abroad, % GDP 0.0 79
5.2.4 Joint venture/strategic alliance deals/bn PPP$ GDP 0.1 28 ● ◆
5.2.5 Patent families/bn PPP$ GDP 0.0 73
5.3 Knowledge absorption 31.7 53 ◆
5.3.1 Intellectual property payments, % total trade n/a n/a
5.3.2 High-tech imports, % total trade 7.7 64
5.3.3 ICT services imports, % total trade 2.3 26 ● ◆
5.3.4 FDI net inflows, % GDP 1.4 95
5.3.5 Research talent, % in businesses 20.0 54
Knowledge and technology outputs 19.7 68
6.1 Knowledge creation 7.7 90
6.1.1 Patents by origin/bn PPP$ GDP 1.2 59
6.1.2 PCT patents by origin/bn PPP$ GDP 0.1 69
6.1.3 Utility models by origin/bn PPP$ GDP n/a n/a
6.1.4 Scientific and technical articles/bn PPP$ GDP 4.7 114 ○
6.1.5 Citable documents H-index 10.6 72
6.2 Knowledge impact 26.3 79
6.2.1 Labor productivity growth, % 1.0 46 ●
6.2.2 New businesses/th pop. 15–64 0.7 88
6.2.3 Software spending, % GDP 0.4 22 ● ◆
6.2.4 ISO 9001 quality certificates/bn PPP$ GDP 4.2 62 ◆
6.2.5 High-tech manufacturing, % 7.7 95
6.3 Knowledge diffusion 25.0 46 ●
6.3.1 Intellectual property receipts, % total trade n/a n/a
6.3.2 Production and export complexity 35.6 77
6.3.3 High-tech exports, % total trade 0.9 75
6.3.4 ICT services exports, % total trade 4.8 16 ● ◆
Creative outputs 15.8 100
7.1 Intangible assets 21.1 97
7.1.1 Trademarks by origin/bn PPP$ GDP 22.5 88
7.1.2 Global brand value, top 5,000, % GDP 15.7 53
7.1.3 Industrial designs by origin/bn PPP$ GDP 1.6 54
7.1.4 ICTs and organizational model creation†
47.5 91
7.2 Creative goods and services 13.9 [67]
7.2.1 Cultural and creative services exports, % total trade n/a n/a
7.2.2 National feature films/mn pop. 15–69 1.0 85
7.2.3 Entertainment and media market/th pop. 15–69 n/a n/a
7.2.4 Printing and other media, % manufacturing 2.3 11 ● ◆
7.2.5 Creative goods exports, % total trade 0.4 67
7.3 Online creativity 7.4 112
7.3.1 Generic top-level domains (TLDs)/th pop. 15–69 0.7 101
7.3.2 Country-code TLDs/th pop. 15–69 0.9 89
7.3.3 Wikipedia edits/mn pop. 15–69 30.0 104
7.3.4 Mobile app creation/bn PPP$ GDP 0.7 77
Score/
Value Rank
Institutions 47.5 119 ○
1.1 Political environment 54.7 79
1.1.1 Political and operational stability* 67.9 71
1.1.2 Government effectiveness* 48.1 81
1.2 Regulatory environment 21.3 130 ○ ◇
1.2.1 Regulatory quality* 38.7 83
1.2.2 Rule of law* 46.4 63 ◆
1.2.3 Cost of redundancy dismissal 58.5 130 ○ ◇
1.3 Business environment 66.6 79
1.3.1 Ease of starting a business* 88.2 68
1.3.2 Ease of resolving insolvency* 45.0 85
Human capital and research 13.5 118 ○ ◇
2.1 Education 29.6 114 ○
2.1.1 Expenditure on education, % GDP 2.1 112 ○ ◇
2.1.2 Government funding/pupil, secondary, % GDP/cap 6.7 99 ○ ◇
2.1.3 School life expectancy, years 14.1 70 ◆
2.1.4 PISA scales in reading, maths and science n/a n/a
2.1.5 Pupil-teacher ratio, secondary 17.5 85
2.2 Tertiary education 9.9 113
2.2.1 Tertiary enrolment, % gross 21.1 97
2.2.2 Graduates in science and engineering, % n/a n/a
2.2.3 Tertiary inbound mobility, % 0.5 97 ○
2.3 Research and development (RD) 0.9 106
2.3.1 Researchers, FTE/mn pop. 106.4 86
2.3.2 Gross expenditure on RD, % GDP 0.1 100
2.3.3 Global corporate RD investors, top 3, mn US$ 0.0 41 ○ ◇
2.3.4 QS university ranking, top 3* 0.0 74 ○ ◇
Infrastructure 39.7 73 ◆
3.1 Informationandcommunicationtechnologies(ICTs) 57.4 88
3.1.1 ICT access* 49.1 92
3.1.2 ICT use* 37.4 100
3.1.3 Government’s online service* 71.8 63 ◆
3.1.4 E-participation* 71.4 66
3.2 General infrastructure 22.1 96
3.2.1 Electricity output, GWh/mn pop. 711.5 103
3.2.2 Logistics performance* 25.6 90
3.2.3 Gross capital formation, % GDP 24.4 53
3.3 Ecological sustainability 39.5 37 ● ◆
3.3.1 GDP/unit of energy use 23.7 4 ● ◆
3.3.2 Environmental performance* 39.0 90
3.3.3 ISO 14001 environmental certificates/bn PPP$ GDP 1.4 59 ◆
Market sophistication 35.8 118 ○
4.1 Credit 25.5 116 ○
4.1.1 Ease of getting credit* 40.0 113 ○
4.1.2 Domestic credit to private sector, % GDP 49.8 70
4.1.3 Microfinance gross loans, % GDP 0.5 35
4.2 Investment 20.7 109
4.2.1 Ease of protecting minority investors* 72.0 27 ● ◆
4.2.2 Market capitalization, % GDP 19.3 60
4.2.3 Venture capital investors, deals/bn PPP$ GDP 0.0 78 ○
4.2.4 Venture capital recipients, deals/bn PPP$ GDP 0.0 71
4.3 Trade, diversification, and market scale 61.1 90
4.3.1 Applied tariff rate, weighted avg., % 13.3 127 ○ ◇
4.3.2 Domestic industry diversification 84.0 70
4.3.3 Domestic market scale, bn PPP$ 287.7 54
NOTES: ● indicates a strength; ○ a weakness; ◆ an income group strength; ◇ an income group weakness; * an index; †
a survey question. indicates that
the
economy’s data are older than the base year; see appendices for details, including the year of the data, at http://globalinnovationindex.org. Square
brackets [ ] indicate
that the data minimum coverage (DMC) requirements were not met at the sub-pillar or pillar level.](https://image.slidesharecdn.com/e-220805033615-e8521670/75/E-INDEX-2021-pdf-173-2048.jpg)
![154 Global Innovation Index 2021
Sweden GII 2021 rank
2
Output rank Input rank Income Region Population (mn) GDP, PPP$ (bn) GDP per capita, PPP$ GII 2020 rank
2 2 High EUR 10.1 551.5 52,477 2
Score/
Value Rank
Business sophistication 68.1 1 ● ◆
5.1 Knowledge workers 77.3 3 ● ◆
5.1.1 Knowledge-intensive employment, % 54.4 3 ● ◆
5.1.2 Firms offering formal training, % 70.3 3 ●
5.1.3 GERD performed by business, % GDP 2.4 4
5.1.4 GERD financed by business, % 60.8 12
5.1.5 Females employed w/advanced degrees, % 26.4 8
5.2 Innovation linkages 70.3 2 ● ◆
5.2.1 University-industry RD collaboration†
67.1 11
5.2.2 State of cluster development and depth†
60.2 25
5.2.3 GERD financed by abroad, % GDP 0.3 8
5.2.4 Joint venture/strategic alliance deals/bn PPP$ GDP 0.3 4 ● ◆
5.2.5 Patent families/bn PPP$ GDP 6.7 1 ● ◆
5.3 Knowledge absorption 56.6 6
5.3.1 Intellectual property payments, % total trade 2.4 11
5.3.2 High-tech imports, % total trade 8.2 57 ○
5.3.3 ICT services imports, % total trade 3.4 5
5.3.4 FDI net inflows, % GDP 3.0 48
5.3.5 Research talent, % in businesses 71.5 5 ◆
Knowledge and technology outputs 60.3 2 ● ◆
6.1 Knowledge creation 78.4 2 ● ◆
6.1.1 Patents by origin/bn PPP$ GDP 10.8 8
6.1.2 PCT patents by origin/bn PPP$ GDP 7.9 1 ● ◆
6.1.3 Utility models by origin/bn PPP$ GDP n/a n/a
6.1.4 Scientific and technical articles/bn PPP$ GDP 54.4 5 ◆
6.1.5 Citable documents H-index 59.4 12
6.2 Knowledge impact 44.1 14
6.2.1 Labor productivity growth, % −0.1 70 ○
6.2.2 New businesses/th pop. 15–64 7.2 22
6.2.3 Software spending, % GDP 0.5 11
6.2.4 ISO 9001 quality certificates/bn PPP$ GDP 7.5 37
6.2.5 High-tech manufacturing, % 48.3 15
6.3 Knowledge diffusion 58.4 6
6.3.1 Intellectual property receipts, % total trade 3.2 6 ◆
6.3.2 Production and export complexity 83.1 8
6.3.3 High-tech exports, % total trade 7.2 23
6.3.4 ICT services exports, % total trade 6.4 8
Creative outputs 52.9 5
7.1 Intangible assets 57.3 8
7.1.1 Trademarks by origin/bn PPP$ GDP 43.9 53 ○
7.1.2 Global brand value, top 5,000, % GDP 221.3 3 ● ◆
7.1.3 Industrial designs by origin/bn PPP$ GDP 4.3 27
7.1.4 ICTs and organizational model creation†
82.7 2 ● ◆
7.2 Creative goods and services 33.0 19
7.2.1 Cultural and creative services exports, % total trade 1.8 11
7.2.2 National feature films/mn pop. 15–69 10.0 20
7.2.3 Entertainment and media market/th pop. 15–69 57.1 10
7.2.4 Printing and other media, % manufacturing 0.9 61 ○
7.2.5 Creative goods exports, % total trade 1.8 32
7.3 Online creativity 63.7 7
7.3.1 Generic top-level domains (TLDs)/th pop. 15–69 43.1 17
7.3.2 Country-code TLDs/th pop. 15–69 69.6 7
7.3.3 Wikipedia edits/mn pop. 15–69 81.6 8
7.3.4 Mobile app creation/bn PPP$ GDP 56.2 9
Score/
Value Rank
Institutions 88.8 9
1.1 Political environment 89.4 8
1.1.1 Political and operational stability* 85.7 11
1.1.2 Government effectiveness* 91.3 6
1.2 Regulatory environment 90.5 13
1.2.1 Regulatory quality* 90.6 8
1.2.2 Rule of law* 97.0 4 ●
1.2.3 Cost of redundancy dismissal 14.4 55 ○
1.3 Business environment 86.3 16
1.3.1 Ease of starting a business* 93.1 37
1.3.2 Ease of resolving insolvency* 79.5 16
Human capital and research 64.1 2 ● ◆
2.1 Education 74.3 4 ● ◆
2.1.1 Expenditure on education, % GDP 7.6 5 ◆
2.1.2 Government funding/pupil, secondary, % GDP/cap 23.4 24
2.1.3 School life expectancy, years 19.7 3 ● ◆
2.1.4 PISA scales in reading, maths and science 502.5 14
2.1.5 Pupil-teacher ratio, secondary 12.6 52 ○
2.2 Tertiary education 43.9 25
2.2.1 Tertiary enrolment, % gross 72.5 27
2.2.2 Graduates in science and engineering, % 26.6 30
2.2.3 Tertiary inbound mobility, % 7.2 35
2.3 Research and development (RD) 74.1 5
2.3.1 Researchers, FTE/mn pop. 7,734.8 3 ● ◆
2.3.2 Gross expenditure on RD, % GDP 3.4 3 ●
2.3.3 Global corporate RD investors, top 3, mn US$ 77.9 10
2.3.4 QS university ranking, top 3* 57.8 16
Infrastructure 62.6 3 ● ◆
3.1 Informationandcommunicationtechnologies(ICTs) 84.8 22
3.1.1 ICT access* 80.0 33
3.1.2 ICT use* 87.2 7
3.1.3 Government’s online service* 90.0 15
3.1.4 E-participation* 82.1 41
3.2 General infrastructure 53.3 6 ◆
3.2.1 Electricity output, GWh/mn pop. 16,383.0 7
3.2.2 Logistics performance* 93.1 2 ●
3.2.3 Gross capital formation, % GDP 24.5 52 ○
3.3 Ecological sustainability 49.6 17
3.3.1 GDP/unit of energy use 11.0 58 ○
3.3.2 Environmental performance* 78.7 8
3.3.3 ISO 14001 environmental certificates/bn PPP$ GDP 6.7 12 ◆
Market sophistication 64.6 11
4.1 Credit 57.6 17
4.1.1 Ease of getting credit* 60.0 74 ○
4.1.2 Domestic credit to private sector, % GDP 132.7 15
4.1.3 Microfinance gross loans, % GDP n/a n/a
4.2 Investment 54.8 16
4.2.1 Ease of protecting minority investors* 72.0 27
4.2.2 Market capitalization, % GDP n/a n/a
4.2.3 Venture capital investors, deals/bn PPP$ GDP 0.2 12
4.2.4 Venture capital recipients, deals/bn PPP$ GDP 0.1 15
4.3 Trade, diversification, and market scale 81.4 24
4.3.1 Applied tariff rate, weighted avg., % 1.8 25 ○
4.3.2 Domestic industry diversification 96.2 20
4.3.3 Domestic market scale, bn PPP$ 551.5 38
NOTES: ● indicates a strength; ○ a weakness; ◆ an income group strength; ◇ an income group weakness; * an index; †
a survey question. indicates that
the
economy’s data are older than the base year; see appendices for details, including the year of the data, at http://globalinnovationindex.org. Square
brackets [ ] indicate
that the data minimum coverage (DMC) requirements were not met at the sub-pillar or pillar level.](https://image.slidesharecdn.com/e-220805033615-e8521670/75/E-INDEX-2021-pdf-174-2048.jpg)
![155
GII 2021 Economy profiles
Switzerland GII 2021 rank
1
Output rank Input rank Income Region Population (mn) GDP, PPP$ (bn) GDP per capita, PPP$ GII 2020 rank
1 4 High EUR 8.7 590.9 68,340 1
Score/
Value Rank
Business sophistication 62.6 4 ◆
5.1 Knowledge workers 71.4 5
5.1.1 Knowledge-intensive employment, % 51.0 6
5.1.2 Firms offering formal training, % n/a n/a
5.1.3 GERD performed by business, % GDP 2.3 6
5.1.4 GERD financed by business, % 68.6 6 ◆
5.1.5 Females employed w/advanced degrees, % 20.0 31
5.2 Innovation linkages 63.9 4
5.2.1 University-industry RD collaboration†
77.1 2 ● ◆
5.2.2 State of cluster development and depth†
70.6 4 ◆
5.2.3 GERD financed by abroad, % GDP 0.2 26
5.2.4 Joint venture/strategic alliance deals/bn PPP$ GDP 0.2 12
5.2.5 Patent families/bn PPP$ GDP 8.5 1 ● ◆
5.3 Knowledge absorption 52.4 11
5.3.1 Intellectual property payments, % total trade 3.1 6 ◆
5.3.2 High-tech imports, % total trade 6.2 93 ○
5.3.3 ICT services imports, % total trade 3.7 4 ◆
5.3.4 FDI net inflows, % GDP 1.9 81 ○
5.3.5 Research talent, % in businesses 49.7 25
Knowledge and technology outputs 63.9 1 ● ◆
6.1 Knowledge creation 86.6 1 ● ◆
6.1.1 Patents by origin/bn PPP$ GDP 15.6 1 ● ◆
6.1.2 PCT patents by origin/bn PPP$ GDP 8.3 1 ● ◆
6.1.3 Utility models by origin/bn PPP$ GDP n/a n/a
6.1.4 Scientific and technical articles/bn PPP$ GDP 56.6 3 ● ◆
6.1.5 Citable documents H-index 66.1 10
6.2 Knowledge impact 55.4 2 ● ◆
6.2.1 Labor productivity growth, % −0.1 67 ○
6.2.2 New businesses/th pop. 15–64 4.5 33
6.2.3 Software spending, % GDP 0.7 2 ● ◆
6.2.4 ISO 9001 quality certificates/bn PPP$ GDP 12.7 23
6.2.5 High-tech manufacturing, % 68.5 2 ● ◆
6.3 Knowledge diffusion 49.7 12
6.3.1 Intellectual property receipts, % total trade 5.9 1 ● ◆
6.3.2 Production and export complexity 94.0 2 ● ◆
6.3.3 High-tech exports, % total trade 7.2 25
6.3.4 ICT services exports, % total trade 2.6 43
Creative outputs 60.2 2 ● ◆
7.1 Intangible assets 63.4 5 ◆
7.1.1 Trademarks by origin/bn PPP$ GDP 66.2 29
7.1.2 Global brand value, top 5,000, % GDP 236.0 2 ● ◆
7.1.3 Industrial designs by origin/bn PPP$ GDP 5.4 23
7.1.4 ICTs and organizational model creation†
77.4 9
7.2 Creative goods and services 47.5 3 ● ◆
7.2.1 Cultural and creative services exports, % total trade 0.6 39
7.2.2 National feature films/mn pop. 15–69 19.4 6 ◆
7.2.3 Entertainment and media market/th pop. 15–69 97.4 2 ● ◆
7.2.4 Printing and other media, % manufacturing 1.1 41 ○
7.2.5 Creative goods exports, % total trade 3.7 13
7.3 Online creativity 66.3 4
7.3.1 Generic top-level domains (TLDs)/th pop. 15–69 59.2 11
7.3.2 Country-code TLDs/th pop. 15–69 100.0 1 ● ◆
7.3.3 Wikipedia edits/mn pop. 15–69 76.6 16
7.3.4 Mobile app creation/bn PPP$ GDP 25.8 22
Score/
Value Rank
Institutions 87.3 13
1.1 Political environment 92.4 3 ● ◆
1.1.1 Political and operational stability* 89.3 6
1.1.2 Government effectiveness* 94.0 2 ● ◆
1.2 Regulatory environment 93.9 7
1.2.1 Regulatory quality* 87.0 12
1.2.2 Rule of law* 97.0 3 ●
1.2.3 Cost of redundancy dismissal 10.1 31
1.3 Business environment 75.5 47 ◇
1.3.1 Ease of starting a business* 88.4 66 ○
1.3.2 Ease of resolving insolvency* 62.6 44 ◇
Human capital and research 60.7 6
2.1 Education 61.3 24
2.1.1 Expenditure on education, % GDP 5.1 34
2.1.2 Government funding/pupil, secondary, % GDP/cap 24.7 17
2.1.3 School life expectancy, years 16.4 27
2.1.4 PISA scales in reading, maths and science 498.2 21
2.1.5 Pupil-teacher ratio, secondary 9.7 25
2.2 Tertiary education 45.1 21
2.2.1 Tertiary enrolment, % gross 61.4 49
2.2.2 Graduates in science and engineering, % 25.2 38
2.2.3 Tertiary inbound mobility, % 17.7 9
2.3 Research and development (RD) 75.8 3 ● ◆
2.3.1 Researchers, FTE/mn pop. 5,450.5 11
2.3.2 Gross expenditure on RD, % GDP 3.2 6
2.3.3 Global corporate RD investors, top 3, mn US$ 90.0 6
2.3.4 QS university ranking, top 3* 83.9 4
Infrastructure 62.7 2 ● ◆
3.1 Informationandcommunicationtechnologies(ICTs) 87.8 15
3.1.1 ICT access* 87.2 15
3.1.2 ICT use* 90.4 1 ● ◆
3.1.3 Government’s online service* 82.9 36
3.1.4 E-participation* 90.5 18
3.2 General infrastructure 42.1 24
3.2.1 Electricity output, GWh/mn pop. 8,222.5 20
3.2.2 Logistics performance* 86.1 13
3.2.3 Gross capital formation, % GDP 22.0 67 ○
3.3 Ecological sustainability 58.1 2 ● ◆
3.3.1 GDP/unit of energy use 23.4 6 ◆
3.3.2 Environmental performance* 81.5 3 ●
3.3.3 ISO 14001 environmental certificates/bn PPP$ GDP 3.7 24
Market sophistication 71.5 6
4.1 Credit 69.2 7
4.1.1 Ease of getting credit* 65.0 61 ○
4.1.2 Domestic credit to private sector, % GDP 174.6 4 ◆
4.1.3 Microfinance gross loans, % GDP n/a n/a
4.2 Investment 70.6 10
4.2.1 Ease of protecting minority investors* 50.0 92 ○ ◇
4.2.2 Market capitalization, % GDP 237.8 3 ● ◆
4.2.3 Venture capital investors, deals/bn PPP$ GDP 0.4 7 ◆
4.2.4 Venture capital recipients, deals/bn PPP$ GDP 0.1 8
4.3 Trade, diversification, and market scale 74.6 46
4.3.1 Applied tariff rate, weighted avg., % 6.1 95 ○ ◇
4.3.2 Domestic industry diversification 90.5 49 ○
4.3.3 Domestic market scale, bn PPP$ 590.9 34
NOTES: ● indicates a strength; ○ a weakness; ◆ an income group strength; ◇ an income group weakness; * an index; †
a survey question. indicates that
the
economy’s data are older than the base year; see appendices for details, including the year of the data, at http://globalinnovationindex.org. Square
brackets [ ] indicate
that the data minimum coverage (DMC) requirements were not met at the sub-pillar or pillar level.](https://image.slidesharecdn.com/e-220805033615-e8521670/75/E-INDEX-2021-pdf-175-2048.jpg)
![156 Global Innovation Index 2021
Tajikistan GII 2021 rank
103
Output rank Input rank Income Region Population (mn) GDP, PPP$ (bn) GDP per capita, PPP$ GII 2020 rank
96 104 Low CSA 9.5 33.7 3,560 109
Score/
Value Rank
Business sophistication 13.2[129]
5.1 Knowledge workers 13.6 [114]
5.1.1 Knowledge-intensive employment, % n/a n/a
5.1.2 Firms offering formal training, % 24.3 64
5.1.3 GERD performed by business, % GDP n/a n/a
5.1.4 GERD financed by business, % 1.6 90
5.1.5 Females employed w/advanced degrees, % n/a n/a
5.2 Innovation linkages 13.7 115
5.2.1 University-industry RD collaboration†
47.2 47 ● ◆
5.2.2 State of cluster development and depth†
32.5 119
5.2.3 GERD financed by abroad, % GDP 0.0 98 ◇
5.2.4 Joint venture/strategic alliance deals/bn PPP$ GDP 0.0 75
5.2.5 Patent families/bn PPP$ GDP 0.0 100 ○ ◇
5.3 Knowledge absorption 12.2 [131]
5.3.1 Intellectual property payments, % total trade 0.0 119
5.3.2 High-tech imports, % total trade n/a n/a
5.3.3 ICT services imports, % total trade 0.3 121 ◇
5.3.4 FDI net inflows, % GDP 2.7 64 ●
5.3.5 Research talent, % in businesses n/a n/a
Knowledge and technology outputs 16.6 80 ◆
6.1 Knowledge creation 23.1 44 ● ◆
6.1.1 Patents by origin/bn PPP$ GDP 0.4 83
6.1.2 PCT patents by origin/bn PPP$ GDP 0.0 98 ○ ◇
6.1.3 Utility models by origin/bn PPP$ GDP 3.6 5 ● ◆
6.1.4 Scientific and technical articles/bn PPP$ GDP 4.3 116
6.1.5 Citable documents H-index 1.1 131 ○ ◇
6.2 Knowledge impact 20.7 100
6.2.1 Labor productivity growth, % 4.7 7 ● ◆
6.2.2 New businesses/th pop. 15–64 0.2 114
6.2.3 Software spending, % GDP 0.1 95 ◆
6.2.4 ISO 9001 quality certificates/bn PPP$ GDP 0.2 132 ○ ◇
6.2.5 High-tech manufacturing, % 2.8 108 ○
6.3 Knowledge diffusion 5.9 115
6.3.1 Intellectual property receipts, % total trade 0.0 105
6.3.2 Production and export complexity 18.7 112
6.3.3 High-tech exports, % total trade n/a n/a
6.3.4 ICT services exports, % total trade 0.3 111
Creative outputs 14.8 107
7.1 Intangible assets 16.5 114
7.1.1 Trademarks by origin/bn PPP$ GDP 18.1 96
7.1.2 Global brand value, top 5,000, % GDP 0.0 80 ○ ◇
7.1.3 Industrial designs by origin/bn PPP$ GDP 0.0 119 ○ ◇
7.1.4 ICTs and organizational model creation†
44.4 99
7.2 Creative goods and services 12.3 [72]
7.2.1 Cultural and creative services exports, % total trade 0.0 103
7.2.2 National feature films/mn pop. 15–69 1.8 72
7.2.3 Entertainment and media market/th pop. 15–69 n/a n/a
7.2.4 Printing and other media, % manufacturing 1.6 24 ●
7.2.5 Creative goods exports, % total trade n/a n/a
7.3 Online creativity 13.9 77 ◆
7.3.1 Generic top-level domains (TLDs)/th pop. 15–69 0.0 128
7.3.2 Country-code TLDs/th pop. 15–69 0.4 104
7.3.3 Wikipedia edits/mn pop. 15–69 42.3 82 ◆
7.3.4 Mobile app creation/bn PPP$ GDP n/a n/a
Score/
Value Rank
Institutions 47.7 118
1.1 Political environment 37.9 124
1.1.1 Political and operational stability* 58.9 100
1.1.2 Government effectiveness* 27.3 125
1.2 Regulatory environment 44.3 118
1.2.1 Regulatory quality* 17.1 128
1.2.2 Rule of law* 14.4 130 ○
1.2.3 Cost of redundancy dismissal 21.7 93
1.3 Business environment 60.8 105
1.3.1 Ease of starting a business* 93.2 34 ● ◆
1.3.2 Ease of resolving insolvency* 28.4 122 ◇
Human capital and research 25.2 85 ◆
2.1 Education 51.5 [64]
2.1.1 Expenditure on education, % GDP 5.2 30 ●
2.1.2 Government funding/pupil, secondary, % GDP/cap n/a n/a
2.1.3 School life expectancy, years 11.4 97
2.1.4 PISA scales in reading, maths and science n/a n/a
2.1.5 Pupil-teacher ratio, secondary 15.4 76 ◆
2.2 Tertiary education 23.4 89 ◆
2.2.1 Tertiary enrolment, % gross 31.3 85 ◆
2.2.2 Graduates in science and engineering, % 22.0 60 ●
2.2.3 Tertiary inbound mobility, % 0.8 92
2.3 Research and development (RD) 0.6 113
2.3.1 Researchers, FTE/mn pop. n/a n/a
2.3.2 Gross expenditure on RD, % GDP 0.1 107
2.3.3 Global corporate RD investors, top 3, mn US$ 0.0 41 ○ ◇
2.3.4 QS university ranking, top 3* 0.0 74 ○ ◇
Infrastructure 21.7 126
3.1 Informationandcommunicationtechnologies(ICTs) 30.7 123
3.1.1 ICT access* 41.4 106 ◆
3.1.2 ICT use* 15.0 122
3.1.3 Government’s online service* 31.8 124
3.1.4 E-participation* 34.5 119
3.2 General infrastructure 14.9 118
3.2.1 Electricity output, GWh/mn pop. 2,169.2 78 ◆
3.2.2 Logistics performance* 13.6 118
3.2.3 Gross capital formation, % GDP 17.8 100
3.3 Ecological sustainability 19.6 103
3.3.1 GDP/unit of energy use 8.5 86
3.3.2 Environmental performance* 38.2 95 ◆
3.3.3 ISO 14001 environmental certificates/bn PPP$ GDP 0.1 124
Market sophistication 52.5 37 ● ◆
4.1 Credit 57.1 18 ● ◆
4.1.1 Ease of getting credit* 90.0 10 ● ◆
4.1.2 Domestic credit to private sector, % GDP 11.8 125
4.1.3 Microfinance gross loans, % GDP 5.7 1 ● ◆
4.2 Investment 40.0 [35]
4.2.1 Ease of protecting minority investors* 40.0 110
4.2.2 Market capitalization, % GDP n/a n/a
4.2.3 Venture capital investors, deals/bn PPP$ GDP n/a n/a
4.2.4 Venture capital recipients, deals/bn PPP$ GDP n/a n/a
4.3 Trade, diversification, and market scale 60.3 93 ◆
4.3.1 Applied tariff rate, weighted avg., % 5.0 84
4.3.2 Domestic industry diversification 80.8 74
4.3.3 Domestic market scale, bn PPP$ 33.7 119
NOTES: ● indicates a strength; ○ a weakness; ◆ an income group strength; ◇ an income group weakness; * an index; †
a survey question. indicates that
the
economy’s data are older than the base year; see appendices for details, including the year of the data, at http://globalinnovationindex.org. Square
brackets [ ] indicate
that the data minimum coverage (DMC) requirements were not met at the sub-pillar or pillar level.](https://image.slidesharecdn.com/e-220805033615-e8521670/75/E-INDEX-2021-pdf-176-2048.jpg)
![157
GII 2021 Economy profiles
Thailand GII 2021 rank
43
Output rank Input rank Income Region Population (mn) GDP, PPP$ (bn) GDP per capita, PPP$ GII 2020 rank
46 47 Upper middle SEAO 69.8 1,261.5 18,073 44
Score/
Value Rank
Business sophistication 34.7 36 ◆
5.1 Knowledge workers 37.3 51
5.1.1 Knowledge-intensive employment, % 13.8 98 ○ ◇
5.1.2 Firms offering formal training, % 18.0 84 ○
5.1.3 GERD performed by business, % GDP 0.8 27 ◆
5.1.4 GERD financed by business, % 80.8 1 ● ◆
5.1.5 Females employed w/advanced degrees, % 9.9 70
5.2 Innovation linkages 20.2 67
5.2.1 University-industry RD collaboration†
54.4 30 ◆
5.2.2 State of cluster development and depth†
52.2 41
5.2.3 GERD financed by abroad, % GDP 0.0 83 ○
5.2.4 Joint venture/strategic alliance deals/bn PPP$ GDP 0.0 56
5.2.5 Patent families/bn PPP$ GDP 0.1 60
5.3 Knowledge absorption 46.4 18 ● ◆
5.3.1 Intellectual property payments, % total trade 1.7 18 ◆
5.3.2 High-tech imports, % total trade 14.2 14 ●
5.3.3 ICT services imports, % total trade 0.3 116 ○ ◇
5.3.4 FDI net inflows, % GDP 1.8 85
5.3.5 Research talent, % in businesses 60.8 10 ● ◆
Knowledge and technology outputs 29.7 40
6.1 Knowledge creation 22.9 47
6.1.1 Patents by origin/bn PPP$ GDP 0.6 75
6.1.2 PCT patents by origin/bn PPP$ GDP 0.1 57
6.1.3 Utility models by origin/bn PPP$ GDP 2.4 9 ● ◆
6.1.4 Scientific and technical articles/bn PPP$ GDP 8.9 93
6.1.5 Citable documents H-index 21.2 39
6.2 Knowledge impact 35.0 44
6.2.1 Labor productivity growth, % −0.1 66
6.2.2 New businesses/th pop. 15–64 1.1 80
6.2.3 Software spending, % GDP 0.2 55
6.2.4 ISO 9001 quality certificates/bn PPP$ GDP 6.8 39
6.2.5 High-tech manufacturing, % 45.1 17 ◆
6.3 Knowledge diffusion 31.2 33 ◆
6.3.1 Intellectual property receipts, % total trade 0.1 69
6.3.2 Production and export complexity 70.9 22 ◆
6.3.3 High-tech exports, % total trade 13.4 11 ● ◆
6.3.4 ICT services exports, % total trade 0.2 118 ○
Creative outputs 27.3 55
7.1 Intangible assets 30.2 68
7.1.1 Trademarks by origin/bn PPP$ GDP 24.2 85
7.1.2 Global brand value, top 5,000, % GDP 62.5 31
7.1.3 Industrial designs by origin/bn PPP$ GDP 2.6 41
7.1.4 ICTs and organizational model creation†
60.3 43 ◆
7.2 Creative goods and services 37.1 15 ● ◆
7.2.1 Cultural and creative services exports, % total trade n/a n/a
7.2.2 National feature films/mn pop. 15–69 1.5 74
7.2.3 Entertainment and media market/th pop. 15–69 10.7 35 ◆
7.2.4 Printing and other media, % manufacturing 0.8 71
7.2.5 Creative goods exports, % total trade 6.9 8 ● ◆
7.3 Online creativity 11.9 84
7.3.1 Generic top-level domains (TLDs)/th pop. 15–69 5.5 52
7.3.2 Country-code TLDs/th pop. 15–69 0.4 102
7.3.3 Wikipedia edits/mn pop. 15–69 39.3 86
7.3.4 Mobile app creation/bn PPP$ GDP 3.9 61
Score/
Value Rank
Institutions 64.2 64
1.1 Political environment 61.7 54
1.1.1 Political and operational stability* 67.9 71
1.1.2 Government effectiveness* 58.6 52
1.2 Regulatory environment 46.3 112 ○ ◇
1.2.1 Regulatory quality* 46.5 63
1.2.2 Rule of law* 49.4 57
1.2.3 Cost of redundancy dismissal 36.0 124 ○ ◇
1.3 Business environment 84.6 20 ◆
1.3.1 Ease of starting a business* 92.4 43
1.3.2 Ease of resolving insolvency* 76.8 22 ◆
Human capital and research 31.7 63
2.1 Education 42.4 86
2.1.1 Expenditure on education, % GDP 4.1 64
2.1.2 Government funding/pupil, secondary, % GDP/cap 18.0 59
2.1.3 School life expectancy, years 15.4 45
2.1.4 PISA scales in reading, maths and science 412.4 61
2.1.5 Pupil-teacher ratio, secondary 26.2 109 ○ ◇
2.2 Tertiary education 35.4 57
2.2.1 Tertiary enrolment, % gross 49.3 64
2.2.2 Graduates in science and engineering, % 27.9 25
2.2.3 Tertiary inbound mobility, % 1.3 85
2.3 Research and development (RD) 17.4 47
2.3.1 Researchers, FTE/mn pop. 1,350.3 48
2.3.2 Gross expenditure on RD, % GDP 1.0 39
2.3.3 Global corporate RD investors, top 3, mn US$ 0.0 41 ○ ◇
2.3.4 QS university ranking, top 3* 33.4 37
Infrastructure 43.0 61
3.1 Informationandcommunicationtechnologies(ICTs) 68.4 60
3.1.1 ICT access* 57.8 81
3.1.2 ICT use* 59.2 63
3.1.3 Government’s online service* 79.4 42
3.1.4 E-participation* 77.4 51
3.2 General infrastructure 33.1 48
3.2.1 Electricity output, GWh/mn pop. 2,738.5 69
3.2.2 Logistics performance* 63.3 31 ◆
3.2.3 Gross capital formation, % GDP 24.0 54
3.3 Ecological sustainability 27.6 68
3.3.1 GDP/unit of energy use 9.2 78
3.3.2 Environmental performance* 45.4 70
3.3.3 ISO 14001 environmental certificates/bn PPP$ GDP 2.4 35
Market sophistication 55.6 27 ◆
4.1 Credit 52.0 24 ◆
4.1.1 Ease of getting credit* 70.0 44
4.1.2 Domestic credit to private sector, % GDP 143.4 10 ● ◆
4.1.3 Microfinance gross loans, % GDP 0.0 81 ○
4.2 Investment 31.8 64
4.2.1 Ease of protecting minority investors* 86.0 3 ● ◆
4.2.2 Market capitalization, % GDP 108.0 11 ●
4.2.3 Venture capital investors, deals/bn PPP$ GDP 0.0 66
4.2.4 Venture capital recipients, deals/bn PPP$ GDP 0.0 85 ○
4.3 Trade, diversification, and market scale 83.1 19 ◆
4.3.1 Applied tariff rate, weighted avg., % 3.5 69
4.3.2 Domestic industry diversification 97.0 16 ●
4.3.3 Domestic market scale, bn PPP$ 1,261.5 21
NOTES: ● indicates a strength; ○ a weakness; ◆ an income group strength; ◇ an income group weakness; * an index; †
a survey question. indicates that
the
economy’s data are older than the base year; see appendices for details, including the year of the data, at http://globalinnovationindex.org. Square
brackets [ ] indicate
that the data minimum coverage (DMC) requirements were not met at the sub-pillar or pillar level.](https://image.slidesharecdn.com/e-220805033615-e8521670/75/E-INDEX-2021-pdf-177-2048.jpg)
![158 Global Innovation Index 2021
Togo GII 2021 rank
125
Output rank Input rank Income Region Population (mn) GDP, PPP$ (bn) GDP per capita, PPP$ GII 2020 rank
129 110 Low SSF 8.3 13.6 1,640 125
Score/
Value Rank
Business sophistication 13.5[128]
5.1 Knowledge workers 23.1 [91]
5.1.1 Knowledge-intensive employment, % 14.1 94 ◆
5.1.2 Firms offering formal training, % 33.7 44 ● ◆
5.1.3 GERD performed by business, % GDP n/a n/a
5.1.4 GERD financed by business, % n/a n/a
5.1.5 Females employed w/advanced degrees, % 0.9 114
5.2 Innovation linkages 3.0 [129]
5.2.1 University-industry RD collaboration†
n/a n/a
5.2.2 State of cluster development and depth†
n/a n/a
5.2.3 GERD financed by abroad, % GDP 0.0 73
5.2.4 Joint venture/strategic alliance deals/bn PPP$ GDP 0.0 66
5.2.5 Patent families/bn PPP$ GDP 0.0 100 ○ ◇
5.3 Knowledge absorption 14.3 122
5.3.1 Intellectual property payments, % total trade 0.0 113
5.3.2 High-tech imports, % total trade 5.1 111
5.3.3 ICT services imports, % total trade 0.8 87
5.3.4 FDI net inflows, % GDP 0.3 121
5.3.5 Research talent, % in businesses n/a n/a
Knowledge and technology outputs 6.1 128 ○ ◇
6.1 Knowledge creation 4.3 116
6.1.1 Patents by origin/bn PPP$ GDP 0.1 103
6.1.2 PCT patents by origin/bn PPP$ GDP 0.0 98 ○ ◇
6.1.3 Utility models by origin/bn PPP$ GDP 0.0 76 ○ ◇
6.1.4 Scientific and technical articles/bn PPP$ GDP 11.0 79
6.1.5 Citable documents H-index 1.7 129 ○ ◇
6.2 Knowledge impact 4.8 [127]
6.2.1 Labor productivity growth, % n/a n/a
6.2.2 New businesses/th pop. 15–64 0.6 92
6.2.3 Software spending, % GDP 0.1 94 ◆
6.2.4 ISO 9001 quality certificates/bn PPP$ GDP 1.9 89 ◆
6.2.5 High-tech manufacturing, % n/a n/a
6.3 Knowledge diffusion 9.1 98
6.3.1 Intellectual property receipts, % total trade 0.0 110 ○
6.3.2 Production and export complexity 25.8 101
6.3.3 High-tech exports, % total trade 0.0 126 ○ ◇
6.3.4 ICT services exports, % total trade 1.7 64 ●
Creative outputs 10.3 119
7.1 Intangible assets 8.3 130 ○ ◇
7.1.1 Trademarks by origin/bn PPP$ GDP 14.9 100
7.1.2 Global brand value, top 5,000, % GDP 26.8 46 ● ◆
7.1.3 Industrial designs by origin/bn PPP$ GDP 0.5 85
7.1.4 ICTs and organizational model creation†
n/a n/a
7.2 Creative goods and services 12.7 [71]
7.2.1 Cultural and creative services exports, % total trade 1.7 14 ● ◆
7.2.2 National feature films/mn pop. 15–69 0.7 93
7.2.3 Entertainment and media market/th pop. 15–69 n/a n/a
7.2.4 Printing and other media, % manufacturing n/a n/a
7.2.5 Creative goods exports, % total trade 0.0 113
7.3 Online creativity 11.7 85 ◆
7.3.1 Generic top-level domains (TLDs)/th pop. 15–69 0.6 104 ◆
7.3.2 Country-code TLDs/th pop. 15–69 0.1 117
7.3.3 Wikipedia edits/mn pop. 15–69 36.4 92 ◆
7.3.4 Mobile app creation/bn PPP$ GDP n/a n/a
Score/
Value Rank
Institutions 57.1 87
1.1 Political environment 41.0 115
1.1.1 Political and operational stability* 62.5 89
1.1.2 Government effectiveness* 30.3 123
1.2 Regulatory environment 59.1 81
1.2.1 Regulatory quality* 25.7 111
1.2.2 Rule of law* 31.2 103
1.2.3 Cost of redundancy dismissal 13.1 47 ●
1.3 Business environment 71.1 67 ◆
1.3.1 Ease of starting a business* 95.1 14 ● ◆
1.3.2 Ease of resolving insolvency* 47.0 80
Human capital and research 17.5 110
2.1 Education 41.7 88
2.1.1 Expenditure on education, % GDP 5.4 25 ● ◆
2.1.2 Government funding/pupil, secondary, % GDP/cap 15.3 75
2.1.3 School life expectancy, years 12.7 85 ◆
2.1.4 PISA scales in reading, maths and science n/a n/a
2.1.5 Pupil-teacher ratio, secondary 26.2 108
2.2 Tertiary education 9.3 [114]
2.2.1 Tertiary enrolment, % gross 14.0 105
2.2.2 Graduates in science and engineering, % n/a n/a
2.2.3 Tertiary inbound mobility, % n/a n/a
2.3 Research and development (RD) 1.4 102
2.3.1 Researchers, FTE/mn pop. 48.1 94
2.3.2 Gross expenditure on RD, % GDP 0.3 86
2.3.3 Global corporate RD investors, top 3, mn US$ 0.0 41 ○ ◇
2.3.4 QS university ranking, top 3* 0.0 74 ○ ◇
Infrastructure 27.5 110
3.1 Informationandcommunicationtechnologies(ICTs) 38.4 113 ◆
3.1.1 ICT access* 34.3 118
3.1.2 ICT use* 18.0 116
3.1.3 Government’s online service* 50.0 106
3.1.4 E-participation* 51.2 99
3.2 General infrastructure 31.5 54 ●
3.2.1 Electricity output, GWh/mn pop. 50.2 122 ○
3.2.2 Logistics performance* 18.6 110
3.2.3 Gross capital formation, % GDP 38.3 8 ●
3.3 Ecological sustainability 12.7 132 ○
3.3.1 GDP/unit of energy use 4.0 119
3.3.2 Environmental performance* 29.5 122
3.3.3 ISO 14001 environmental certificates/bn PPP$ GDP 0.6 79 ◆
Market sophistication 36.9 112
4.1 Credit 40.2 69
4.1.1 Ease of getting credit* 70.0 44 ●
4.1.2 Domestic credit to private sector, % GDP 35.1 88 ◆
4.1.3 Microfinance gross loans, % GDP 2.0 12 ●
4.2 Investment 42.0 [28]
4.2.1 Ease of protecting minority investors* 42.0 102
4.2.2 Market capitalization, % GDP n/a n/a
4.2.3 Venture capital investors, deals/bn PPP$ GDP n/a n/a
4.2.4 Venture capital recipients, deals/bn PPP$ GDP n/a n/a
4.3 Trade, diversification, and market scale 28.5 131 ○ ◇
4.3.1 Applied tariff rate, weighted avg., % 11.0 122 ◇
4.3.2 Domestic industry diversification n/a n/a
4.3.3 Domestic market scale, bn PPP$ 13.6 130 ○ ◇
NOTES: ● indicates a strength; ○ a weakness; ◆ an income group strength; ◇ an income group weakness; * an index; †
a survey question. indicates that
the
economy’s data are older than the base year; see appendices for details, including the year of the data, at http://globalinnovationindex.org. Square
brackets [ ] indicate
that the data minimum coverage (DMC) requirements were not met at the sub-pillar or pillar level.](https://image.slidesharecdn.com/e-220805033615-e8521670/75/E-INDEX-2021-pdf-178-2048.jpg)
![159
GII 2021 Economy profiles
Trinidad and Tobago GII 2021 rank
97
Output rank Input rank Income Region Population (mn) GDP, PPP$ (bn) GDP per capita, PPP$ GII 2020 rank
95 97 High LCN 1.4 36.4 25,964 98
Score/
Value Rank
Business sophistication 18.3 104 ◇
5.1 Knowledge workers 25.1 85 ◇
5.1.1 Knowledge-intensive employment, % 29.8 49 ●
5.1.2 Firms offering formal training, % 28.0 55
5.1.3 GERD performed by business, % GDP 0.0 86 ○ ◇
5.1.4 GERD financed by business, % 13.6 73 ◇
5.1.5 Females employed w/advanced degrees, % 12.8 57 ●
5.2 Innovation linkages 15.9 104 ◇
5.2.1 University-industry RD collaboration†
33.3 99 ◇
5.2.2 State of cluster development and depth†
43.0 86 ◇
5.2.3 GERD financed by abroad, % GDP 0.0 66
5.2.4 Joint venture/strategic alliance deals/bn PPP$ GDP 0.0 58 ●
5.2.5 Patent families/bn PPP$ GDP 0.0 77
5.3 Knowledge absorption 14.1 123 ○ ◇
5.3.1 Intellectual property payments, % total trade 0.6 65
5.3.2 High-tech imports, % total trade 6.5 88
5.3.3 ICT services imports, % total trade 0.5 105 ◇
5.3.4 FDI net inflows, % GDP −1.4 125 ○
5.3.5 Research talent, % in businesses 1.4 77 ◇
Knowledge and technology outputs 15.8 83 ◇
6.1 Knowledge creation 3.5 119 ◇
6.1.1 Patents by origin/bn PPP$ GDP 0.0 124 ○
6.1.2 PCT patents by origin/bn PPP$ GDP 0.0 84
6.1.3 Utility models by origin/bn PPP$ GDP 0.0 65
6.1.4 Scientific and technical articles/bn PPP$ GDP 6.7 104 ◇
6.1.5 Citable documents H-index 4.9 106 ◇
6.2 Knowledge impact 33.0 [54]
6.2.1 Labor productivity growth, % 0.5 56
6.2.2 New businesses/th pop. 15–64 n/a n/a
6.2.3 Software spending, % GDP n/a n/a
6.2.4 ISO 9001 quality certificates/bn PPP$ GDP 2.2 85 ◇
6.2.5 High-tech manufacturing, % n/a n/a
6.3 Knowledge diffusion 10.9 92 ◇
6.3.1 Intellectual property receipts, % total trade 0.0 81
6.3.2 Production and export complexity 45.1 58 ◇
6.3.3 High-tech exports, % total trade 2.0 59 ●
6.3.4 ICT services exports, % total trade 0.2 123 ○
Creative outputs 15.6 103 ◇
7.1 Intangible assets 19.5 102 ◇
7.1.1 Trademarks by origin/bn PPP$ GDP 22.4 89 ◇
7.1.2 Global brand value, top 5,000, % GDP 0.0 80 ○ ◇
7.1.3 Industrial designs by origin/bn PPP$ GDP 0.5 84
7.1.4 ICTs and organizational model creation†
49.8 83 ◇
7.2 Creative goods and services 1.5 [122]
7.2.1 Cultural and creative services exports, % total trade 0.0 97 ◇
7.2.2 National feature films/mn pop. 15–69 n/a n/a
7.2.3 Entertainment and media market/th pop. 15–69 n/a n/a
7.2.4 Printing and other media, % manufacturing n/a n/a
7.2.5 Creative goods exports, % total trade 0.1 89
7.3 Online creativity 21.9 54 ● ◇
7.3.1 Generic top-level domains (TLDs)/th pop. 15–69 4.2 58 ●
7.3.2 Country-code TLDs/th pop. 15–69 1.5 75 ◇
7.3.3 Wikipedia edits/mn pop. 15–69 58.8 55 ●
7.3.4 Mobile app creation/bn PPP$ GDP n/a n/a
Score/
Value Rank
Institutions 62.0 72 ◇
1.1 Political environment 59.1 60 ● ◇
1.1.1 Political and operational stability* 71.4 54 ● ◇
1.1.2 Government effectiveness* 52.9 64 ◇
1.2 Regulatory environment 58.4 84 ◇
1.2.1 Regulatory quality* 39.6 80 ◇
1.2.2 Rule of law* 43.6 69 ◇
1.2.3 Cost of redundancy dismissal 20.5 87
1.3 Business environment 68.5 74 ◇
1.3.1 Ease of starting a business* 88.6 64
1.3.2 Ease of resolving insolvency* 48.4 75 ◇
Human capital and research 19.2[100]
2.1 Education 36.3 [101]
2.1.1 Expenditure on education, % GDP n/a n/a
2.1.2 Government funding/pupil, secondary, % GDP/cap n/a n/a
2.1.3 School life expectancy, years n/a n/a
2.1.4 PISA scales in reading, maths and science 423.0 54 ◇
2.1.5 Pupil-teacher ratio, secondary n/a n/a
2.2 Tertiary education n/a [n/a]
2.2.1 Tertiary enrolment, % gross n/a n/a
2.2.2 Graduates in science and engineering, % n/a n/a
2.2.3 Tertiary inbound mobility, % n/a n/a
2.3 Research and development (RD) 2.0 94 ◇
2.3.1 Researchers, FTE/mn pop. 567.0 64 ◇
2.3.2 Gross expenditure on RD, % GDP 0.1 108 ○ ◇
2.3.3 Global corporate RD investors, top 3, mn US$ 0.0 41 ○ ◇
2.3.4 QS university ranking, top 3* 0.0 74 ○ ◇
Infrastructure 33.8 90 ◇
3.1 Informationandcommunicationtechnologies(ICTs) 64.1 71 ◇
3.1.1 ICT access* 77.7 41 ●
3.1.2 ICT use* 55.6 70 ◇
3.1.3 Government’s online service* 61.2 86 ◇
3.1.4 E-participation* 61.9 84 ◇
3.2 General infrastructure 20.6 106 ◇
3.2.1 Electricity output, GWh/mn pop. 6,636.7 31 ●
3.2.2 Logistics performance* 17.1 113 ◇
3.2.3 Gross capital formation, % GDP n/a n/a
3.3 Ecological sustainability 16.8 117 ◇
3.3.1 GDP/unit of energy use 2.5 124 ○ ◇
3.3.2 Environmental performance* 47.5 63 ◇
3.3.3 ISO 14001 environmental certificates/bn PPP$ GDP 0.5 86 ◇
Market sophistication 35.8 119 ◇
4.1 Credit 32.0 100 ◇
4.1.1 Ease of getting credit* 65.0 61
4.1.2 Domestic credit to private sector, % GDP 40.1 82 ◇
4.1.3 Microfinance gross loans, % GDP 0.0 76 ○
4.2 Investment 34.8 [50]
4.2.1 Ease of protecting minority investors* 64.0 56 ●
4.2.2 Market capitalization, % GDP n/a n/a
4.2.3 Venture capital investors, deals/bn PPP$ GDP 0.0 51
4.2.4 Venture capital recipients, deals/bn PPP$ GDP n/a n/a
4.3 Trade, diversification, and market scale 40.5 124 ○ ◇
4.3.1 Applied tariff rate, weighted avg., % 8.6 107 ◇
4.3.2 Domestic industry diversification n/a n/a
4.3.3 Domestic market scale, bn PPP$ 36.4 114 ◇
NOTES: ● indicates a strength; ○ a weakness; ◆ an income group strength; ◇ an income group weakness; * an index; †
a survey question. indicates that
the
economy’s data are older than the base year; see appendices for details, including the year of the data, at http://globalinnovationindex.org. Square
brackets [ ] indicate
that the data minimum coverage (DMC) requirements were not met at the sub-pillar or pillar level.](https://image.slidesharecdn.com/e-220805033615-e8521670/75/E-INDEX-2021-pdf-179-2048.jpg)
![160 Global Innovation Index 2021
Tunisia GII 2021 rank
71
Output rank Input rank Income Region Population (mn) GDP, PPP$ (bn) GDP per capita, PPP$ GII 2020 rank
64 78 Lower middle NAWA 11.8 123.6 10,382 65
Score/
Value Rank
Business sophistication 16.5 114 ○
5.1 Knowledge workers 19.6 102
5.1.1 Knowledge-intensive employment, % 20.9 78
5.1.2 Firms offering formal training, % 19.1 80
5.1.3 GERD performed by business, % GDP 0.1 59
5.1.4 GERD financed by business, % 18.9 67
5.1.5 Females employed w/advanced degrees, % 8.8 75
5.2 Innovation linkages 13.9 114 ○
5.2.1 University-industry RD collaboration†
32.8 103
5.2.2 State of cluster development and depth†
39.0 105
5.2.3 GERD financed by abroad, % GDP 0.0 62
5.2.4 Joint venture/strategic alliance deals/bn PPP$ GDP 0.0 98
5.2.5 Patent families/bn PPP$ GDP 0.0 70
5.3 Knowledge absorption 16.1 113 ○
5.3.1 Intellectual property payments, % total trade 0.1 106 ○
5.3.2 High-tech imports, % total trade 9.3 41
5.3.3 ICT services imports, % total trade 0.4 110 ○
5.3.4 FDI net inflows, % GDP 2.2 75
5.3.5 Research talent, % in businesses 5.2 71
Knowledge and technology outputs 24.0 55 ◆
6.1 Knowledge creation 24.2 38 ● ◆
6.1.1 Patents by origin/bn PPP$ GDP 1.4 52
6.1.2 PCT patents by origin/bn PPP$ GDP 0.0 81
6.1.3 Utility models by origin/bn PPP$ GDP n/a n/a
6.1.4 Scientific and technical articles/bn PPP$ GDP 40.9 18 ● ◆
6.1.5 Citable documents H-index 11.2 68
6.2 Knowledge impact 29.7 63
6.2.1 Labor productivity growth, % −1.4 93
6.2.2 New businesses/th pop. 15–64 1.7 60
6.2.3 Software spending, % GDP 0.3 35 ● ◆
6.2.4 ISO 9001 quality certificates/bn PPP$ GDP 8.6 32 ● ◆
6.2.5 High-tech manufacturing, % 24.3 51
6.3 Knowledge diffusion 18.0 60
6.3.1 Intellectual property receipts, % total trade 0.1 56
6.3.2 Production and export complexity 51.6 46 ◆
6.3.3 High-tech exports, % total trade 4.0 40 ●
6.3.4 ICT services exports, % total trade 1.2 76
Creative outputs 20.6 [80]
7.1 Intangible assets 30.5 [65]
7.1.1 Trademarks by origin/bn PPP$ GDP n/a n/a
7.1.2 Global brand value, top 5,000, % GDP n/a n/a
7.1.3 Industrial designs by origin/bn PPP$ GDP 1.3 61
7.1.4 ICTs and organizational model creation†
42.7 105 ○
7.2 Creative goods and services 12.9 [70]
7.2.1 Cultural and creative services exports, % total trade n/a n/a
7.2.2 National feature films/mn pop. 15–69 1.4 77
7.2.3 Entertainment and media market/th pop. 15–69 1.2 57 ○
7.2.4 Printing and other media, % manufacturing n/a n/a
7.2.5 Creative goods exports, % total trade 2.0 30 ●
7.3 Online creativity 8.3 107
7.3.1 Generic top-level domains (TLDs)/th pop. 15–69 2.8 67 ◆
7.3.2 Country-code TLDs/th pop. 15–69 1.7 73
7.3.3 Wikipedia edits/mn pop. 15–69 31.1 100
7.3.4 Mobile app creation/bn PPP$ GDP 0.1 87 ○
Score/
Value Rank
Institutions 61.4 75 ◆
1.1 Political environment 53.1 84
1.1.1 Political and operational stability* 62.5 89
1.1.2 Government effectiveness* 48.4 80 ◆
1.2 Regulatory environment 56.7 90
1.2.1 Regulatory quality* 32.1 101
1.2.2 Rule of law* 48.4 60 ◆
1.2.3 Cost of redundancy dismissal 21.6 92
1.3 Business environment 74.4 54 ◆
1.3.1 Ease of starting a business* 94.6 18 ● ◆
1.3.2 Ease of resolving insolvency* 54.2 64
Human capital and research 42.7 35 ● ◆
2.1 Education 71.2 8 ● ◆
2.1.1 Expenditure on education, % GDP 6.6 7 ● ◆
2.1.2 Government funding/pupil, secondary, % GDP/cap 52.4 1 ● ◆
2.1.3 School life expectancy, years 15.1 50 ◆
2.1.4 PISA scales in reading, maths and science 371.4 74 ○
2.1.5 Pupil-teacher ratio, secondary 13.6 64
2.2 Tertiary education 48.6 16 ● ◆
2.2.1 Tertiary enrolment, % gross 31.8 82
2.2.2 Graduates in science and engineering, % 43.3 2 ● ◆
2.2.3 Tertiary inbound mobility, % 2.2 75
2.3 Research and development (RD) 8.2 65
2.3.1 Researchers, FTE/mn pop. 1,771.6 42 ◆
2.3.2 Gross expenditure on RD, % GDP 0.6 58 ◆
2.3.3 Global corporate RD investors, top 3, mn US$ 0.0 41 ○ ◇
2.3.4 QS university ranking, top 3* 0.0 74 ○ ◇
Infrastructure 34.2 89
3.1 Informationandcommunicationtechnologies(ICTs) 61.7 78 ◆
3.1.1 ICT access* 61.5 73 ◆
3.1.2 ICT use* 53.8 74 ◆
3.1.3 Government’s online service* 62.4 83
3.1.4 E-participation* 69.0 73
3.2 General infrastructure 11.0 128 ○ ◇
3.2.1 Electricity output, GWh/mn pop. 1,816.7 85
3.2.2 Logistics performance* 24.3 100
3.2.3 Gross capital formation, % GDP 10.3 124 ○ ◇
3.3 Ecological sustainability 30.0 58 ◆
3.3.1 GDP/unit of energy use 12.0 50
3.3.2 Environmental performance* 46.7 65 ◆
3.3.3 ISO 14001 environmental certificates/bn PPP$ GDP 1.9 45 ◆
Market sophistication 40.7 98
4.1 Credit 35.9 83
4.1.1 Ease of getting credit* 50.0 94
4.1.2 Domestic credit to private sector, % GDP 86.6 34 ● ◆
4.1.3 Microfinance gross loans, % GDP 0.5 34
4.2 Investment 22.3 103
4.2.1 Ease of protecting minority investors* 62.0 60
4.2.2 Market capitalization, % GDP 21.8 57
4.2.3 Venture capital investors, deals/bn PPP$ GDP 0.0 47
4.2.4 Venture capital recipients, deals/bn PPP$ GDP 0.0 37
4.3 Trade, diversification, and market scale 63.9 78
4.3.1 Applied tariff rate, weighted avg., % 9.4 113 ○
4.3.2 Domestic industry diversification 88.5 56
4.3.3 Domestic market scale, bn PPP$ 123.6 78
NOTES: ● indicates a strength; ○ a weakness; ◆ an income group strength; ◇ an income group weakness; * an index; †
a survey question. indicates that
the
economy’s data are older than the base year; see appendices for details, including the year of the data, at http://globalinnovationindex.org. Square
brackets [ ] indicate
that the data minimum coverage (DMC) requirements were not met at the sub-pillar or pillar level.](https://image.slidesharecdn.com/e-220805033615-e8521670/75/E-INDEX-2021-pdf-180-2048.jpg)
![161
GII 2021 Economy profiles
Turkey GII 2021 rank
41
Output rank Input rank Income Region Population (mn) GDP, PPP$ (bn) GDP per capita, PPP$ GII 2020 rank
41 45 Upper middle NAWA 84.3 2,381.6 28,294 51
Score/
Value Rank
Business sophistication 30.8 46
5.1 Knowledge workers 37.3 49
5.1.1 Knowledge-intensive employment, % 22.8 69
5.1.2 Firms offering formal training, % 30.7 50
5.1.3 GERD performed by business, % GDP 0.7 33
5.1.4 GERD financed by business, % 56.3 18 ◆
5.1.5 Females employed w/advanced degrees, % 10.1 69
5.2 Innovation linkages 18.4 79
5.2.1 University-industry RD collaboration†
43.3 62
5.2.2 State of cluster development and depth†
49.7 48
5.2.3 GERD financed by abroad, % GDP 0.0 71
5.2.4 Joint venture/strategic alliance deals/bn PPP$ GDP 0.0 115 ○
5.2.5 Patent families/bn PPP$ GDP 0.4 33 ◆
5.3 Knowledge absorption 36.8 36
5.3.1 Intellectual property payments, % total trade 0.8 56
5.3.2 High-tech imports, % total trade 7.8 62
5.3.3 ICT services imports, % total trade 0.9 84
5.3.4 FDI net inflows, % GDP 1.4 100 ○
5.3.5 Research talent, % in businesses 61.8 9 ● ◆
Knowledge and technology outputs 25.3 50
6.1 Knowledge creation 25.6 37
6.1.1 Patents by origin/bn PPP$ GDP 3.4 24
6.1.2 PCT patents by origin/bn PPP$ GDP 0.7 31
6.1.3 Utility models by origin/bn PPP$ GDP 1.2 20
6.1.4 Scientific and technical articles/bn PPP$ GDP 16.0 52
6.1.5 Citable documents H-index 28.3 35 ◆
6.2 Knowledge impact 36.0 38
6.2.1 Labor productivity growth, % 3.6 12 ● ◆
6.2.2 New businesses/th pop. 15–64 1.6 65
6.2.3 Software spending, % GDP 0.5 20 ◆
6.2.4 ISO 9001 quality certificates/bn PPP$ GDP 3.3 70
6.2.5 High-tech manufacturing, % 23.5 55
6.3 Knowledge diffusion 14.3 73
6.3.1 Intellectual property receipts, % total trade 0.0 76
6.3.2 Production and export complexity 58.7 40
6.3.3 High-tech exports, % total trade 1.8 61
6.3.4 ICT services exports, % total trade 0.7 94
Creative outputs 35.3 35 ◆
7.1 Intangible assets 50.2 18 ● ◆
7.1.1 Trademarks by origin/bn PPP$ GDP 100.6 6 ● ◆
7.1.2 Global brand value, top 5,000, % GDP 27.9 45
7.1.3 Industrial designs by origin/bn PPP$ GDP 15.9 5 ● ◆
7.1.4 ICTs and organizational model creation†
44.2 100 ○
7.2 Creative goods and services 16.7 61
7.2.1 Cultural and creative services exports, % total trade 0.1 82
7.2.2 National feature films/mn pop. 15–69 2.6 62
7.2.3 Entertainment and media market/th pop. 15–69 5.0 47 ○
7.2.4 Printing and other media, % manufacturing 0.7 75 ○
7.2.5 Creative goods exports, % total trade 3.1 19 ●
7.3 Online creativity 23.9 50
7.3.1 Generic top-level domains (TLDs)/th pop. 15–69 11.4 36 ◆
7.3.2 Country-code TLDs/th pop. 15–69 2.2 68
7.3.3 Wikipedia edits/mn pop. 15–69 52.8 61
7.3.4 Mobile app creation/bn PPP$ GDP 29.0 18 ◆
Score/
Value Rank
Institutions 56.0 93
1.1 Political environment 55.3 75
1.1.1 Political and operational stability* 62.5 89
1.1.2 Government effectiveness* 51.7 70
1.2 Regulatory environment 49.1 109 ○
1.2.1 Regulatory quality* 43.3 72
1.2.2 Rule of law* 39.3 78
1.2.3 Cost of redundancy dismissal 29.8 118 ○
1.3 Business environment 63.6 91
1.3.1 Ease of starting a business* 88.8 62
1.3.2 Ease of resolving insolvency* 38.5 104 ○
Human capital and research 48.5 26 ◆
2.1 Education 73.0 [6]
2.1.1 Expenditure on education, % GDP n/a n/a
2.1.2 Government funding/pupil, secondary, % GDP/cap n/a n/a
2.1.3 School life expectancy, years 18.2 11 ● ◆
2.1.4 PISA scales in reading, maths and science 462.5 41
2.1.5 Pupil-teacher ratio, secondary 16.4 80
2.2 Tertiary education 44.0 24 ◆
2.2.1 Tertiary enrolment, % gross 113.2 2 ● ◆
2.2.2 Graduates in science and engineering, % 19.4 75
2.2.3 Tertiary inbound mobility, % 1.7 80
2.3 Research and development (RD) 28.4 38 ◆
2.3.1 Researchers, FTE/mn pop. 1,624.3 43
2.3.2 Gross expenditure on RD, % GDP 1.1 36 ◆
2.3.3 Global corporate RD investors, top 3, mn US$ 50.2 29 ◆
2.3.4 QS university ranking, top 3* 23.1 45
Infrastructure 47.0 48
3.1 Informationandcommunicationtechnologies(ICTs) 75.4 47
3.1.1 ICT access* 67.3 66
3.1.2 ICT use* 59.1 64
3.1.3 Government’s online service* 85.9 22 ◆
3.1.4 E-participation* 89.3 23 ◆
3.2 General infrastructure 34.4 42 ◆
3.2.1 Electricity output, GWh/mn pop. 3,744.2 57
3.2.2 Logistics performance* 51.0 46 ◆
3.2.3 Gross capital formation, % GDP 28.2 26
3.3 Ecological sustainability 31.2 54
3.3.1 GDP/unit of energy use 15.8 19 ● ◆
3.3.2 Environmental performance* 42.6 84
3.3.3 ISO 14001 environmental certificates/bn PPP$ GDP 1.1 66
Market sophistication 49.7 49
4.1 Credit 40.4 68
4.1.1 Ease of getting credit* 75.0 34
4.1.2 Domestic credit to private sector, % GDP 65.4 51
4.1.3 Microfinance gross loans, % GDP 0.0 77 ○
4.2 Investment 21.6 105 ○
4.2.1 Ease of protecting minority investors* 76.0 21
4.2.2 Market capitalization, % GDP 23.3 55
4.2.3 Venture capital investors, deals/bn PPP$ GDP 0.0 85 ○
4.2.4 Venture capital recipients, deals/bn PPP$ GDP 0.0 83 ○
4.3 Trade, diversification, and market scale 87.0 10 ● ◆
4.3.1 Applied tariff rate, weighted avg., % 3.1 63
4.3.2 Domestic industry diversification 99.2 4 ●
4.3.3 Domestic market scale, bn PPP$ 2,381.6 13 ● ◆
NOTES: ● indicates a strength; ○ a weakness; ◆ an income group strength; ◇ an income group weakness; * an index; †
a survey question. indicates that
the
economy’s data are older than the base year; see appendices for details, including the year of the data, at http://globalinnovationindex.org. Square
brackets [ ] indicate
that the data minimum coverage (DMC) requirements were not met at the sub-pillar or pillar level.](https://image.slidesharecdn.com/e-220805033615-e8521670/75/E-INDEX-2021-pdf-181-2048.jpg)
![162 Global Innovation Index 2021
Uganda GII 2021 rank
119
Output rank Input rank Income Region Population (mn) GDP, PPP$ (bn) GDP per capita, PPP$ GII 2020 rank
122 119 Low SSF 45.7 106.6 2,585 114
Score/
Value Rank
Business sophistication 16.1 118
5.1 Knowledge workers 12.4 120
5.1.1 Knowledge-intensive employment, % 10.3 109
5.1.2 Firms offering formal training, % 34.7 42 ● ◆
5.1.3 GERD performed by business, % GDP 0.0 89 ○ ◇
5.1.4 GERD financed by business, % 3.4 87 ◆
5.1.5 Females employed w/advanced degrees, % 0.1 124 ○ ◇
5.2 Innovation linkages 22.6 56 ●
5.2.1 University-industry RD collaboration†
43.1 63 ●
5.2.2 State of cluster development and depth†
43.3 84
5.2.3 GERD financed by abroad, % GDP 0.1 45 ●
5.2.4 Joint venture/strategic alliance deals/bn PPP$ GDP 0.0 96
5.2.5 Patent families/bn PPP$ GDP n/a n/a
5.3 Knowledge absorption 13.5 125 ◇
5.3.1 Intellectual property payments, % total trade 0.3 84
5.3.2 High-tech imports, % total trade 6.1 95
5.3.3 ICT services imports, % total trade 0.3 123 ◇
5.3.4 FDI net inflows, % GDP 3.1 43 ●
5.3.5 Research talent, % in businesses 4.0 74
Knowledge and technology outputs 11.9 105
6.1 Knowledge creation 9.1 86
6.1.1 Patents by origin/bn PPP$ GDP 0.1 118
6.1.2 PCT patents by origin/bn PPP$ GDP 0.0 95 ◆
6.1.3 Utility models by origin/bn PPP$ GDP n/a n/a
6.1.4 Scientific and technical articles/bn PPP$ GDP 13.8 65 ●
6.1.5 Citable documents H-index 10.6 72 ◆
6.2 Knowledge impact 19.3 109
6.2.1 Labor productivity growth, % 0.9 49 ●
6.2.2 New businesses/th pop. 15–64 0.9 86
6.2.3 Software spending, % GDP 0.0 121 ○ ◇
6.2.4 ISO 9001 quality certificates/bn PPP$ GDP 1.1 106
6.2.5 High-tech manufacturing, % n/a n/a
6.3 Knowledge diffusion 7.3 107
6.3.1 Intellectual property receipts, % total trade 0.1 50 ● ◆
6.3.2 Production and export complexity 32.4 85 ◆
6.3.3 High-tech exports, % total trade 0.3 102
6.3.4 ICT services exports, % total trade 0.3 110
Creative outputs 9.0 126
7.1 Intangible assets 15.6 117
7.1.1 Trademarks by origin/bn PPP$ GDP 15.2 99
7.1.2 Global brand value, top 5,000, % GDP 0.0 80 ○ ◇
7.1.3 Industrial designs by origin/bn PPP$ GDP 0.3 99
7.1.4 ICTs and organizational model creation†
42.7 104
7.2 Creative goods and services 1.0 [127]
7.2.1 Cultural and creative services exports, % total trade 0.0 96
7.2.2 National feature films/mn pop. 15–69 n/a n/a
7.2.3 Entertainment and media market/th pop. 15–69 n/a n/a
7.2.4 Printing and other media, % manufacturing n/a n/a
7.2.5 Creative goods exports, % total trade 0.1 103
7.3 Online creativity 3.7 128 ○
7.3.1 Generic top-level domains (TLDs)/th pop. 15–69 0.2 116
7.3.2 Country-code TLDs/th pop. 15–69 0.1 120
7.3.3 Wikipedia edits/mn pop. 15–69 15.6 128 ○
7.3.4 Mobile app creation/bn PPP$ GDP n/a n/a
Score/
Value Rank
Institutions 56.5 89
1.1 Political environment 44.7 105
1.1.1 Political and operational stability* 58.9 100
1.1.2 Government effectiveness* 37.6 104
1.2 Regulatory environment 67.4 59 ● ◆
1.2.1 Regulatory quality* 33.7 96
1.2.2 Rule of law* 38.4 80
1.2.3 Cost of redundancy dismissal 8.7 18 ● ◆
1.3 Business environment 57.5 111
1.3.1 Ease of starting a business* 71.4 123 ◇
1.3.2 Ease of resolving insolvency* 43.6 89
Human capital and research 8.1 131 ○ ◇
2.1 Education 11.5 [131]
2.1.1 Expenditure on education, % GDP 2.1 111 ○ ◇
2.1.2 Government funding/pupil, secondary, % GDP/cap n/a n/a
2.1.3 School life expectancy, years n/a n/a
2.1.4 PISA scales in reading, maths and science n/a n/a
2.1.5 Pupil-teacher ratio, secondary n/a n/a
2.2 Tertiary education 12.0 110
2.2.1 Tertiary enrolment, % gross 4.8 124 ○
2.2.2 Graduates in science and engineering, % n/a n/a
2.2.3 Tertiary inbound mobility, % 10.7 18 ● ◆
2.3 Research and development (RD) 0.7 107
2.3.1 Researchers, FTE/mn pop. 27.8 103
2.3.2 Gross expenditure on RD, % GDP 0.1 98
2.3.3 Global corporate RD investors, top 3, mn US$ 0.0 41 ○ ◇
2.3.4 QS university ranking, top 3* 0.0 74 ○ ◇
Infrastructure 30.0 103
3.1 Informationandcommunicationtechnologies(ICTs) 40.0 109 ◆
3.1.1 ICT access* 25.4 127 ○
3.1.2 ICT use* 19.2 115 ◆
3.1.3 Government’s online service* 58.2 90 ◆
3.1.4 E-participation* 57.1 91 ◆
3.2 General infrastructure 31.1 56 ●
3.2.1 Electricity output, GWh/mn pop. n/a n/a
3.2.2 Logistics performance* 24.6 98
3.2.3 Gross capital formation, % GDP 26.9 33 ●
3.3 Ecological sustainability 18.9 109
3.3.1 GDP/unit of energy use n/a n/a
3.3.2 Environmental performance* 35.6 101
3.3.3 ISO 14001 environmental certificates/bn PPP$ GDP 0.4 91
Market sophistication 37.2 111
4.1 Credit 30.5 104
4.1.1 Ease of getting credit* 60.0 74
4.1.2 Domestic credit to private sector, % GDP 13.9 122
4.1.3 Microfinance gross loans, % GDP 1.4 23 ●
4.2 Investment 32.2 [62]
4.2.1 Ease of protecting minority investors* 56.0 82 ◆
4.2.2 Market capitalization, % GDP n/a n/a
4.2.3 Venture capital investors, deals/bn PPP$ GDP n/a n/a
4.2.4 Venture capital recipients, deals/bn PPP$ GDP 0.0 52
4.3 Trade, diversification, and market scale 49.0 117
4.3.1 Applied tariff rate, weighted avg., % 8.1 103
4.3.2 Domestic industry diversification n/a n/a
4.3.3 Domestic market scale, bn PPP$ 106.6 81 ◆
NOTES: ● indicates a strength; ○ a weakness; ◆ an income group strength; ◇ an income group weakness; * an index; †
a survey question. indicates that
the
economy’s data are older than the base year; see appendices for details, including the year of the data, at http://globalinnovationindex.org. Square
brackets [ ] indicate
that the data minimum coverage (DMC) requirements were not met at the sub-pillar or pillar level.](https://image.slidesharecdn.com/e-220805033615-e8521670/75/E-INDEX-2021-pdf-182-2048.jpg)
![163
GII 2021 Economy profiles
Ukraine GII 2021 rank
49
Output rank Input rank Income Region Population (mn) GDP, PPP$ (bn) GDP per capita, PPP$ GII 2020 rank
37 76 Lower middle EUR 43.7 527.9 12,710 45
Score/
Value Rank
Business sophistication 28.9 53 ◆
5.1 Knowledge workers 38.9 45 ◆
5.1.1 Knowledge-intensive employment, % 37.5 32 ◆
5.1.2 Firms offering formal training, % 24.3 64
5.1.3 GERD performed by business, % GDP 0.3 49 ◆
5.1.4 GERD financed by business, % 30.5 59
5.1.5 Females employed w/advanced degrees, % 30.2 2 ● ◆
5.2 Innovation linkages 18.0 84
5.2.1 University-industry RD collaboration†
42.3 67
5.2.2 State of cluster development and depth†
40.3 100
5.2.3 GERD financed by abroad, % GDP 0.1 38
5.2.4 Joint venture/strategic alliance deals/bn PPP$ GDP 0.0 116 ○
5.2.5 Patent families/bn PPP$ GDP 0.2 47 ◆
5.3 Knowledge absorption 29.7 59
5.3.1 Intellectual property payments, % total trade 0.8 46
5.3.2 High-tech imports, % total trade 9.9 36
5.3.3 ICT services imports, % total trade 1.0 78
5.3.4 FDI net inflows, % GDP 3.6 36
5.3.5 Research talent, % in businesses 27.3 45
Knowledge and technology outputs 32.3 33 ◆
6.1 Knowledge creation 35.7 27 ◆
6.1.1 Patents by origin/bn PPP$ GDP 3.7 22 ◆
6.1.2 PCT patents by origin/bn PPP$ GDP 0.3 46 ◆
6.1.3 Utility models by origin/bn PPP$ GDP 14.9 1 ● ◆
6.1.4 Scientific and technical articles/bn PPP$ GDP 9.1 90
6.1.5 Citable documents H-index 17.0 51 ◆
6.2 Knowledge impact 31.4 61 ◆
6.2.1 Labor productivity growth, % 0.7 54
6.2.2 New businesses/th pop. 15–64 1.7 61
6.2.3 Software spending, % GDP 0.5 17 ● ◆
6.2.4 ISO 9001 quality certificates/bn PPP$ GDP 3.3 72
6.2.5 High-tech manufacturing, % 18.4 65
6.3 Knowledge diffusion 29.8 35 ◆
6.3.1 Intellectual property receipts, % total trade 0.1 48
6.3.2 Production and export complexity 52.4 44 ◆
6.3.3 High-tech exports, % total trade 1.9 60
6.3.4 ICT services exports, % total trade 6.3 9 ● ◆
Creative outputs 30.9 48 ◆
7.1 Intangible assets 45.0 29 ◆
7.1.1 Trademarks by origin/bn PPP$ GDP 96.8 10 ● ◆
7.1.2 Global brand value, top 5,000, % GDP 3.1 74
7.1.3 Industrial designs by origin/bn PPP$ GDP 8.3 15 ● ◆
7.1.4 ICTs and organizational model creation†
55.6 58
7.2 Creative goods and services 7.0 93
7.2.1 Cultural and creative services exports, % total trade 0.5 47
7.2.2 National feature films/mn pop. 15–69 0.6 97 ○
7.2.3 Entertainment and media market/th pop. 15–69 n/a n/a
7.2.4 Printing and other media, % manufacturing 0.8 68
7.2.5 Creative goods exports, % total trade 0.2 78
7.3 Online creativity 26.4 45 ◆
7.3.1 Generic top-level domains (TLDs)/th pop. 15–69 4.5 55 ◆
7.3.2 Country-code TLDs/th pop. 15–69 5.1 55 ◆
7.3.3 Wikipedia edits/mn pop. 15–69 65.0 44 ◆
7.3.4 Mobile app creation/bn PPP$ GDP 29.1 17 ● ◆
Score/
Value Rank
Institutions 56.2 91
1.1 Political environment 46.0 101
1.1.1 Political and operational stability* 50.0 123 ○ ◇
1.1.2 Government effectiveness* 44.1 90
1.2 Regulatory environment 61.3 78
1.2.1 Regulatory quality* 36.7 92
1.2.2 Rule of law* 28.3 108
1.2.3 Cost of redundancy dismissal 13.0 40
1.3 Business environment 61.2 104
1.3.1 Ease of starting a business* 91.1 52
1.3.2 Ease of resolving insolvency* 31.4 117 ○
Human capital and research 38.2 44 ◆
2.1 Education 61.3 23 ◆
2.1.1 Expenditure on education, % GDP 5.4 23
2.1.2 Government funding/pupil, secondary, % GDP/cap 30.3 7 ● ◆
2.1.3 School life expectancy, years 14.9 55 ◆
2.1.4 PISA scales in reading, maths and science 462.7 40
2.1.5 Pupil-teacher ratio, secondary 7.8 7 ● ◆
2.2 Tertiary education 42.8 33 ◆
2.2.1 Tertiary enrolment, % gross 82.7 18 ● ◆
2.2.2 Graduates in science and engineering, % 25.1 39
2.2.3 Tertiary inbound mobility, % 3.5 62
2.3 Research and development (RD) 10.4 58 ◆
2.3.1 Researchers, FTE/mn pop. 988.1 51 ◆
2.3.2 Gross expenditure on RD, % GDP 0.5 69
2.3.3 Global corporate RD investors, top 3, mn US$ 0.0 41 ○ ◇
2.3.4 QS university ranking, top 3* 20.6 51 ◆
Infrastructure 32.3 94
3.1 Informationandcommunicationtechnologies(ICTs) 64.9 69 ◆
3.1.1 ICT access* 65.0 69 ◆
3.1.2 ICT use* 45.5 91
3.1.3 Government’s online service* 68.2 72
3.1.4 E-participation* 81.0 46 ◆
3.2 General infrastructure 12.8 124 ○ ◇
3.2.1 Electricity output, GWh/mn pop. 3,546.9 58 ◆
3.2.2 Logistics performance* 36.4 65
3.2.3 Gross capital formation, % GDP 6.9 125 ○ ◇
3.3 Ecological sustainability 19.2 106
3.3.1 GDP/unit of energy use 4.0 120 ○ ◇
3.3.2 Environmental performance* 49.5 57 ◆
3.3.3 ISO 14001 environmental certificates/bn PPP$ GDP 0.6 82
Market sophistication 42.3 88
4.1 Credit 34.3 90
4.1.1 Ease of getting credit* 75.0 34
4.1.2 Domestic credit to private sector, % GDP 30.1 94
4.1.3 Microfinance gross loans, % GDP 0.0 79 ○
4.2 Investment 17.9 120 ○
4.2.1 Ease of protecting minority investors* 68.0 44
4.2.2 Market capitalization, % GDP 4.0 73 ○ ◇
4.2.3 Venture capital investors, deals/bn PPP$ GDP 0.0 68
4.2.4 Venture capital recipients, deals/bn PPP$ GDP 0.0 93 ○ ◇
4.3 Trade, diversification, and market scale 74.8 44 ◆
4.3.1 Applied tariff rate, weighted avg., % 5.3 89
4.3.2 Domestic industry diversification 89.8 51
4.3.3 Domestic market scale, bn PPP$ 527.9 39
NOTES: ● indicates a strength; ○ a weakness; ◆ an income group strength; ◇ an income group weakness; * an index; †
a survey question. indicates that
the
economy’s data are older than the base year; see appendices for details, including the year of the data, at http://globalinnovationindex.org. Square
brackets [ ] indicate
that the data minimum coverage (DMC) requirements were not met at the sub-pillar or pillar level.](https://image.slidesharecdn.com/e-220805033615-e8521670/75/E-INDEX-2021-pdf-183-2048.jpg)
![164 Global Innovation Index 2021
United Arab Emirates GII 2021 rank
33
Output rank Input rank Income Region Population (mn) GDP, PPP$ (bn) GDP per capita, PPP$ GII 2020 rank
47 23 High NAWA 9.9 647.6 58,466 34
Score/
Value Rank
Business sophistication 47.2 22
5.1 Knowledge workers 51.4 26
5.1.1 Knowledge-intensive employment, % 36.0 37
5.1.2 Firms offering formal training, % n/a n/a
5.1.3 GERD performed by business, % GDP 0.8 29
5.1.4 GERD financed by business, % 74.3 5 ● ◆
5.1.5 Females employed w/advanced degrees, % 8.6 77 ○ ◇
5.2 Innovation linkages 42.5 21
5.2.1 University-industry RD collaboration†
62.1 19
5.2.2 State of cluster development and depth†
68.5 9 ● ◆
5.2.3 GERD financed by abroad, % GDP n/a n/a
5.2.4 Joint venture/strategic alliance deals/bn PPP$ GDP 0.2 15
5.2.5 Patent families/bn PPP$ GDP 0.1 59
5.3 Knowledge absorption 47.7 16
5.3.1 Intellectual property payments, % total trade 0.8 54
5.3.2 High-tech imports, % total trade 13.0 17
5.3.3 ICT services imports, % total trade 1.0 75 ○
5.3.4 FDI net inflows, % GDP 2.8 57
5.3.5 Research talent, % in businesses 77.9 2 ● ◆
Knowledge and technology outputs 22.2 59
6.1 Knowledge creation 5.9 105 ○ ◇
6.1.1 Patents by origin/bn PPP$ GDP 0.1 105 ○
6.1.2 PCT patents by origin/bn PPP$ GDP 0.1 60
6.1.3 Utility models by origin/bn PPP$ GDP 0.0 75 ○
6.1.4 Scientific and technical articles/bn PPP$ GDP 7.7 97 ○ ◇
6.1.5 Citable documents H-index 12.8 60
6.2 Knowledge impact 29.5 65
6.2.1 Labor productivity growth, % −0.8 80 ○
6.2.2 New businesses/th pop. 15–64 3.0 48
6.2.3 Software spending, % GDP 0.3 40
6.2.4 ISO 9001 quality certificates/bn PPP$ GDP 5.6 51
6.2.5 High-tech manufacturing, % 26.3 46
6.3 Knowledge diffusion 31.3 32
6.3.1 Intellectual property receipts, % total trade 1.1 19
6.3.2 Production and export complexity 43.6 62 ◇
6.3.3 High-tech exports, % total trade 9.4 17
6.3.4 ICT services exports, % total trade 2.0 58
Creative outputs 33.8 40
7.1 Intangible assets 33.1 55
7.1.1 Trademarks by origin/bn PPP$ GDP 8.1 115 ○ ◇
7.1.2 Global brand value, top 5,000, % GDP 133.4 14
7.1.3 Industrial designs by origin/bn PPP$ GDP 0.1 111 ○
7.1.4 ICTs and organizational model creation†
67.3 24
7.2 Creative goods and services 50.5 2 ● ◆
7.2.1 Cultural and creative services exports, % total trade n/a n/a
7.2.2 National feature films/mn pop. 15–69 10.6 18
7.2.3 Entertainment and media market/th pop. 15–69 25.9 25
7.2.4 Printing and other media, % manufacturing 1.4 30
7.2.5 Creative goods exports, % total trade 7.2 6 ● ◆
7.3 Online creativity 18.4 64 ◇
7.3.1 Generic top-level domains (TLDs)/th pop. 15–69 10.6 38
7.3.2 Country-code TLDs/th pop. 15–69 7.8 44
7.3.3 Wikipedia edits/mn pop. 15–69 46.4 71 ◇
7.3.4 Mobile app creation/bn PPP$ GDP 9.1 50
Score/
Value Rank
Institutions 78.4 30
1.1 Political environment 78.6 24
1.1.1 Political and operational stability* 73.2 44
1.1.2 Government effectiveness* 81.2 20
1.2 Regulatory environment 84.5 21
1.2.1 Regulatory quality* 69.1 36
1.2.2 Rule of law* 68.9 33
1.2.3 Cost of redundancy dismissal 8.0 1 ● ◆
1.3 Business environment 72.0 61
1.3.1 Ease of starting a business* 94.8 16
1.3.2 Ease of resolving insolvency* 49.3 72
Human capital and research 49.9 22
2.1 Education 52.0 61
2.1.1 Expenditure on education, % GDP 3.1 94 ○ ◇
2.1.2 Government funding/pupil, secondary, % GDP/cap n/a n/a
2.1.3 School life expectancy, years 15.7 43
2.1.4 PISA scales in reading, maths and science 433.5 47 ○ ◇
2.1.5 Pupil-teacher ratio, secondary 10.5 33
2.2 Tertiary education 59.2 3 ● ◆
2.2.1 Tertiary enrolment, % gross 52.6 60
2.2.2 Graduates in science and engineering, % 31.0 15 ◆
2.2.3 Tertiary inbound mobility, % 48.6 1 ● ◆
2.3 Research and development (RD) 38.6 28
2.3.1 Researchers, FTE/mn pop. 2,378.9 36
2.3.2 Gross expenditure on RD, % GDP 1.3 29
2.3.3 Global corporate RD investors, top 3, mn US$ 64.9 19
2.3.4 QS university ranking, top 3* 35.8 33
Infrastructure 58.1 14 ●
3.1 Informationandcommunicationtechnologies(ICTs) 88.8 12 ●
3.1.1 ICT access* 87.3 13 ●
3.1.2 ICT use* 83.7 12 ●
3.1.3 Government’s online service* 90.0 15
3.1.4 E-participation* 94.0 16
3.2 General infrastructure 52.9 7 ● ◆
3.2.1 Electricity output, GWh/mn pop. 14,120.8 8 ●
3.2.2 Logistics performance* 88.6 11 ● ◆
3.2.3 Gross capital formation, % GDP 27.7 30
3.3 Ecological sustainability 32.7 51
3.3.1 GDP/unit of energy use 10.1 66
3.3.2 Environmental performance* 55.6 40
3.3.3 ISO 14001 environmental certificates/bn PPP$ GDP 2.8 32
Market sophistication 56.7 26
4.1 Credit 50.6 28
4.1.1 Ease of getting credit* 70.0 44
4.1.2 Domestic credit to private sector, % GDP 77.6 39
4.1.3 Microfinance gross loans, % GDP n/a n/a
4.2 Investment 41.1 34
4.2.1 Ease of protecting minority investors* 80.0 13 ◆
4.2.2 Market capitalization, % GDP 58.0 29
4.2.3 Venture capital investors, deals/bn PPP$ GDP 0.1 20
4.2.4 Venture capital recipients, deals/bn PPP$ GDP 0.1 18
4.3 Trade, diversification, and market scale 78.4 34
4.3.1 Applied tariff rate, weighted avg., % 3.9 73
4.3.2 Domestic industry diversification 92.9 43
4.3.3 Domestic market scale, bn PPP$ 647.7 33
NOTES: ● indicates a strength; ○ a weakness; ◆ an income group strength; ◇ an income group weakness; * an index; †
a survey question. indicates that
the
economy’s data are older than the base year; see appendices for details, including the year of the data, at http://globalinnovationindex.org. Square
brackets [ ] indicate
that the data minimum coverage (DMC) requirements were not met at the sub-pillar or pillar level.](https://image.slidesharecdn.com/e-220805033615-e8521670/75/E-INDEX-2021-pdf-184-2048.jpg)
![165
GII 2021 Economy profiles
United Kingdom GII 2021 rank
4
Output rank Input rank Income Region Population (mn) GDP, PPP$ (bn) GDP per capita, PPP$ GII 2020 rank
6 7 High EUR 67.9 2,978.6 44,288 4
Score/
Value Rank
Business sophistication 49.7 21
5.1 Knowledge workers 61.2 14
5.1.1 Knowledge-intensive employment, % 50.6 7 ●
5.1.2 Firms offering formal training, % n/a n/a
5.1.3 GERD performed by business, % GDP 1.2 18
5.1.4 GERD financed by business, % 54.8 19
5.1.5 Females employed w/advanced degrees, % 24.1 17
5.2 Innovation linkages 47.0 17
5.2.1 University-industry RD collaboration†
63.7 16
5.2.2 State of cluster development and depth†
59.7 26
5.2.3 GERD financed by abroad, % GDP 0.2 16
5.2.4 Joint venture/strategic alliance deals/bn PPP$ GDP 0.2 13
5.2.5 Patent families/bn PPP$ GDP 2.0 20
5.3 Knowledge absorption 40.7 27
5.3.1 Intellectual property payments, % total trade 1.7 19
5.3.2 High-tech imports, % total trade 10.8 23
5.3.3 ICT services imports, % total trade 1.5 51 ○
5.3.4 FDI net inflows, % GDP 2.8 59 ○
5.3.5 Research talent, % in businesses 41.9 32 ○
Knowledge and technology outputs 52.3 10
6.1 Knowledge creation 65.0 8 ●
6.1.1 Patents by origin/bn PPP$ GDP 5.6 16
6.1.2 PCT patents by origin/bn PPP$ GDP 2.0 19
6.1.3 Utility models by origin/bn PPP$ GDP n/a n/a
6.1.4 Scientific and technical articles/bn PPP$ GDP 43.7 13
6.1.5 Citable documents H-index 100.0 1 ● ◆
6.2 Knowledge impact 43.1 19
6.2.1 Labor productivity growth, % −3.0 112 ○ ◇
6.2.2 New businesses/th pop. 15–64 15.6 8 ◆
6.2.3 Software spending, % GDP 0.5 14
6.2.4 ISO 9001 quality certificates/bn PPP$ GDP 8.3 33
6.2.5 High-tech manufacturing, % 44.9 18
6.3 Knowledge diffusion 48.9 15
6.3.1 Intellectual property receipts, % total trade 2.8 8
6.3.2 Production and export complexity 78.7 13
6.3.3 High-tech exports, % total trade 8.6 19
6.3.4 ICT services exports, % total trade 3.3 28
Creative outputs 54.0 4 ●
7.1 Intangible assets 56.0 10
7.1.1 Trademarks by origin/bn PPP$ GDP 53.8 40
7.1.2 Global brand value, top 5,000, % GDP 160.7 8
7.1.3 Industrial designs by origin/bn PPP$ GDP 8.5 14
7.1.4 ICTs and organizational model creation†
79.1 6 ●
7.2 Creative goods and services 44.8 6 ● ◆
7.2.1 Cultural and creative services exports, % total trade 2.5 6 ● ◆
7.2.2 National feature films/mn pop. 15–69 6.2 36
7.2.3 Entertainment and media market/th pop. 15–69 61.8 8
7.2.4 Printing and other media, % manufacturing 1.9 18
7.2.5 Creative goods exports, % total trade 3.5 16
7.3 Online creativity 59.0 10
7.3.1 Generic top-level domains (TLDs)/th pop. 15–69 60.1 10
7.3.2 Country-code TLDs/th pop. 15–69 69.4 8 ●
7.3.3 Wikipedia edits/mn pop. 15–69 80.0 11
7.3.4 Mobile app creation/bn PPP$ GDP 22.4 24
Score/
Value Rank
Institutions 86.6 15
1.1 Political environment 80.0 21
1.1.1 Political and operational stability* 75.0 40 ◇
1.1.2 Government effectiveness* 82.6 18
1.2 Regulatory environment 92.4 9
1.2.1 Regulatory quality* 86.0 13
1.2.2 Rule of law* 88.9 16
1.2.3 Cost of redundancy dismissal 9.3 25
1.3 Business environment 87.4 12
1.3.1 Ease of starting a business* 94.6 17
1.3.2 Ease of resolving insolvency* 80.3 13
Human capital and research 58.2 10
2.1 Education 59.7 28
2.1.1 Expenditure on education, % GDP 5.4 21
2.1.2 Government funding/pupil, secondary, % GDP/cap 20.8 44 ○
2.1.3 School life expectancy, years 17.2 16
2.1.4 PISA scales in reading, maths and science 503.5 12
2.1.5 Pupil-teacher ratio, secondary 16.7 82 ○ ◇
2.2 Tertiary education 47.4 18
2.2.1 Tertiary enrolment, % gross 61.4 48 ○
2.2.2 Graduates in science and engineering, % 26.9 28
2.2.3 Tertiary inbound mobility, % 18.3 8
2.3 Research and development (RD) 67.7 9
2.3.1 Researchers, FTE/mn pop. 4,701.2 19
2.3.2 Gross expenditure on RD, % GDP 1.8 21
2.3.3 Global corporate RD investors, top 3, mn US$ 84.5 8 ●
2.3.4 QS university ranking, top 3* 94.9 2 ● ◆
Infrastructure 59.7 10
3.1 Informationandcommunicationtechnologies(ICTs) 93.4 2 ● ◆
3.1.1 ICT access* 93.9 3 ● ◆
3.1.2 ICT use* 86.2 9
3.1.3 Government’s online service* 95.9 6 ●
3.1.4 E-participation* 97.6 6 ●
3.2 General infrastructure 34.7 40 ◇
3.2.1 Electricity output, GWh/mn pop. 4,804.5 48 ○
3.2.2 Logistics performance* 90.1 9
3.2.3 Gross capital formation, % GDP 15.7 111 ○ ◇
3.3 Ecological sustainability 50.9 14
3.3.1 GDP/unit of energy use 17.2 12
3.3.2 Environmental performance* 81.3 4 ●
3.3.3 ISO 14001 environmental certificates/bn PPP$ GDP 3.6 26
Market sophistication 78.1 4 ● ◆
4.1 Credit 65.3 10
4.1.1 Ease of getting credit* 75.0 34
4.1.2 Domestic credit to private sector, % GDP 133.6 14
4.1.3 Microfinance gross loans, % GDP n/a n/a
4.2 Investment 80.0 5 ● ◆
4.2.1 Ease of protecting minority investors* 84.0 7 ◆
4.2.2 Market capitalization, % GDP n/a n/a
4.2.3 Venture capital investors, deals/bn PPP$ GDP 0.3 9
4.2.4 Venture capital recipients, deals/bn PPP$ GDP 0.2 7
4.3 Trade, diversification, and market scale 89.1 3 ● ◆
4.3.1 Applied tariff rate, weighted avg., % 1.8 25 ○
4.3.2 Domestic industry diversification 98.6 6 ●
4.3.3 Domestic market scale, bn PPP$ 2,978.6 9
NOTES: ● indicates a strength; ○ a weakness; ◆ an income group strength; ◇ an income group weakness; * an index; †
a survey question. indicates that
the
economy’s data are older than the base year; see appendices for details, including the year of the data, at http://globalinnovationindex.org. Square
brackets [ ] indicate
that the data minimum coverage (DMC) requirements were not met at the sub-pillar or pillar level.](https://image.slidesharecdn.com/e-220805033615-e8521670/75/E-INDEX-2021-pdf-185-2048.jpg)
![166 Global Innovation Index 2021
United Republic of Tanzania GII 2021 rank
90
Output rank Input rank Income Region Population (mn) GDP, PPP$ (bn) GDP per capita, PPP$ GII 2020 rank
65 120 Lower middle SSF 59.7 165.3 2,851 88
Score/
Value Rank
Business sophistication 16.0 119
5.1 Knowledge workers 9.8 124 ◇
5.1.1 Knowledge-intensive employment, % 3.4 124 ○ ◇
5.1.2 Firms offering formal training, % 30.7 50
5.1.3 GERD performed by business, % GDP n/a n/a
5.1.4 GERD financed by business, % 0.1 101 ◇
5.1.5 Females employed w/advanced degrees, % 0.4 122 ○
5.2 Innovation linkages 22.1 59 ●
5.2.1 University-industry RD collaboration†
47.2 46 ● ◆
5.2.2 State of cluster development and depth†
50.7 43 ●
5.2.3 GERD financed by abroad, % GDP 0.2 29 ● ◆
5.2.4 Joint venture/strategic alliance deals/bn PPP$ GDP 0.0 104
5.2.5 Patent families/bn PPP$ GDP 0.0 96
5.3 Knowledge absorption 16.2 111
5.3.1 Intellectual property payments, % total trade 0.1 112
5.3.2 High-tech imports, % total trade 7.8 63 ●
5.3.3 ICT services imports, % total trade 0.2 127 ◇
5.3.4 FDI net inflows, % GDP 1.8 84
5.3.5 Research talent, % in businesses n/a n/a
Knowledge and technology outputs 12.2 100
6.1 Knowledge creation 5.5 109
6.1.1 Patents by origin/bn PPP$ GDP 0.2 99
6.1.2 PCT patents by origin/bn PPP$ GDP 0.0 98 ○ ◇
6.1.3 Utility models by origin/bn PPP$ GDP 0.0 74
6.1.4 Scientific and technical articles/bn PPP$ GDP 9.0 91
6.1.5 Citable documents H-index 10.0 79
6.2 Knowledge impact 20.7 101
6.2.1 Labor productivity growth, % 4.1 10 ●
6.2.2 New businesses/th pop. 15–64 0.2 112
6.2.3 Software spending, % GDP 0.0 124 ○ ◇
6.2.4 ISO 9001 quality certificates/bn PPP$ GDP 0.5 121
6.2.5 High-tech manufacturing, % 8.7 92
6.3 Knowledge diffusion 10.4 94
6.3.1 Intellectual property receipts, % total trade 0.0 109
6.3.2 Production and export complexity 41.7 67
6.3.3 High-tech exports, % total trade 2.0 57 ●
6.3.4 ICT services exports, % total trade 0.2 120
Creative outputs 31.4 [44]
7.1 Intangible assets 47.2 [22]
7.1.1 Trademarks by origin/bn PPP$ GDP n/a n/a
7.1.2 Global brand value, top 5,000, % GDP n/a n/a
7.1.3 Industrial designs by origin/bn PPP$ GDP n/a n/a
7.1.4 ICTs and organizational model creation†
47.2 94
7.2 Creative goods and services 28.7 [28]
7.2.1 Cultural and creative services exports, % total trade n/a n/a
7.2.2 National feature films/mn pop. 15–69 n/a n/a
7.2.3 Entertainment and media market/th pop. 15–69 n/a n/a
7.2.4 Printing and other media, % manufacturing 1.7 22 ●
7.2.5 Creative goods exports, % total trade 2.3 25 ●
7.3 Online creativity 2.5 130 ○ ◇
7.3.1 Generic top-level domains (TLDs)/th pop. 15–69 0.2 120
7.3.2 Country-code TLDs/th pop. 15–69 0.2 111
7.3.3 Wikipedia edits/mn pop. 15–69 12.4 130 ○ ◇
7.3.4 Mobile app creation/bn PPP$ GDP n/a n/a
Score/
Value Rank
Institutions 52.7 103
1.1 Political environment 38.0 122 ◇
1.1.1 Political and operational stability* 51.8 119 ◇
1.1.2 Government effectiveness* 31.1 122
1.2 Regulatory environment 63.2 73 ◆
1.2.1 Regulatory quality* 26.7 108
1.2.2 Rule of law* 31.5 102
1.2.3 Cost of redundancy dismissal 9.3 25 ● ◆
1.3 Business environment 56.7 114
1.3.1 Ease of starting a business* 74.4 119
1.3.2 Ease of resolving insolvency* 39.1 102
Human capital and research 10.9 125 ◇
2.1 Education 29.1 117
2.1.1 Expenditure on education, % GDP 3.7 78
2.1.2 Government funding/pupil, secondary, % GDP/cap 14.9 76
2.1.3 School life expectancy, years 9.1 111 ◇
2.1.4 PISA scales in reading, maths and science n/a n/a
2.1.5 Pupil-teacher ratio, secondary 22.1 101
2.2 Tertiary education 1.0 130 ○ ◇
2.2.1 Tertiary enrolment, % gross 3.1 127 ○ ◇
2.2.2 Graduates in science and engineering, % 9.5 109 ○ ◇
2.2.3 Tertiary inbound mobility, % n/a n/a
2.3 Research and development (RD) 2.6 90
2.3.1 Researchers, FTE/mn pop. 19.2 105
2.3.2 Gross expenditure on RD, % GDP 0.5 65
2.3.3 Global corporate RD investors, top 3, mn US$ 0.0 41 ○ ◇
2.3.4 QS university ranking, top 3* 0.0 74 ○ ◇
Infrastructure 29.9 105
3.1 Informationandcommunicationtechnologies(ICTs) 37.1 115
3.1.1 ICT access* 27.7 124 ◇
3.1.2 ICT use* 9.6 130 ○ ◇
3.1.3 Government’s online service* 55.3 95
3.1.4 E-participation* 56.0 93
3.2 General infrastructure 35.6 38 ● ◆
3.2.1 Electricity output, GWh/mn pop. 128.4 119
3.2.2 Logistics performance* n/a n/a
3.2.3 Gross capital formation, % GDP 38.1 9 ● ◆
3.3 Ecological sustainability 16.9 116
3.3.1 GDP/unit of energy use 8.0 91
3.3.2 Environmental performance* 31.1 116
3.3.3 ISO 14001 environmental certificates/bn PPP$ GDP 0.2 115
Market sophistication 37.5 109
4.1 Credit 27.6 114
4.1.1 Ease of getting credit* 65.0 61
4.1.2 Domestic credit to private sector, % GDP 12.1 124
4.1.3 Microfinance gross loans, % GDP 0.1 55
4.2 Investment 27.4 [74]
4.2.1 Ease of protecting minority investors* 50.0 92
4.2.2 Market capitalization, % GDP n/a n/a
4.2.3 Venture capital investors, deals/bn PPP$ GDP n/a n/a
4.2.4 Venture capital recipients, deals/bn PPP$ GDP 0.0 64
4.3 Trade, diversification, and market scale 57.6 103
4.3.1 Applied tariff rate, weighted avg., % 8.4 105
4.3.2 Domestic industry diversification 67.0 100
4.3.3 Domestic market scale, bn PPP$ 165.3 70
NOTES: ● indicates a strength; ○ a weakness; ◆ an income group strength; ◇ an income group weakness; * an index; †
a survey question. indicates that
the
economy’s data are older than the base year; see appendices for details, including the year of the data, at http://globalinnovationindex.org. Square
brackets [ ] indicate
that the data minimum coverage (DMC) requirements were not met at the sub-pillar or pillar level.](https://image.slidesharecdn.com/e-220805033615-e8521670/75/E-INDEX-2021-pdf-186-2048.jpg)
![167
GII 2021 Economy profiles
United States of America GII 2021 rank
3
Output rank Input rank Income Region Population (mn) GDP, PPP$ (bn) GDP per capita, PPP$ GII 2020 rank
4 3 High NAC 331.0 20,807.3 63,051 3
Score/
Value Rank
Business sophistication 63.0 2 ● ◆
5.1 Knowledge workers 73.5 4 ◆
5.1.1 Knowledge-intensive employment, % 52.0 4
5.1.2 Firms offering formal training, % n/a n/a
5.1.3 GERD performed by business, % GDP 2.3 5
5.1.4 GERD financed by business, % 63.1 10
5.1.5 Females employed w/advanced degrees, % 28.0 5 ◆
5.2 Innovation linkages 59.9 5
5.2.1 University-industry RD collaboration†
74.4 3 ● ◆
5.2.2 State of cluster development and depth†
73.7 1 ● ◆
5.2.3 GERD financed by abroad, % GDP 0.2 19
5.2.4 Joint venture/strategic alliance deals/bn PPP$ GDP 0.2 6 ◆
5.2.5 Patent families/bn PPP$ GDP 3.4 12
5.3 Knowledge absorption 55.7 7
5.3.1 Intellectual property payments, % total trade 1.6 22
5.3.2 High-tech imports, % total trade 16.9 10
5.3.3 ICT services imports, % total trade 1.6 47
5.3.4 FDI net inflows, % GDP 1.6 89 ○
5.3.5 Research talent, % in businesses 72.5 4 ◆
Knowledge and technology outputs 59.2 3 ● ◆
6.1 Knowledge creation 72.9 3 ● ◆
6.1.1 Patents by origin/bn PPP$ GDP 13.3 1 ● ◆
6.1.2 PCT patents by origin/bn PPP$ GDP 2.8 12
6.1.3 Utility models by origin/bn PPP$ GDP n/a n/a
6.1.4 Scientific and technical articles/bn PPP$ GDP 18.9 46 ◇
6.1.5 Citable documents H-index 100.0 1 ● ◆
6.2 Knowledge impact 56.9 1 ● ◆
6.2.1 Labor productivity growth, % 1.6 30 ◆
6.2.2 New businesses/th pop. 15–64 n/a n/a
6.2.3 Software spending, % GDP 1.1 1 ● ◆
6.2.4 ISO 9001 quality certificates/bn PPP$ GDP 1.0 110 ○ ◇
6.2.5 High-tech manufacturing, % 44.9 19
6.3 Knowledge diffusion 47.7 16
6.3.1 Intellectual property receipts, % total trade 4.3 1 ● ◆
6.3.2 Production and export complexity 79.7 11
6.3.3 High-tech exports, % total trade 8.8 18
6.3.4 ICT services exports, % total trade 2.0 56
Creative outputs 47.8 12
7.1 Intangible assets 48.8 21
7.1.1 Trademarks by origin/bn PPP$ GDP 21.5 91 ○ ◇
7.1.2 Global brand value, top 5,000, % GDP 209.5 4 ◆
7.1.3 Industrial designs by origin/bn PPP$ GDP 1.1 66
7.1.4 ICTs and organizational model creation†
83.7 1 ● ◆
7.2 Creative goods and services 43.0 7
7.2.1 Cultural and creative services exports, % total trade 1.9 8
7.2.2 National feature films/mn pop. 15–69 2.9 60 ○
7.2.3 Entertainment and media market/th pop. 15–69 100.0 1 ● ◆
7.2.4 Printing and other media, % manufacturing 1.4 31
7.2.5 Creative goods exports, % total trade 3.0 21
7.3 Online creativity 50.4 21
7.3.1 Generic top-level domains (TLDs)/th pop. 15–69 100.0 1 ● ◆
7.3.2 Country-code TLDs/th pop. 15–69 2.1 70 ◇
7.3.3 Wikipedia edits/mn pop. 15–69 69.5 40 ◇
7.3.4 Mobile app creation/bn PPP$ GDP 27.4 21
Score/
Value Rank
Institutions 87.6 12
1.1 Political environment 80.8 19
1.1.1 Political and operational stability* 75.0 40 ◇
1.1.2 Government effectiveness* 83.7 17
1.2 Regulatory environment 91.0 12
1.2.1 Regulatory quality* 78.7 20
1.2.2 Rule of law* 85.2 18
1.2.3 Cost of redundancy dismissal 8.0 1 ● ◆
1.3 Business environment 91.0 2 ● ◆
1.3.1 Ease of starting a business* 91.6 48
1.3.2 Ease of resolving insolvency* 90.5 2 ● ◆
Human capital and research 58.1 11
2.1 Education 57.6 41
2.1.1 Expenditure on education, % GDP 5.0 42
2.1.2 Government funding/pupil, secondary, % GDP/cap 22.7 31
2.1.3 School life expectancy, years 16.3 29
2.1.4 PISA scales in reading, maths and science 495.3 24
2.1.5 Pupil-teacher ratio, secondary 14.6 71 ○ ◇
2.2 Tertiary education 38.6 45
2.2.1 Tertiary enrolment, % gross 88.3 11
2.2.2 Graduates in science and engineering, % 19.0 78 ○
2.2.3 Tertiary inbound mobility, % 5.2 47
2.3 Research and development (RD) 78.3 2 ● ◆
2.3.1 Researchers, FTE/mn pop. 4,408.2 22
2.3.2 Gross expenditure on RD, % GDP 3.1 8
2.3.3 Global corporate RD investors, top 3, mn US$ 100.0 1 ● ◆
2.3.4 QS university ranking, top 3* 98.8 1 ● ◆
Infrastructure 55.3 23
3.1 Informationandcommunicationtechnologies(ICTs) 90.1 9
3.1.1 ICT access* 83.5 22
3.1.2 ICT use* 82.1 18
3.1.3 Government’s online service* 94.7 7
3.1.4 E-participation* 100.0 1 ●
3.2 General infrastructure 45.1 18
3.2.1 Electricity output, GWh/mn pop. 13,284.9 9
3.2.2 Logistics performance* 85.3 14
3.2.3 Gross capital formation, % GDP 20.3 86 ○
3.3 Ecological sustainability 30.8 55 ◇
3.3.1 GDP/unit of energy use 9.1 80 ○
3.3.2 Environmental performance* 69.3 24
3.3.3 ISO 14001 environmental certificates/bn PPP$ GDP 0.2 117 ○ ◇
Market sophistication 81.5 2 ● ◆
4.1 Credit 88.0 1 ● ◆
4.1.1 Ease of getting credit* 95.0 4 ◆
4.1.2 Domestic credit to private sector, % GDP 191.8 2 ● ◆
4.1.3 Microfinance gross loans, % GDP n/a n/a
4.2 Investment 73.2 9 ◆
4.2.1 Ease of protecting minority investors* 71.6 35
4.2.2 Market capitalization, % GDP 152.9 5
4.2.3 Venture capital investors, deals/bn PPP$ GDP 0.3 10
4.2.4 Venture capital recipients, deals/bn PPP$ GDP 0.3 1 ● ◆
4.3 Trade, diversification, and market scale 83.4 18
4.3.1 Applied tariff rate, weighted avg., % 13.8 128 ○ ◇
4.3.2 Domestic industry diversification 98.6 8
4.3.3 Domestic market scale, bn PPP$ 20,807.3 2 ● ◆
NOTES: ● indicates a strength; ○ a weakness; ◆ an income group strength; ◇ an income group weakness; * an index; †
a survey question. indicates that
the
economy’s data are older than the base year; see appendices for details, including the year of the data, at http://globalinnovationindex.org. Square
brackets [ ] indicate
that the data minimum coverage (DMC) requirements were not met at the sub-pillar or pillar level.](https://image.slidesharecdn.com/e-220805033615-e8521670/75/E-INDEX-2021-pdf-187-2048.jpg)
![168 Global Innovation Index 2021
Uruguay GII 2021 rank
65
Output rank Input rank Income Region Population (mn) GDP, PPP$ (bn) GDP per capita, PPP$ GII 2020 rank
63 69 High LCN 3.5 75.3 21,338 69
Score/
Value Rank
Business sophistication 22.4 81 ◇
5.1 Knowledge workers 27.0 82 ◇
5.1.1 Knowledge-intensive employment, % 22.3 71 ◇
5.1.2 Firms offering formal training, % 53.3 14 ●
5.1.3 GERD performed by business, % GDP 0.1 63 ◇
5.1.4 GERD financed by business, % 4.6 83 ○ ◇
5.1.5 Females employed w/advanced degrees, % 10.4 68 ◇
5.2 Innovation linkages 17.0 95 ◇
5.2.1 University-industry RD collaboration†
39.5 79 ◇
5.2.2 State of cluster development and depth†
45.2 76
5.2.3 GERD financed by abroad, % GDP 0.0 59
5.2.4 Joint venture/strategic alliance deals/bn PPP$ GDP 0.0 88
5.2.5 Patent families/bn PPP$ GDP 0.2 44
5.3 Knowledge absorption 23.1 74 ◇
5.3.1 Intellectual property payments, % total trade 0.8 52
5.3.2 High-tech imports, % total trade 6.6 85
5.3.3 ICT services imports, % total trade 2.8 12 ●
5.3.4 FDI net inflows, % GDP 3.0 50
5.3.5 Research talent, % in businesses 0.6 81 ○ ◇
Knowledge and technology outputs 21.4 63
6.1 Knowledge creation 11.7 72 ◇
6.1.1 Patents by origin/bn PPP$ GDP 0.3 86
6.1.2 PCT patents by origin/bn PPP$ GDP n/a n/a
6.1.3 Utility models by origin/bn PPP$ GDP 0.3 42
6.1.4 Scientific and technical articles/bn PPP$ GDP 16.2 51
6.1.5 Citable documents H-index 11.2 68
6.2 Knowledge impact 32.2 57
6.2.1 Labor productivity growth, % 2.1 27 ◆
6.2.2 New businesses/th pop. 15–64 1.3 78
6.2.3 Software spending, % GDP 0.2 62
6.2.4 ISO 9001 quality certificates/bn PPP$ GDP 13.2 22 ●
6.2.5 High-tech manufacturing, % 15.3 73 ◇
6.3 Knowledge diffusion 20.3 53
6.3.1 Intellectual property receipts, % total trade 0.3 32
6.3.2 Production and export complexity 44.4 60 ◇
6.3.3 High-tech exports, % total trade 0.8 77
6.3.4 ICT services exports, % total trade 3.6 25 ●
Creative outputs 24.5 64 ◇
7.1 Intangible assets 29.5 72
7.1.1 Trademarks by origin/bn PPP$ GDP 52.6 43
7.1.2 Global brand value, top 5,000, % GDP 0.0 80 ○ ◇
7.1.3 Industrial designs by origin/bn PPP$ GDP 0.7 77
7.1.4 ICTs and organizational model creation†
58.4 50
7.2 Creative goods and services 14.4 64
7.2.1 Cultural and creative services exports, % total trade 1.3 20 ●
7.2.2 National feature films/mn pop. 15–69 4.7 46
7.2.3 Entertainment and media market/th pop. 15–69 n/a n/a
7.2.4 Printing and other media, % manufacturing 1.1 46
7.2.5 Creative goods exports, % total trade 0.0 112 ○
7.3 Online creativity 24.7 48
7.3.1 Generic top-level domains (TLDs)/th pop. 15–69 6.4 49
7.3.2 Country-code TLDs/th pop. 15–69 11.5 40
7.3.3 Wikipedia edits/mn pop. 15–69 69.8 37
7.3.4 Mobile app creation/bn PPP$ GDP 8.6 51
Score/
Value Rank
Institutions 70.3 44
1.1 Political environment 72.0 38
1.1.1 Political and operational stability* 83.9 13 ●
1.1.2 Government effectiveness* 66.1 40
1.2 Regulatory environment 67.3 60 ◇
1.2.1 Regulatory quality* 56.8 48 ◇
1.2.2 Rule of law* 63.1 37
1.2.3 Cost of redundancy dismissal 20.8 89
1.3 Business environment 71.6 65
1.3.1 Ease of starting a business* 89.6 56
1.3.2 Ease of resolving insolvency* 53.6 65
Human capital and research 31.7 64 ◇
2.1 Education 52.3 59
2.1.1 Expenditure on education, % GDP 5.0 37
2.1.2 Government funding/pupil, secondary, % GDP/cap 16.1 69 ◇
2.1.3 School life expectancy, years 16.8 20 ●
2.1.4 PISA scales in reading, maths and science 423.5 52 ◇
2.1.5 Pupil-teacher ratio, secondary 12.7 55
2.2 Tertiary education 33.4 65 ◇
2.2.1 Tertiary enrolment, % gross 63.1 45
2.2.2 Graduates in science and engineering, % 17.5 86 ○ ◇
2.2.3 Tertiary inbound mobility, % n/a n/a
2.3 Research and development (RD) 9.4 61 ◇
2.3.1 Researchers, FTE/mn pop. 696.4 58 ◇
2.3.2 Gross expenditure on RD, % GDP 0.4 71 ◇
2.3.3 Global corporate RD investors, top 3, mn US$ 0.0 41 ○ ◇
2.3.4 QS university ranking, top 3* 21.2 49
Infrastructure 45.4 53 ◇
3.1 Informationandcommunicationtechnologies(ICTs) 80.5 30
3.1.1 ICT access* 77.7 42
3.1.2 ICT use* 74.4 36
3.1.3 Government’s online service* 84.1 31
3.1.4 E-participation* 85.7 29
3.2 General infrastructure 20.0 111 ○ ◇
3.2.1 Electricity output, GWh/mn pop. 4,653.2 50
3.2.2 Logistics performance* 29.6 84 ◇
3.2.3 Gross capital formation, % GDP 16.3 107 ○ ◇
3.3 Ecological sustainability 35.8 45
3.3.1 GDP/unit of energy use 14.6 25 ●
3.3.2 Environmental performance* 49.1 58 ◇
3.3.3 ISO 14001 environmental certificates/bn PPP$ GDP 2.9 29 ●
Market sophistication 37.6 108 ○ ◇
4.1 Credit 27.9 113 ○ ◇
4.1.1 Ease of getting credit* 60.0 74
4.1.2 Domestic credit to private sector, % GDP 28.1 100 ◇
4.1.3 Microfinance gross loans, % GDP 0.0 68 ○
4.2 Investment 23.9 95
4.2.1 Ease of protecting minority investors* 30.0 122 ○ ◇
4.2.2 Market capitalization, % GDP n/a n/a
4.2.3 Venture capital investors, deals/bn PPP$ GDP 0.2 19 ●
4.2.4 Venture capital recipients, deals/bn PPP$ GDP 0.0 66
4.3 Trade, diversification, and market scale 61.1 91 ◇
4.3.1 Applied tariff rate, weighted avg., % 5.3 89 ◇
4.3.2 Domestic industry diversification 75.1 89 ○
4.3.3 Domestic market scale, bn PPP$ 75.3 90
NOTES: ● indicates a strength; ○ a weakness; ◆ an income group strength; ◇ an income group weakness; * an index; †
a survey question. indicates that
the
economy’s data are older than the base year; see appendices for details, including the year of the data, at http://globalinnovationindex.org. Square
brackets [ ] indicate
that the data minimum coverage (DMC) requirements were not met at the sub-pillar or pillar level.](https://image.slidesharecdn.com/e-220805033615-e8521670/75/E-INDEX-2021-pdf-188-2048.jpg)
![169
GII 2021 Economy profiles
Uzbekistan GII 2021 rank
86
Output rank Input rank Income Region Population (mn) GDP, PPP$ (bn) GDP per capita, PPP$ GII 2020 rank
100 75 Lower middle CSA 33.5 250.2 7,378 93
Score/
Value Rank
Business sophistication 14.8[123]
5.1 Knowledge workers 22.8 [93]
5.1.1 Knowledge-intensive employment, % n/a n/a
5.1.2 Firms offering formal training, % 16.9 87 ◇
5.1.3 GERD performed by business, % GDP 0.1 72
5.1.4 GERD financed by business, % 42.4 38 ◆
5.1.5 Females employed w/advanced degrees, % n/a n/a
5.2 Innovation linkages 2.6 [130]
5.2.1 University-industry RD collaboration†
n/a n/a
5.2.2 State of cluster development and depth†
n/a n/a
5.2.3 GERD financed by abroad, % GDP 0.0 97 ○
5.2.4 Joint venture/strategic alliance deals/bn PPP$ GDP 0.0 62
5.2.5 Patent families/bn PPP$ GDP 0.0 90
5.3 Knowledge absorption 19.0 98
5.3.1 Intellectual property payments, % total trade 0.3 83
5.3.2 High-tech imports, % total trade 8.8 51
5.3.3 ICT services imports, % total trade 0.3 115
5.3.4 FDI net inflows, % GDP 2.8 58
5.3.5 Research talent, % in businesses 12.9 60
Knowledge and technology outputs 17.9 77
6.1 Knowledge creation 10.6 77
6.1.1 Patents by origin/bn PPP$ GDP 1.5 47
6.1.2 PCT patents by origin/bn PPP$ GDP 0.0 98 ○ ◇
6.1.3 Utility models by origin/bn PPP$ GDP 1.1 22 ●
6.1.4 Scientific and technical articles/bn PPP$ GDP 2.1 125 ○
6.1.5 Citable documents H-index 4.4 112
6.2 Knowledge impact 35.1 42 ● ◆
6.2.1 Labor productivity growth, % 4.6 8 ● ◆
6.2.2 New businesses/th pop. 15–64 1.6 63
6.2.3 Software spending, % GDP n/a n/a
6.2.4 ISO 9001 quality certificates/bn PPP$ GDP 2.3 83
6.2.5 High-tech manufacturing, % 24.0 52
6.3 Knowledge diffusion 8.0 102
6.3.1 Intellectual property receipts, % total trade 0.0 103
6.3.2 Production and export complexity 34.4 79
6.3.3 High-tech exports, % total trade 0.1 119
6.3.4 ICT services exports, % total trade 0.8 87
Creative outputs 12.3 113
7.1 Intangible assets 19.0 [106]
7.1.1 Trademarks by origin/bn PPP$ GDP 32.8 71
7.1.2 Global brand value, top 5,000, % GDP n/a n/a
7.1.3 Industrial designs by origin/bn PPP$ GDP 1.0 69
7.1.4 ICTs and organizational model creation†
n/a n/a
7.2 Creative goods and services 5.9 101
7.2.1 Cultural and creative services exports, % total trade 0.0 95
7.2.2 National feature films/mn pop. 15–69 4.2 47
7.2.3 Entertainment and media market/th pop. 15–69 n/a n/a
7.2.4 Printing and other media, % manufacturing 0.7 79
7.2.5 Creative goods exports, % total trade 0.2 86
7.3 Online creativity 5.3 122
7.3.1 Generic top-level domains (TLDs)/th pop. 15–69 0.0 131 ○ ◇
7.3.2 Country-code TLDs/th pop. 15–69 1.1 82
7.3.3 Wikipedia edits/mn pop. 15–69 23.7 116
7.3.4 Mobile app creation/bn PPP$ GDP 0.0 99 ○
Score/
Value Rank
Institutions 55.8 94
1.1 Political environment 47.6 95
1.1.1 Political and operational stability* 64.3 80
1.1.2 Government effectiveness* 39.2 99
1.2 Regulatory environment 49.9 107
1.2.1 Regulatory quality* 17.5 126 ○ ◇
1.2.2 Rule of law* 19.1 123 ◇
1.2.3 Cost of redundancy dismissal 17.3 69
1.3 Business environment 69.8 72
1.3.1 Ease of starting a business* 96.2 8 ● ◆
1.3.2 Ease of resolving insolvency* 43.5 90
Human capital and research 30.4 72 ◆
2.1 Education 57.3 [42]
2.1.1 Expenditure on education, % GDP 5.3 28 ●
2.1.2 Government funding/pupil, secondary, % GDP/cap n/a n/a
2.1.3 School life expectancy, years 12.5 87
2.1.4 PISA scales in reading, maths and science n/a n/a
2.1.5 Pupil-teacher ratio, secondary 10.9 37 ● ◆
2.2 Tertiary education 32.0 68
2.2.1 Tertiary enrolment, % gross 12.6 108
2.2.2 Graduates in science and engineering, % 34.5 7 ● ◆
2.2.3 Tertiary inbound mobility, % 0.2 105 ○
2.3 Research and development (RD) 2.0 95
2.3.1 Researchers, FTE/mn pop. 476.2 69
2.3.2 Gross expenditure on RD, % GDP 0.1 99
2.3.3 Global corporate RD investors, top 3, mn US$ 0.0 41 ○ ◇
2.3.4 QS university ranking, top 3* 0.0 74 ○ ◇
Infrastructure 40.4 72 ◆
3.1 Informationandcommunicationtechnologies(ICTs) 66.9 65 ◆
3.1.1 ICT access* 60.1 76 ◆
3.1.2 ICT use* 48.3 84
3.1.3 Government’s online service* 78.2 46 ● ◆
3.1.4 E-participation* 81.0 46 ◆
3.2 General infrastructure 35.7 37 ● ◆
3.2.1 Electricity output, GWh/mn pop. 1,908.6 82
3.2.2 Logistics performance* 24.6 95
3.2.3 Gross capital formation, % GDP 39.5 7 ● ◆
3.3 Ecological sustainability 18.7 111
3.3.1 GDP/unit of energy use 5.8 110
3.3.2 Environmental performance* 44.3 77 ◆
3.3.3 ISO 14001 environmental certificates/bn PPP$ GDP 0.2 116
Market sophistication 56.9 24 ● ◆
4.1 Credit 30.2 105
4.1.1 Ease of getting credit* 65.0 61
4.1.2 Domestic credit to private sector, % GDP 30.0 95
4.1.3 Microfinance gross loans, % GDP 0.0 80 ○
4.2 Investment 70.0 [11]
4.2.1 Ease of protecting minority investors* 70.0 36 ●
4.2.2 Market capitalization, % GDP n/a n/a
4.2.3 Venture capital investors, deals/bn PPP$ GDP n/a n/a
4.2.4 Venture capital recipients, deals/bn PPP$ GDP n/a n/a
4.3 Trade, diversification, and market scale 70.4 62
4.3.1 Applied tariff rate, weighted avg., % 8.7 110
4.3.2 Domestic industry diversification 95.9 22 ● ◆
4.3.3 Domestic market scale, bn PPP$ 250.2 60
NOTES: ● indicates a strength; ○ a weakness; ◆ an income group strength; ◇ an income group weakness; * an index; †
a survey question. indicates that
the
economy’s data are older than the base year; see appendices for details, including the year of the data, at http://globalinnovationindex.org. Square
brackets [ ] indicate
that the data minimum coverage (DMC) requirements were not met at the sub-pillar or pillar level.](https://image.slidesharecdn.com/e-220805033615-e8521670/75/E-INDEX-2021-pdf-189-2048.jpg)
![170 Global Innovation Index 2021
Viet Nam GII 2021 rank
44
Output rank Input rank Income Region Population (mn) GDP, PPP$ (bn) GDP per capita, PPP$ GII 2020 rank
38 60 Lower middle SEAO 97.3 1,047.3 10,755 42
Score/
Value Rank
Business sophistication 30.8 47 ◆
5.1 Knowledge workers 31.0 66
5.1.1 Knowledge-intensive employment, % 13.2 100 ○
5.1.2 Firms offering formal training, % 22.2 68
5.1.3 GERD performed by business, % GDP 0.4 44 ◆
5.1.4 GERD financed by business, % 64.1 8 ● ◆
5.1.5 Females employed w/advanced degrees, % 8.0 79
5.2 Innovation linkages 22.1 58
5.2.1 University-industry RD collaboration†
53.0 34 ◆
5.2.2 State of cluster development and depth†
63.6 17 ◆
5.2.3 GERD financed by abroad, % GDP 0.0 64
5.2.4 Joint venture/strategic alliance deals/bn PPP$ GDP 0.0 74
5.2.5 Patent families/bn PPP$ GDP 0.0 92
5.3 Knowledge absorption 39.2 30 ◆
5.3.1 Intellectual property payments, % total trade 0.2 91
5.3.2 High-tech imports, % total trade 25.7 3 ● ◆
5.3.3 ICT services imports, % total trade 0.1 129 ○ ◇
5.3.4 FDI net inflows, % GDP 6.3 16 ●
5.3.5 Research talent, % in businesses 24.1 52
Knowledge and technology outputs 29.4 41 ◆
6.1 Knowledge creation 9.8 79
6.1.1 Patents by origin/bn PPP$ GDP 0.7 73
6.1.2 PCT patents by origin/bn PPP$ GDP 0.0 88
6.1.3 Utility models by origin/bn PPP$ GDP 0.4 38
6.1.4 Scientific and technical articles/bn PPP$ GDP 10.4 83
6.1.5 Citable documents H-index 13.0 58
6.2 Knowledge impact 36.4 36 ◆
6.2.1 Labor productivity growth, % 5.8 3 ● ◆
6.2.2 New businesses/th pop. 15–64 1.1 81
6.2.3 Software spending, % GDP 0.3 49
6.2.4 ISO 9001 quality certificates/bn PPP$ GDP 3.8 65
6.2.5 High-tech manufacturing, % 29.9 42 ◆
6.3 Knowledge diffusion 41.9 21 ◆
6.3.1 Intellectual property receipts, % total trade 0.0 106 ○
6.3.2 Production and export complexity 47.2 52 ◆
6.3.3 High-tech exports, % total trade 32.1 1 ● ◆
6.3.4 ICT services exports, % total trade 0.3 115 ○
Creative outputs 33.4 42 ◆
7.1 Intangible assets 41.9 35 ◆
7.1.1 Trademarks by origin/bn PPP$ GDP 73.3 23 ◆
7.1.2 Global brand value, top 5,000, % GDP 80.8 25 ◆
7.1.3 Industrial designs by origin/bn PPP$ GDP 2.2 45
7.1.4 ICTs and organizational model creation†
54.4 63
7.2 Creative goods and services 26.0 35 ◆
7.2.1 Cultural and creative services exports, % total trade 0.1 91 ○
7.2.2 National feature films/mn pop. 15–69 1.2 81
7.2.3 Entertainment and media market/th pop. 15–69 2.8 52 ○ ◆
7.2.4 Printing and other media, % manufacturing 0.9 64
7.2.5 Creative goods exports, % total trade 5.8 11 ● ◆
7.3 Online creativity 23.9 49 ◆
7.3.1 Generic top-level domains (TLDs)/th pop. 15–69 2.5 71 ◆
7.3.2 Country-code TLDs/th pop. 15–69 2.1 69 ◆
7.3.3 Wikipedia edits/mn pop. 15–69 44.0 79
7.3.4 Mobile app creation/bn PPP$ GDP 47.9 10 ● ◆
Score/
Value Rank
Institutions 58.8 83
1.1 Political environment 60.5 58 ◆
1.1.1 Political and operational stability* 78.6 34 ◆
1.1.2 Government effectiveness* 51.5 71 ◆
1.2 Regulatory environment 54.3 98
1.2.1 Regulatory quality* 36.6 93
1.2.2 Rule of law* 46.3 64 ◆
1.2.3 Cost of redundancy dismissal 24.6 104
1.3 Business environment 61.6 101
1.3.1 Ease of starting a business* 85.1 88
1.3.2 Ease of resolving insolvency* 38.0 106 ○
Human capital and research 28.1 79
2.1 Education 54.2 [52]
2.1.1 Expenditure on education, % GDP 4.2 62
2.1.2 Government funding/pupil, secondary, % GDP/cap n/a n/a
2.1.3 School life expectancy, years n/a n/a
2.1.4 PISA scales in reading, maths and science 502.0 16 ◆
2.1.5 Pupil-teacher ratio, secondary 18.6 91
2.2 Tertiary education 23.2 90
2.2.1 Tertiary enrolment, % gross 28.6 87
2.2.2 Graduates in science and engineering, % 22.7 54
2.2.3 Tertiary inbound mobility, % 0.4 102 ○
2.3 Research and development (RD) 6.9 68
2.3.1 Researchers, FTE/mn pop. 707.7 57
2.3.2 Gross expenditure on RD, % GDP 0.5 64
2.3.3 Global corporate RD investors, top 3, mn US$ 0.0 41 ○ ◇
2.3.4 QS university ranking, top 3* 8.9 66
Infrastructure 38.2 79 ◆
3.1 Informationandcommunicationtechnologies(ICTs) 61.0 79 ◆
3.1.1 ICT access* 52.8 87
3.1.2 ICT use* 55.6 71 ◆
3.1.3 Government’s online service* 65.3 78
3.1.4 E-participation* 70.2 70
3.2 General infrastructure 33.1 47
3.2.1 Electricity output, GWh/mn pop. 2,521.9 74 ◆
3.2.2 Logistics performance* 57.0 38 ◆
3.2.3 Gross capital formation, % GDP 26.2 39
3.3 Ecological sustainability 20.5 95
3.3.1 GDP/unit of energy use 8.1 90
3.3.2 Environmental performance* 33.4 110 ○
3.3.3 ISO 14001 environmental certificates/bn PPP$ GDP 1.5 55 ◆
Market sophistication 57.2 22 ◆
4.1 Credit 66.1 9 ● ◆
4.1.1 Ease of getting credit* 80.0 23
4.1.2 Domestic credit to private sector, % GDP 137.9 12 ● ◆
4.1.3 Microfinance gross loans, % GDP 3.1 11 ●
4.2 Investment 20.6 111 ○
4.2.1 Ease of protecting minority investors* 54.0 88
4.2.2 Market capitalization, % GDP 55.8 31
4.2.3 Venture capital investors, deals/bn PPP$ GDP 0.0 71
4.2.4 Venture capital recipients, deals/bn PPP$ GDP 0.0 54
4.3 Trade, diversification, and market scale 85.0 15 ● ◆
4.3.1 Applied tariff rate, weighted avg., % 1.7 21 ◆
4.3.2 Domestic industry diversification 98.3 9 ● ◆
4.3.3 Domestic market scale, bn PPP$ 1,047.3 23 ◆
NOTES: ● indicates a strength; ○ a weakness; ◆ an income group strength; ◇ an income group weakness; * an index; †
a survey question. indicates that
the
economy’s data are older than the base year; see appendices for details, including the year of the data, at http://globalinnovationindex.org. Square
brackets [ ] indicate
that the data minimum coverage (DMC) requirements were not met at the sub-pillar or pillar level.](https://image.slidesharecdn.com/e-220805033615-e8521670/75/E-INDEX-2021-pdf-190-2048.jpg)
![171
GII 2021 Economy profiles
Yemen GII 2021 rank
131
Output rank Input rank Income Region Population (mn) GDP, PPP$ (bn) GDP per capita, PPP$ GII 2020 rank
125 132 Low NAWA 29.8 62.7 1,931 131
Score/
Value Rank
Business sophistication 18.6 102
5.1 Knowledge workers 11.4 [123]
5.1.1 Knowledge-intensive employment, % 12.4 102
5.1.2 Firms offering formal training, % 14.3 91 ◇
5.1.3 GERD performed by business, % GDP n/a n/a
5.1.4 GERD financed by business, % n/a n/a
5.1.5 Females employed w/advanced degrees, % 1.1 113
5.2 Innovation linkages 12.1 124
5.2.1 University-industry RD collaboration†
17.0 127 ○ ◇
5.2.2 State of cluster development and depth†
31.0 122 ◇
5.2.3 GERD financed by abroad, % GDP n/a n/a
5.2.4 Joint venture/strategic alliance deals/bn PPP$ GDP 0.0 103
5.2.5 Patent families/bn PPP$ GDP 0.0 100 ○ ◇
5.3 Knowledge absorption 32.5 50 ● ◆
5.3.1 Intellectual property payments, % total trade 3.3 5 ● ◆
5.3.2 High-tech imports, % total trade 2.4 127 ◇
5.3.3 ICT services imports, % total trade 0.3 122 ◇
5.3.4 FDI net inflows, % GDP −1.3 124 ◇
5.3.5 Research talent, % in businesses n/a n/a
Knowledge and technology outputs 7.2 126 ◇
6.1 Knowledge creation 6.6 97
6.1.1 Patents by origin/bn PPP$ GDP 0.9 66 ● ◆
6.1.2 PCT patents by origin/bn PPP$ GDP n/a n/a
6.1.3 Utility models by origin/bn PPP$ GDP 0.0 69
6.1.4 Scientific and technical articles/bn PPP$ GDP 10.6 81 ●
6.1.5 Citable documents H-index 3.3 121
6.2 Knowledge impact 10.1 123
6.2.1 Labor productivity growth, % −3.7 114 ◇
6.2.2 New businesses/th pop. 15–64 n/a n/a
6.2.3 Software spending, % GDP 0.1 99
6.2.4 ISO 9001 quality certificates/bn PPP$ GDP 0.2 131
6.2.5 High-tech manufacturing, % 1.2 110 ○ ◇
6.3 Knowledge diffusion 5.1 120
6.3.1 Intellectual property receipts, % total trade 0.0 82
6.3.2 Production and export complexity 13.6 116 ◇
6.3.3 High-tech exports, % total trade 0.1 124
6.3.4 ICT services exports, % total trade 0.9 84 ●
Creative outputs 12.2 114
7.1 Intangible assets 22.4 91 ●
7.1.1 Trademarks by origin/bn PPP$ GDP 66.5 28 ● ◆
7.1.2 Global brand value, top 5,000, % GDP 0.0 80 ○ ◇
7.1.3 Industrial designs by origin/bn PPP$ GDP 0.7 78 ●
7.1.4 ICTs and organizational model creation†
21.7 125 ○ ◇
7.2 Creative goods and services 0.0 [132]
7.2.1 Cultural and creative services exports, % total trade n/a n/a
7.2.2 National feature films/mn pop. 15–69 n/a n/a
7.2.3 Entertainment and media market/th pop. 15–69 0.0 63 ○
7.2.4 Printing and other media, % manufacturing n/a n/a
7.2.5 Creative goods exports, % total trade 0.0 128
7.3 Online creativity 3.8 126
7.3.1 Generic top-level domains (TLDs)/th pop. 15–69 0.4 114
7.3.2 Country-code TLDs/th pop. 15–69 0.0 130
7.3.3 Wikipedia edits/mn pop. 15–69 19.1 125
7.3.4 Mobile app creation/bn PPP$ GDP 0.2 84 ◆
Score/
Value Rank
Institutions 27.6 132 ○ ◇
1.1 Political environment 0.0 132 ○ ◇
1.1.1 Political and operational stability* 0.0 132 ○ ◇
1.1.2 Government effectiveness* 0.0 132 ○ ◇
1.2 Regulatory environment 30.8 127 ◇
1.2.1 Regulatory quality* 0.0 132 ○ ◇
1.2.2 Rule of law* 0.0 132 ○ ◇
1.2.3 Cost of redundancy dismissal 27.4 110 ◇
1.3 Business environment 51.9 124 ◇
1.3.1 Ease of starting a business* 76.8 116
1.3.2 Ease of resolving insolvency* 26.9 125 ◇
Human capital and research 10.1[127]
2.1 Education 22.0 [126]
2.1.1 Expenditure on education, % GDP n/a n/a
2.1.2 Government funding/pupil, secondary, % GDP/cap 11.8 86
2.1.3 School life expectancy, years 9.1 112
2.1.4 PISA scales in reading, maths and science n/a n/a
2.1.5 Pupil-teacher ratio, secondary 26.8 110
2.2 Tertiary education 8.4 115
2.2.1 Tertiary enrolment, % gross 10.2 113
2.2.2 Graduates in science and engineering, % n/a n/a
2.2.3 Tertiary inbound mobility, % 4.3 56 ●
2.3 Research and development (RD) 0.0 [123]
2.3.1 Researchers, FTE/mn pop. n/a n/a
2.3.2 Gross expenditure on RD, % GDP n/a n/a
2.3.3 Global corporate RD investors, top 3, mn US$ 0.0 41 ○ ◇
2.3.4 QS university ranking, top 3* 0.0 74 ○ ◇
Infrastructure 19.8 129
3.1 Informationandcommunicationtechnologies(ICTs) 25.2 130
3.1.1 ICT access* 25.7 126
3.1.2 ICT use* 11.7 128
3.1.3 Government’s online service* 32.4 123
3.1.4 E-participation* 31.0 124
3.2 General infrastructure 2.6 132 ○ ◇
3.2.1 Electricity output, GWh/mn pop. 126.6 120
3.2.2 Logistics performance* 10.2 120
3.2.3 Gross capital formation, % GDP 6.4 126 ○ ◇
3.3 Ecological sustainability 31.5 53 ● ◆
3.3.1 GDP/unit of energy use 21.1 7 ● ◆
3.3.2 Environmental performance* n/a n/a
3.3.3 ISO 14001 environmental certificates/bn PPP$ GDP 0.1 123
Market sophistication 29.0 125
4.1 Credit 0.3 132 ○ ◇
4.1.1 Ease of getting credit* 0.0 132 ○ ◇
4.1.2 Domestic credit to private sector, % GDP 5.6 130 ○ ◇
4.1.3 Microfinance gross loans, % GDP 0.1 61
4.2 Investment 26.0 [80]
4.2.1 Ease of protecting minority investors* 26.0 126
4.2.2 Market capitalization, % GDP n/a n/a
4.2.3 Venture capital investors, deals/bn PPP$ GDP n/a n/a
4.2.4 Venture capital recipients, deals/bn PPP$ GDP n/a n/a
4.3 Trade, diversification, and market scale 60.6 92 ● ◆
4.3.1 Applied tariff rate, weighted avg., % 5.0 87 ●
4.3.2 Domestic industry diversification 75.1 91
4.3.3 Domestic market scale, bn PPP$ 62.7 94 ●
NOTES: ● indicates a strength; ○ a weakness; ◆ an income group strength; ◇ an income group weakness; * an index; †
a survey question. indicates that
the
economy’s data are older than the base year; see appendices for details, including the year of the data, at http://globalinnovationindex.org. Square
brackets [ ] indicate
that the data minimum coverage (DMC) requirements were not met at the sub-pillar or pillar level.](https://image.slidesharecdn.com/e-220805033615-e8521670/75/E-INDEX-2021-pdf-191-2048.jpg)
![172 Global Innovation Index 2021
Zambia GII 2021 rank
121
Output rank Input rank Income Region Population (mn) GDP, PPP$ (bn) GDP per capita, PPP$ GII 2020 rank
127 111 Lower middle SSF 18.4 62.4 3,302 122
Score/
Value Rank
Business sophistication 22.0 83
5.1 Knowledge workers 31.5 [65]
5.1.1 Knowledge-intensive employment, % 19.1 81
5.1.2 Firms offering formal training, % 36.6 37 ●
5.1.3 GERD performed by business, % GDP n/a n/a
5.1.4 GERD financed by business, % n/a n/a
5.1.5 Females employed w/advanced degrees, % 6.2 88
5.2 Innovation linkages 17.8 86
5.2.1 University-industry RD collaboration†
32.2 105
5.2.2 State of cluster development and depth†
42.1 95
5.2.3 GERD financed by abroad, % GDP n/a n/a
5.2.4 Joint venture/strategic alliance deals/bn PPP$ GDP 0.0 91
5.2.5 Patent families/bn PPP$ GDP 0.0 89
5.3 Knowledge absorption 16.6 107
5.3.1 Intellectual property payments, % total trade 0.2 93
5.3.2 High-tech imports, % total trade 5.1 112
5.3.3 ICT services imports, % total trade 0.9 82
5.3.4 FDI net inflows, % GDP 2.7 63 ●
5.3.5 Research talent, % in businesses n/a n/a
Knowledge and technology outputs 9.0 120
6.1 Knowledge creation 5.8 106
6.1.1 Patents by origin/bn PPP$ GDP 0.0 123 ○
6.1.2 PCT patents by origin/bn PPP$ GDP 0.0 92
6.1.3 Utility models by origin/bn PPP$ GDP n/a n/a
6.1.4 Scientific and technical articles/bn PPP$ GDP 8.8 95
6.1.5 Citable documents H-index 6.9 90
6.2 Knowledge impact 14.1 117
6.2.1 Labor productivity growth, % −1.8 98 ◇
6.2.2 New businesses/th pop. 15–64 1.1 82
6.2.3 Software spending, % GDP 0.0 113 ◇
6.2.4 ISO 9001 quality certificates/bn PPP$ GDP 0.5 120
6.2.5 High-tech manufacturing, % 10.1 88
6.3 Knowledge diffusion 7.1 108
6.3.1 Intellectual property receipts, % total trade n/a n/a
6.3.2 Production and export complexity 29.6 93
6.3.3 High-tech exports, % total trade 0.3 101
6.3.4 ICT services exports, % total trade 0.2 119
Creative outputs 9.5 125 ○ ◇
7.1 Intangible assets 14.8 120
7.1.1 Trademarks by origin/bn PPP$ GDP 16.8 97
7.1.2 Global brand value, top 5,000, % GDP 0.0 80 ○ ◇
7.1.3 Industrial designs by origin/bn PPP$ GDP 0.9 75 ●
7.1.4 ICTs and organizational model creation†
37.3 119 ○ ◇
7.2 Creative goods and services 0.8 [130]
7.2.1 Cultural and creative services exports, % total trade 0.0 112 ○
7.2.2 National feature films/mn pop. 15–69 n/a n/a
7.2.3 Entertainment and media market/th pop. 15–69 n/a n/a
7.2.4 Printing and other media, % manufacturing n/a n/a
7.2.5 Creative goods exports, % total trade 0.1 99
7.3 Online creativity 7.7 109
7.3.1 Generic top-level domains (TLDs)/th pop. 15–69 0.1 124 ○
7.3.2 Country-code TLDs/th pop. 15–69 0.1 115
7.3.3 Wikipedia edits/mn pop. 15–69 26.2 110
7.3.4 Mobile app creation/bn PPP$ GDP n/a n/a
Score/
Value Rank
Institutions 44.4 125 ○ ◇
1.1 Political environment 42.2 108
1.1.1 Political and operational stability* 55.4 112
1.1.2 Government effectiveness* 35.6 108
1.2 Regulatory environment 23.8 129 ○ ◇
1.2.1 Regulatory quality* 29.0 105
1.2.2 Rule of law* 34.5 92
1.2.3 Cost of redundancy dismissal 50.6 128 ○ ◇
1.3 Business environment 67.1 78 ●
1.3.1 Ease of starting a business* 84.9 90
1.3.2 Ease of resolving insolvency* 49.3 71 ●
Human capital and research 17.9[107]
2.1 Education 51.4 [65]
2.1.1 Expenditure on education, % GDP 4.6 54 ●
2.1.2 Government funding/pupil, secondary, % GDP/cap n/a n/a
2.1.3 School life expectancy, years n/a n/a
2.1.4 PISA scales in reading, maths and science n/a n/a
2.1.5 Pupil-teacher ratio, secondary 21.1 98
2.2 Tertiary education 2.3 [127]
2.2.1 Tertiary enrolment, % gross 4.1 126 ○ ◇
2.2.2 Graduates in science and engineering, % n/a n/a
2.2.3 Tertiary inbound mobility, % n/a n/a
2.3 Research and development (RD) 0.0 [123]
2.3.1 Researchers, FTE/mn pop. n/a n/a
2.3.2 Gross expenditure on RD, % GDP n/a n/a
2.3.3 Global corporate RD investors, top 3, mn US$ 0.0 41 ○ ◇
2.3.4 QS university ranking, top 3* 0.0 74 ○ ◇
Infrastructure 24.9 119 ◇
3.1 Informationandcommunicationtechnologies(ICTs) 28.5 126 ○ ◇
3.1.1 ICT access* 35.3 116
3.1.2 ICT use* 22.1 111
3.1.3 Government’s online service* 25.9 128 ○ ◇
3.1.4 E-participation* 31.0 124 ○ ◇
3.2 General infrastructure 30.7 59 ●
3.2.1 Electricity output, GWh/mn pop. 933.0 99
3.2.2 Logistics performance* 22.3 105
3.2.3 Gross capital formation, % GDP 35.3 12 ●
3.3 Ecological sustainability 15.3 125 ○ ◇
3.3.1 GDP/unit of energy use 5.5 113
3.3.2 Environmental performance* 34.7 103
3.3.3 ISO 14001 environmental certificates/bn PPP$ GDP 0.2 112
Market sophistication 42.9 87
4.1 Credit 40.0 71 ●
4.1.1 Ease of getting credit* 95.0 4 ● ◆
4.1.2 Domestic credit to private sector, % GDP 15.6 118
4.1.3 Microfinance gross loans, % GDP 0.1 63
4.2 Investment 24.6 84
4.2.1 Ease of protecting minority investors* 60.0 71 ●
4.2.2 Market capitalization, % GDP 13.6 66
4.2.3 Venture capital investors, deals/bn PPP$ GDP n/a n/a
4.2.4 Venture capital recipients, deals/bn PPP$ GDP 0.0 46 ●
4.3 Trade, diversification, and market scale 64.0 77 ●
4.3.1 Applied tariff rate, weighted avg., % 3.4 65 ●
4.3.2 Domestic industry diversification 79.1 81
4.3.3 Domestic market scale, bn PPP$ 62.3 95
NOTES: ● indicates a strength; ○ a weakness; ◆ an income group strength; ◇ an income group weakness; * an index; †
a survey question. indicates that
the
economy’s data are older than the base year; see appendices for details, including the year of the data, at http://globalinnovationindex.org. Square
brackets [ ] indicate
that the data minimum coverage (DMC) requirements were not met at the sub-pillar or pillar level.](https://image.slidesharecdn.com/e-220805033615-e8521670/75/E-INDEX-2021-pdf-192-2048.jpg)
![173
GII 2021 Economy profiles
Zimbabwe GII 2021 rank
113
Output rank Input rank Income Region Population (mn) GDP, PPP$ (bn) GDP per capita, PPP$ GII 2020 rank
105 116 Lower middle SSF 14.9 39.2 2,583 120
Score/
Value Rank
Business sophistication 18.7 101
5.1 Knowledge workers 22.3 [96]
5.1.1 Knowledge-intensive employment, % 12.8 101
5.1.2 Firms offering formal training, % 26.4 59
5.1.3 GERD performed by business, % GDP n/a n/a
5.1.4 GERD financed by business, % n/a n/a
5.1.5 Females employed w/advanced degrees, % 7.5 84
5.2 Innovation linkages 17.5 91
5.2.1 University-industry RD collaboration†
29.0 115
5.2.2 State of cluster development and depth†
31.4 121 ◇
5.2.3 GERD financed by abroad, % GDP n/a n/a
5.2.4 Joint venture/strategic alliance deals/bn PPP$ GDP 0.1 33 ● ◆
5.2.5 Patent families/bn PPP$ GDP 0.0 100 ○ ◇
5.3 Knowledge absorption 16.4 108
5.3.1 Intellectual property payments, % total trade 0.1 109
5.3.2 High-tech imports, % total trade 6.7 83
5.3.3 ICT services imports, % total trade 0.7 94
5.3.4 FDI net inflows, % GDP 1.8 83
5.3.5 Research talent, % in businesses n/a n/a
Knowledge and technology outputs 11.7 109
6.1 Knowledge creation 9.2 84
6.1.1 Patents by origin/bn PPP$ GDP 0.2 97
6.1.2 PCT patents by origin/bn PPP$ GDP 0.1 74
6.1.3 Utility models by origin/bn PPP$ GDP n/a n/a
6.1.4 Scientific and technical articles/bn PPP$ GDP 15.1 57 ●
6.1.5 Citable documents H-index 7.5 87
6.2 Knowledge impact 20.2 103
6.2.1 Labor productivity growth, % −4.2 117 ◇
6.2.2 New businesses/th pop. 15–64 2.1 54 ●
6.2.3 Software spending, % GDP 0.2 69
6.2.4 ISO 9001 quality certificates/bn PPP$ GDP 3.7 67
6.2.5 High-tech manufacturing, % 21.7 59
6.3 Knowledge diffusion 5.6 117
6.3.1 Intellectual property receipts, % total trade 0.0 77
6.3.2 Production and export complexity 22.4 106
6.3.3 High-tech exports, % total trade 0.6 88
6.3.4 ICT services exports, % total trade 0.3 109
Creative outputs 15.7 101
7.1 Intangible assets 12.0 126 ◇
7.1.1 Trademarks by origin/bn PPP$ GDP 4.0 126 ○
7.1.2 Global brand value, top 5,000, % GDP 14.9 54 ●
7.1.3 Industrial designs by origin/bn PPP$ GDP n/a n/a
7.1.4 ICTs and organizational model creation†
29.7 123 ○ ◇
7.2 Creative goods and services 29.8 [24]
7.2.1 Cultural and creative services exports, % total trade n/a n/a
7.2.2 National feature films/mn pop. 15–69 n/a n/a
7.2.3 Entertainment and media market/th pop. 15–69 n/a n/a
7.2.4 Printing and other media, % manufacturing 0.5 82
7.2.5 Creative goods exports, % total trade 3.5 15 ● ◆
7.3 Online creativity 9.0 101
7.3.1 Generic top-level domains (TLDs)/th pop. 15–69 0.5 111
7.3.2 Country-code TLDs/th pop. 15–69 0.8 91
7.3.3 Wikipedia edits/mn pop. 15–69 28.7 108
7.3.4 Mobile app creation/bn PPP$ GDP n/a n/a
Score/
Value Rank
Institutions 40.7 129 ◇
1.1 Political environment 32.0 131 ○ ◇
1.1.1 Political and operational stability* 48.2 127 ◇
1.1.2 Government effectiveness* 23.9 131 ○ ◇
1.2 Regulatory environment 37.6 123
1.2.1 Regulatory quality* 5.2 131 ○ ◇
1.2.2 Rule of law* 13.6 131 ○ ◇
1.2.3 Cost of redundancy dismissal 25.3 105
1.3 Business environment 52.4 122
1.3.1 Ease of starting a business* 72.0 121 ◇
1.3.2 Ease of resolving insolvency* 32.9 115
Human capital and research 24.6 88
2.1 Education 46.8 76
2.1.1 Expenditure on education, % GDP 5.9 17 ● ◆
2.1.2 Government funding/pupil, secondary, % GDP/cap 22.2 33 ●
2.1.3 School life expectancy, years 11.4 98
2.1.4 PISA scales in reading, maths and science n/a n/a
2.1.5 Pupil-teacher ratio, secondary 22.5 103
2.2 Tertiary education 26.6 81
2.2.1 Tertiary enrolment, % gross 10.0 114
2.2.2 Graduates in science and engineering, % 30.2 16 ●
2.2.3 Tertiary inbound mobility, % 0.5 98
2.3 Research and development (RD) 0.3 115
2.3.1 Researchers, FTE/mn pop. 99.5 88
2.3.2 Gross expenditure on RD, % GDP n/a n/a
2.3.3 Global corporate RD investors, top 3, mn US$ 0.0 41 ○ ◇
2.3.4 QS university ranking, top 3* 0.0 74 ○ ◇
Infrastructure 19.8 128 ◇
3.1 Informationandcommunicationtechnologies(ICTs) 40.8 108
3.1.1 ICT access* 38.4 110
3.1.2 ICT use* 27.0 106
3.1.3 Government’s online service* 52.3 99
3.1.4 E-participation* 45.2 108
3.2 General infrastructure 2.9 131 ○ ◇
3.2.1 Electricity output, GWh/mn pop. 652.3 105
3.2.2 Logistics performance* 3.4 123 ○ ◇
3.2.3 Gross capital formation, % GDP n/a n/a
3.3 Ecological sustainability 15.9 121
3.3.1 GDP/unit of energy use 3.5 122 ○ ◇
3.3.2 Environmental performance* 37.0 100
3.3.3 ISO 14001 environmental certificates/bn PPP$ GDP 1.2 63 ● ◆
Market sophistication 46.7 64 ●
4.1 Credit 34.1 92
4.1.1 Ease of getting credit* 65.0 61
4.1.2 Domestic credit to private sector, % GDP 51.8 64 ●
4.1.3 Microfinance gross loans, % GDP 0.0 71
4.2 Investment 54.0 [17]
4.2.1 Ease of protecting minority investors* 54.0 88
4.2.2 Market capitalization, % GDP n/a n/a
4.2.3 Venture capital investors, deals/bn PPP$ GDP n/a n/a
4.2.4 Venture capital recipients, deals/bn PPP$ GDP n/a n/a
4.3 Trade, diversification, and market scale 51.9 113
4.3.1 Applied tariff rate, weighted avg., % 5.0 86
4.3.2 Domestic industry diversification 58.2 104 ◇
4.3.3 Domestic market scale, bn PPP$ 39.2 111
NOTES: ● indicates a strength; ○ a weakness; ◆ an income group strength; ◇ an income group weakness; * an index; †
a survey question. indicates that
the
economy’s data are older than the base year; see appendices for details, including the year of the data, at http://globalinnovationindex.org. Square
brackets [ ] indicate
that the data minimum coverage (DMC) requirements were not met at the sub-pillar or pillar level.](https://image.slidesharecdn.com/e-220805033615-e8521670/75/E-INDEX-2021-pdf-193-2048.jpg)

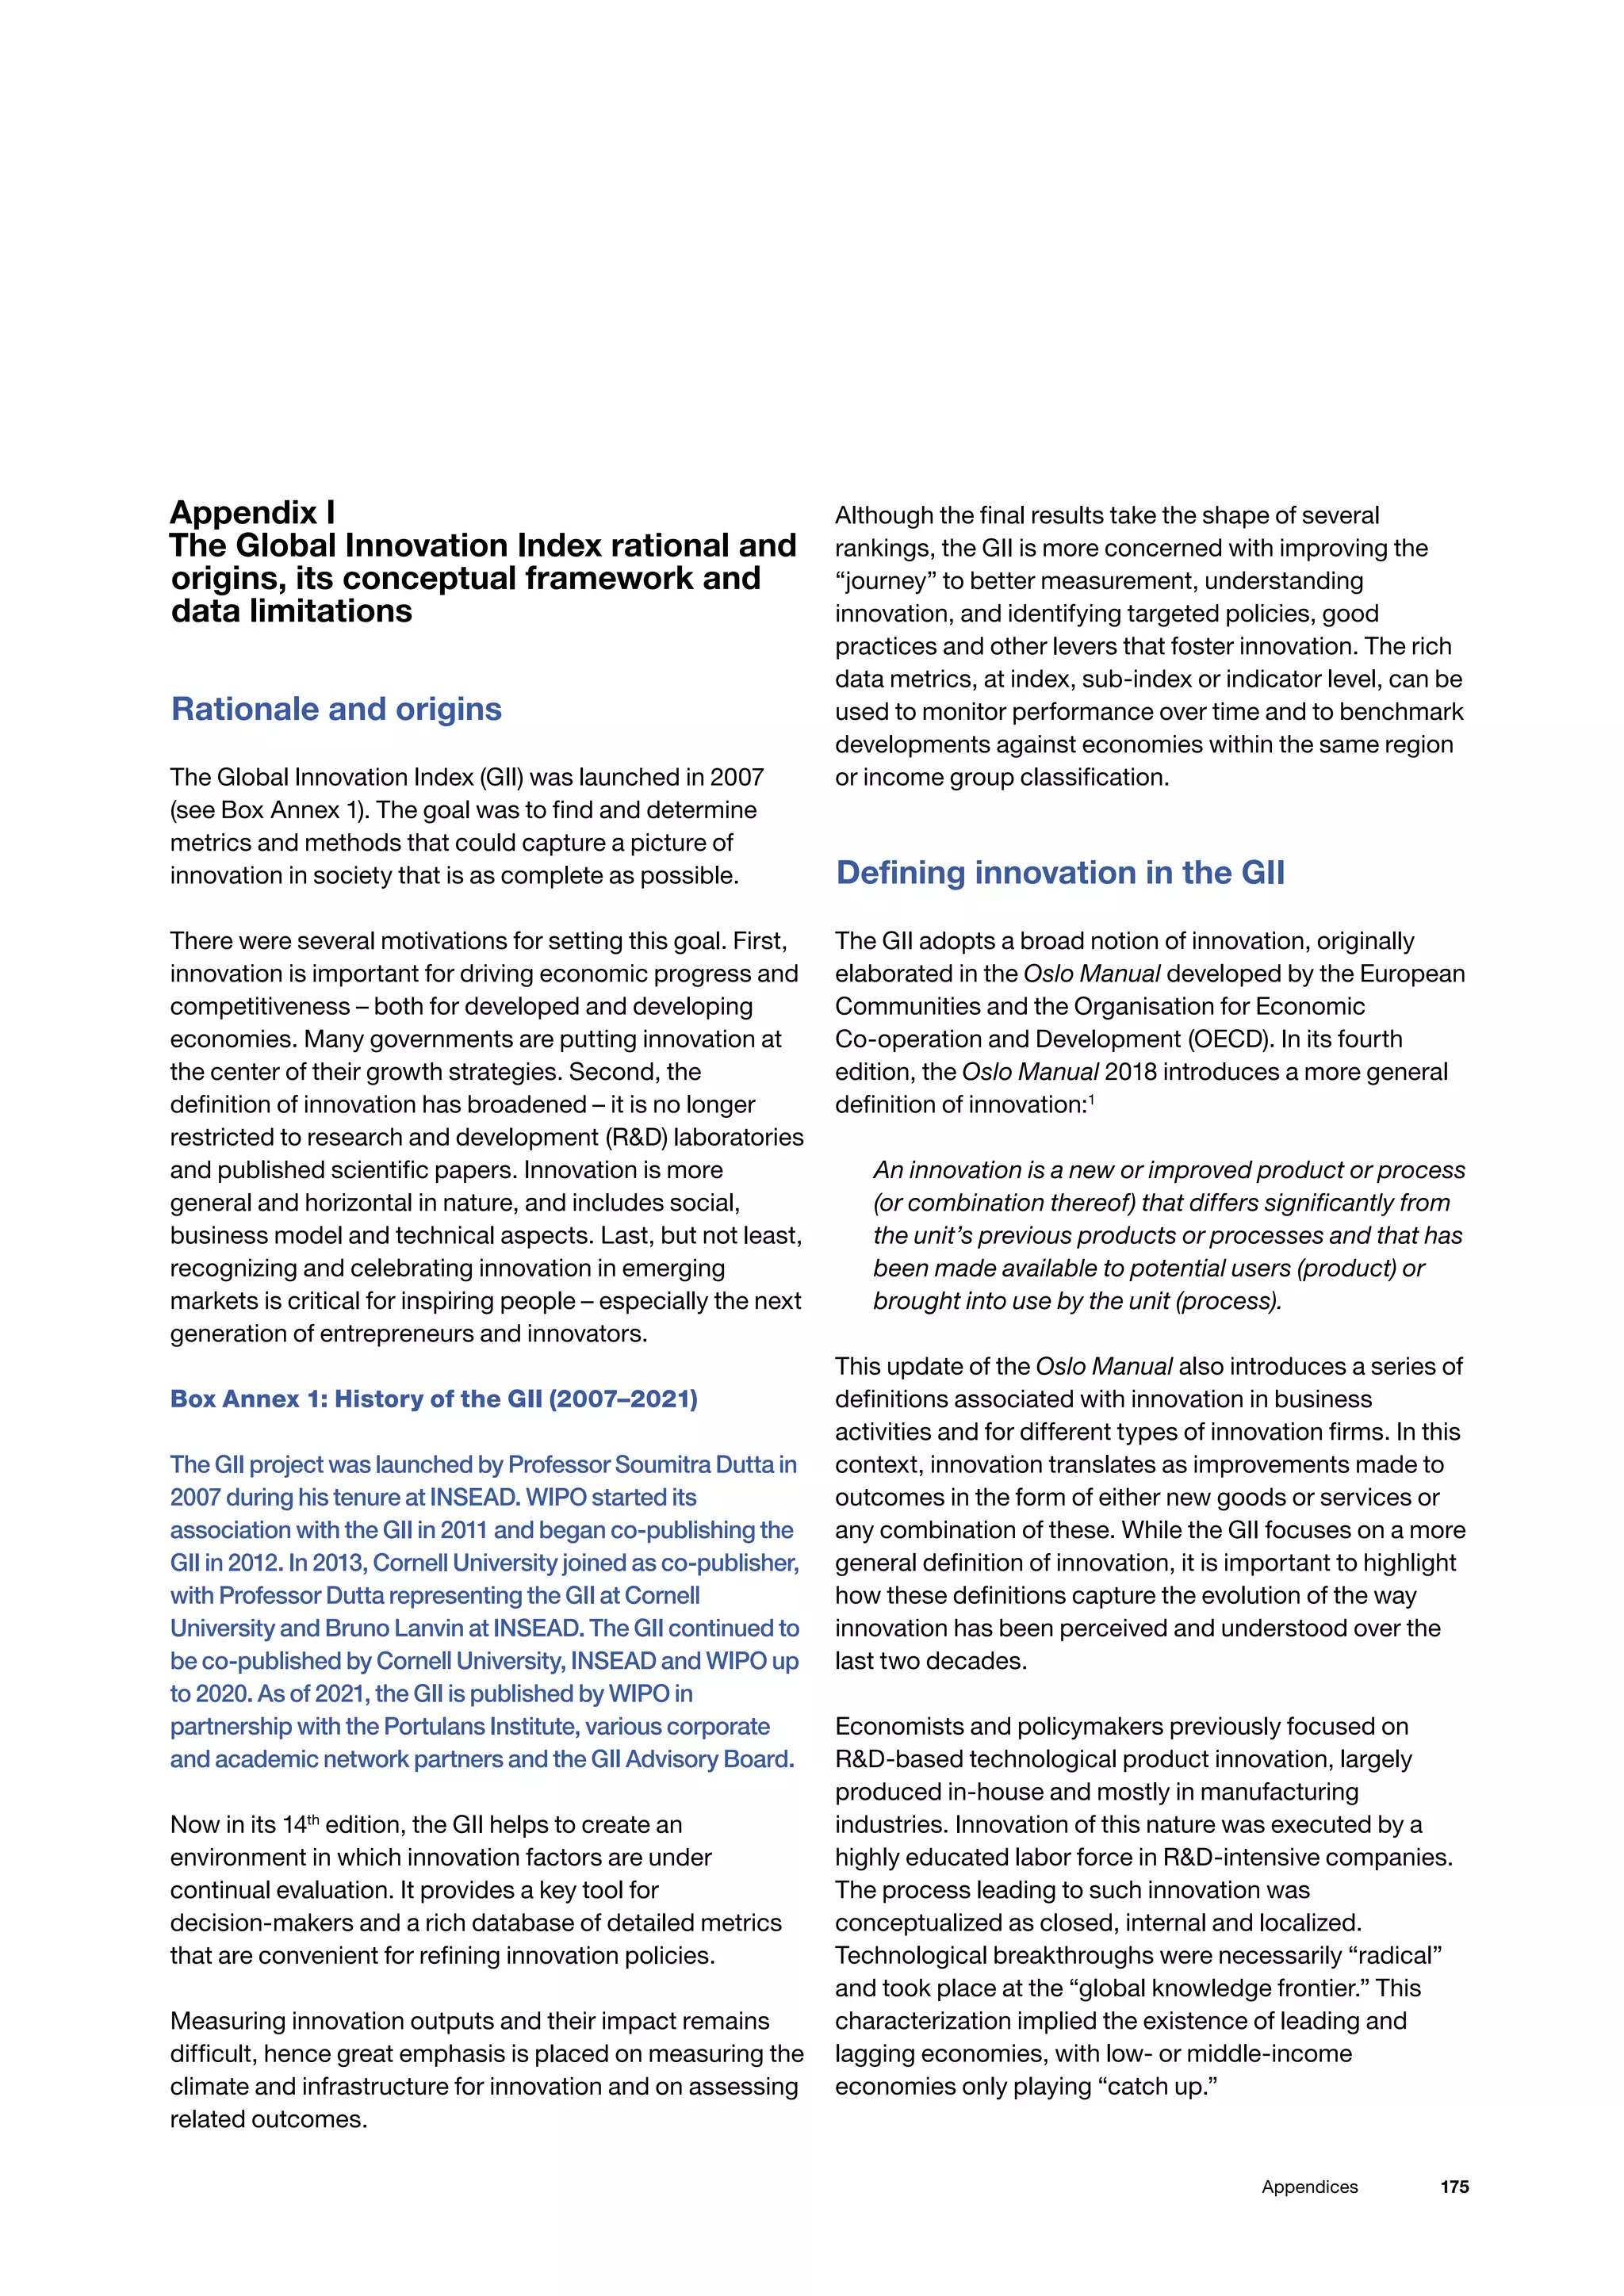

![177
Appendices
are from 2019, 17.5% are from 2018, 5.9% are from 2017,
1.2% are from 2016, and the small remainder of 4.0% are
from earlier years.5
The GII 2021 model includes 81 indicators, which fall into
three categories:
• quantitative/objective/hard data (63 indicators);
• composite indicators/index data (15 indicators); and
• survey/qualitative/subjective/soft data (3 indicators).
This year, for an economy to feature in the GII 2021, the
minimum symmetric data coverage is at least 36 indicators
in the Innovation Input Sub-Index (66%) and 18 indicators in
the Innovation Output Sub-Index (66%), with scores for at
least two sub-pillars per pillar. In the GII 2021, 132
economies had sufficient data available to be included in
the Index. For each economy, only the most recent yearly
data were considered. As a rule, the GII indicators consider
data from as far back as 2011, with a few exceptions.
Missing values
For the sake of transparency and replicability of results,
missing values are not estimated; they are indicated with
“n/a” and are not considered in the sub-pillar score. In
return, the European Commission’s Competence Centre
on Composite Indicators and Scoreboards at the Joint
Research Centre (JRC-COIN) audit (see Appendix II)
assesses the robustness of the GII modeling choices (no
imputation of missing data, fixed predefined weights and
arithmetic averages) by imputing missing data, applying
random weights and using geometric averages. Since
2012, based on this assessment, a confidence interval has
been provided for each ranking in the GII as well as the
Input and Output Sub-Indices (Appendix II).
Treatment of series with outliers
Potentially problematic indicators with outliers that could
polarize results and unduly bias the rankings were treated
according to the rules listed below, as per the
recommendations of the JRC-COIN. Only hard data
indicators were treated (32 out of 63).
First rule: selection
Problematic indicators were identified by skewness and
kurtosis. The problematic indicators had:
• an absolute value of skewness greater than 2.25; and
• a kurtosis greater than 3.5.6
Second rule: treatment
Indicators with one to five outliers (30 cases) were
winsorized; the values distorting the indicator distribution
were assigned the next highest value, up to the level
where skewness and/or kurtosis had the values
specified above.7
Indicators with five or more outliers and for which
skewness or kurtosis did not enter within the ranges
specified above were transformed using natural
logarithms after multiplication by a given factor f.8
Since
only “goods” were affected (i.e., indicators for which
higher values indicate better outcomes, as opposed to
“bads”), the following formula was used:
where “min” and “max” are the minimum and maximum
indicator sample values.9
Normalization
The 81 indicators were then normalized into the [0, 100]
range, with higher scores representing better outcomes.
Normalization was according to the min–max method,
where the “min” and “max” values were the minimum and
maximum indicator sample values, respectively. Index
and survey data were exceptions; the original series range
of values was kept as min and max values ([0, 1] for
UNPAN indices; [1, 7] for the World Economic Forum
Executive Opinion Survey questions; [0, 100] for World
Bank’s World Governance Indicators; etc.). The following
formulas were applied:
Goods:
Bads:
Caveats on the year-to-year comparison
of rankings
The GII compares the performance of national innovation
systems across economies and presents the changes in
economy rankings over time.
Importantly, scores and rankings from one year to the next
are not directly comparable. Each ranking reflects the
relative positioning of a particular economy based on the
conceptual framework, the data coverage and the sample
of economies of that GII edition, also reflecting changes in
the underlying indicators at source and in data availability.
A few factors influence year-on-year rankings of
an economy:
• the actual performance of the economy in question;
• adjustments made to the GII framework (changes in
indicator composition and measurement revisions);
• data updates, the treatment of outliers, and missing
values; and
• the inclusion or exclusion of economies in the sample.](https://image.slidesharecdn.com/e-220805033615-e8521670/75/E-INDEX-2021-pdf-197-2048.jpg)
![178 Global Innovation Index 2021
Additionally, the following characteristics complicate the
time-series analysis based on simple GII rankings
or scores:
• Missing values. The GII produces relative index
scores, which means that a missing value for one
economy affects the index score of other economies.
Because the number of missing values decreases every
year, this problem reduces over time.
• Reference year. The data underlying the GII do not
refer to a single year but to several years, depending
on the latest available year for any given variable. In
addition, the reference years for different variables are
not the same for each economy, in an attempt to limit
the number of missing data points.
• Normalization factor. Most GII variables are
normalized using either GDP or population, with the
intention of enabling cross-economy comparability.
Yet, this implies that year-on-year changes in individual
indicators may be driven either by the variable
(numerator) or by its normalization factor (denominator).
• Consistent data collection. Measuring the change
in year-on-year performance relies on the consistent
collection of data over time. Changes in the definition
of variables or in the data collection process could
create movements in the rankings that are unrelated
to performance.
A detailed economy study based on the GII database and
the economy profile over time, coupled with analytical
work on the ground, including that of innovation actors
and decision-makers, yields the best results in terms of
monitoring an economy’s innovation performance, as well
as in identifying possible avenues for improvement.
Notes:
References
Arundel, A., S. Athreye and S. Wunsch-Vincent (2021). Harnessing Public
Research for Innovation in the 21st
Century: An International Assessment
of Knowledge Transfer Policies. Series: Intellectual Property,
Innovation and Economic Development. Geneva and Cambridge: World
Intellectual Property Organization and Cambridge University Press.
Cornell University, INSEAD and WIPO (World Intellectual Property
Organization) (2013). The Global Innovation Index 2013: The Local
Dynamics of Innovation, S. Dutta and B. Lanvin (eds). Ithaca,
NY, Fontainebleau and Geneva: Cornell, INSEAD and WIPO.
Eurostat and OECD (Organisation for Economic Co-operation
and Development) (2018). Oslo Manual: Guidelines for
Collecting and Interpreting Innovation Data (4th
ed.). Paris:
OECD. https://doi.org/10.1787/9789264304604-en.
Groeneveld, R. A. and G. Meeden (1984). Measuring
skewness and kurtosis. The Statistician, 33, 391–399.
Kraemer-Mbula E. and S. Wunsch-Vincent (2017). The Informal
Economy in Developing Nations: Hidden Engine of Innovation?
Series: Intellectual Property, Innovation and Economic Development.
Geneva and Cambridge: WIPO and Cambridge University Press.
WIPO (World Intellectual Property Organization) (2011–2021). World
Intellectual Property Report, various editions. Geneva: WIPO.
1 Eurostat and OECD, 2018.
2 See WIPO (2011–2021) for bi-annual elaborations on the changing
nature and geographic dispersion of innovation. See Arundel
et al. (2021) for an elaboration on the role and measurement of
knowledge and technology transfer between innovation actors.
3 On innovation in the informal economy, see Kraemer-Mbula
and Wunsch-Vincent (2017).
4 See WIPO (2020), Appendix 1: https://www.wipo.int/edocs/
pubdocs/en/wipo_pub_gii_2020-appendix1.pdf.
5 The GII is calculated based on 9,647 data points out of a
possible 10,692 (132 economies multiplied by 81 indicators),
implying that 9.8% of data points are missing. The Sources
and Definitions (Appendix III) include the range of years
used for each indicator. If an indicator for an economy is
missing, it is marked as “n/a” in the Economy profiles.
6 Based on Groeneveld and Meeden (1984), which sets
the criteria of absolute skewness above 1 and kurtosis
above 3.5. The skewness criterion was relaxed to account
for the small sample at hand (132 economies).
7 This distributional issue affects the following variables: 2.1.5, 3.2.1,
4.2.2, 5.2.3, 5.2.4, 5.3.2, 5.3.3, 5.3.4, 6.1.5, 7.2.2, 7.2.4 and 7.3.1 (1
outlier); 2.2.3, 5.3.1 and 7.1.3 (2 outliers); 4.2.4, 6.1.3, 6.3.4, 7.1.1,
7.2.1, 7.3.2 and 7.3.4 (3 outliers); 5.2.5, 6.3.1 and 7.2.5 (4 outliers);
and 4.2.3, 6.1.1, 6.1.2 and 6.3.3 (5 outliers). An exception was made
this year by also winsorizing an indicator that had six outliers: 4.1.3.
8 Indicators 2.3.3 and 4.3.3 were treated using
log-transformation (factor f of 1).
9 This formula achieves two things: converting all series into “goods”
and scaling the series to the range [1, max] so that natural logs are
positive starting at 0, where “min” and “max” are the minimum and
maximum indicator sample values. The corresponding formula for
“bads” is:](https://image.slidesharecdn.com/e-220805033615-e8521670/75/E-INDEX-2021-pdf-198-2048.jpg)
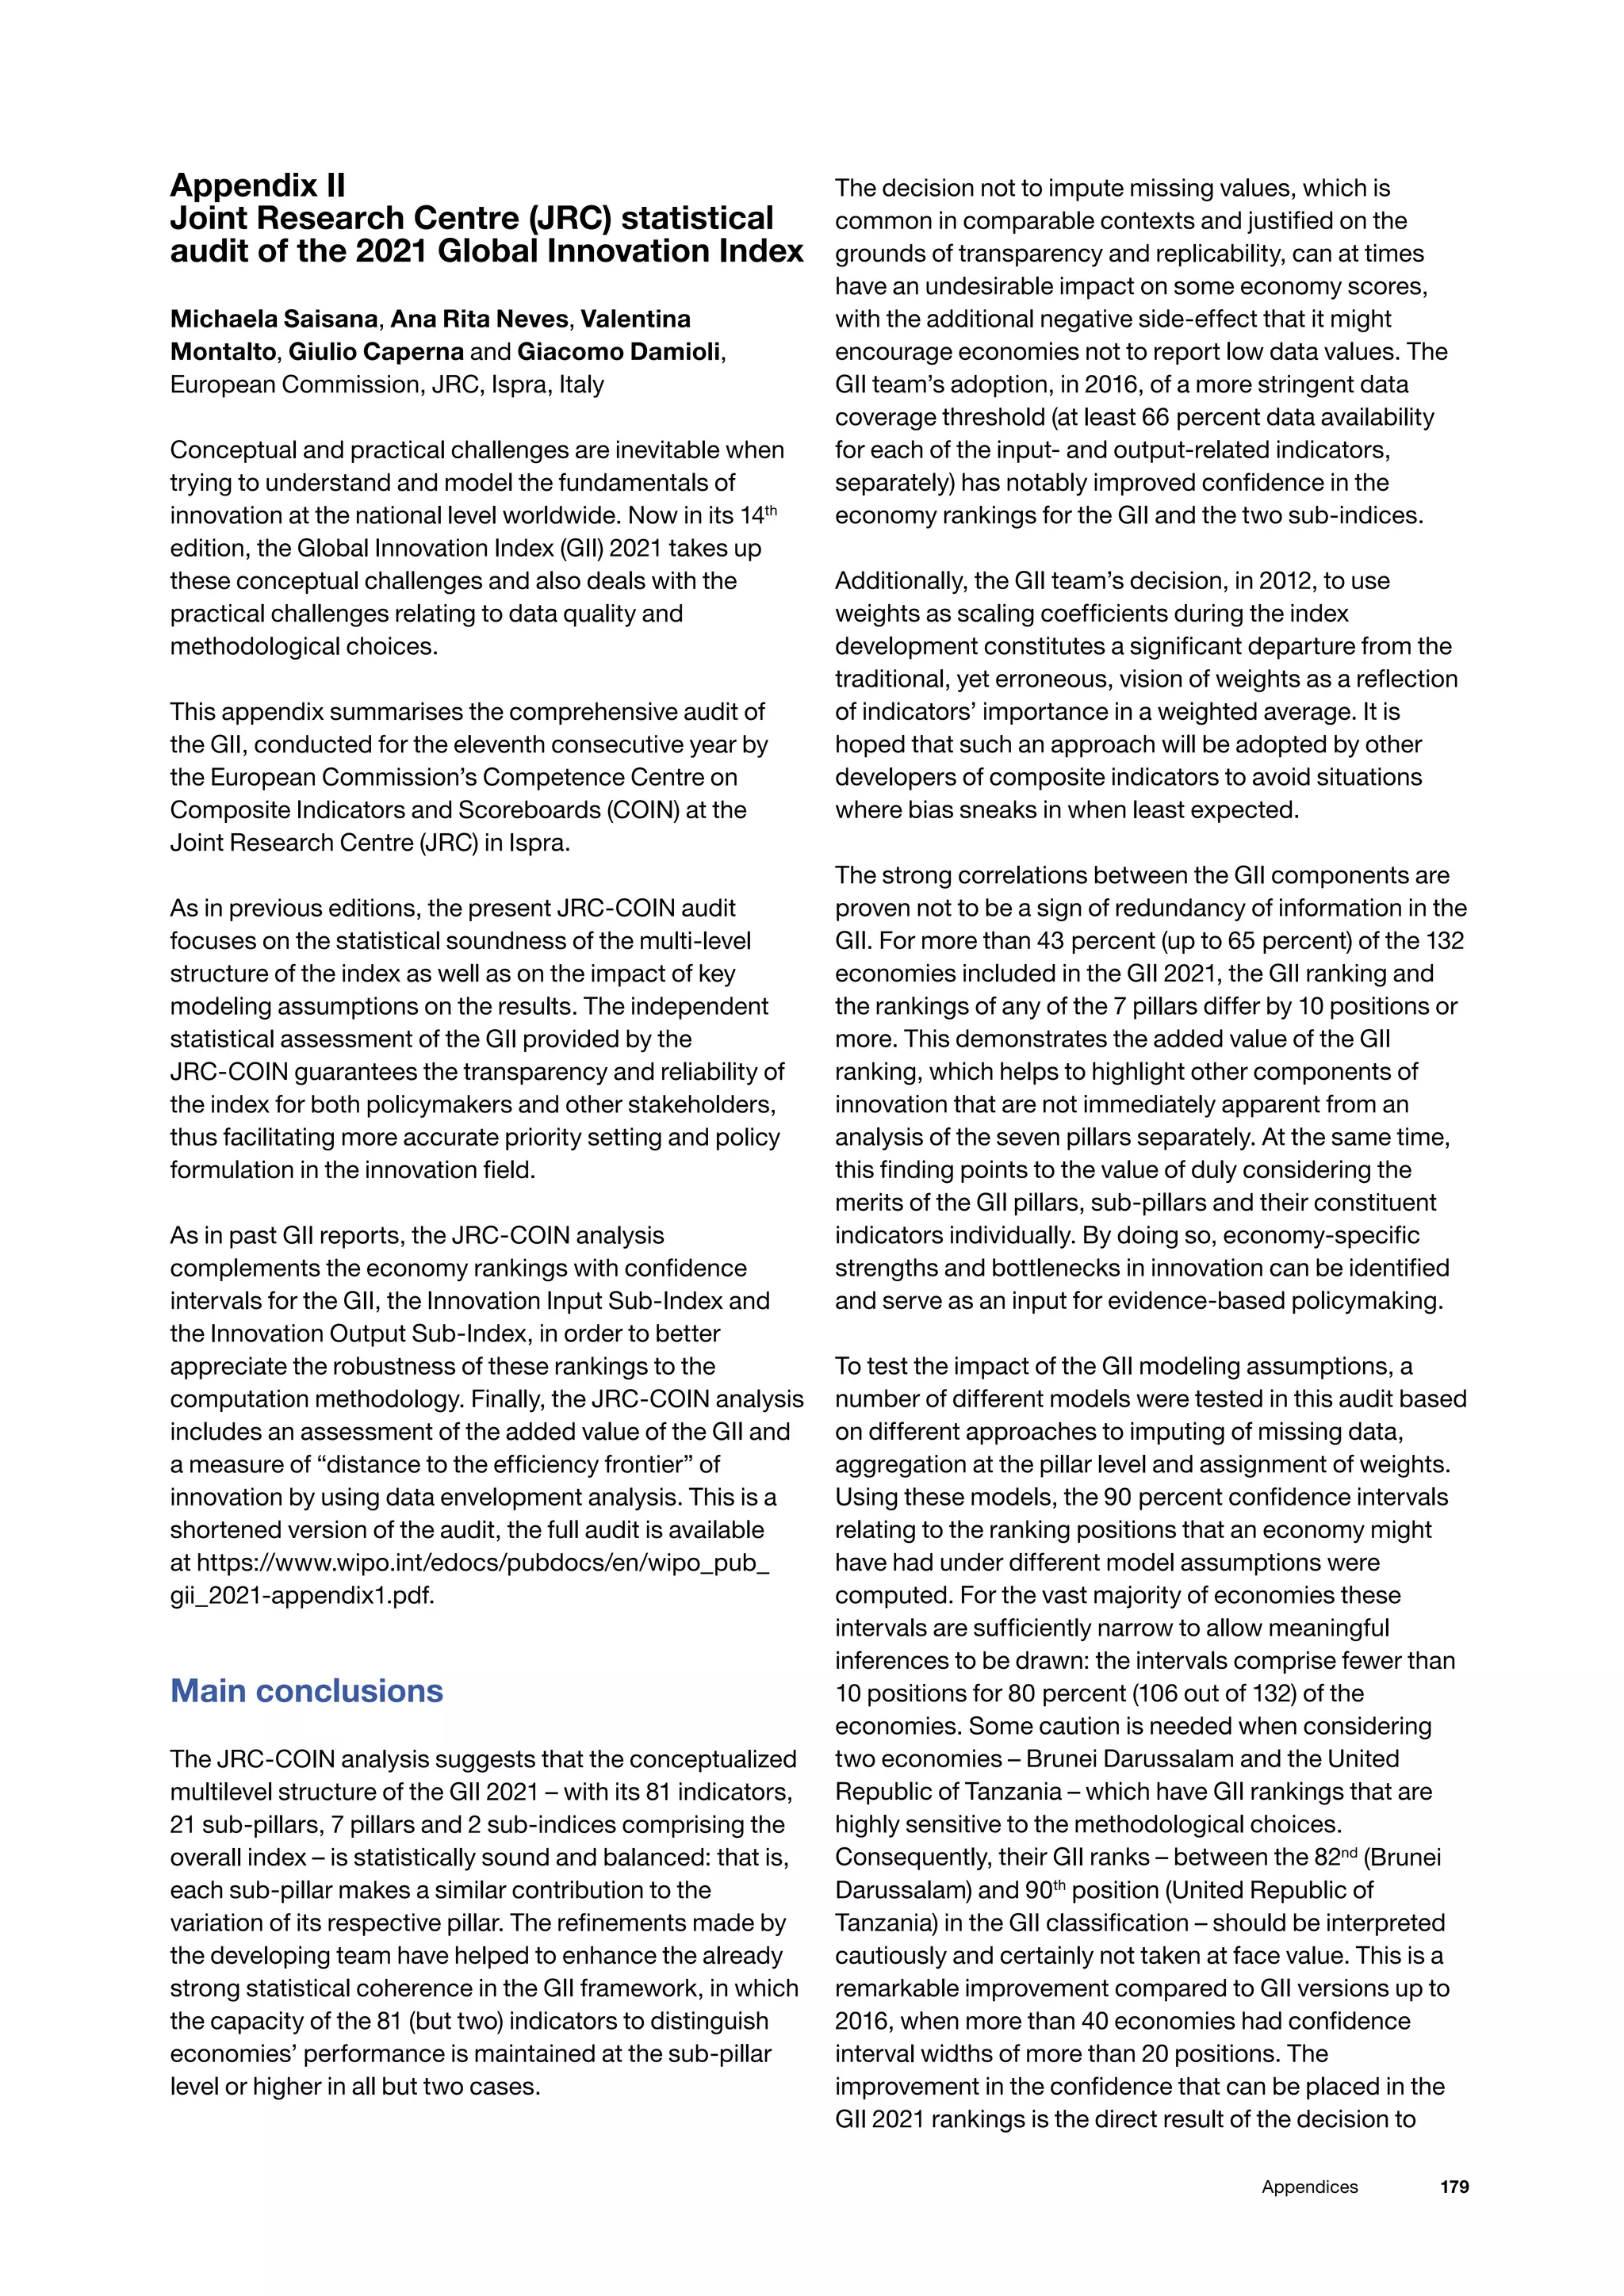
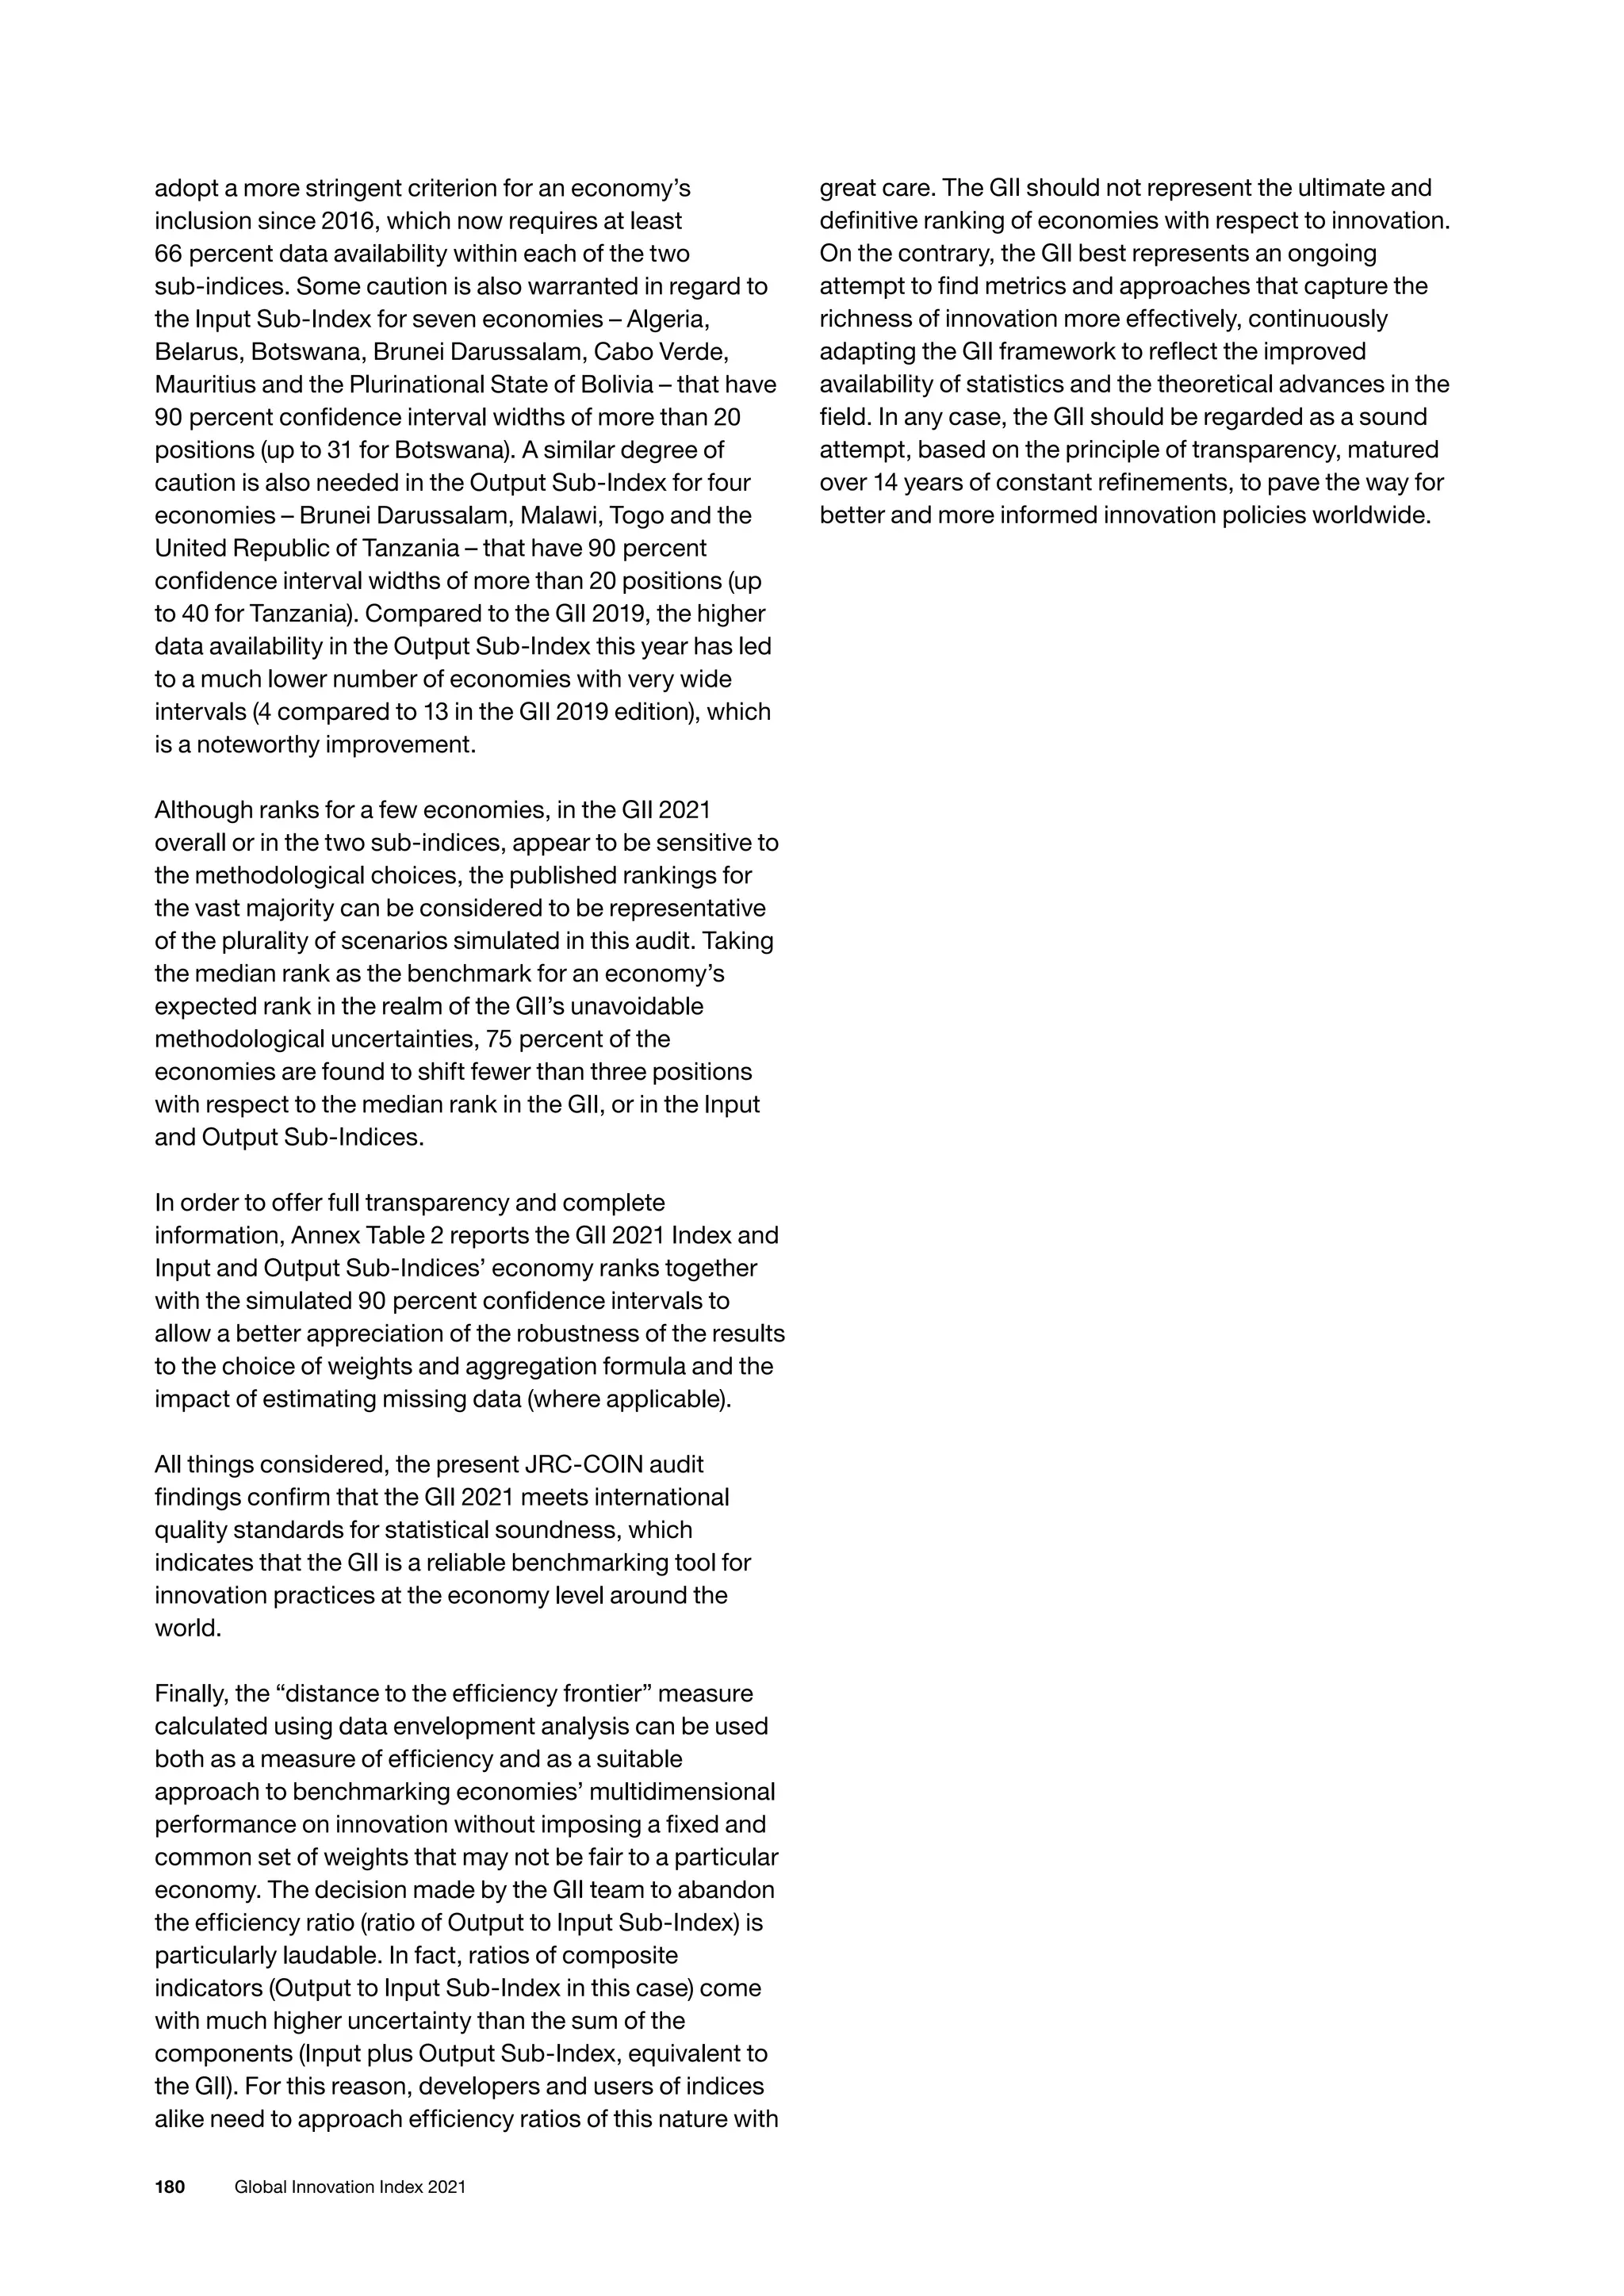
![181
Appendices
Annex Table 2
GII 2021 and Input/Output Sub-Indices: Ranks and 90 percent confidence intervals
GII 2021 Input Sub-Index Output Sub-Index
Rank Interval Rank Interval Rank Interval
Switzerland 1 [1, 1] 4 [2, 4] 1 [1, 1]
Sweden 2 [2, 2] 2 [1, 4] 2 [2, 3]
United States 3 [3, 4] 3 [2, 5] 4 [3, 8]
United Kingdom 4 [4, 7] 7 [6, 9] 6 [4, 8]
Republic of Korea 5 [3, 5] 9 [7, 12] 5 [4, 5]
Netherlands 6 [6, 8] 12 [8, 14] 3 [3, 7]
Finland 7 [5, 8] 6 [4, 9] 9 [9, 10]
Singapore 8 [6, 10] 1 [1, 3] 13 [12, 14]
Denmark 9 [9, 10] 5 [5, 7] 11 [11, 11]
Germany 10 [7, 10] 14 [11, 15] 8 [5, 8]
France 11 [11, 13] 17 [16, 18] 10 [9, 10]
China 12 [11, 14] 25 [21, 26] 7 [2, 7]
Japan 13 [12, 14] 11 [9, 13] 14 [12, 14]
Hong Kong, China 14 [11, 23] 10 [8, 15] 17 [12, 29]
Israel 15 [14, 16] 18 [11, 20] 12 [12, 17]
Canada 16 [15, 19] 8 [5, 13] 23 [20, 25]
Iceland 17 [16, 18] 20 [19, 22] 16 [14, 17]
Austria 18 [17, 19] 16 [13, 18] 24 [20, 24]
Ireland 19 [16, 20] 22 [18, 23] 19 [16, 21]
Norway 20 [19, 23] 13 [10, 16] 28 [27, 28]
Estonia 21 [19, 22] 24 [22, 26] 20 [17, 20]
Belgium 22 [21, 25] 21 [19, 22] 26 [24, 27]
Luxembourg 23 [21, 24] 26 [23, 28] 18 [17, 22]
Czech Republic 24 [20, 25] 30 [29, 30] 15 [14, 17]
Australia 25 [23, 27] 15 [13, 19] 33 [31, 36]
New Zealand 26 [26, 30] 19 [18, 24] 32 [31, 36]
Malta 27 [25, 28] 29 [27, 32] 22 [20, 26]
Cyprus 28 [25, 28] 31 [30, 33] 21 [19, 22]
Italy 29 [27, 30] 33 [31, 33] 25 [23, 26]
Spain 30 [29, 30] 28 [26, 31] 29 [27, 29]
Portugal 31 [31, 32] 32 [29, 33] 30 [29, 31]
Slovenia 32 [31, 32] 27 [26, 30] 36 [33, 36]
United Arab Emirates 33 [33, 36] 23 [23, 25] 47 [45, 52]
Hungary 34 [33, 34] 34 [34, 37] 31 [29, 33]
Bulgaria 35 [33, 36] 46 [40, 48] 27 [25, 30]
Malaysia 36 [34, 36] 36 [34, 38] 34 [32, 34]
Slovakia 37 [37, 40] 42 [40, 46] 35 [34, 36]
Latvia 38 [37, 39] 38 [37, 40] 39 [39, 40]
Lithuania 39 [37, 40] 35 [34, 38] 43 [41, 44]
Poland 40 [37, 40] 37 [35, 38] 42 [40, 44]
Turkey 41 [41, 41] 45 [39, 51] 41 [40, 43]
Croatia 42 [42, 48] 41 [40, 47] 48 [47, 50]
Thailand 43 [42, 45] 47 [40, 49] 46 [45, 47]
Viet Nam 44 [42, 47] 60 [55, 69] 38 [37, 39]
Russian Federation 45 [43, 47] 43 [39, 47] 52 [50, 54]
India 46 [43, 48] 57 [47, 58] 45 [41, 47]
Greece 47 [42, 50] 39 [36, 43] 60 [56, 61]
Romania 48 [48, 52] 54 [47, 58] 50 [48, 55]
Ukraine 49 [43, 53] 76 [63, 77] 37 [37, 38]
Montenegro 50 [49, 58] 53 [52, 62] 53 [50, 60]
Philippines 51 [47, 55] 72 [61, 77] 40 [38, 43]
Mauritius 52 [49, 66] 48 [41, 69] 58 [57, 67]
Chile 53 [49, 55] 44 [40, 46] 61 [59, 62]
Serbia 54 [51, 56] 50 [48, 54] 57 [54, 59]
Mexico 55 [51, 56] 62 [54, 64] 51 [50, 53]
Costa Rica 56 [51, 58] 66 [59, 68] 49 [49, 54]
Brazil 57 [53, 59] 56 [47, 59] 59 [56, 60]
Mongolia 58 [55, 62] 65 [60, 75] 55 [46, 61]
North Macedonia 59 [55, 61] 40 [39, 58] 69 [62, 70]
Iran (Islamic Republic of) 60 [57, 65] 86 [77, 92] 44 [44, 45]
South Africa 61 [60, 64] 55 [47, 59] 68 [65, 68]
Belarus 62 [49, 64] 68 [47, 70] 62 [47, 63]
Georgia 63 [61, 69] 49 [48, 68] 74 [69, 74]
Republic of Moldova 64 [58, 66] 80 [76, 82] 54 [52, 55]
Uruguay 65 [62, 66] 69 [63, 72] 63 [61, 63]
Saudi Arabia 66 [64, 69] 59 [49, 66] 72 [68, 72]](https://image.slidesharecdn.com/e-220805033615-e8521670/75/E-INDEX-2021-pdf-201-2048.jpg)
![182 Global Innovation Index 2021
GII 2021 Input Sub-Index Output Sub-Index
Rank Interval Rank Interval Rank Interval
Colombia 67 [62, 69] 58 [49, 58] 75 [72, 75]
Qatar 68 [67, 71] 64 [60, 71] 70 [68, 74]
Armenia 69 [64, 71] 85 [83, 90] 56 [54, 58]
Peru 70 [68, 73] 52 [48, 64] 82 [78, 83]
Tunisia 71 [68, 78] 78 [69, 82] 64 [63, 75]
Kuwait 72 [72, 78] 73 [70, 80] 73 [68, 74]
Argentina 73 [67, 75] 77 [63, 79] 71 [67, 73]
Jamaica 74 [68, 76] 82 [72, 87] 66 [62, 74]
Bosnia and Herzegovina 75 [73, 82] 70 [68, 81] 80 [77, 84]
Oman 76 [73, 79] 67 [60, 69] 90 [83, 90]
Morocco 77 [70, 78] 84 [80, 87] 67 [64, 67]
Bahrain 78 [73, 81] 63 [56, 71] 99 [86, 99]
Kazakhstan 79 [77, 83] 61 [56, 65] 101 [96, 101]
Azerbaijan 80 [80, 91] 74 [72, 83] 91 [89, 98]
Jordan 81 [77, 83] 79 [73, 83] 81 [78, 83]
Brunei Darussalam 82 [77, 111] 51 [46, 67] 115 [106, 127]
Panama 83 [76, 85] 83 [77, 91] 79 [68, 86]
Albania 84 [82, 86] 71 [70, 79] 92 [91, 96]
Kenya 85 [78, 86] 89 [84, 95] 76 [75, 79]
Uzbekistan 86 [84, 90] 75 [71, 83] 100 [93, 101]
Indonesia 87 [80, 87] 87 [83, 92] 84 [78, 85]
Paraguay 88 [86, 92] 90 [84, 94] 87 [79, 96]
Cabo Verde 89 [89, 97] 96 [89, 110] 88 [81, 101]
United Republic of Tanzania 90 [89, 112] 120 [116, 124] 65 [64, 104]
Ecuador 91 [89, 97] 92 [89, 100] 94 [90, 96]
Lebanon 92 [88, 95] 94 [84, 96] 97 [88, 97]
Dominican Republic 93 [92, 100] 93 [90, 99] 98 [97, 104]
Egypt 94 [85, 96] 102 [95, 103] 86 [81, 91]
Sri Lanka 95 [84, 97] 103 [93, 107] 85 [79, 88]
El Salvador 96 [89, 99] 100 [95, 102] 89 [83, 102]
Trinidad and Tobago 97 [89, 98] 97 [86, 102] 95 [89, 99]
Kyrgyzstan 98 [96, 109] 81 [80, 89] 119 [115, 121]
Pakistan 99 [90, 101] 117 [100, 117] 77 [76, 87]
Namibia 100 [96, 106] 88 [85, 97] 110 [107, 113]
Guatemala 101 [95, 107] 112 [108, 119] 83 [81, 89]
Rwanda 102 [99, 110] 91 [87, 102] 108 [106, 113]
Tajikistan 103 [98, 107] 104 [100, 117] 96 [89, 97]
Bolivia (Plurinational State of) 104 [100, 109] 95 [83, 104] 111 [109, 116]
Senegal 105 [100, 108] 105 [97, 116] 102 [97, 103]
Botswana 106 [96, 113] 98 [85, 116] 109 [107, 113]
Malawi 107 [100, 116] 118 [114, 123] 93 [87, 113]
Honduras 108 [97, 110] 101 [96, 108] 106 [99, 109]
Cambodia 109 [102, 110] 106 [100, 109] 104 [102, 105]
Madagascar 110 [101, 118] 127 [126, 129] 78 [76, 94]
Nepal 111 [102, 113] 99 [96, 107] 116 [101, 118]
Ghana 112 [102, 112] 114 [105, 117] 103 [101, 111]
Zimbabwe 113 [108, 123] 116 [104, 123] 105 [104, 120]
Côte d'Ivoire 114 [112, 119] 107 [103, 117] 121 [119, 124]
Burkina Faso 115 [115, 126] 108 [107, 119] 123 [122, 128]
Bangladesh 116 [115, 123] 121 [119, 127] 113 [111, 115]
Lao People's Democratic Republic 117 [112, 122] 123 [111, 126] 112 [107, 120]
Nigeria 118 [114, 125] 115 [106, 118] 124 [122, 128]
Uganda 119 [113, 125] 119 [109, 125] 122 [121, 125]
Algeria 120 [113, 125] 109 [98, 120] 128 [126, 131]
Zambia 121 [119, 127] 111 [104, 118] 127 [124, 130]
Mozambique 122 [115, 128] 122 [114, 126] 118 [115, 123]
Cameroon 123 [114, 127] 124 [115, 125] 117 [114, 126]
Mali 124 [116, 125] 126 [122, 126] 114 [113, 116]
Togo 125 [107, 127] 110 [108, 119] 129 [104, 129]
Ethiopia 126 [123, 129] 129 [128, 129] 107 [106, 124]
Myanmar 127 [114, 128] 128 [125, 129] 120 [106, 120]
Benin 128 [125, 131] 113 [110, 122] 132 [129, 132]
Niger 129 [120, 129] 125 [119, 128] 130 [117, 130]
Guinea 130 [130, 132] 130 [130, 132] 126 [117, 131]
Yemen 131 [128, 132] 132 [130, 132] 125 [123, 127]
Angola 132 [130, 132] 131 [130, 132] 131 [130, 132]
Annex Table 2
GII 2021 and Input/Output Sub-Indices: Ranks and 90 percent confidence intervals (continued)](https://image.slidesharecdn.com/e-220805033615-e8521670/75/E-INDEX-2021-pdf-202-2048.jpg)
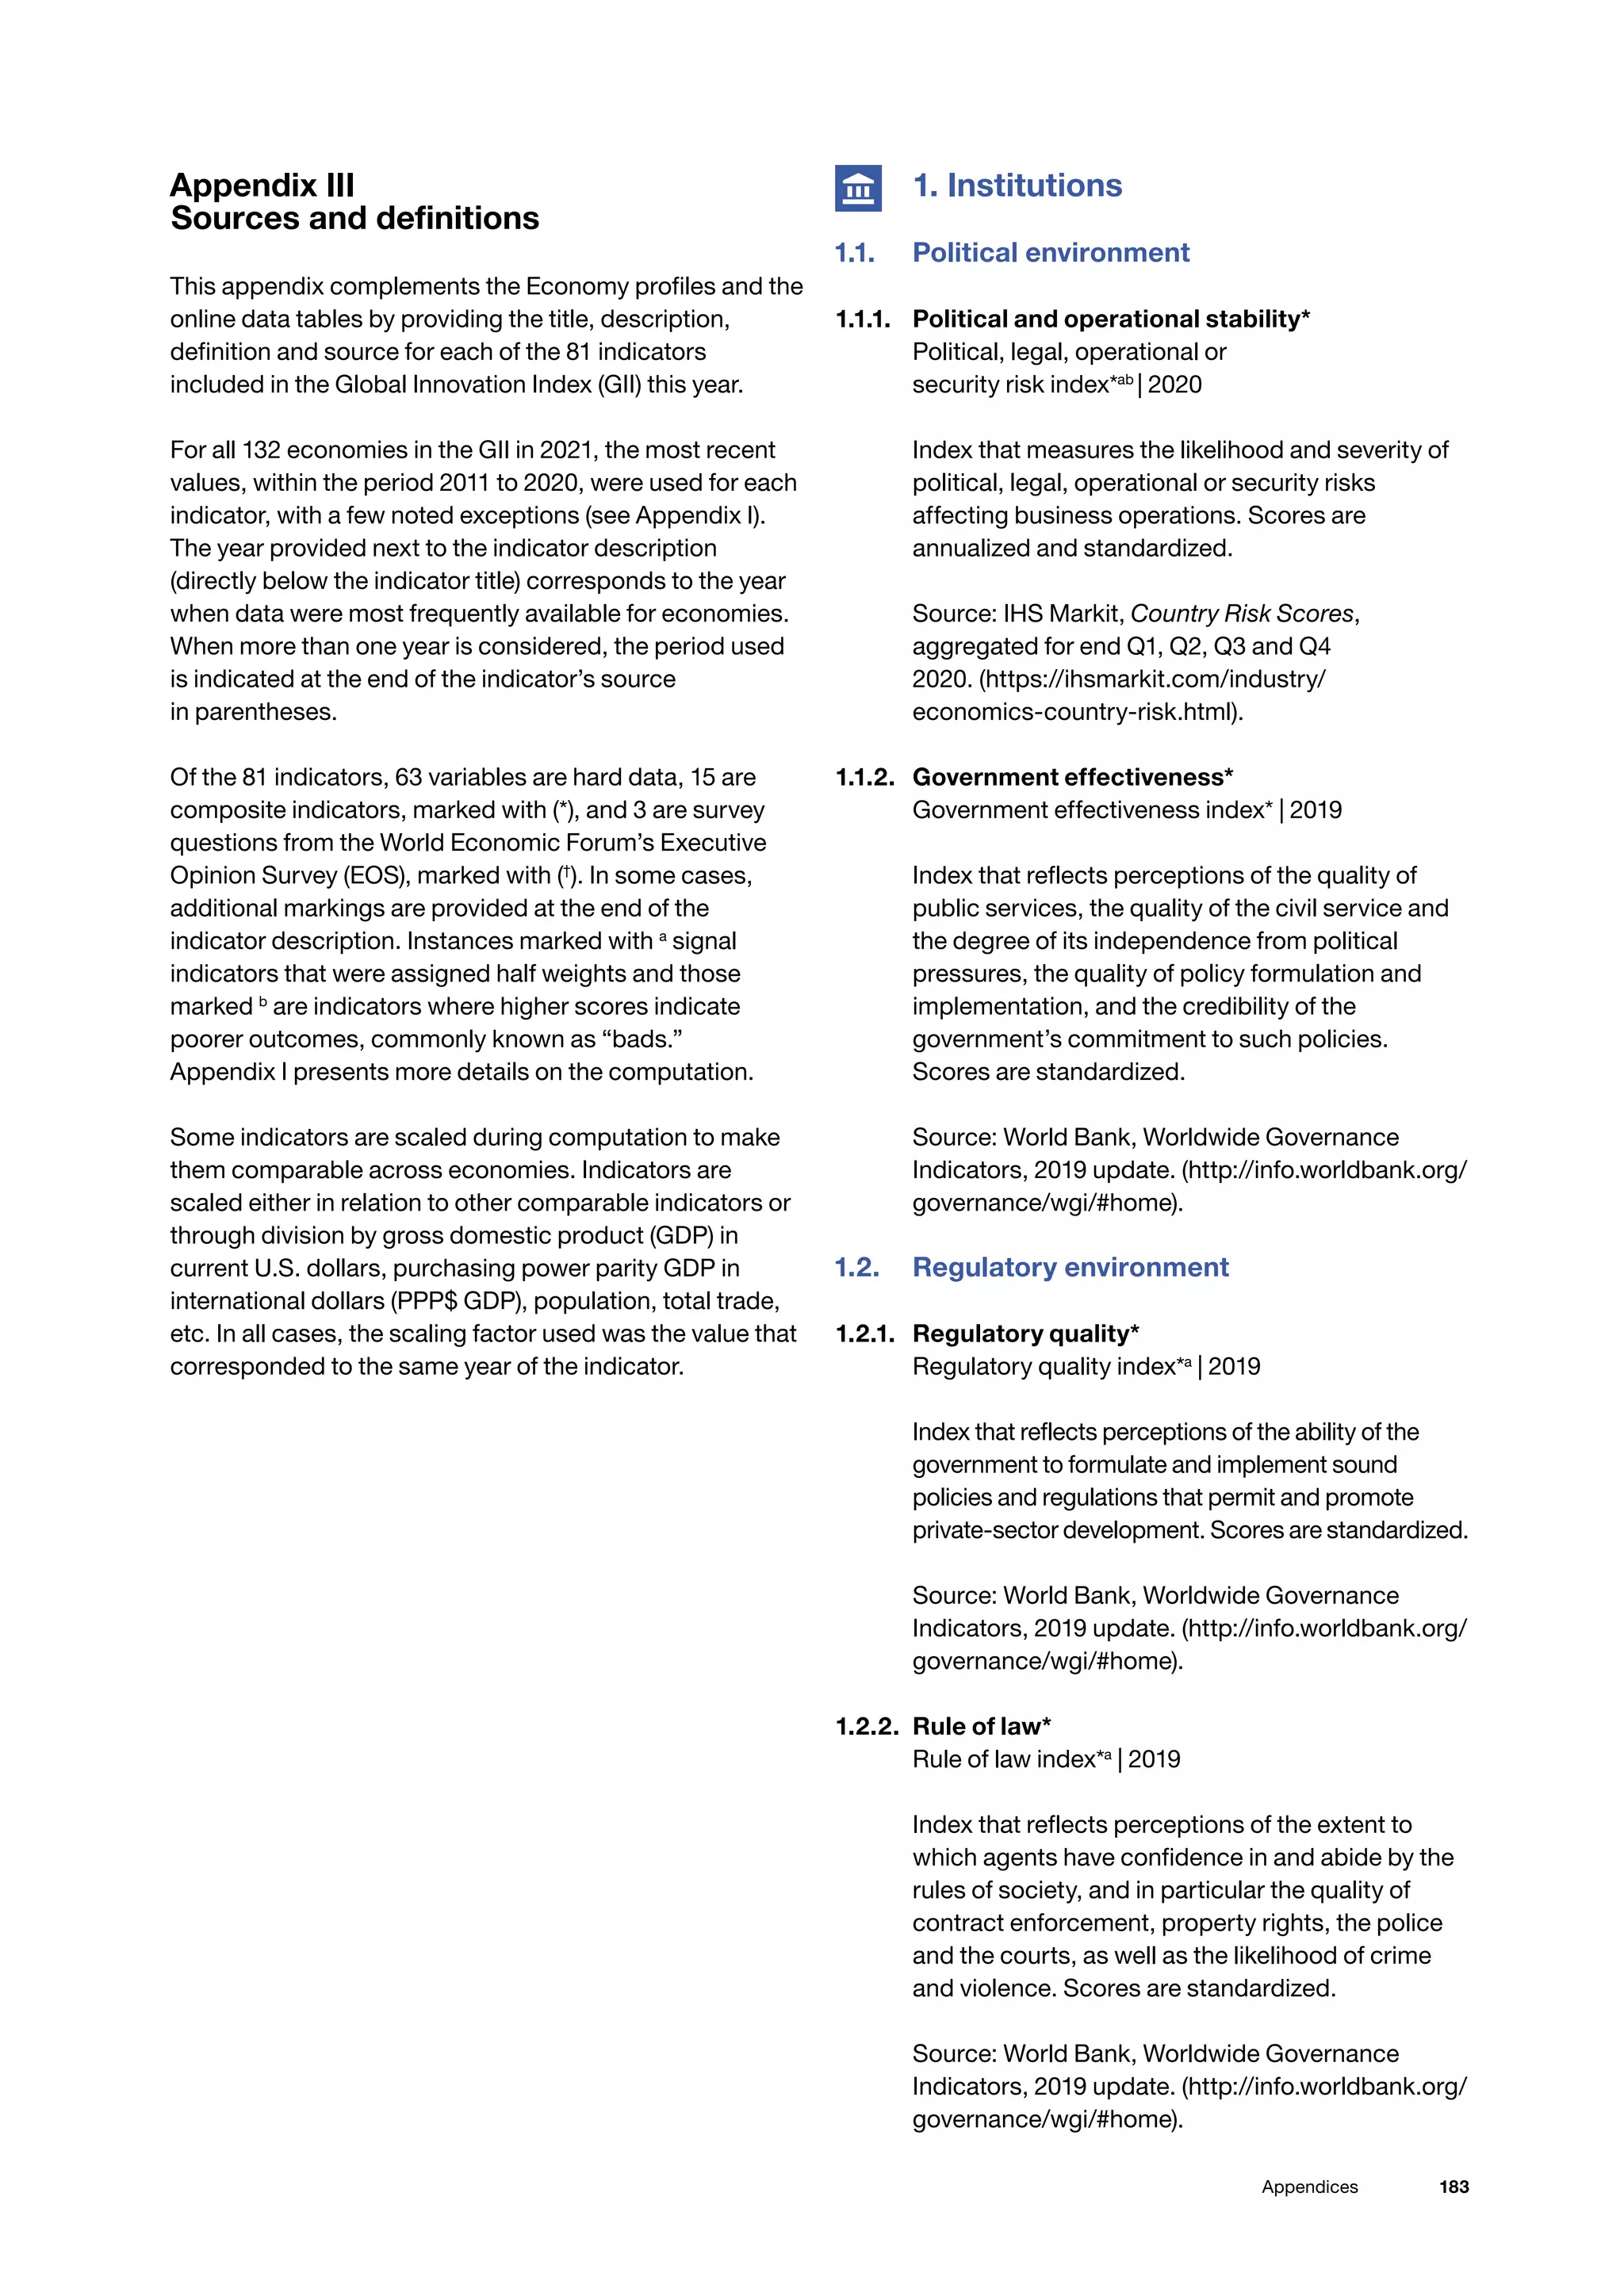
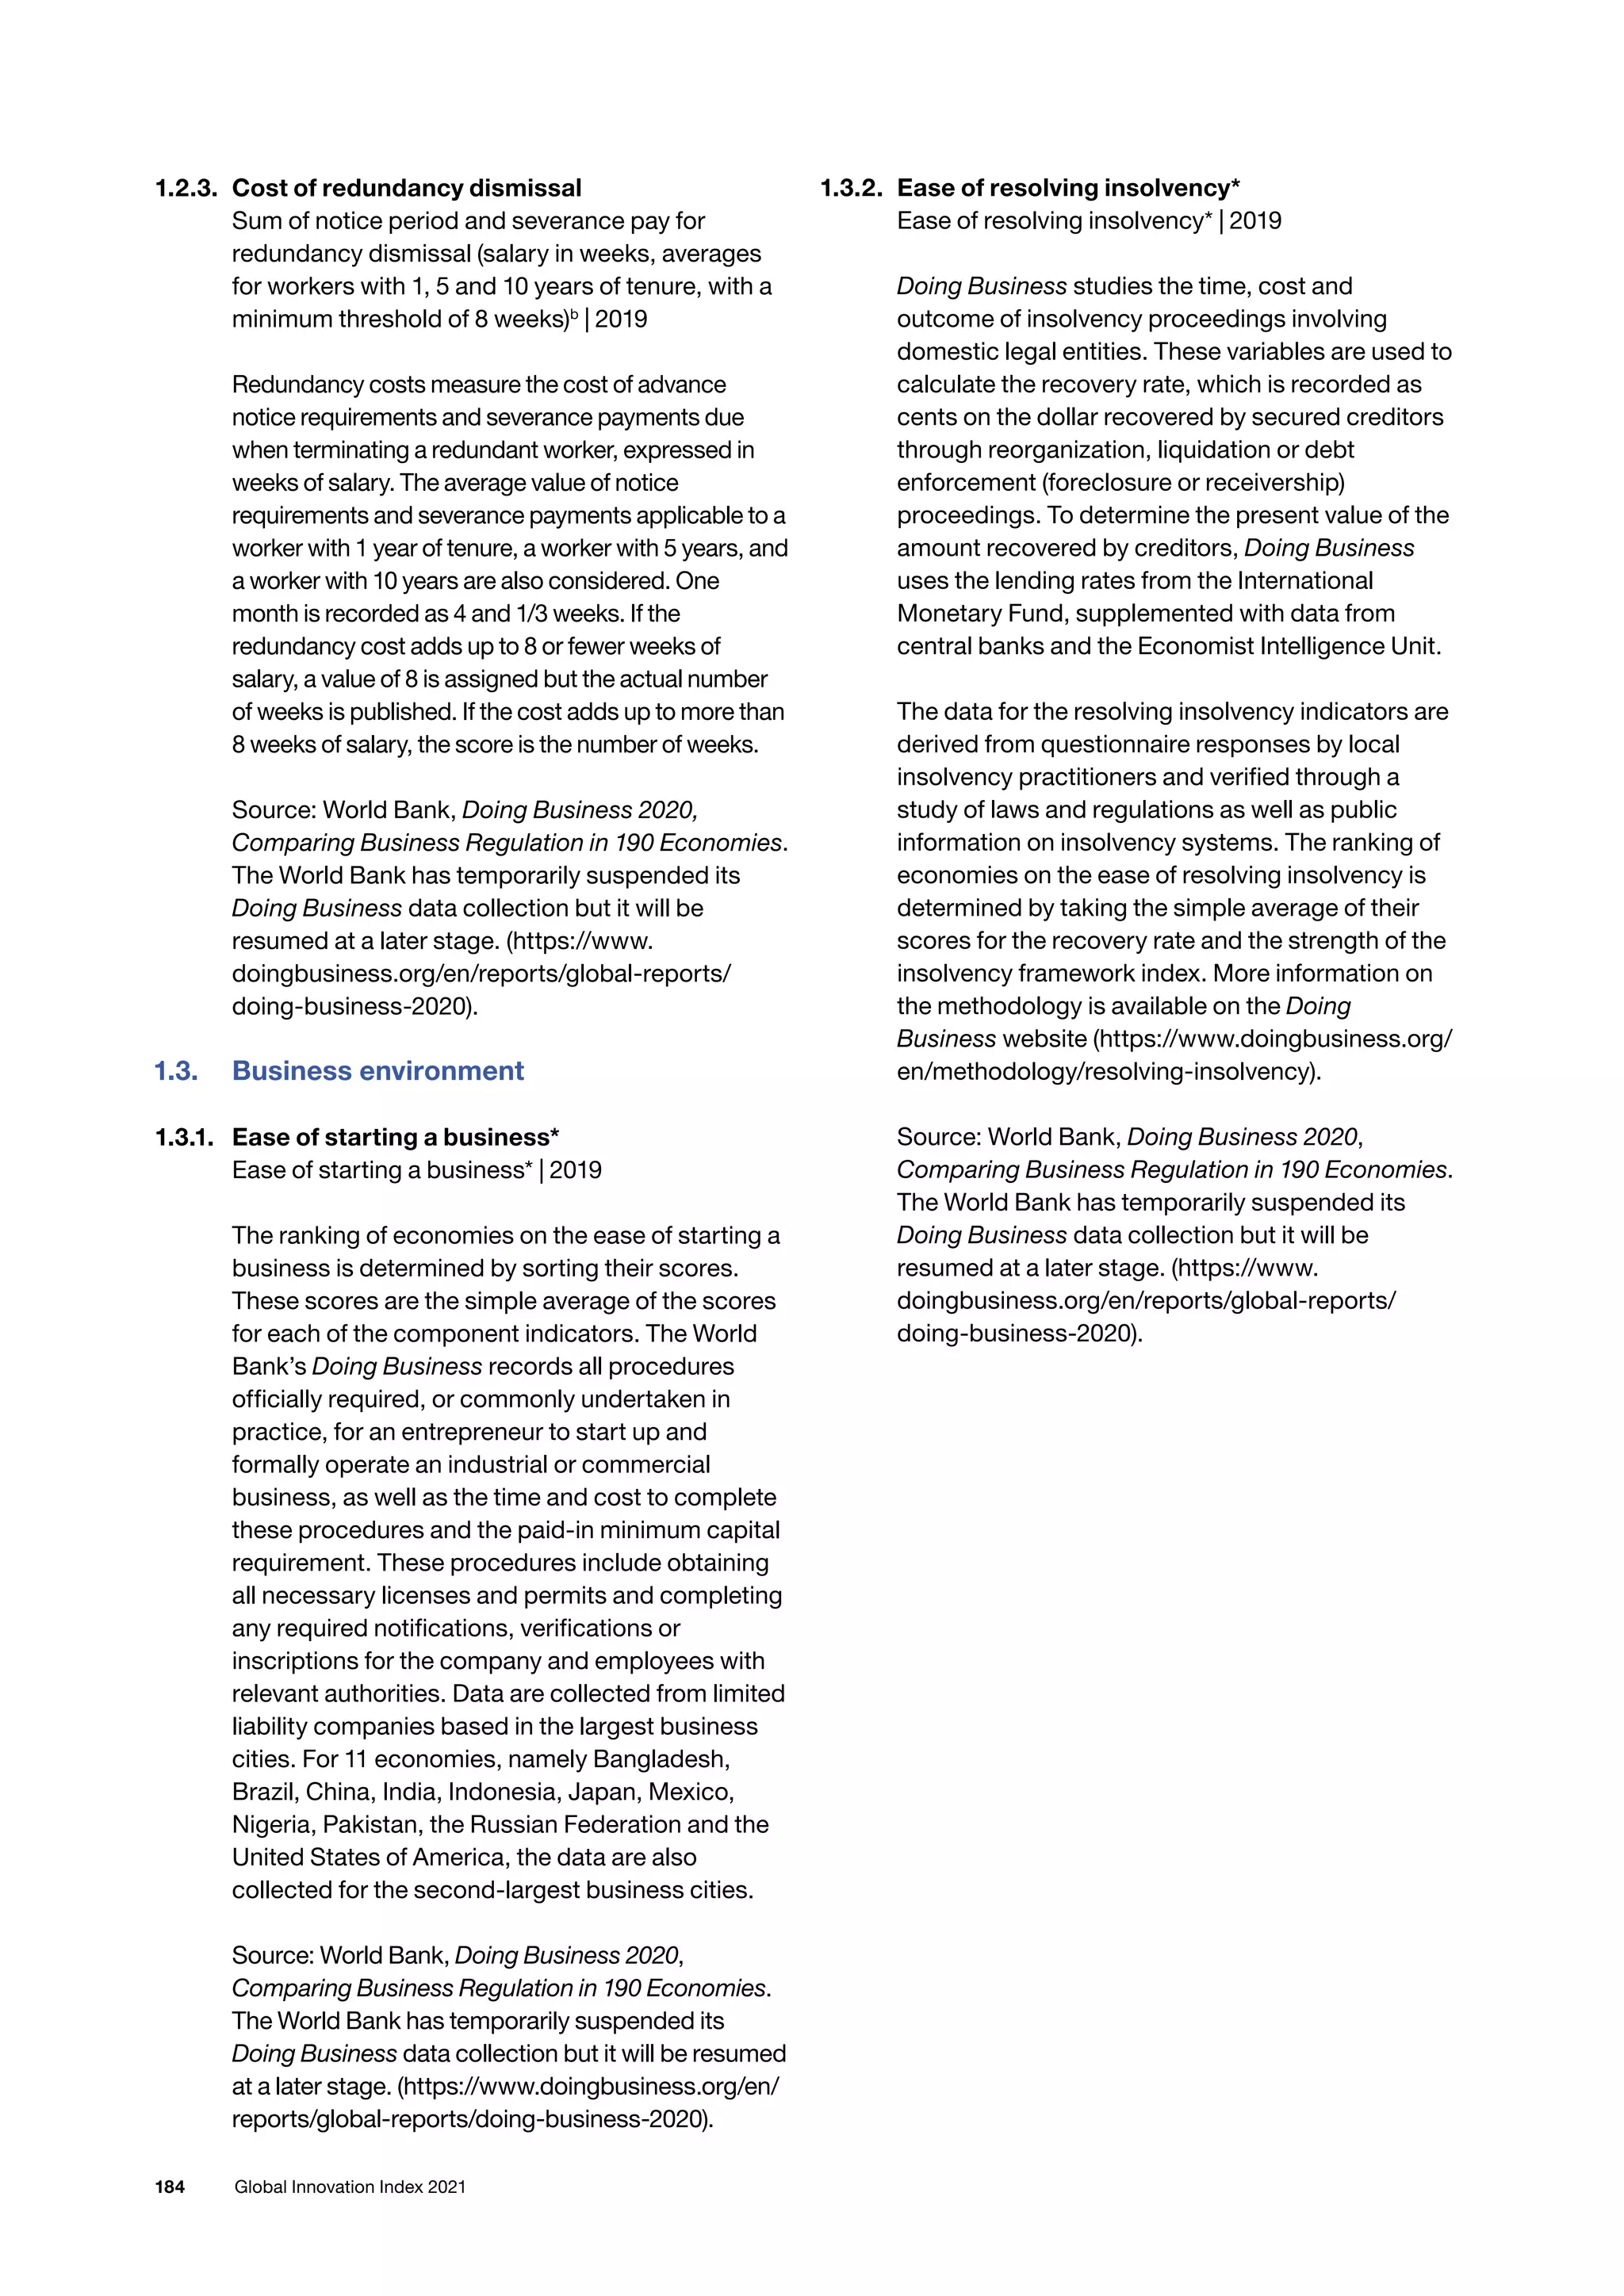


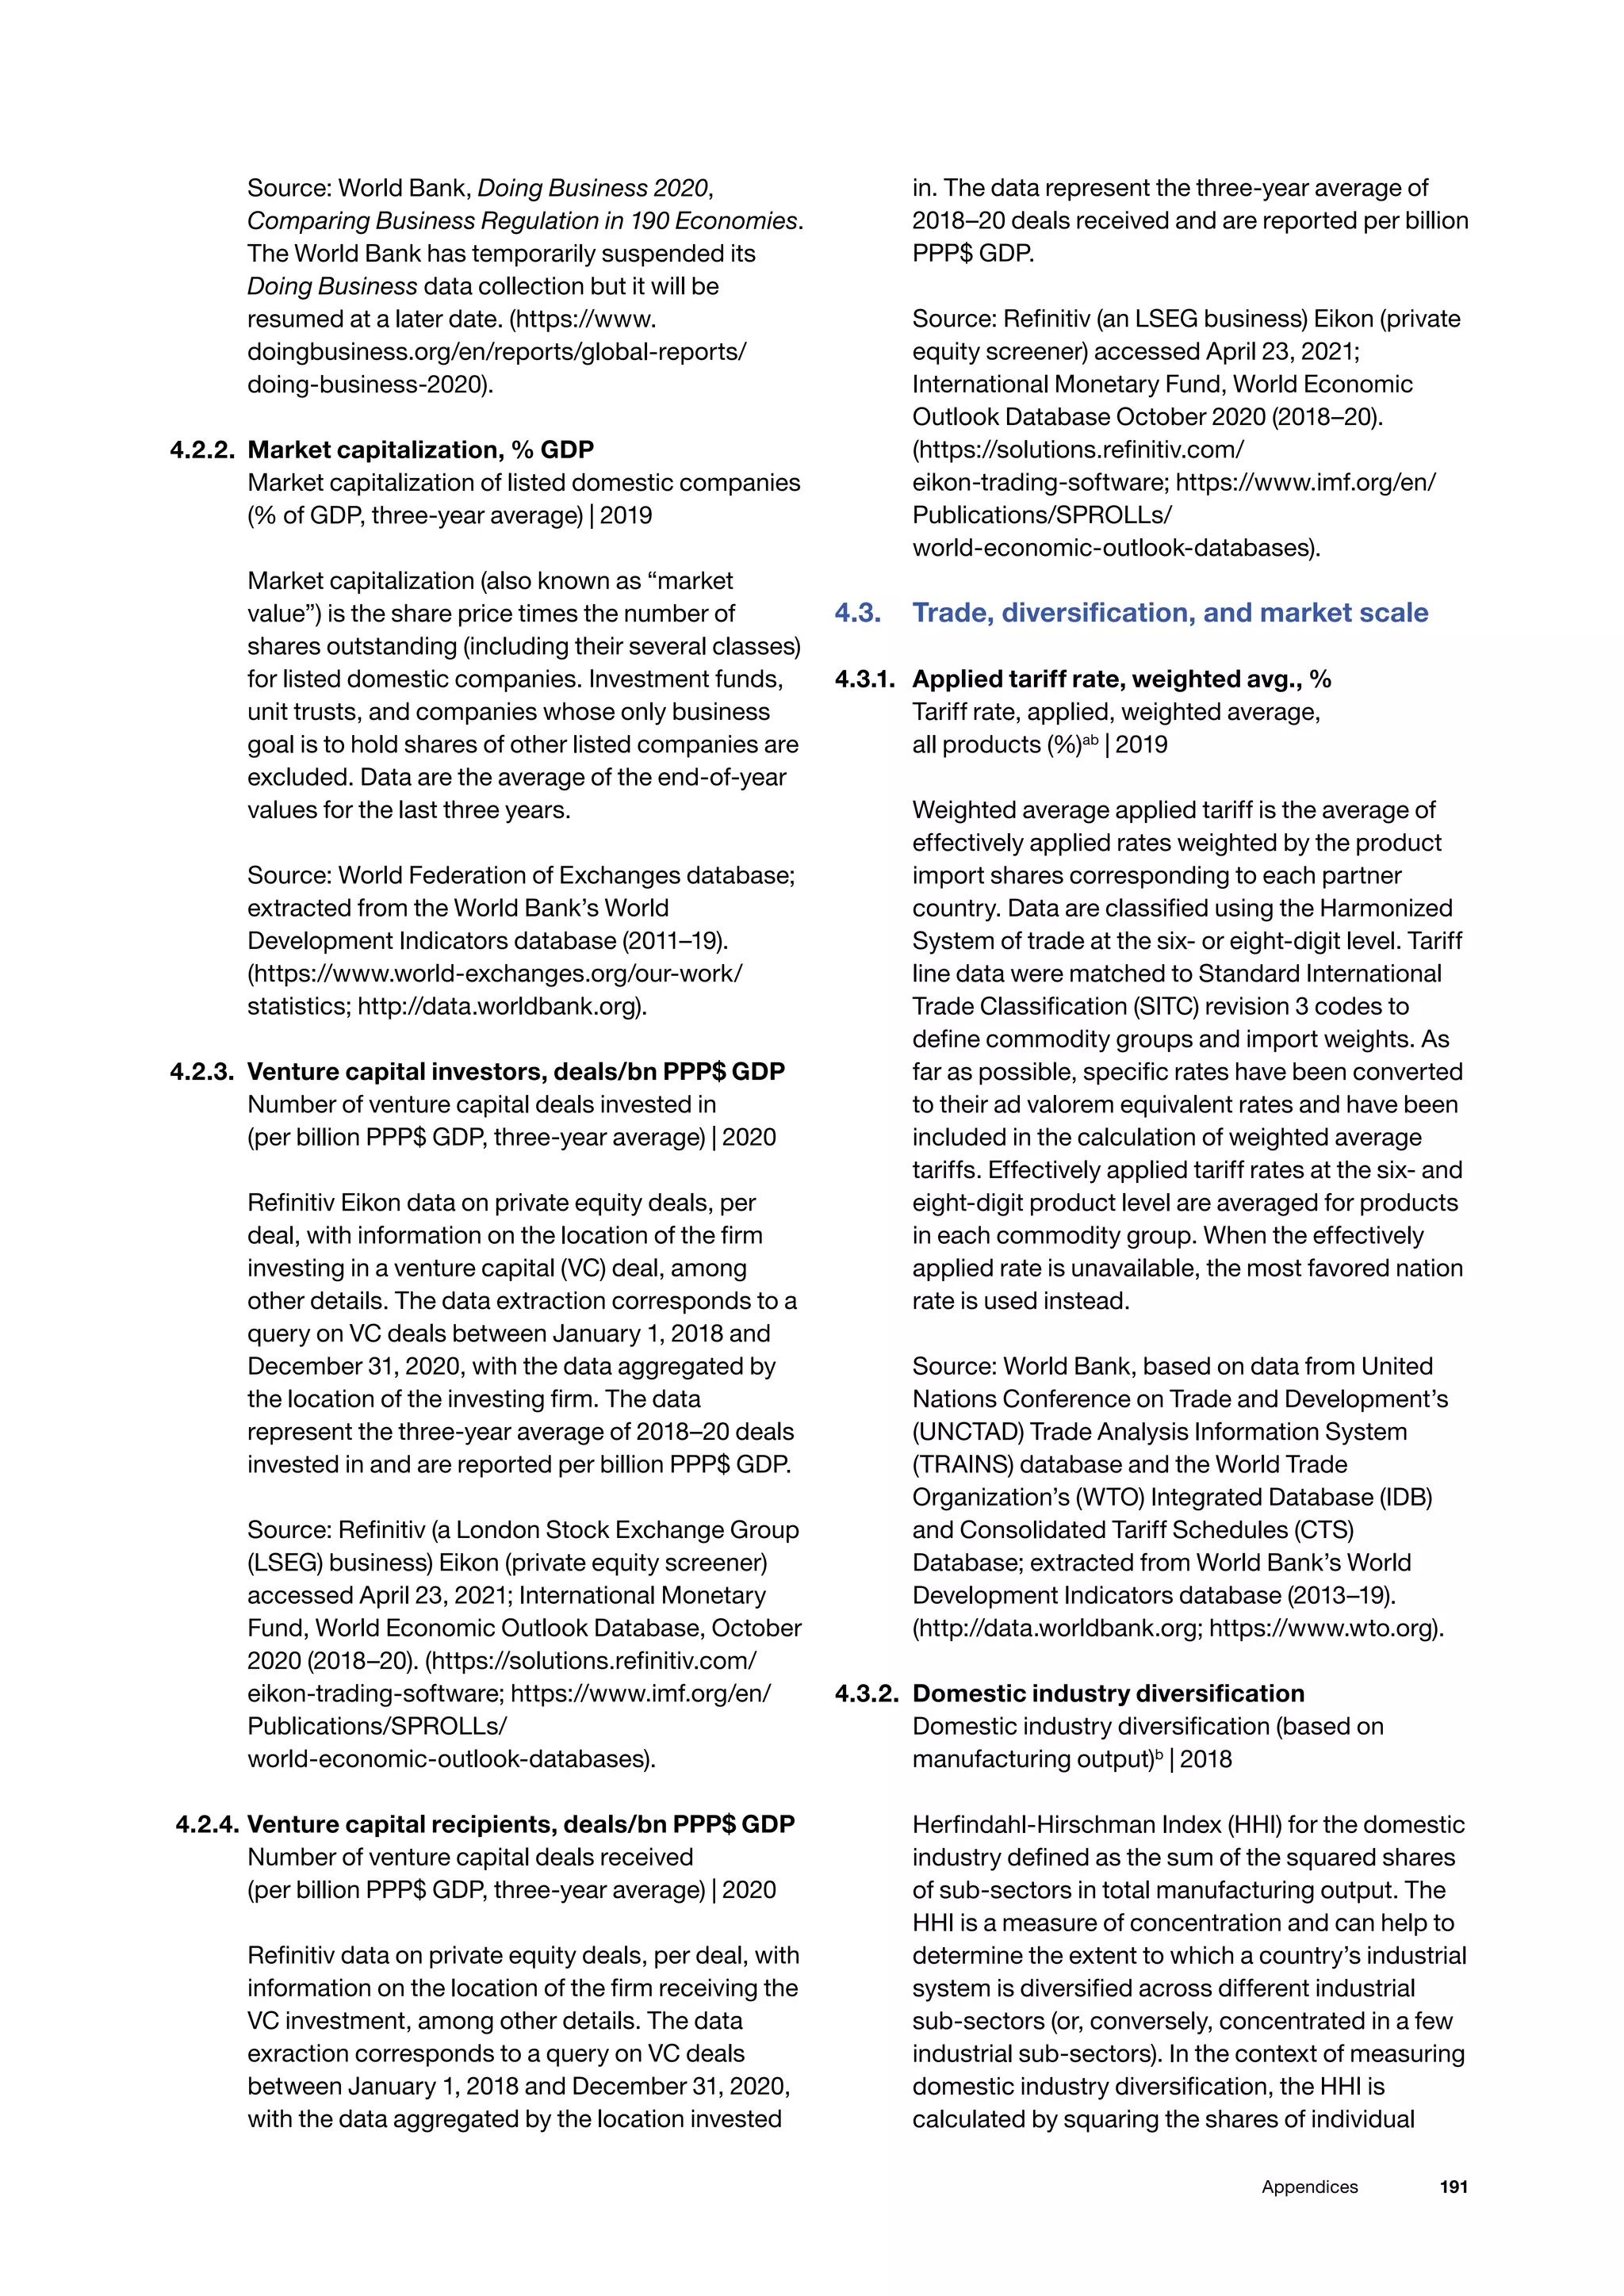
![193
Appendices
Source: UNESCO Institute for Statistics (UIS)
online database; Eurostat, Eurostat database;
OECD, Main Science and Technology Indicators
(MSTI) database, 2019 (2010–19). (http://data.uis.
unesco.org; https://ec.europa.eu/eurostat/data/
database; https://stats.oecd.org/Index.
aspx?DataSet-Code=MSTI_PUB).
5.1.5. Females employed w/advanced degrees, %
Females employed with advanced degrees, %
total employed (25+ years old)a
| 2019
The percentage of females employed with
advanced degrees out of total employed. The
employed comprise all persons of working age
who, during a specified brief period, were in one of
the following categories: (1) paid employment; or
(2) self-employment. Data are disaggregated by
level of education, which refers to the highest level
of education completed, classified according to
the International Standard Classification of
Education (ISCE). Data for Canada are based on
Table 14-10-0020-01 of the country’s Labour Force
Survey estimates.
Source: International Labour Organization,
ILOSTAT Database of Labour Statistics; Statistics
Canada. Table 14-10-0020-01 Unemployment rate,
participation rate and employment rate by
educational attainment, annual, accessed
February 10, 2020 (2011–20). (www.ilo.org/
ilostat; https://www150.statcan.gc.ca/t1/tbl1/en/
tv.action?pid=1410002001).
5.2. Innovation linkages
5.2.1. University–industry RD collaboration†
The extent to which businesses and universities
collaborate on RD†a
| 2020
Average answer to the survey question: In your
country, to what extent do businesses and
universities collaborate on research and
development (RD)? [1 = not at all; 7 = to a
great extent]
Source: World Economic Forum, Executive
Opinion Survey 2020 (2018–20), Appendix C of The
Global Competitiveness Report 2020. (www3.
weforum.org/docs/WEF_
TheGlobalCompetitivenessReport2020.pdf).
5.2.2. State of cluster development and depth†
How widespread clusters are†
| 2020
Average answer to the survey question: In your
country, how widespread are well-developed and
deep clusters (geographic concentrations of firms,
suppliers, producers of related products and
services, and specialized institutions in a particular
field)? [1 = nonexistent; 7 = widespread in
many fields].
Source: World Economic Forum, Executive
Opinion Survey 2020 (2018–20), Appendix C of The
Global Competitiveness Report 2020. (www3.
weforum.org/docs/WEF_
TheGlobalCompetitivenessReport2020.pdf).
5.2.3. GERD financed by abroad, % GDP
GERD financed by abroad (% of total GDP) | 2018
Percentage of gross expenditure on RD financed
by abroad (billions, national currency) – that is, with
foreign financing as a percentage of GDP (billions,
national currency). For the definition of GERD, see
indicator 2.3.2.
Source: UNESCO Institute for Statistics (UIS)
online database; Eurostat, Eurostat database;
OECD, Main Science and Technology Indicators
(MSTI) database, 2019 (2010–19). (http://data.uis.
unesco.org; https://ec.europa.eu/eurostat/data/
database; https://stats.oecd.org/Index.
aspx?DataSet-Code=MSTI_PUB).
5.2.4. Joint venture/strategic alliance deals/bn
PPP$ GDP
Number of joint venture/strategic alliance deals,
fractional counting (per billion PPP$ GDP,
three-year average) | 2020
Refinitiv’s data on joint ventures/strategic alliances,
per deal, with details on the country of origin of
partner firms, among others. The data extraction
corresponds to a query on joint venture/strategic
alliance deals between January 1, 2018 and
December 31, 2020. The nation of each company
participating in a deal (n companies per deal) is
allocated, per deal, a score equivalent to 1/n (with
the effect that all country scores add up to the total
number of deals). The data are reported per billion
PPP$ GDP.
Source: Refinitive (an LSEG business) SDC
Platinum database; International Monetary Fund
World Economic Outlook Database, October 2020.
(https://www.refinitiv.com/en/financial-data/
deals-data/joint-venture-deals; https://www.imf.
org/en/Publications/SPROLLs/
world-economic-outlook-databases).
5.2.5. Patent families/bn PPP$ GDP
Number of patent families filed in at least two
offices (per billion PPP$ GDP) | 2017
A patent family is a set of interrelated patent
applications filed in one or more countries or
jurisdictions to protect the same invention. Patent
families containing applications filed in at least two](https://image.slidesharecdn.com/e-220805033615-e8521670/75/E-INDEX-2021-pdf-213-2048.jpg)


![199
Appendices
charged for the use of the brand. Brand Finance’s
study is based on publicly available information on
the largest brands in the world. This indicator
assesses the economy’s brands in the top 5,000
global brand database and produces the sum of
the brand values corresponding to that economy.
This sum is then scaled by GDP. A score of 0 is
assigned where there are no brands in the country
that make the top 5,000 ranking. A score of n/a is
assigned where Brand Finance has been unable to
determine if there are brands from the country that
would rank within the top 5,000 due to data
availability limitations.
Source: Brand Finance database; International
Monetary Fund, World Economic Outlook
Database, October 2020. (https://brandirectory.
com; https://brandfinance.com/knowledge-centre;
https://www.imf.org/en/Publications/SPROLLs/
world-economic-outlook-databases).
7.1.3. Industrial designs by origin/bn PPP$ GDP
Number of designs contained in resident industrial
design applications filed at a given national or
regional office (per billion PPP$ GDP)a
| 2019
An industrial design is a set of exclusive rights
granted by law to applicants to protect the
ornamental or aesthetic aspect of their products.
An industrial design is valid for a limited period of
time and within a defined territory. A resident
industrial design application refers to an
application filed with the IP office for or on behalf of
the applicant’s country of residence. For example,
an application filed with the Japan Patent Office by
a resident of Japan is considered to be a resident
application for Japan. Similarly, an application filed
with the Office for Harmonization in the Internal
Market (OHIM) by an applicant who resides in any
of the OHIM member states, such as Italy, is
considered to be a resident application for that
member state (Italy). This indicator is based on
design count – the total number of designs
contained in the resident industrial design
applications. Data are scaled by PPP$
GDP (billions).
Source: World Intellectual Property Organization,
Intellectual Property Statistics; International
Monetary Fund, World Economic Outlook
Database, October 2020 (2014–19). (www.wipo.int/
ipstats; https://www.imf.org/en/Publications/
SPROLLs/world-economic-outlook-databases).
7.1.4. ICTs and organizational model creation†
Extent to which ICTs enable new organizational
models†
| 2018
Average answer to the question: In your country, to
what extent do ICTs enable new organizational
models (e.g., virtual teams, remote working,
telecommuting) within companies? [1 = not at all;
7 = to a great extent]
Source: World Economic Forum, Executive
Opinion Survey 2019. (www3.weforum.org/docs/
WEF_GCR_2019_Appendix_B.pdf).
7.2. Creative goods and services
7.2.1. Cultural and creative services exports,
% total trade
Cultural and creative services exports (% of total
trade)a
| 2019
Creative services exports as a percentage of total
exports according to the Extended Balance of
Payments Services Classification EBOPS 2010
– that is, EBOPS code SI3: Information services;
code SJ22: Advertising, market research, and
public opinion polling services; code SK1:
Audio-visual and related services; and code SK23:
Heritage and recreational services as a percentage
of total trade. See indicator 5.3.1 for the full
definition of total trade.
Source: World Trade Organization, Trade in
Commercial Services database, values based on
the classification of the sixth (2009) edition of the
International Monetary Fund’s Balance of
Payments and International Investment Position
Manual and Balance of Payments database
(2011–19). (https://timeseries.wto.org; www.oecd.
org/std/its/EBOPS-2010.pdf).
7.2.2. National feature films/mn pop. 15–69
Number of national feature films produced
(per million population, 15–69 years old)a
| 2017
A feature film is defined as a film with a running
time of 60 minutes or longer. It includes works of
fiction, animation and documentaries. It is intended
for commercial exhibition in cinemas. Feature films
produced exclusively for television broadcasting,
as well as newsreels and advertising films, are
excluded. Data are reported per million population
aged 15–69 years old.
Source: UNESCO Institute for Statistics (UIS)
online database; United Nations, Department of
Economic and Social Affairs, Population Division,
World Population Prospects: The 2019 Revision
(population) (2010–17). (http://data.uis.unesco.
org; https://population.un.org/wpp).](https://image.slidesharecdn.com/e-220805033615-e8521670/75/E-INDEX-2021-pdf-219-2048.jpg)