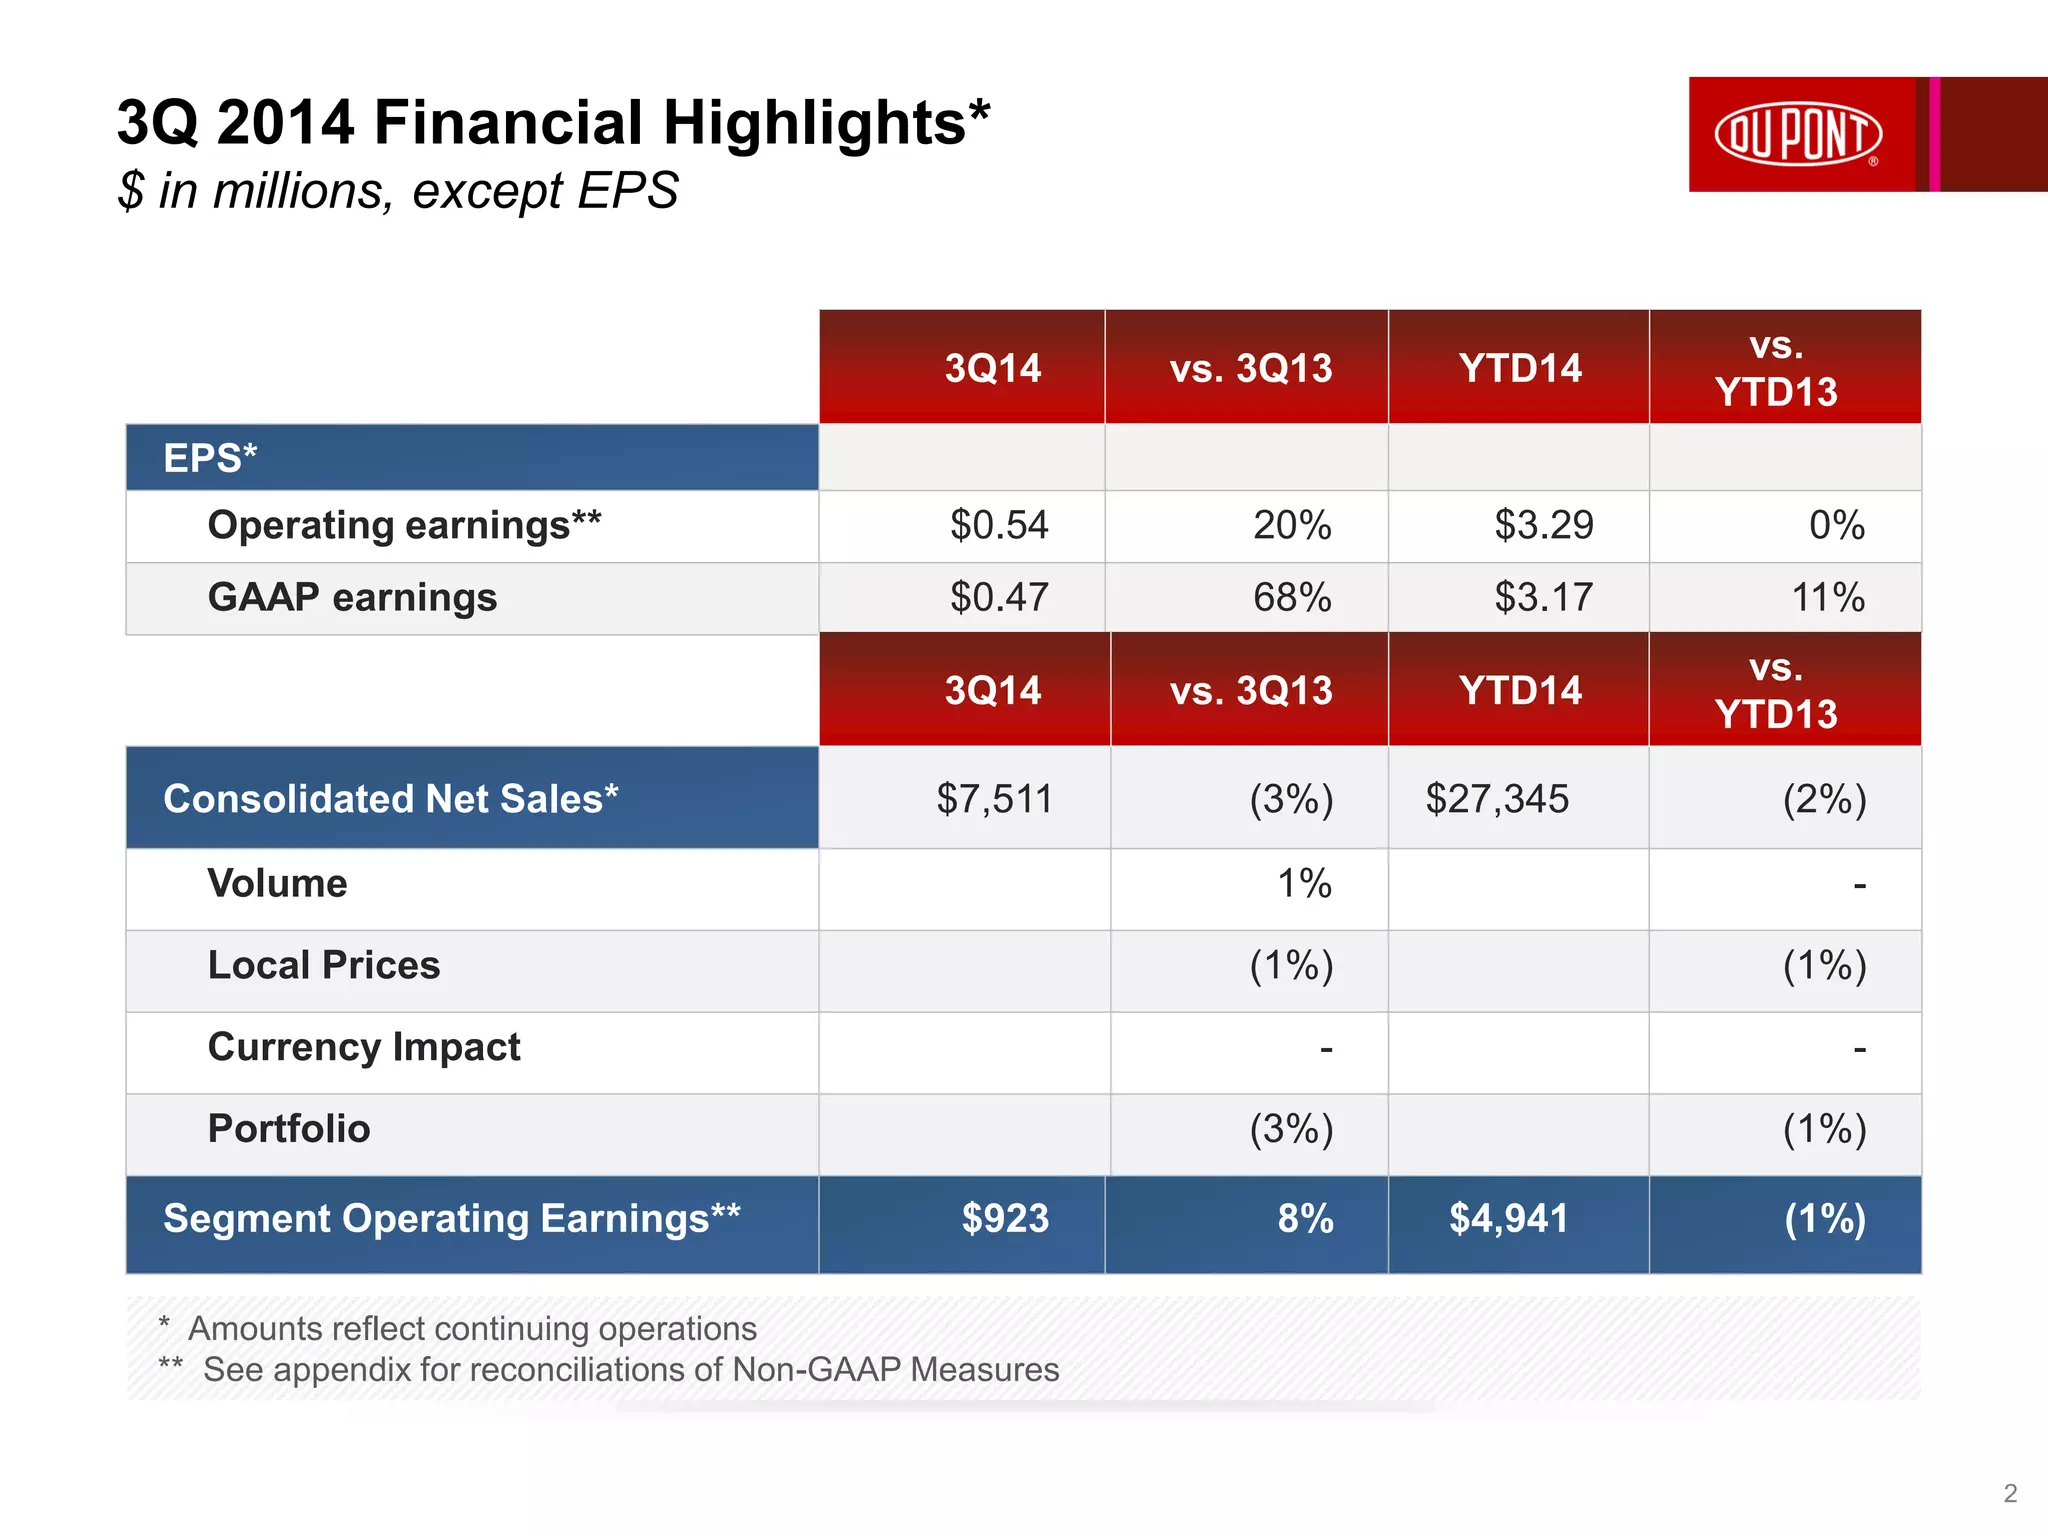
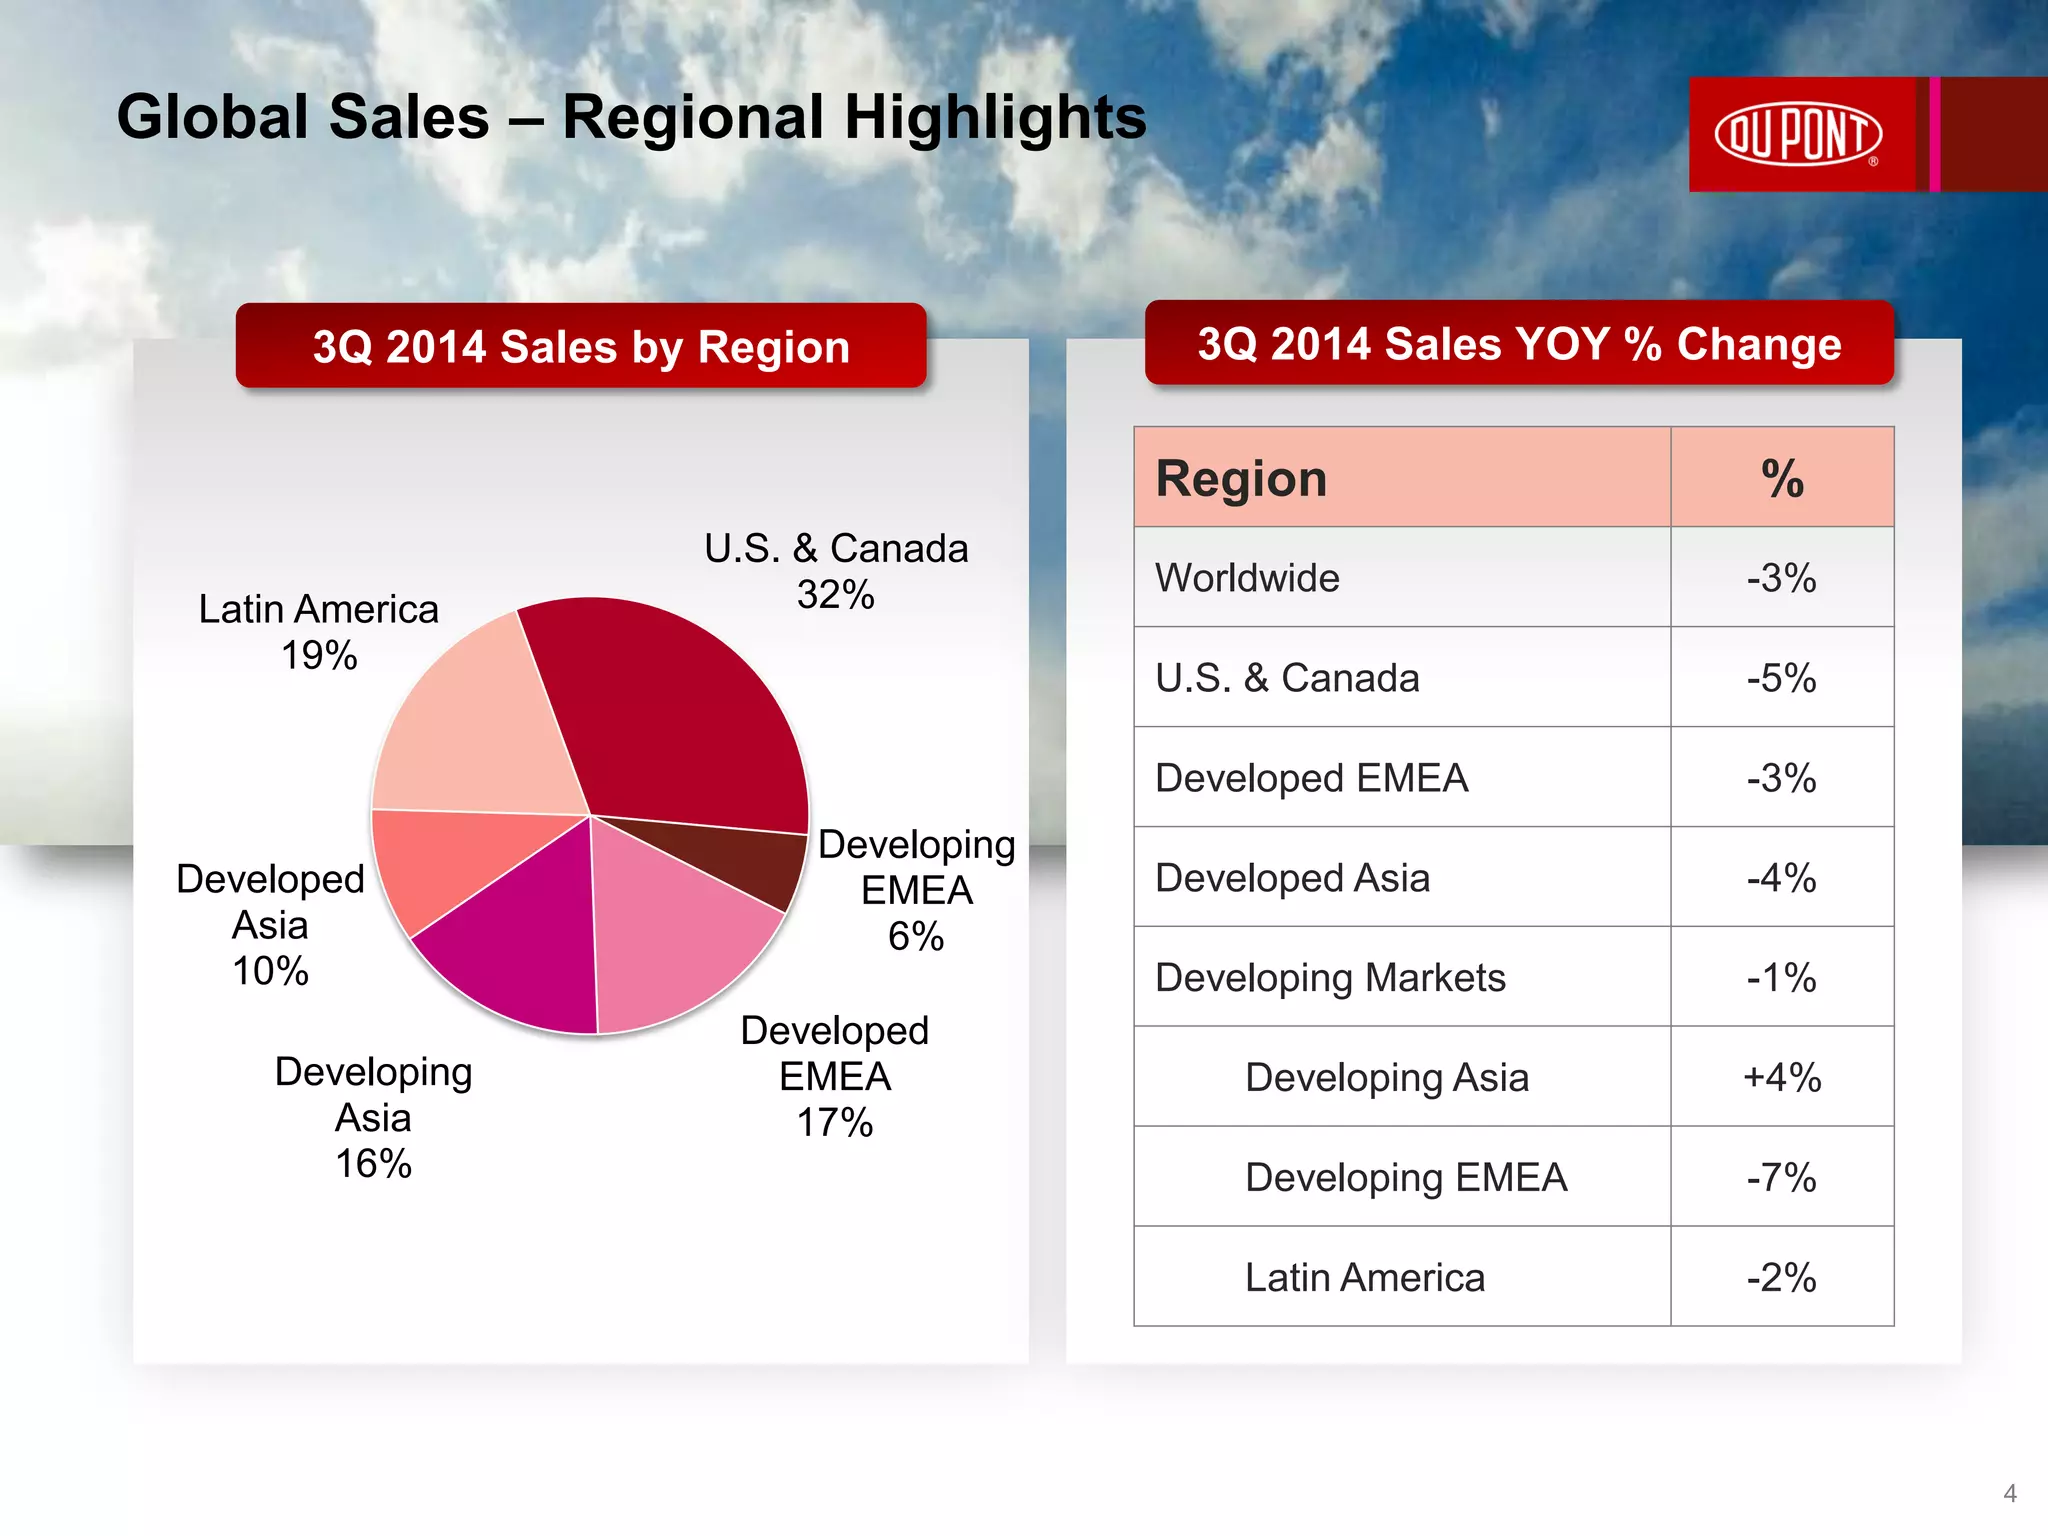
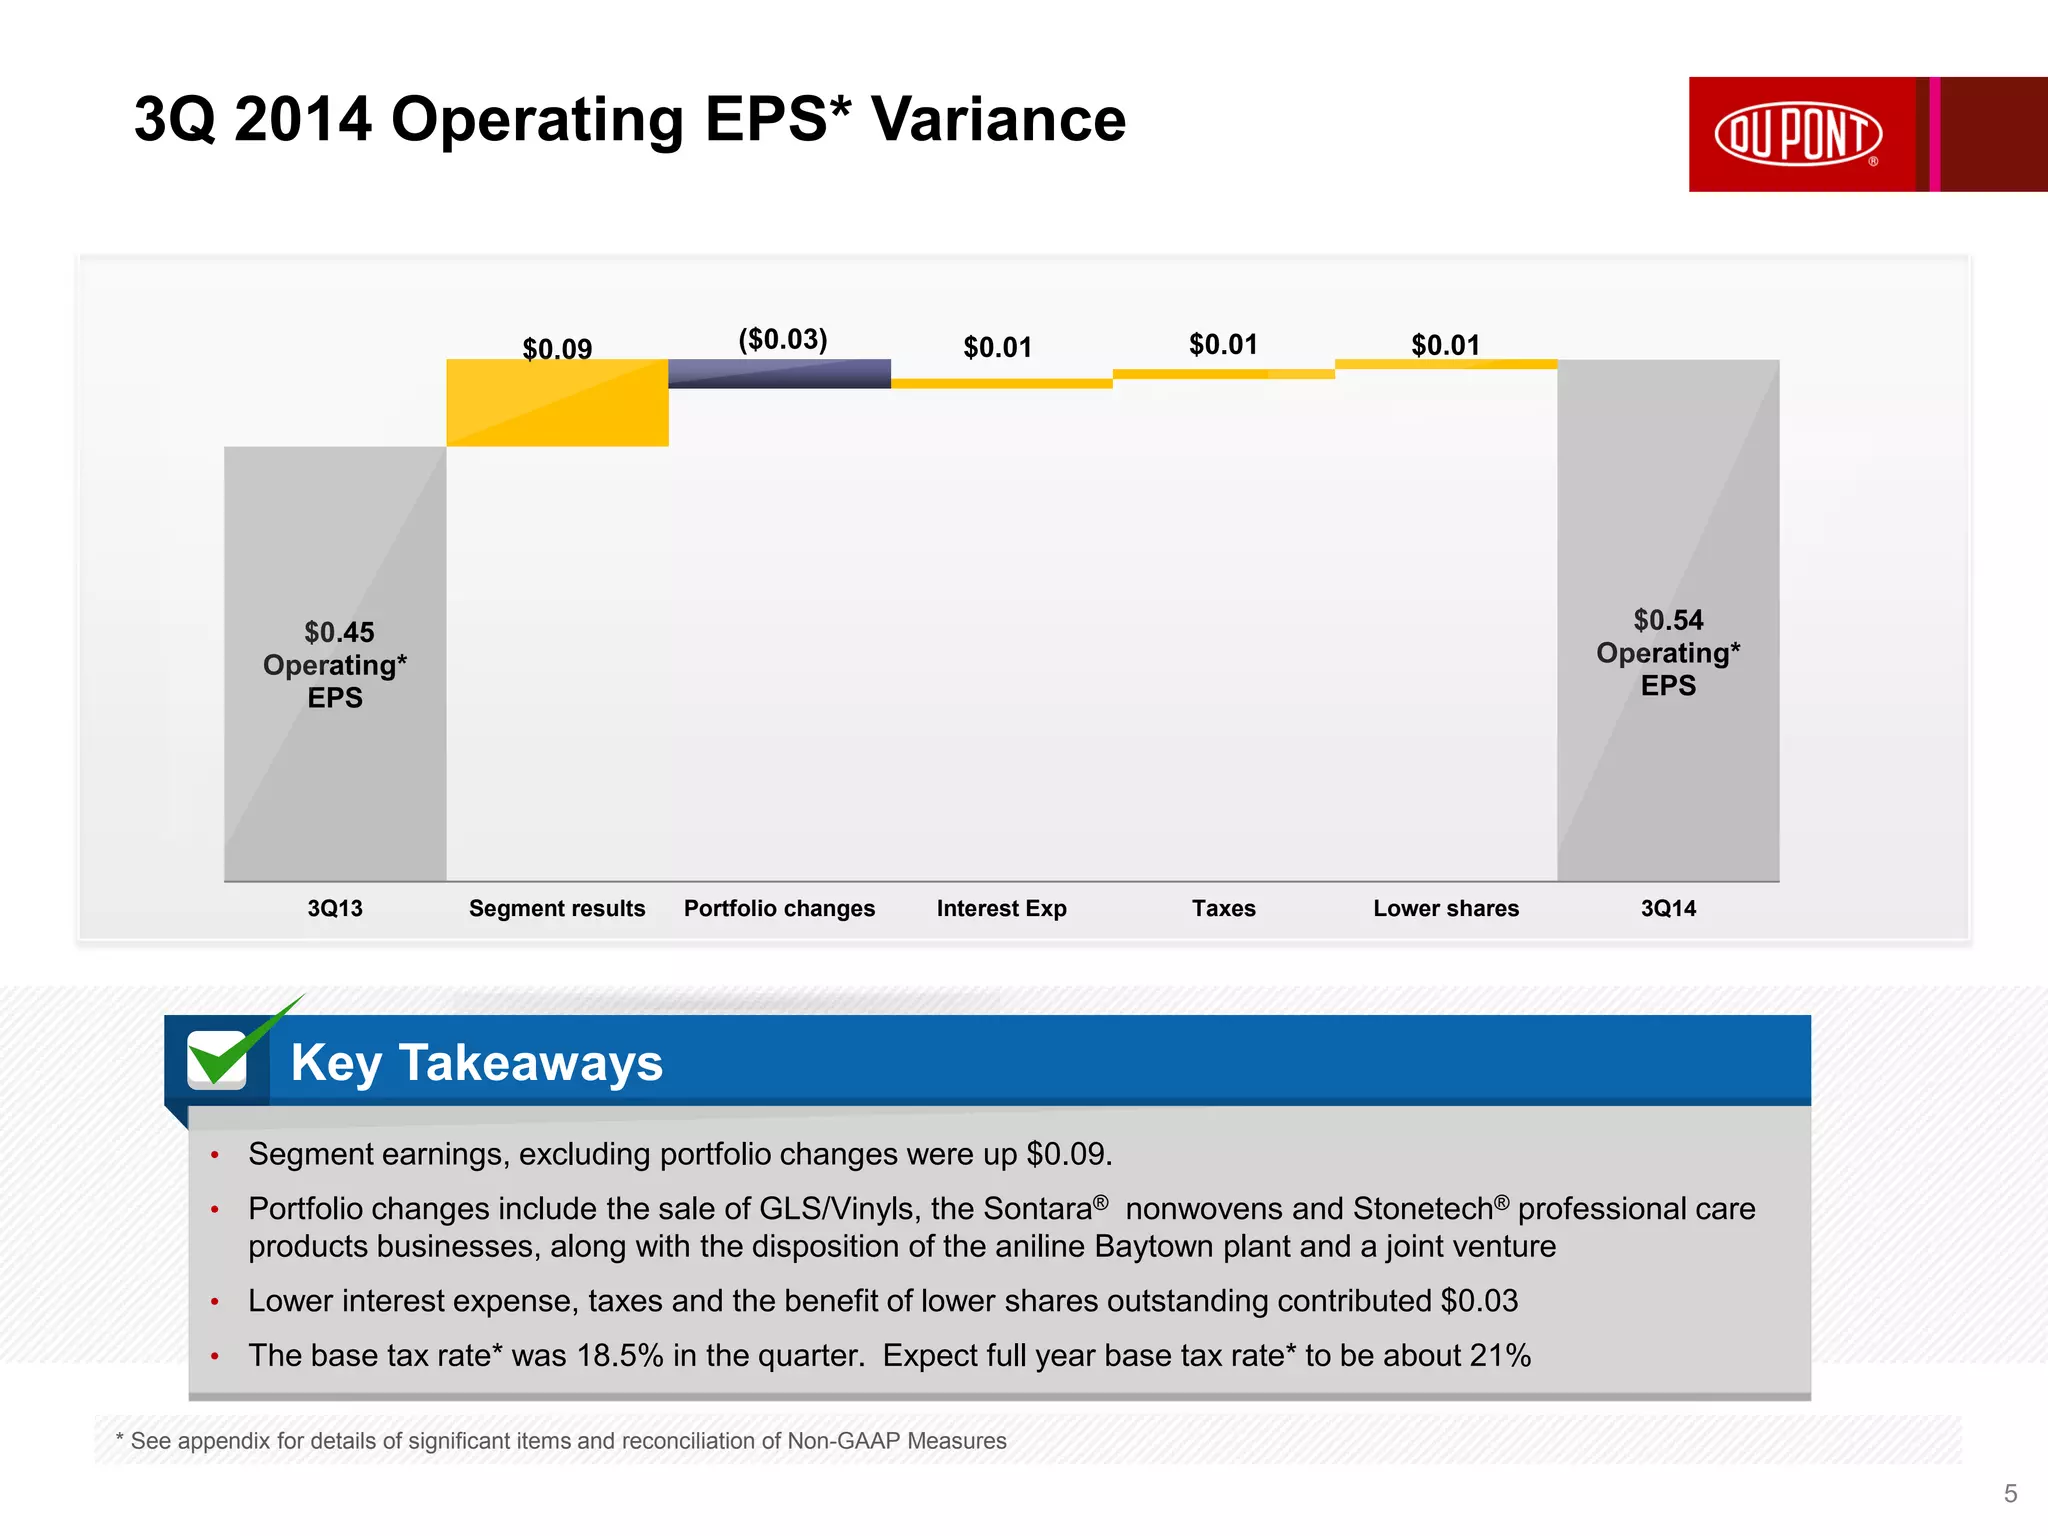
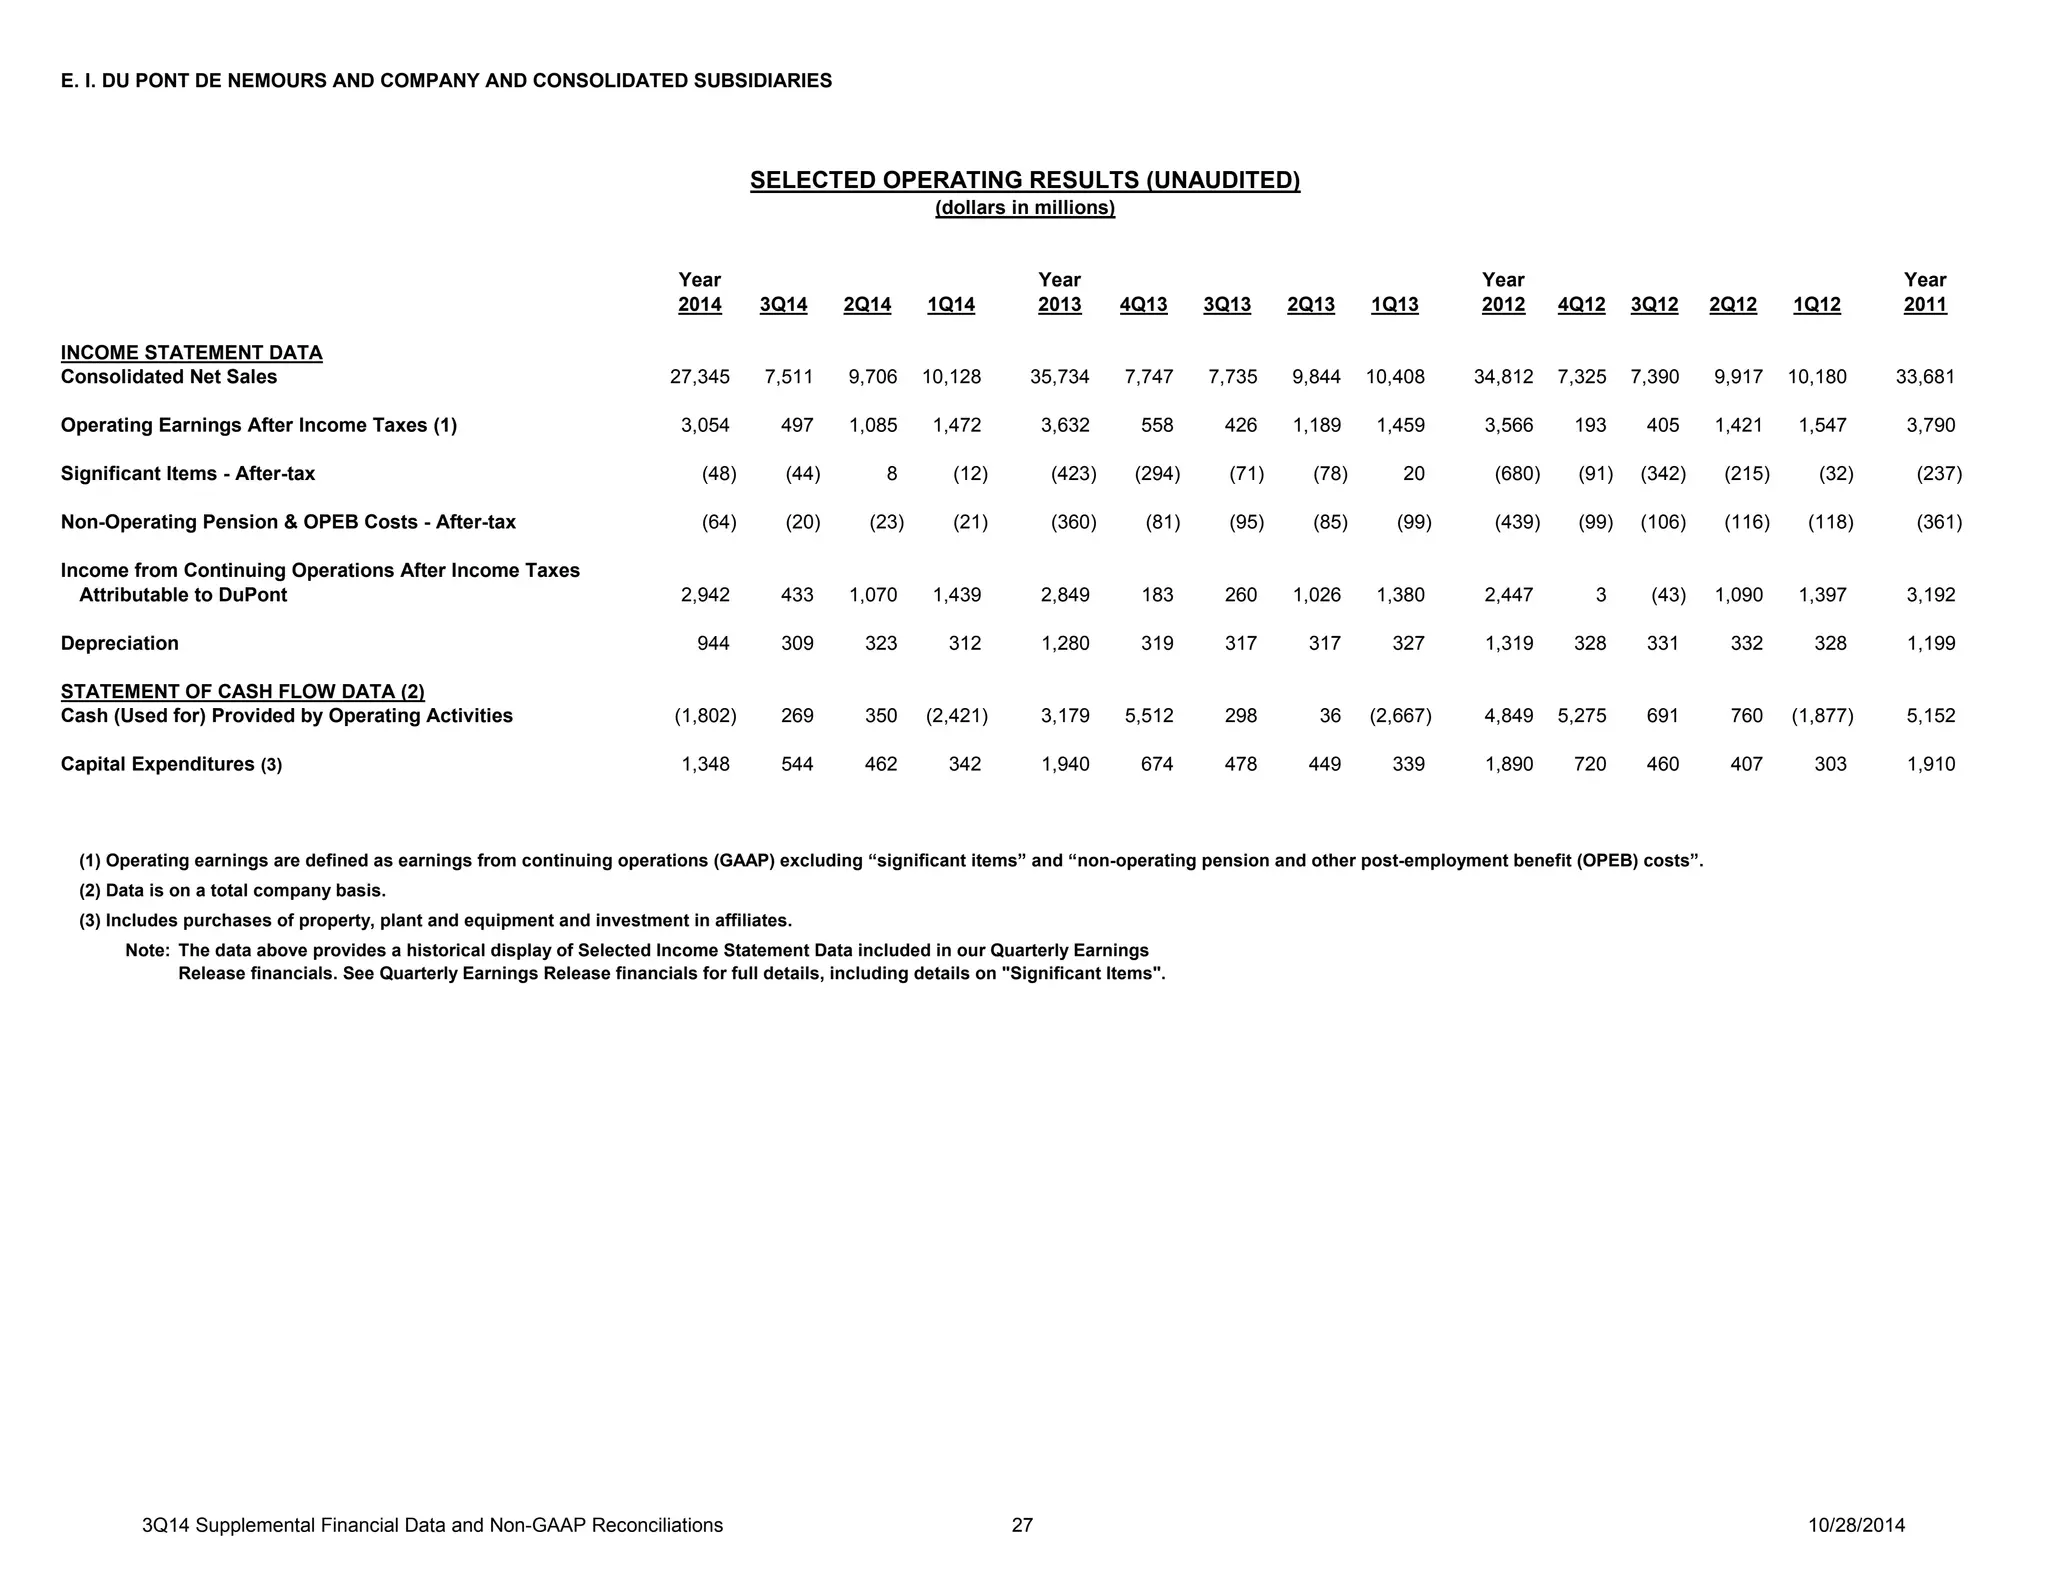
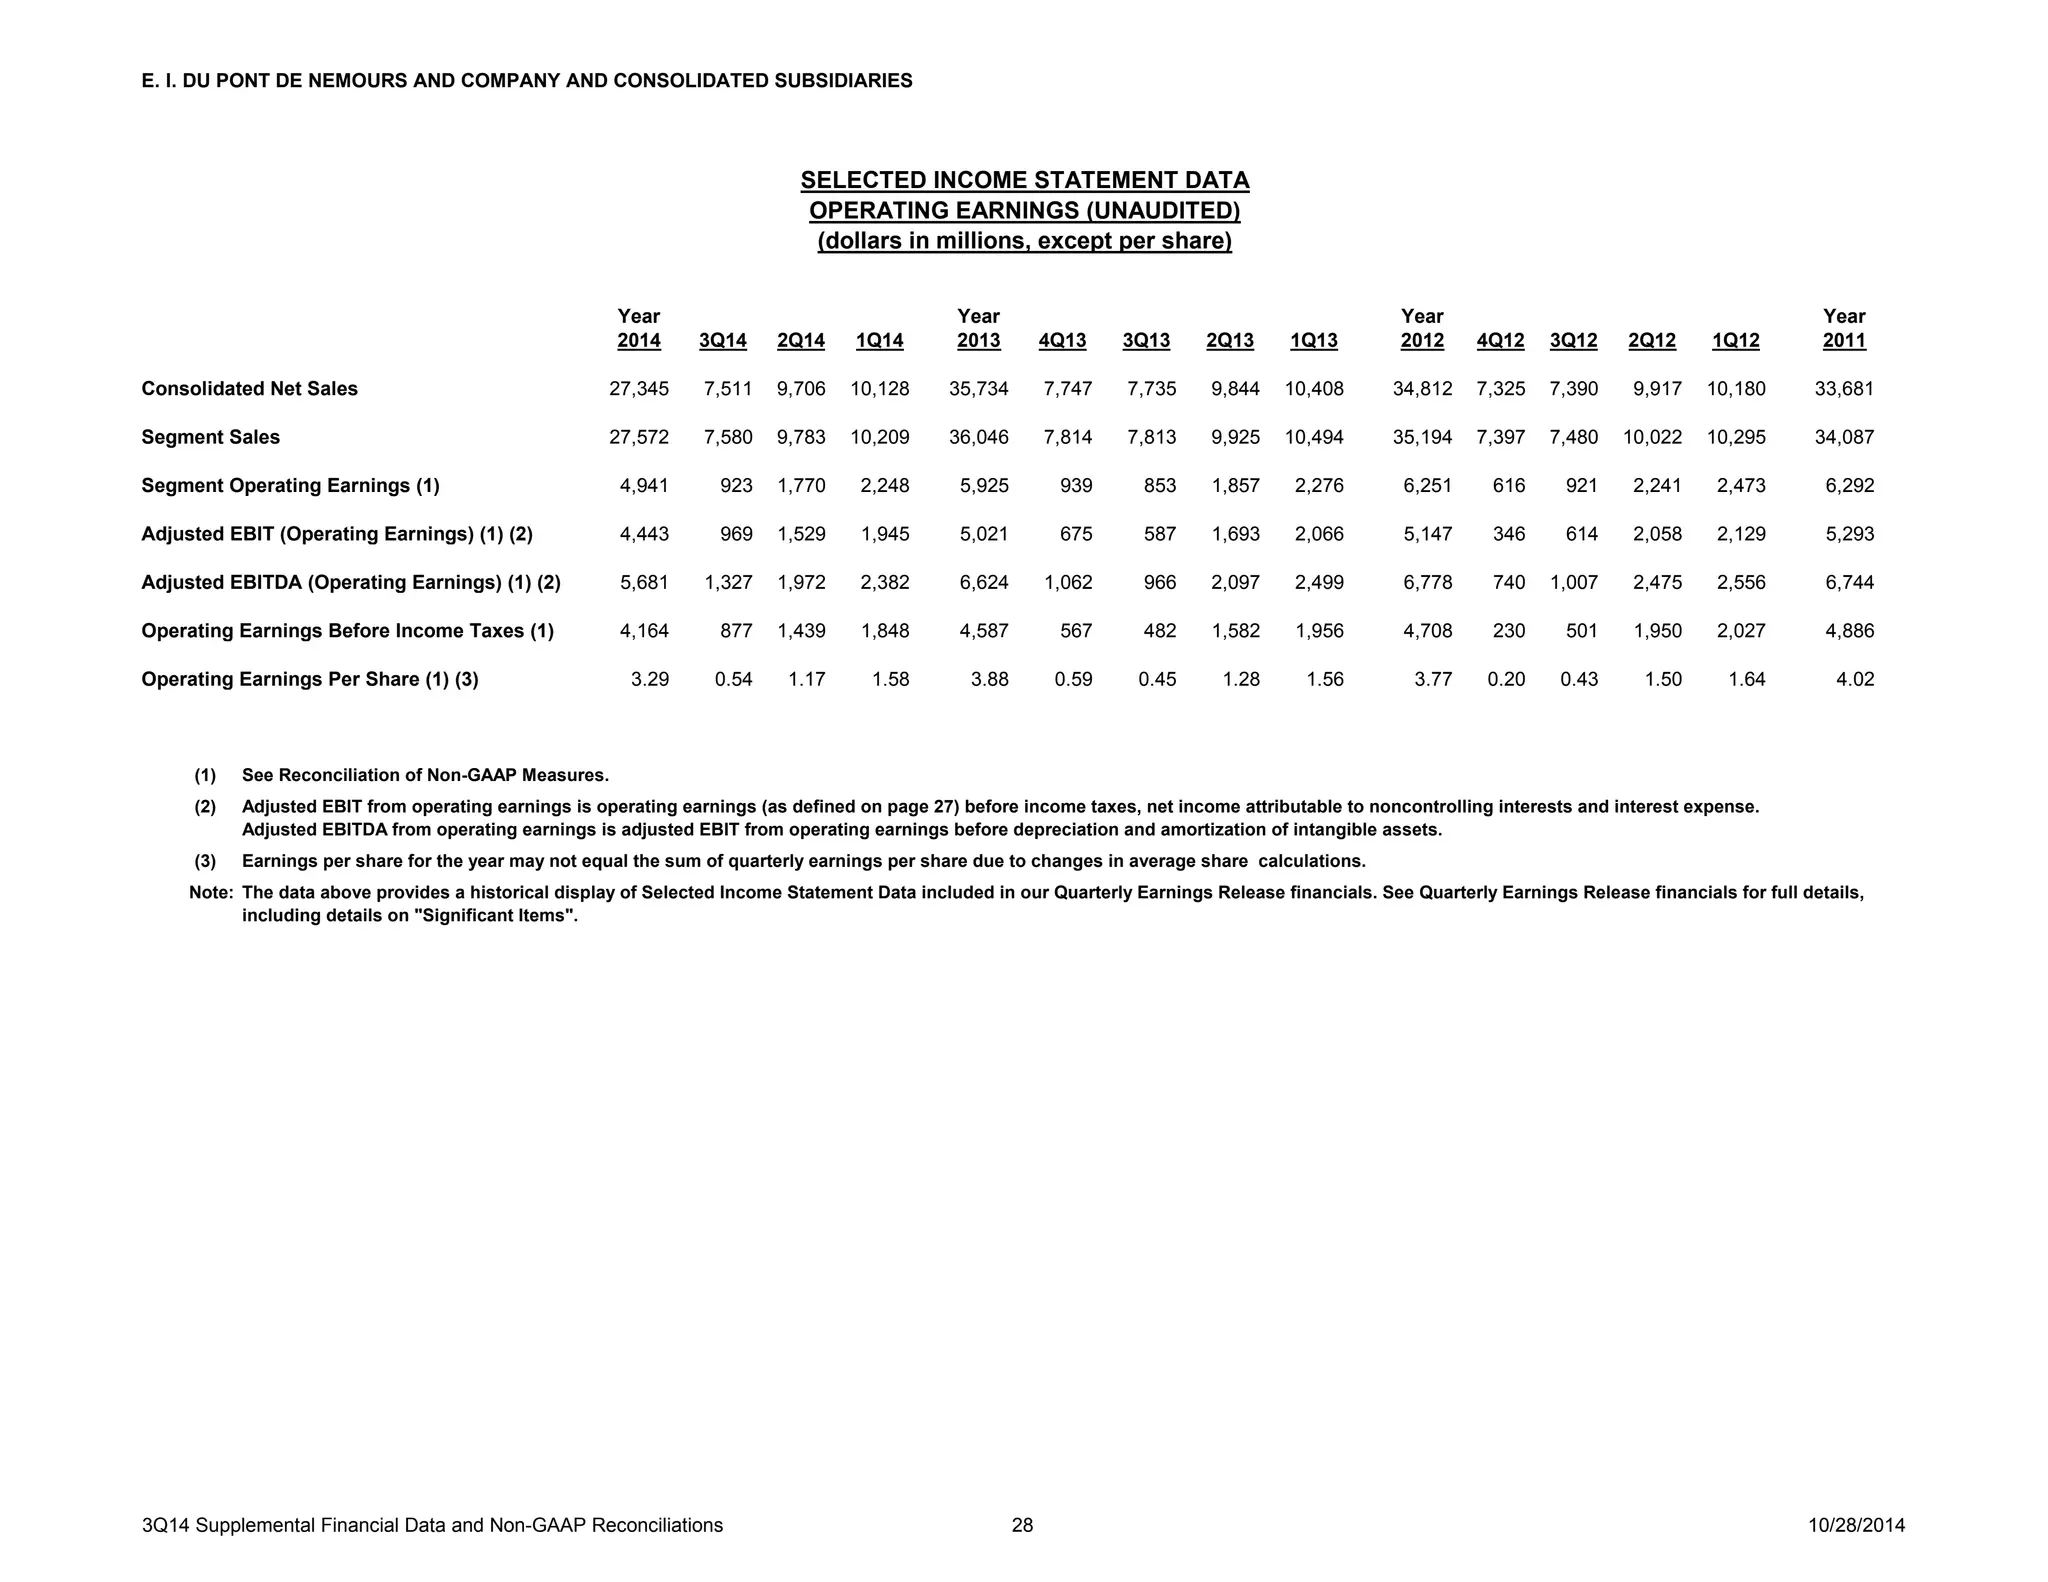
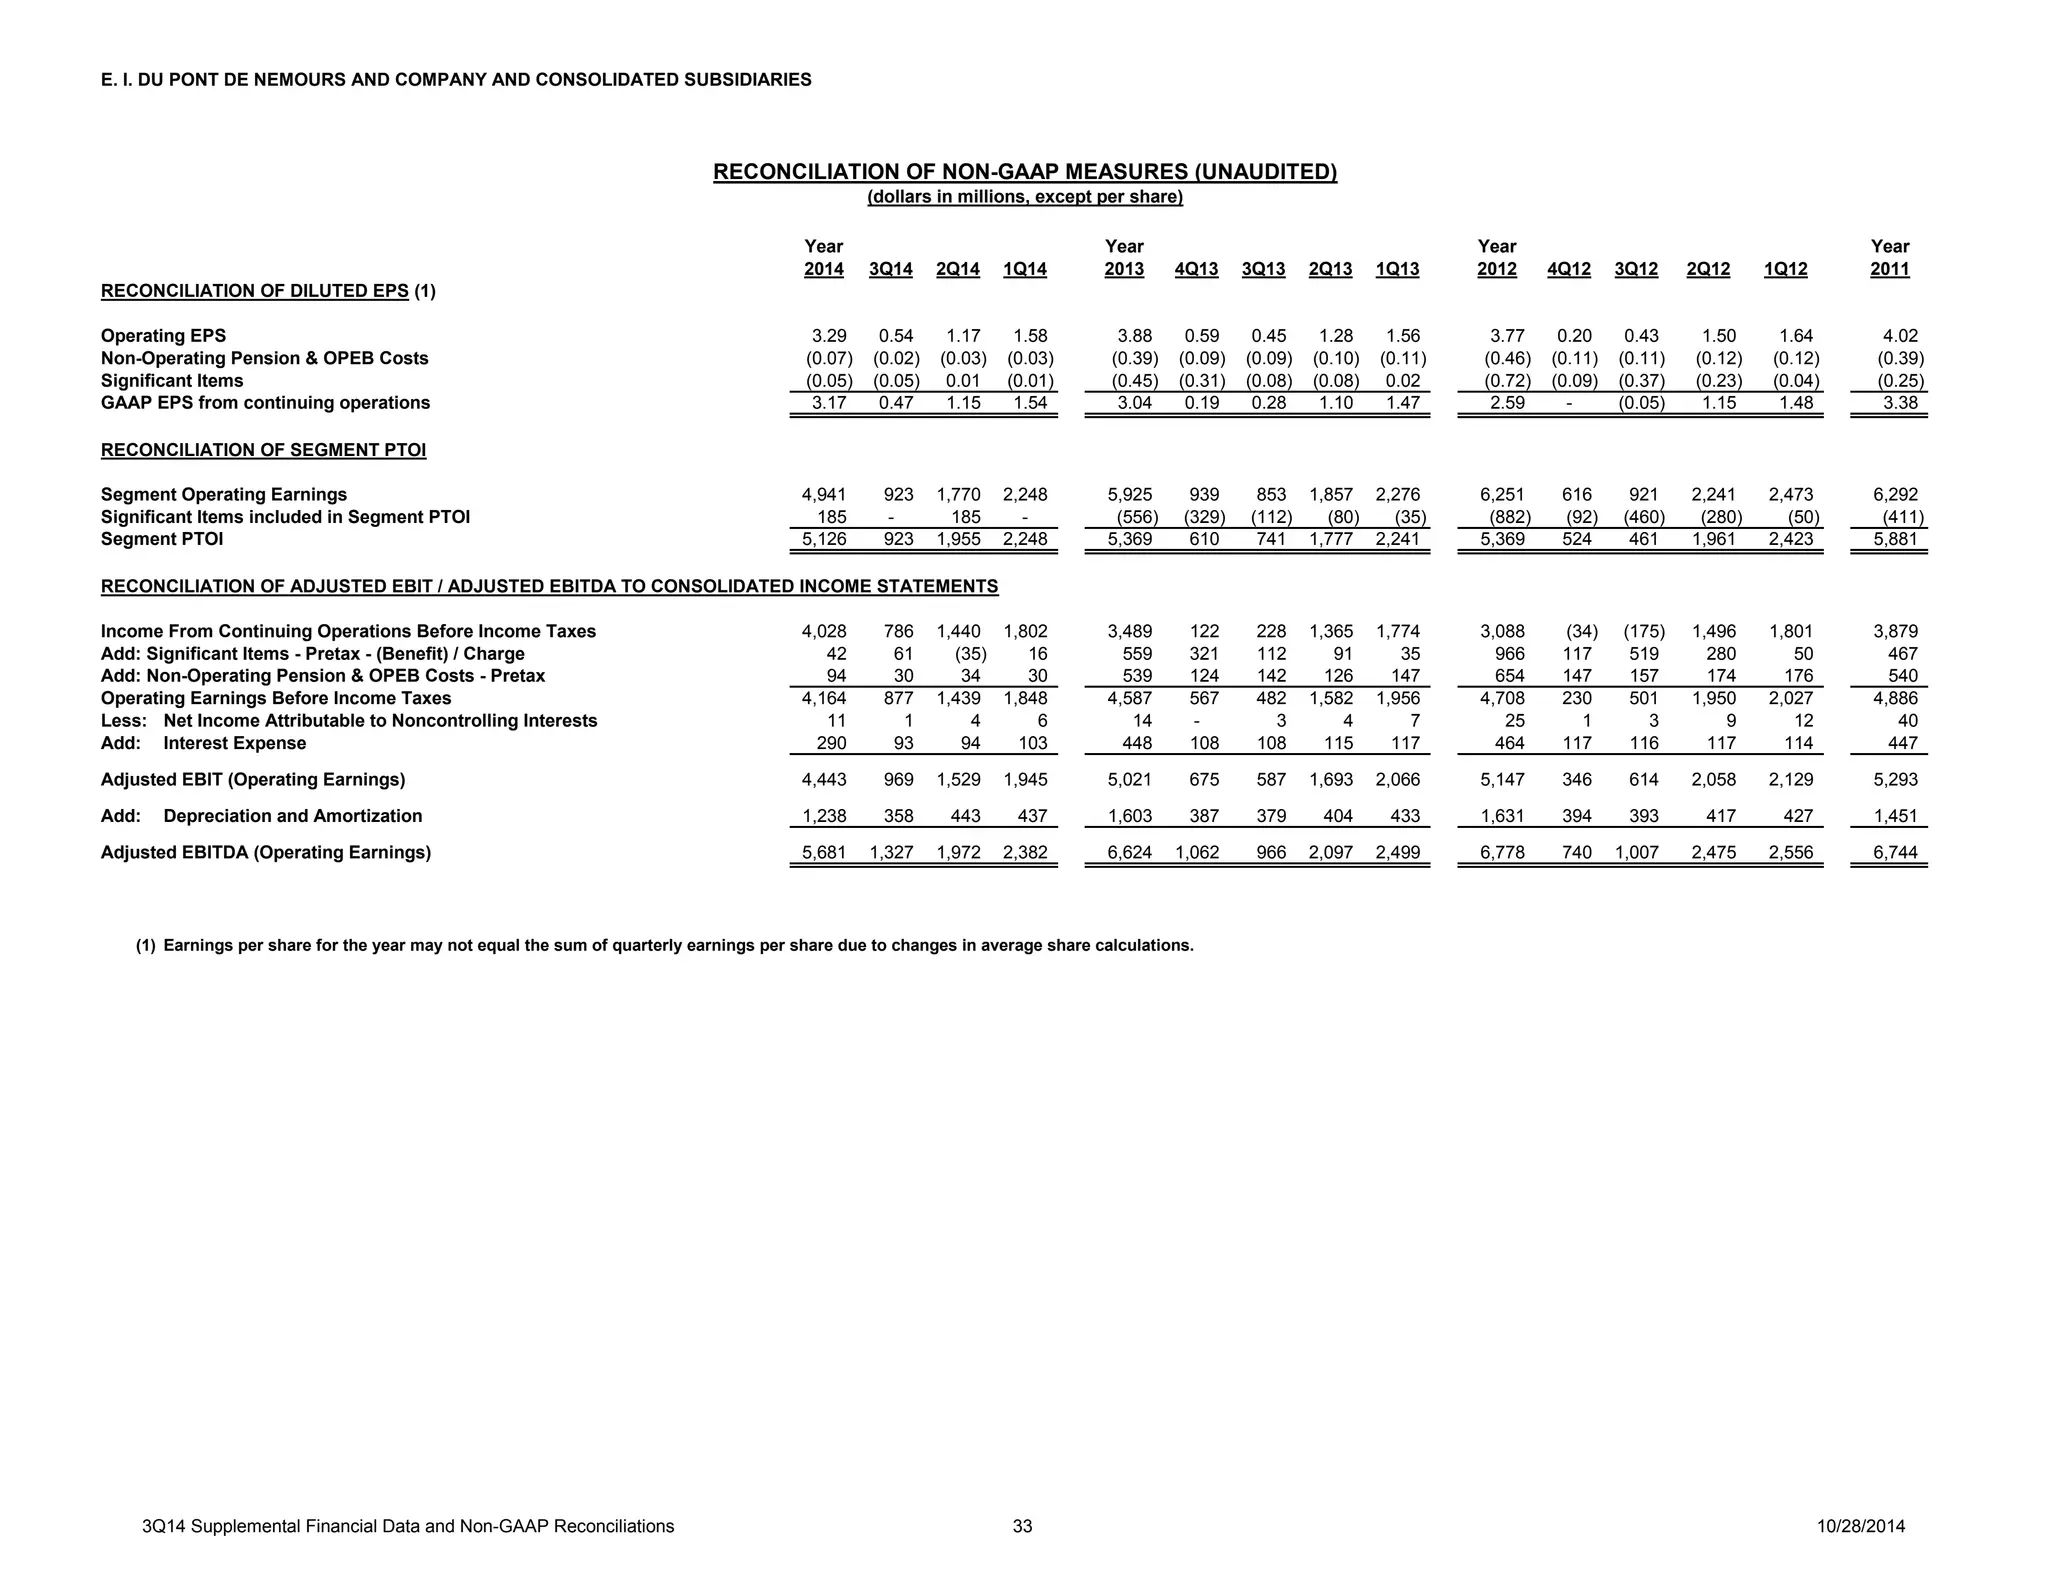
- DuPont reported third quarter 2014 earnings, with operating earnings per share up 20% year-over-year to $0.54. Net sales were down 3% to $7.5 billion due to portfolio changes and currency impacts.
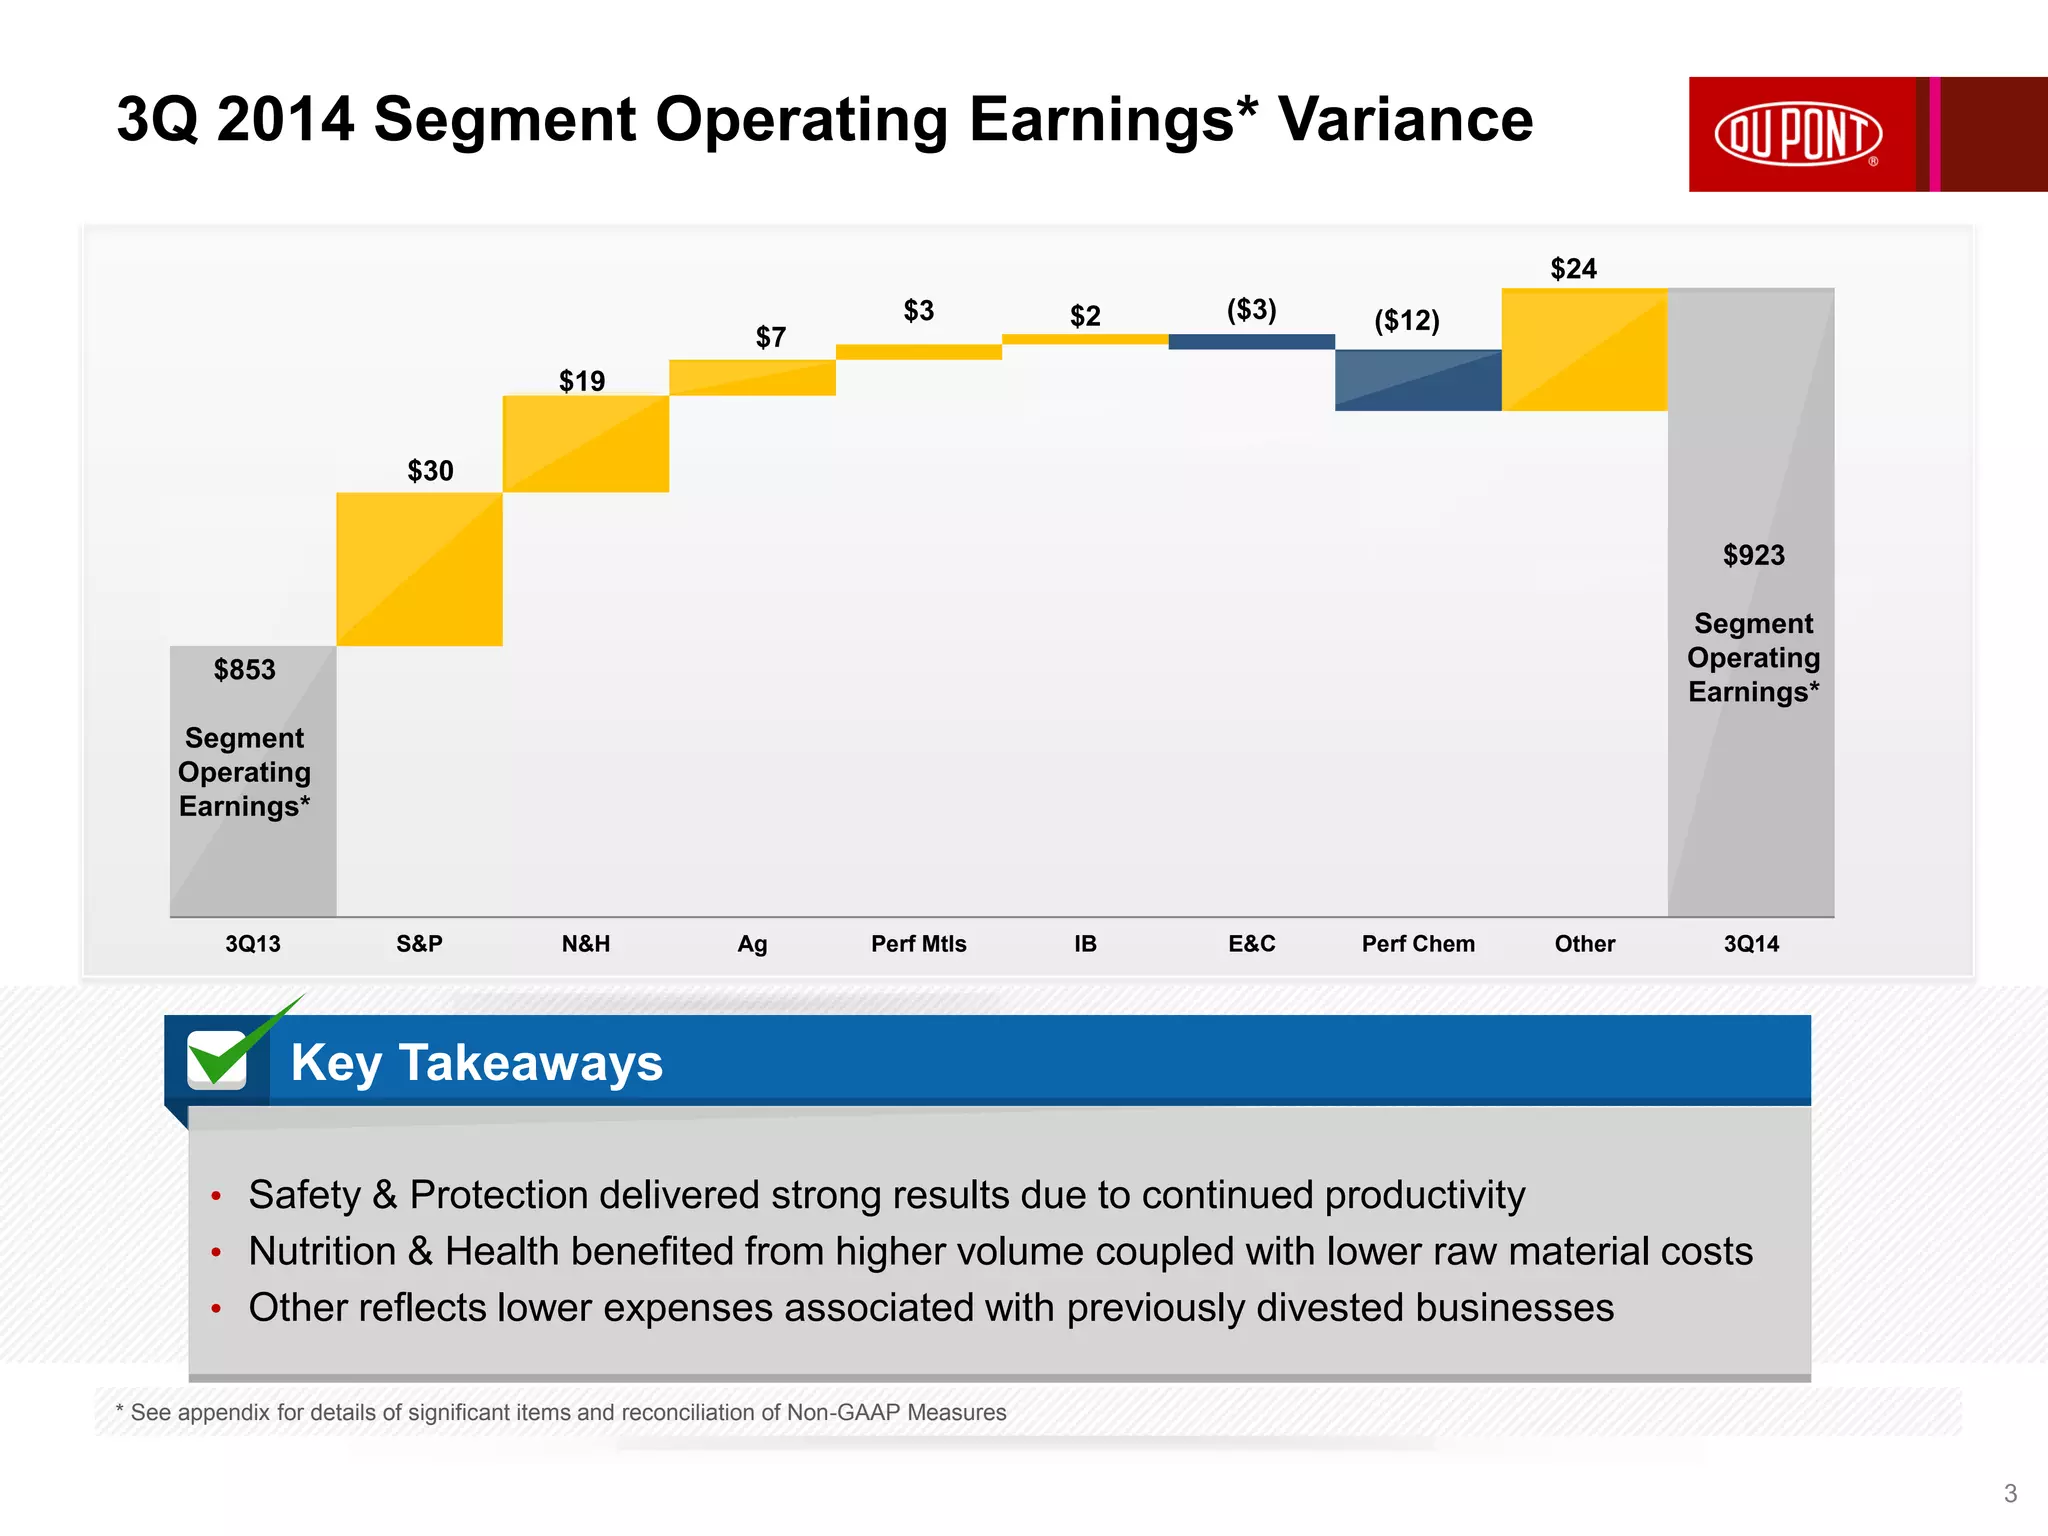
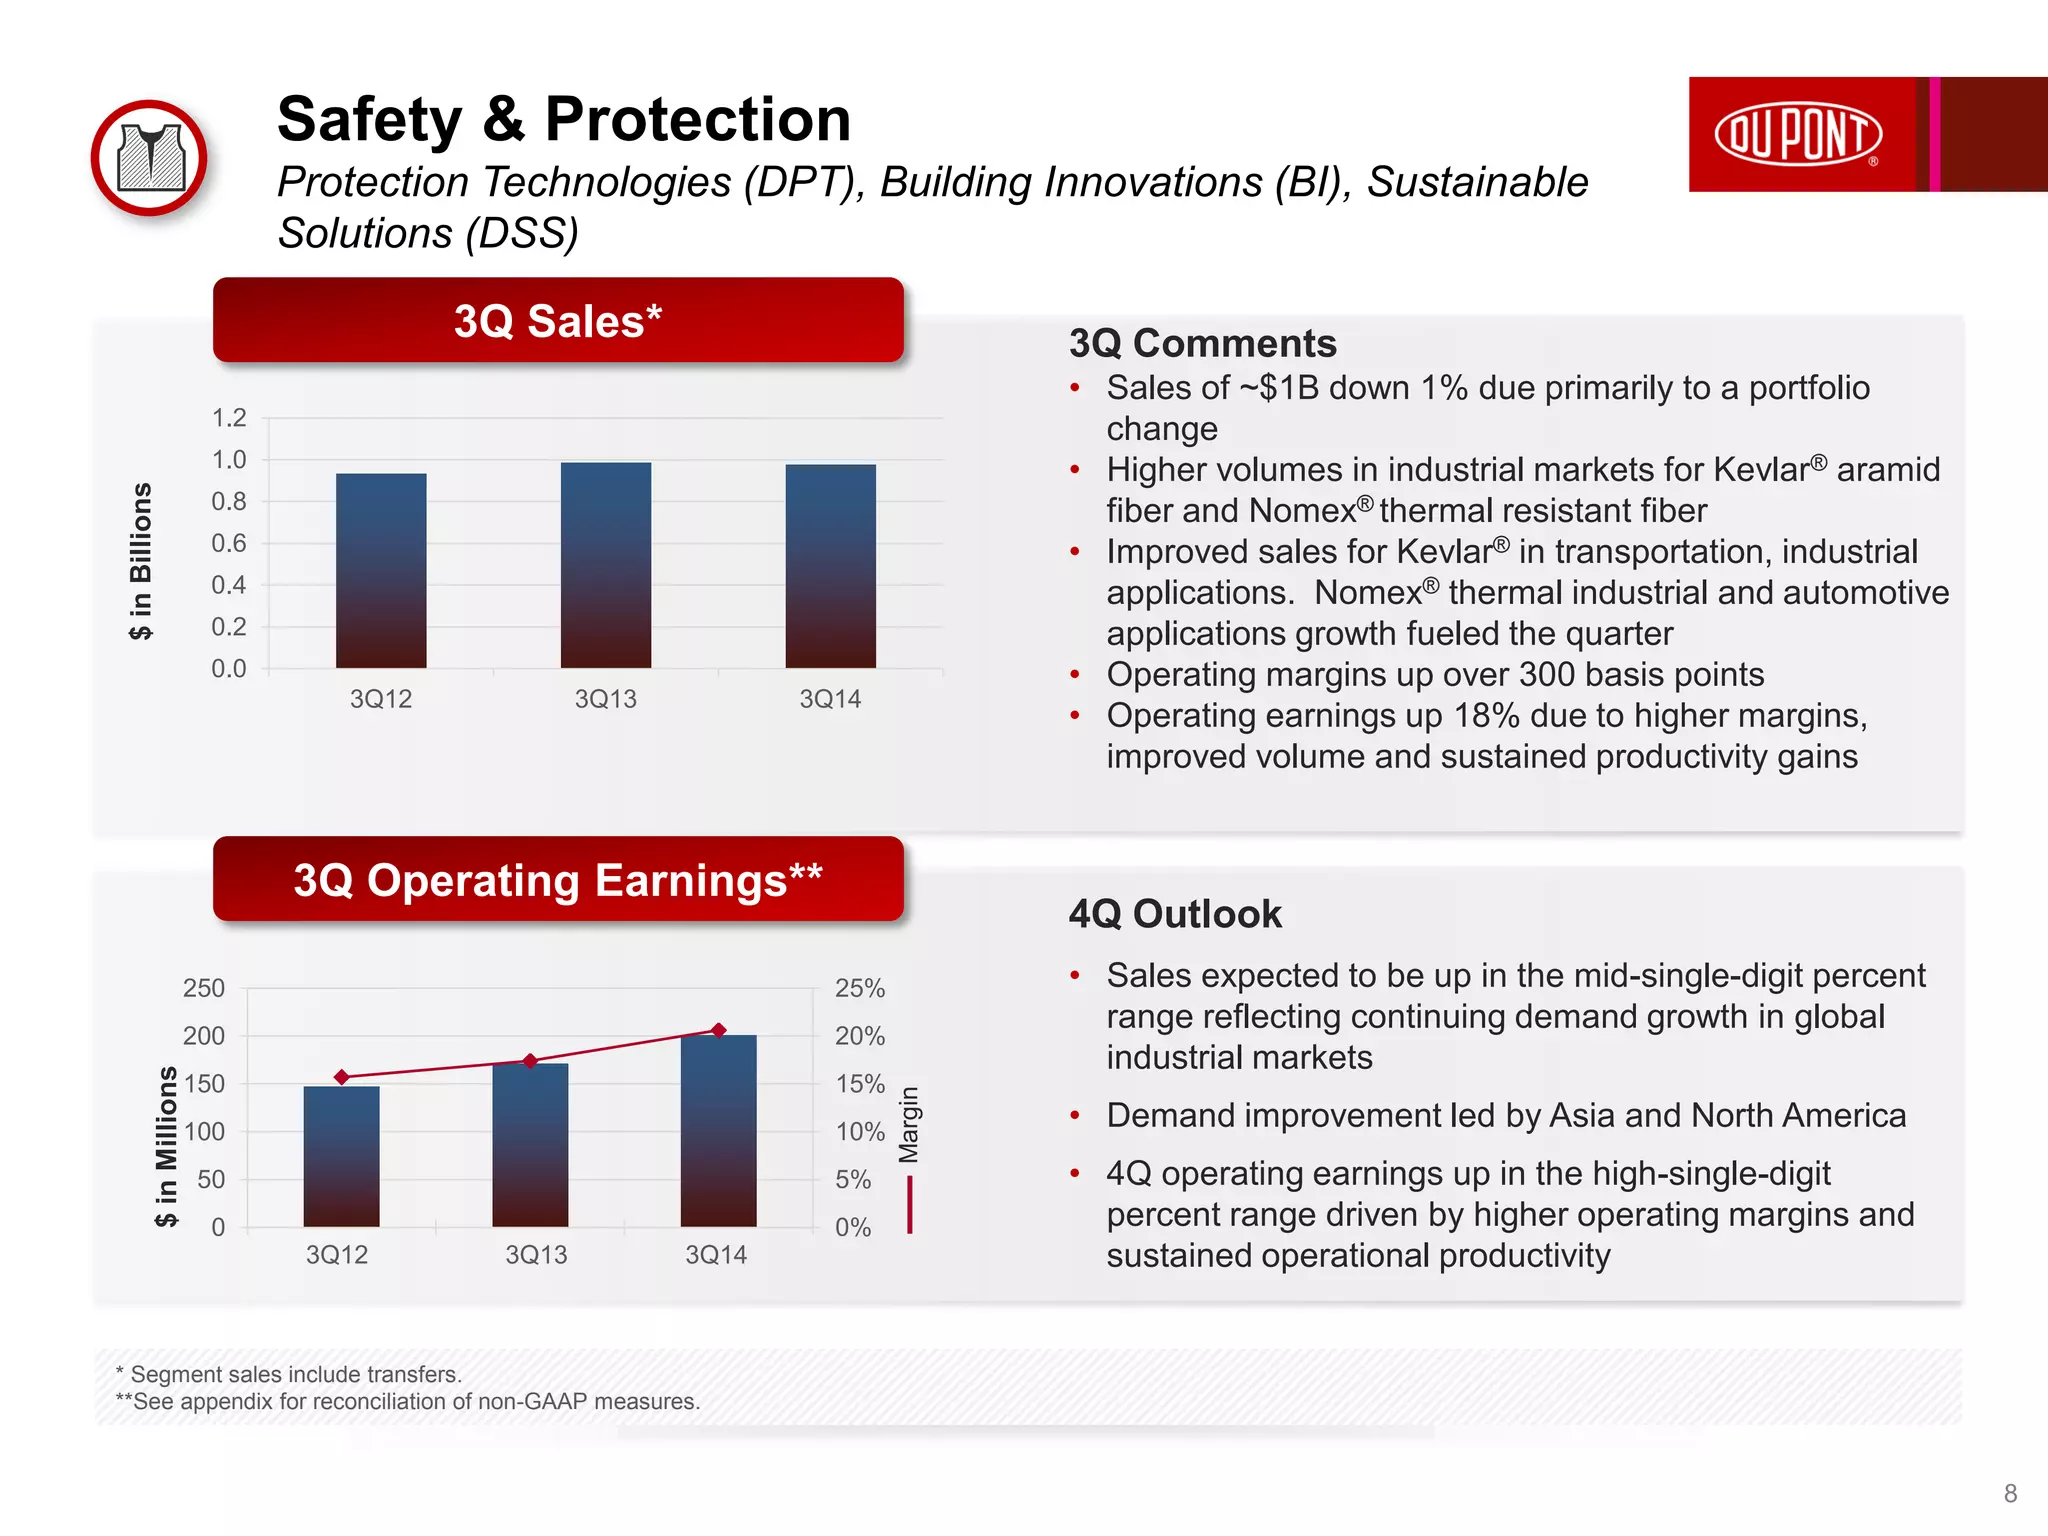
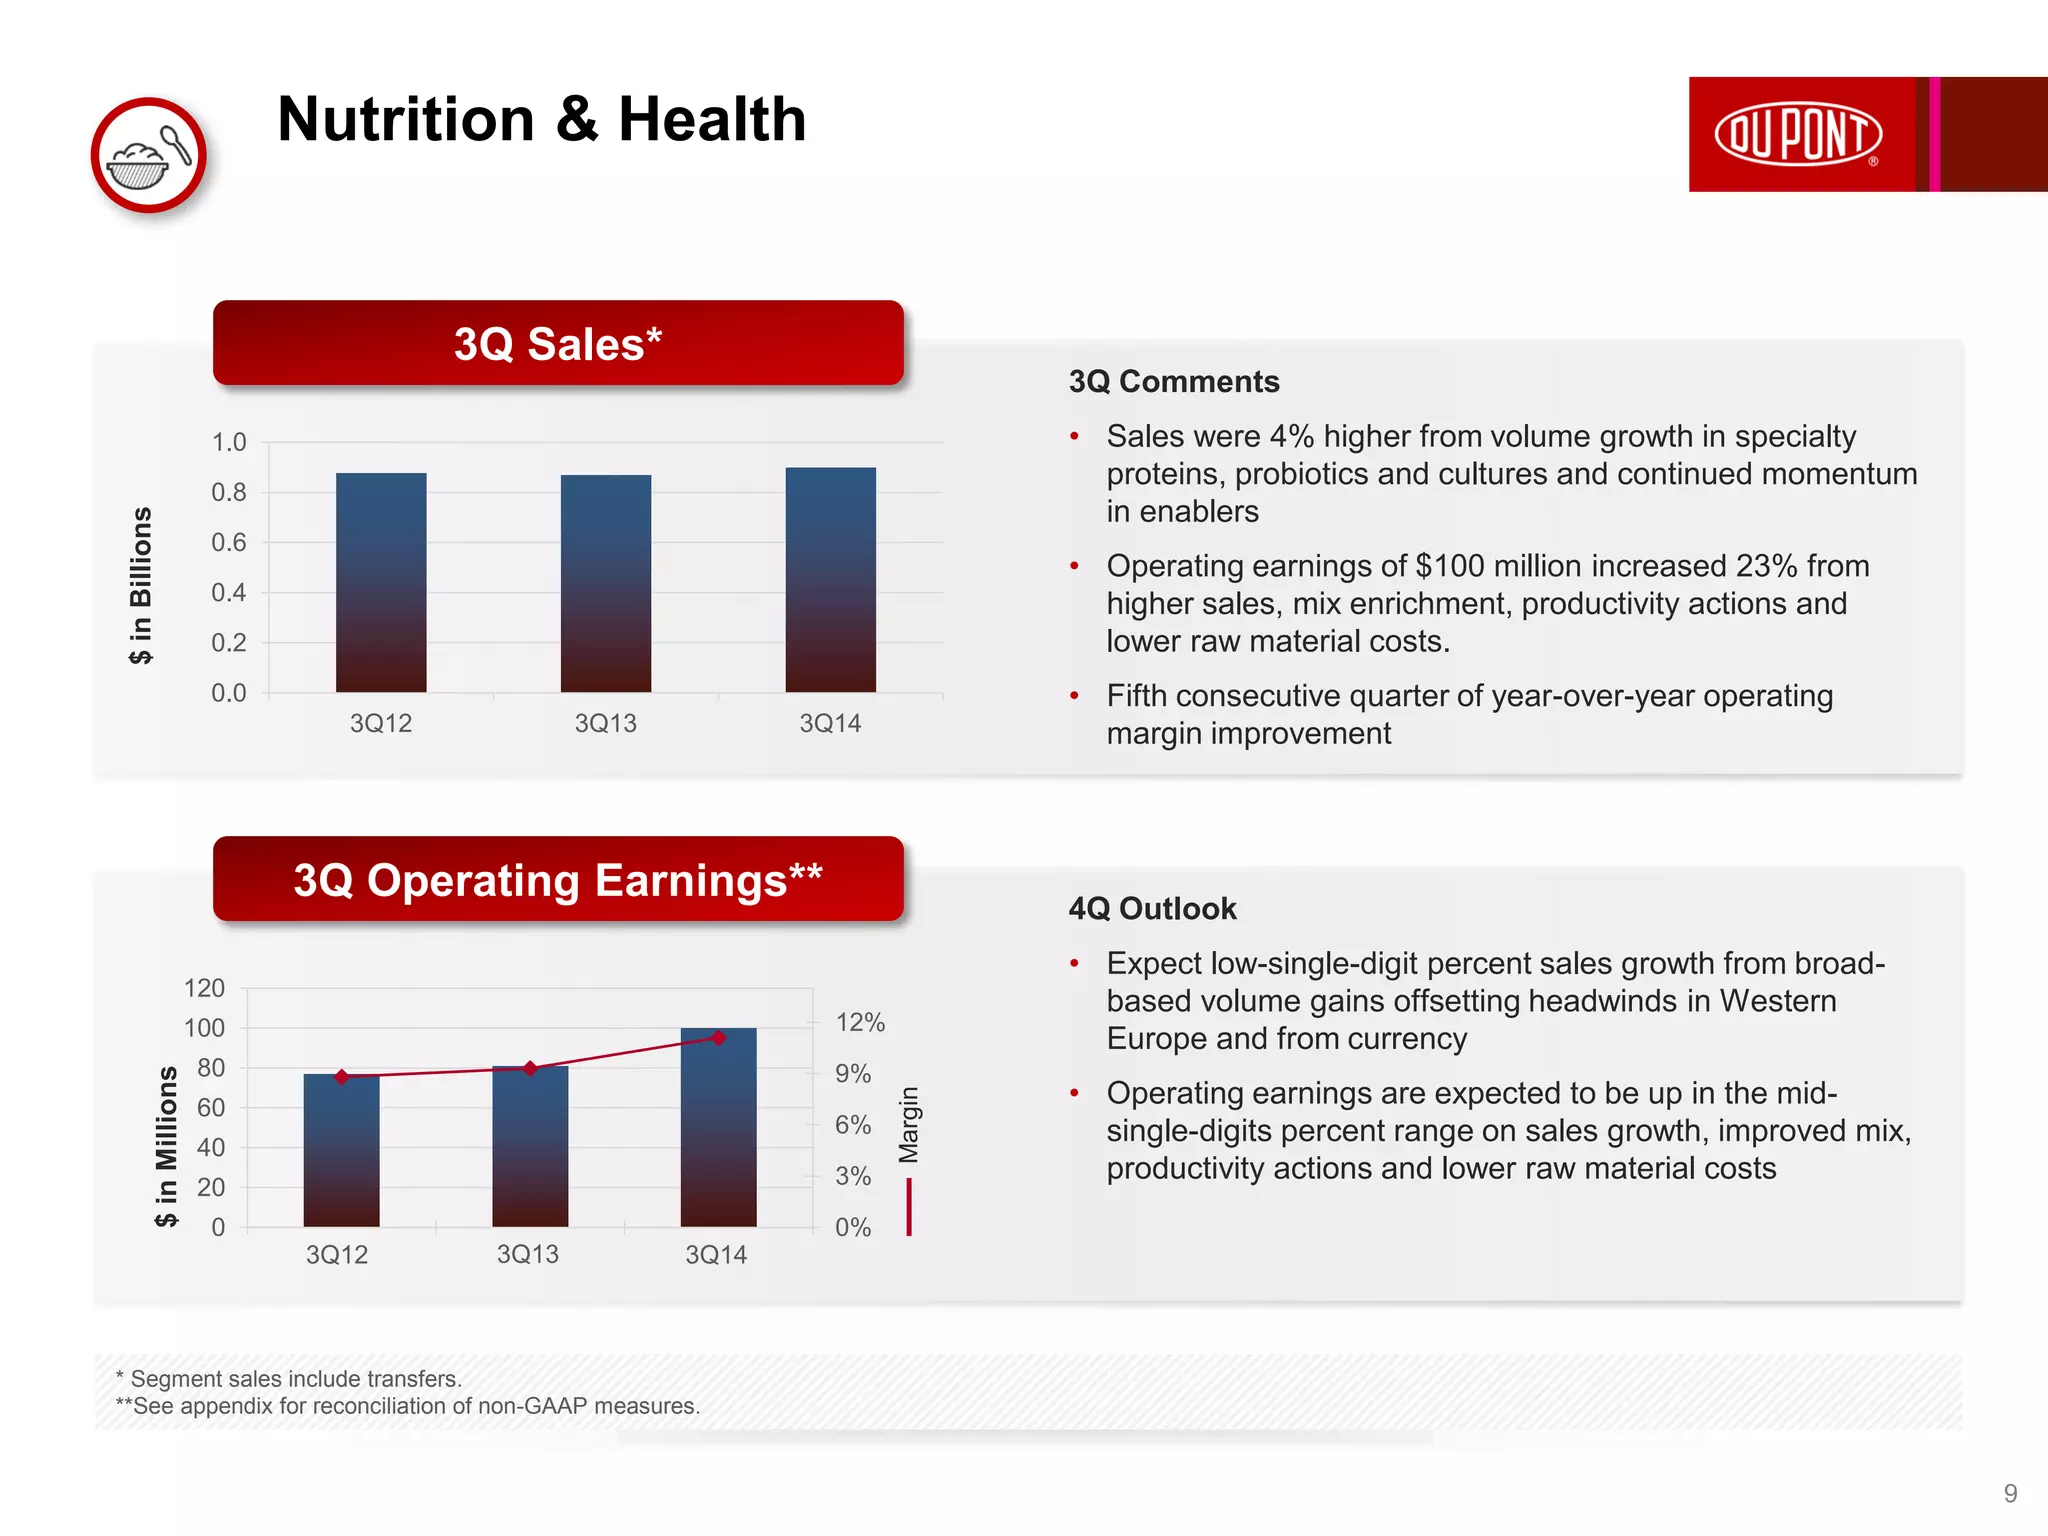
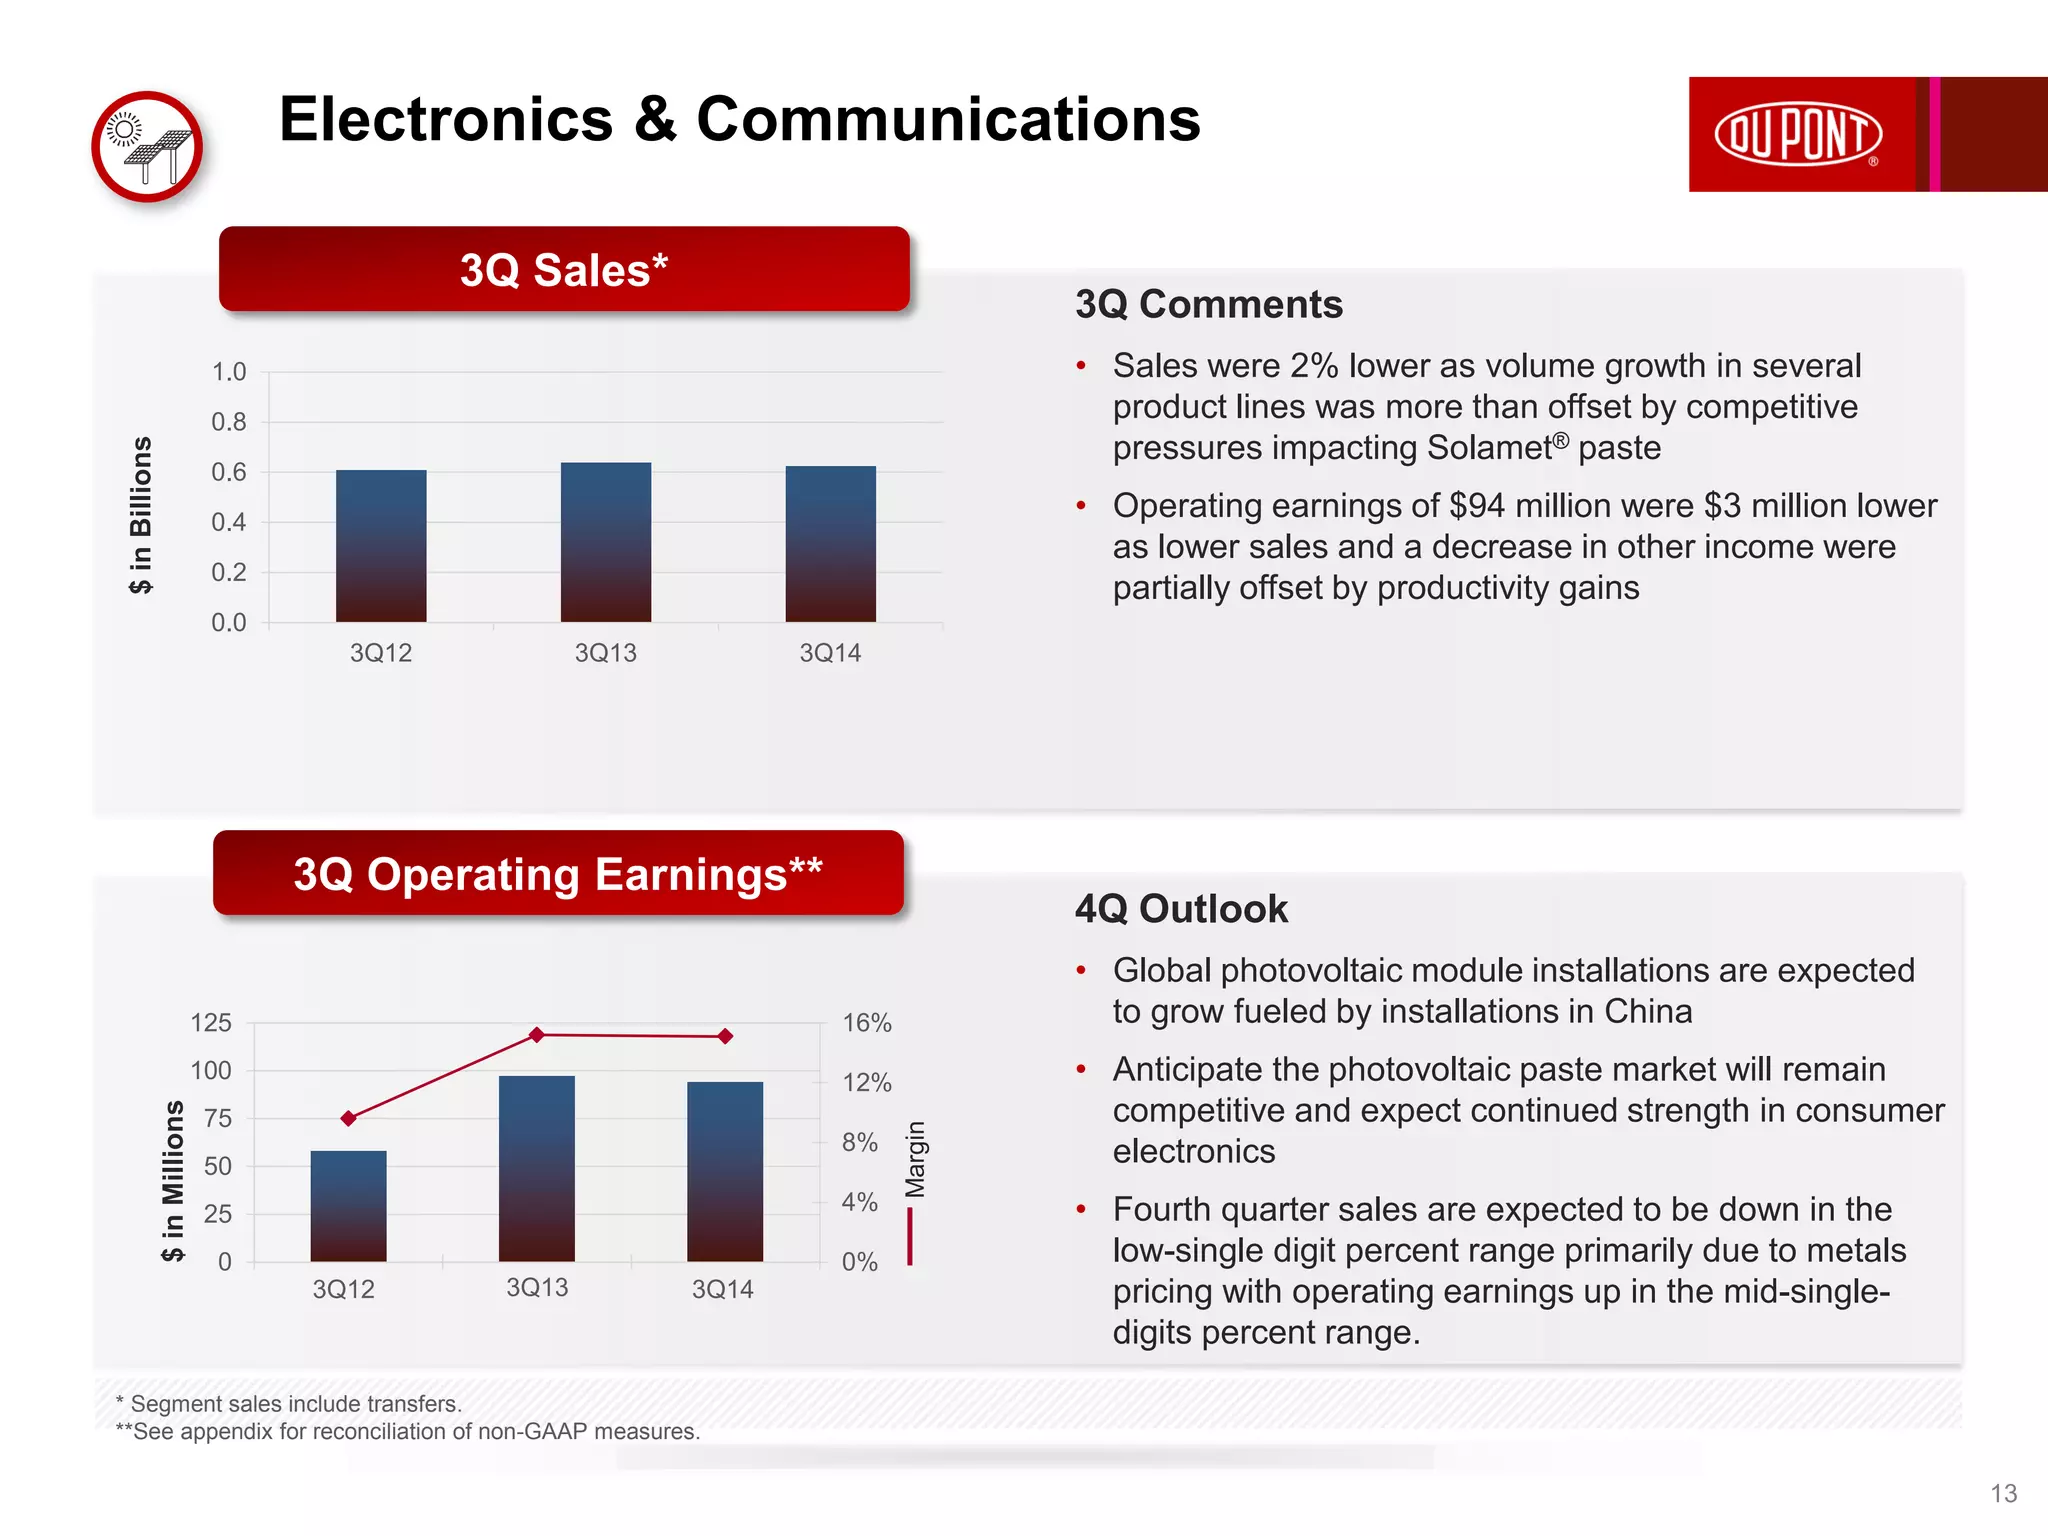
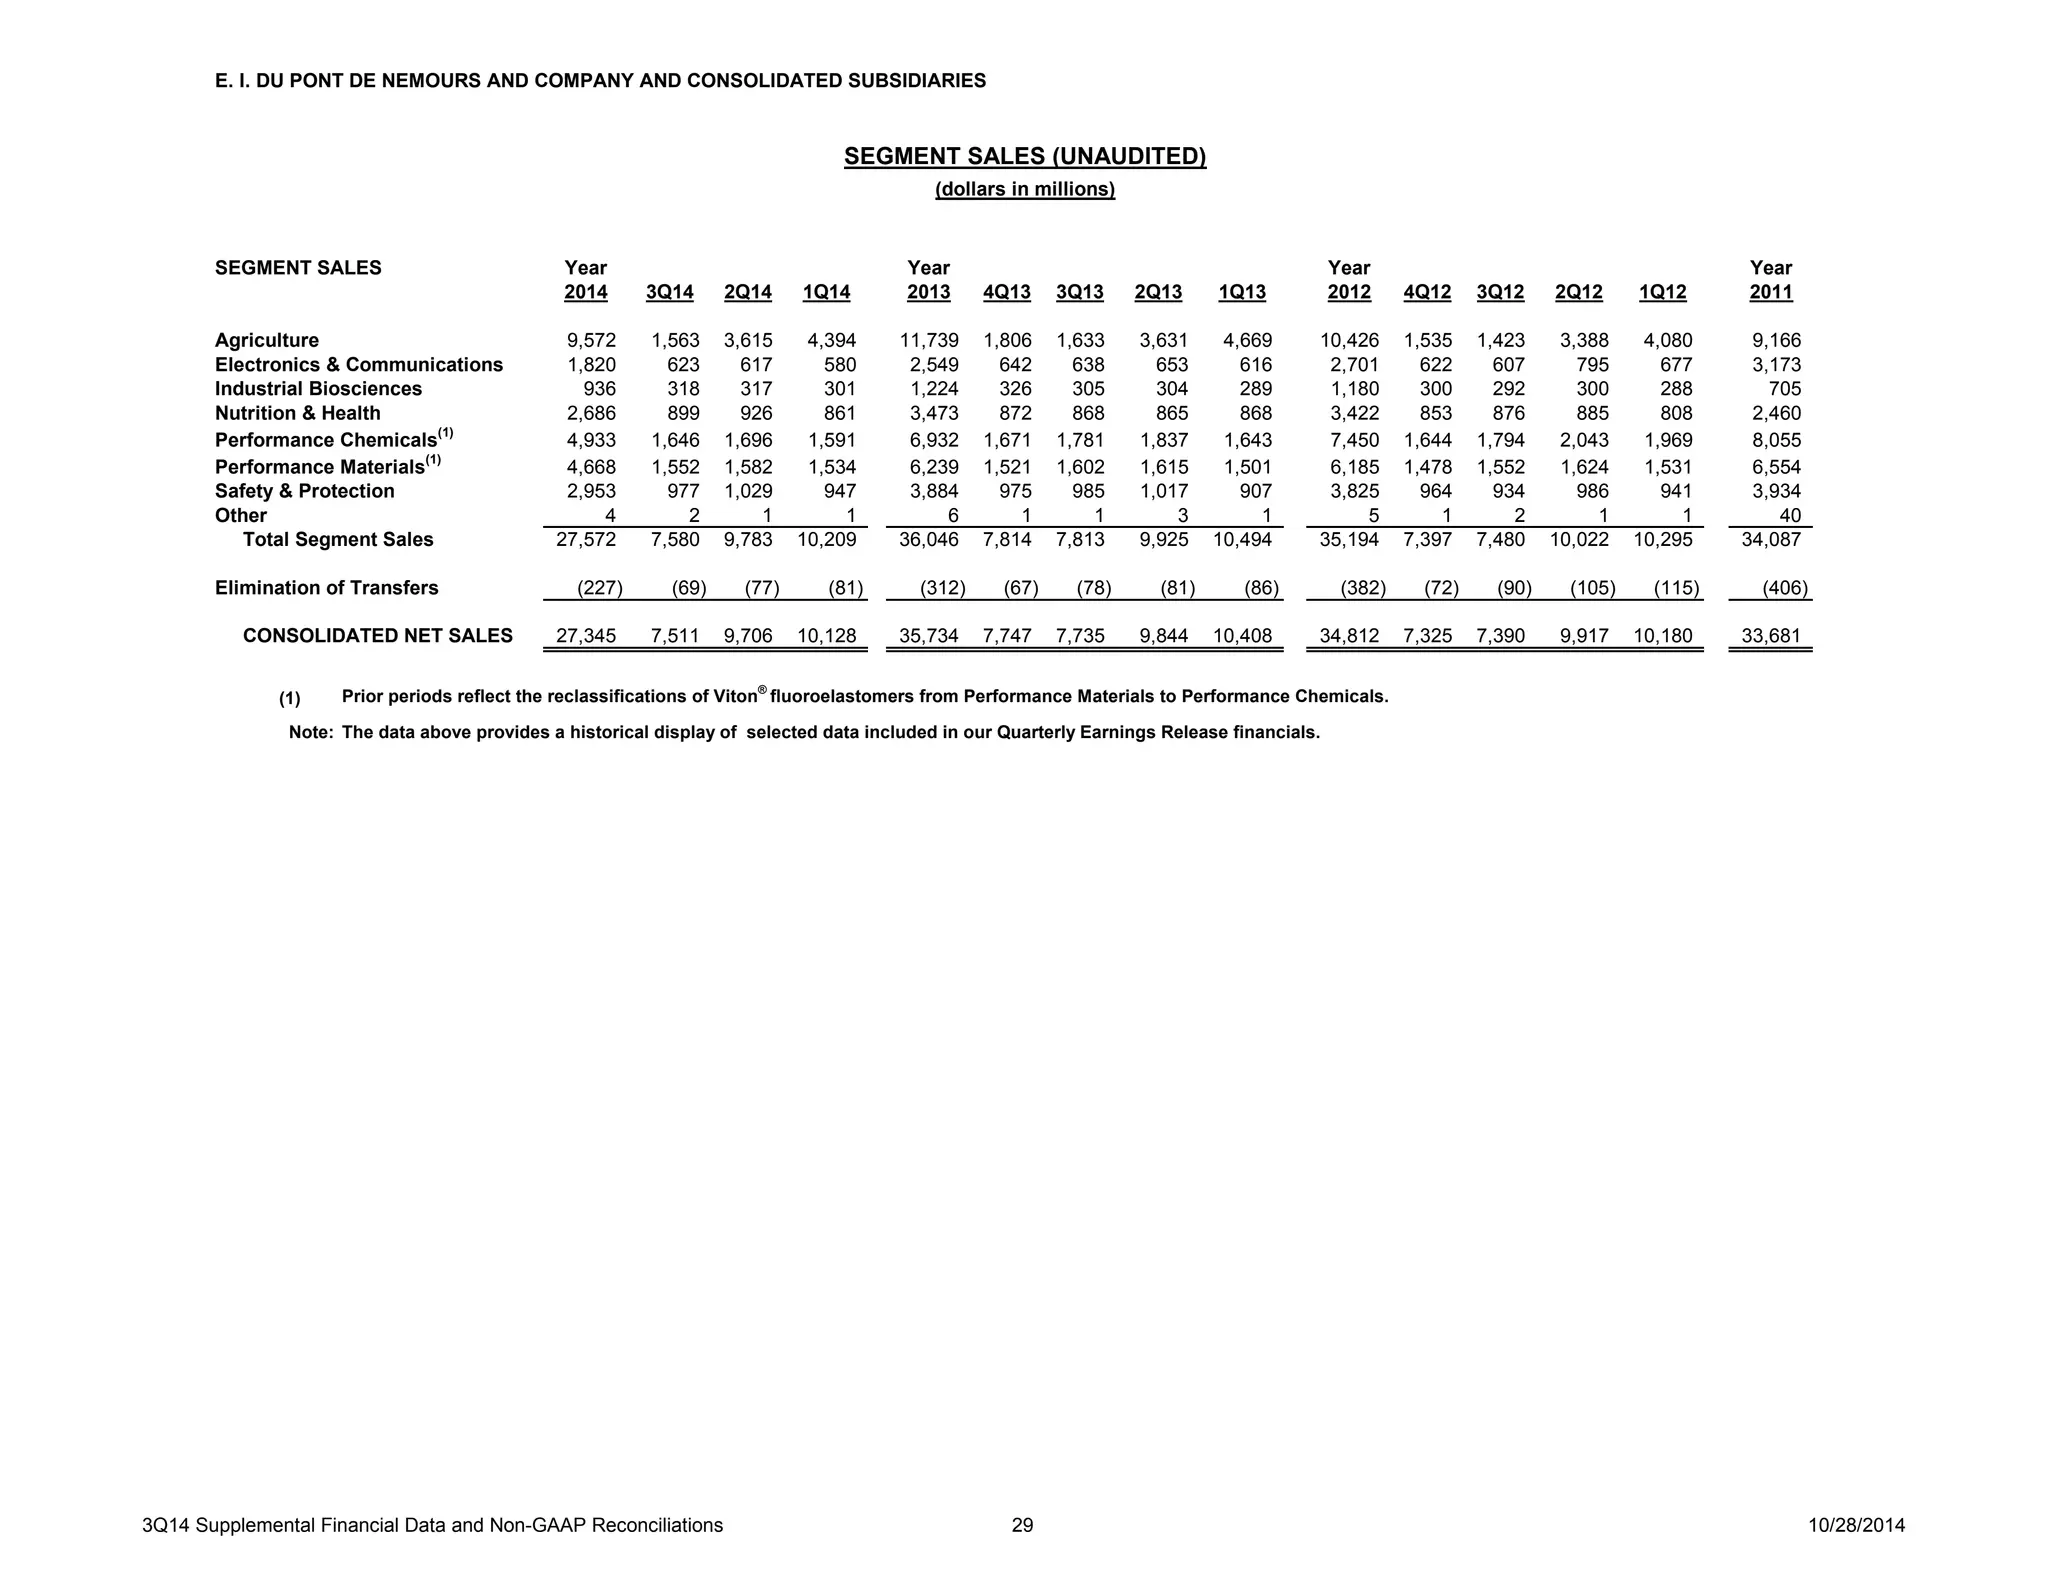
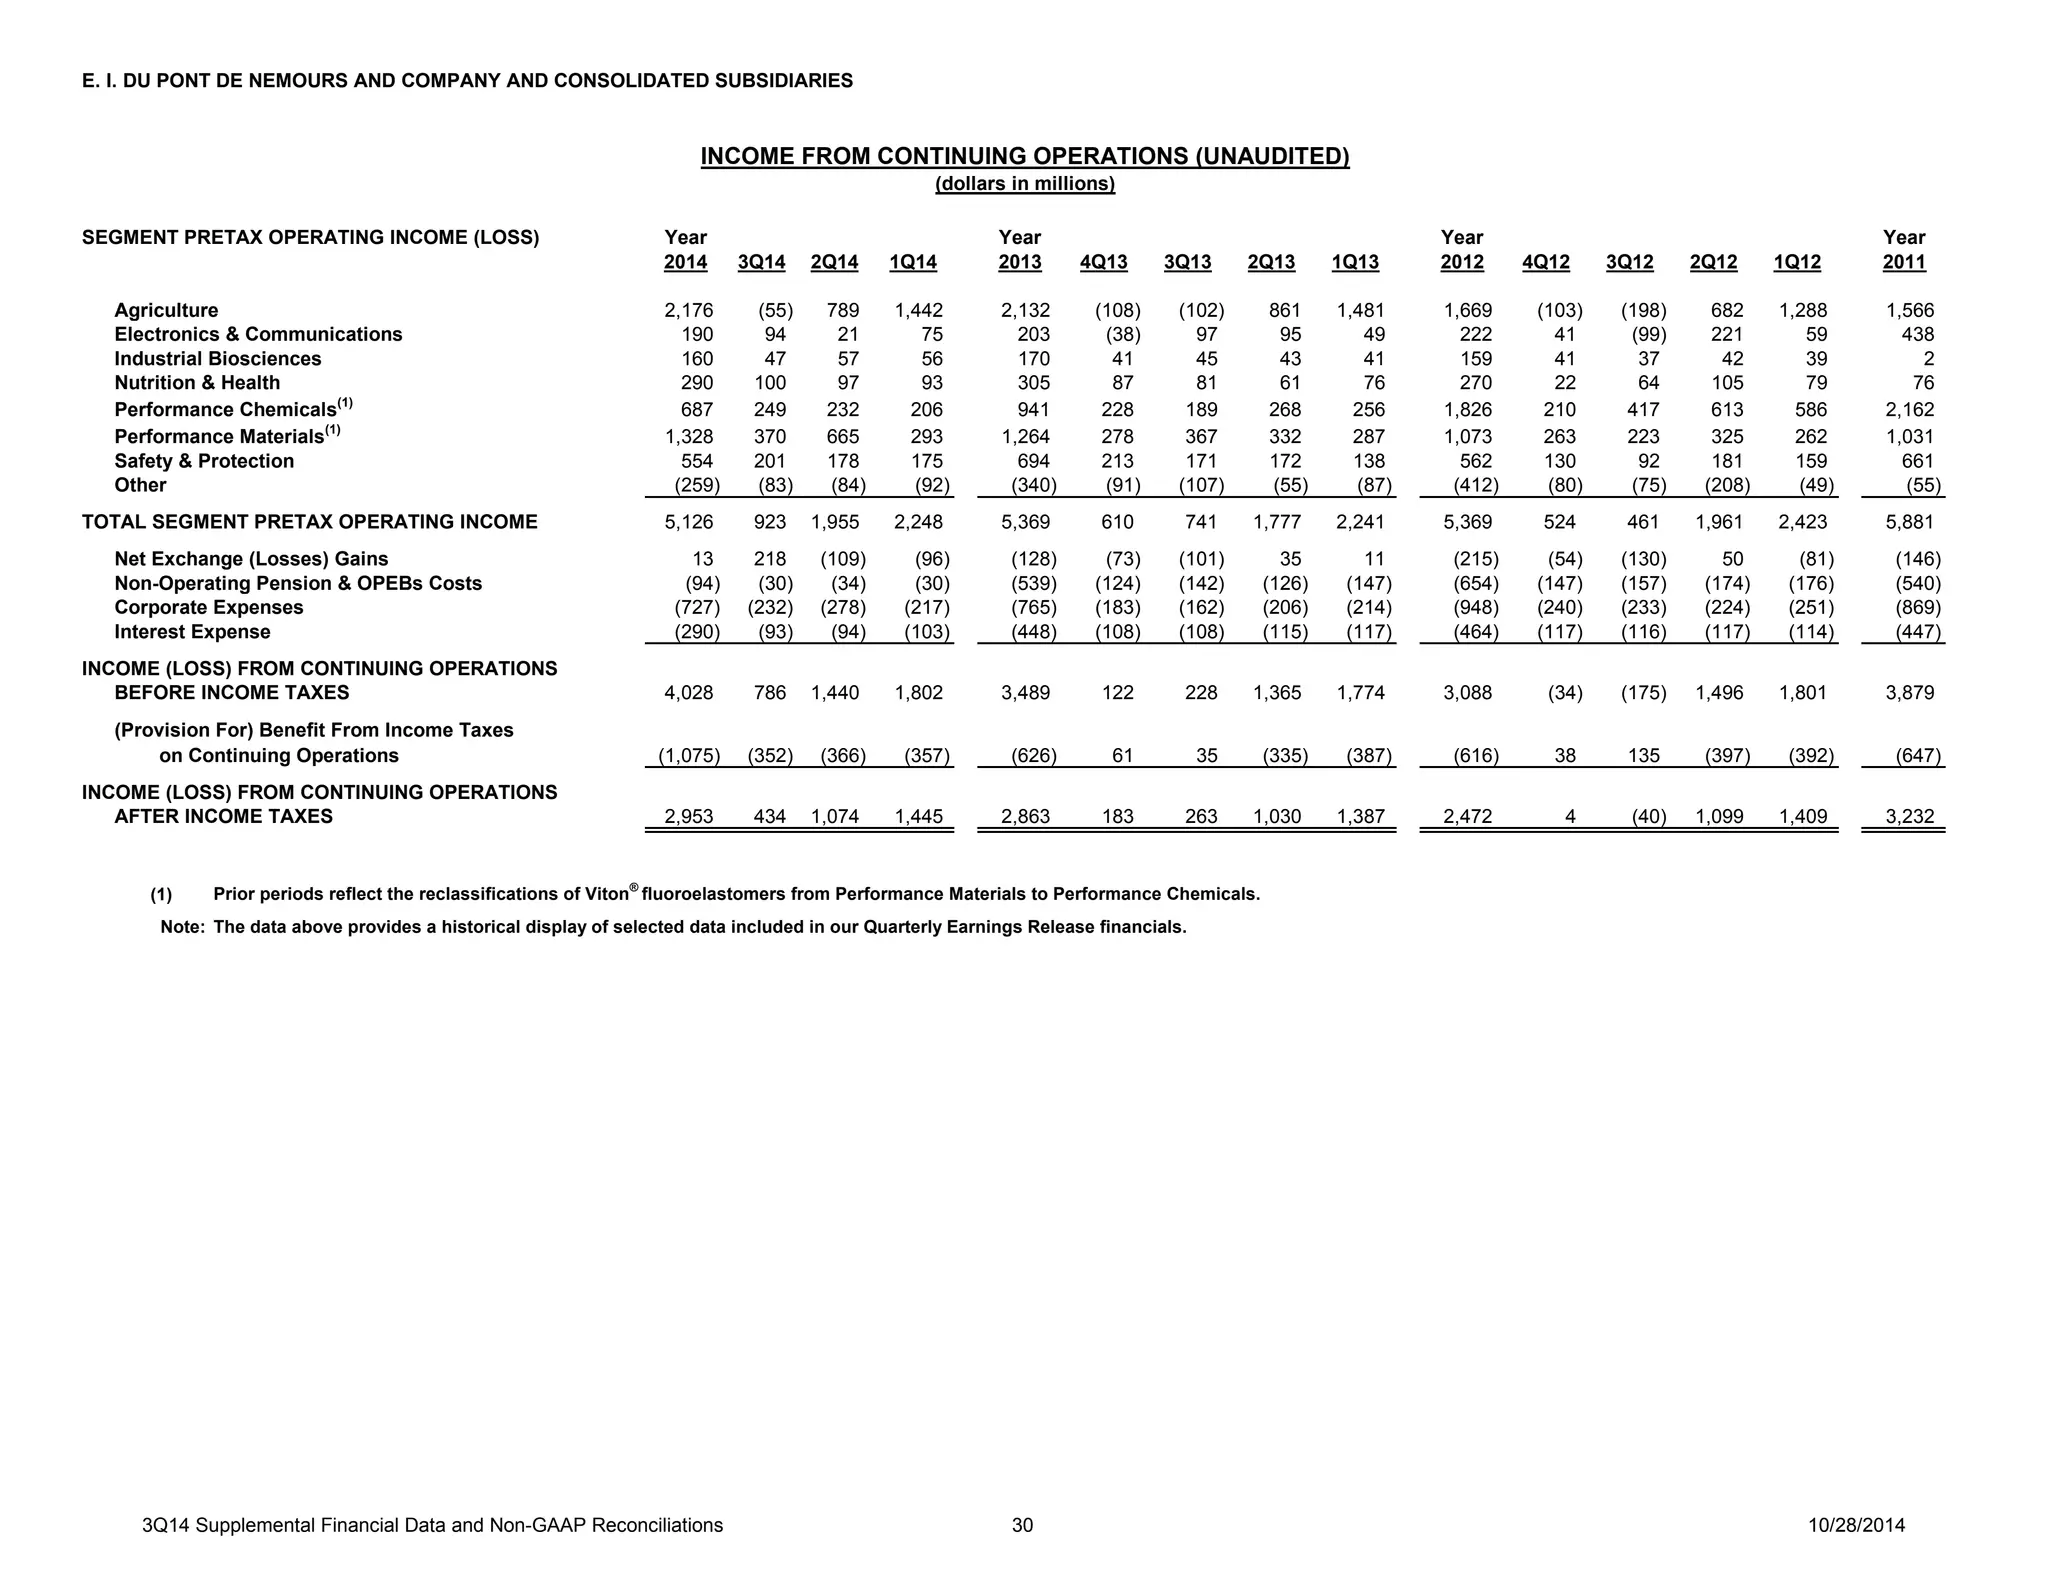
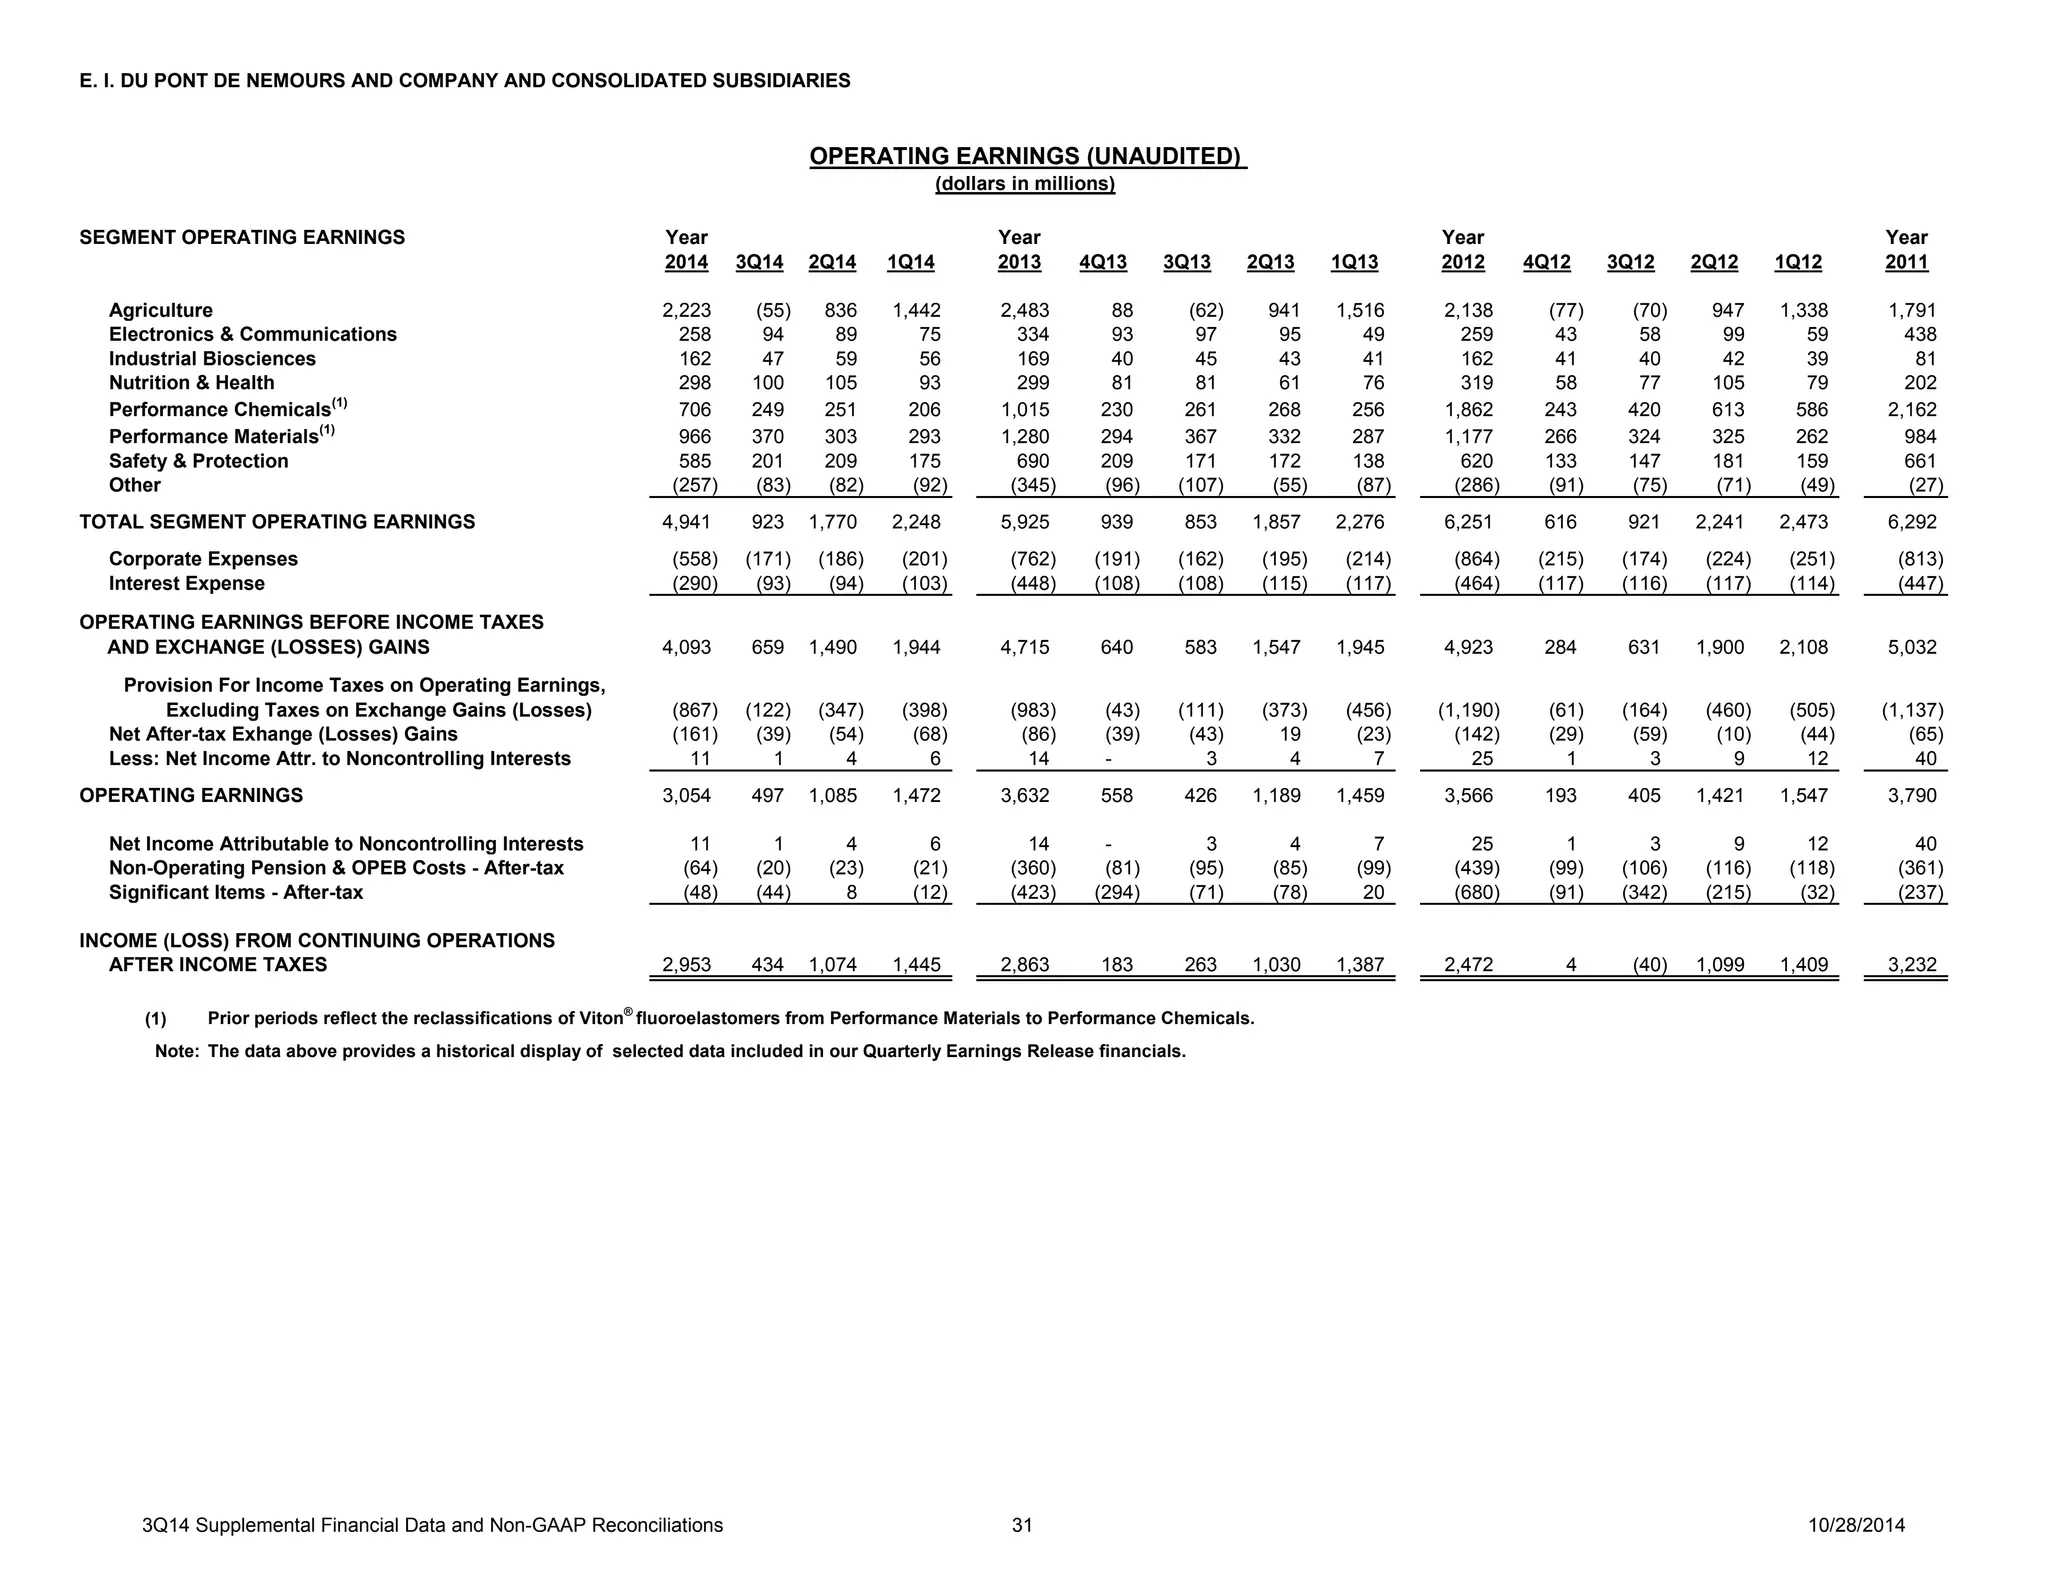
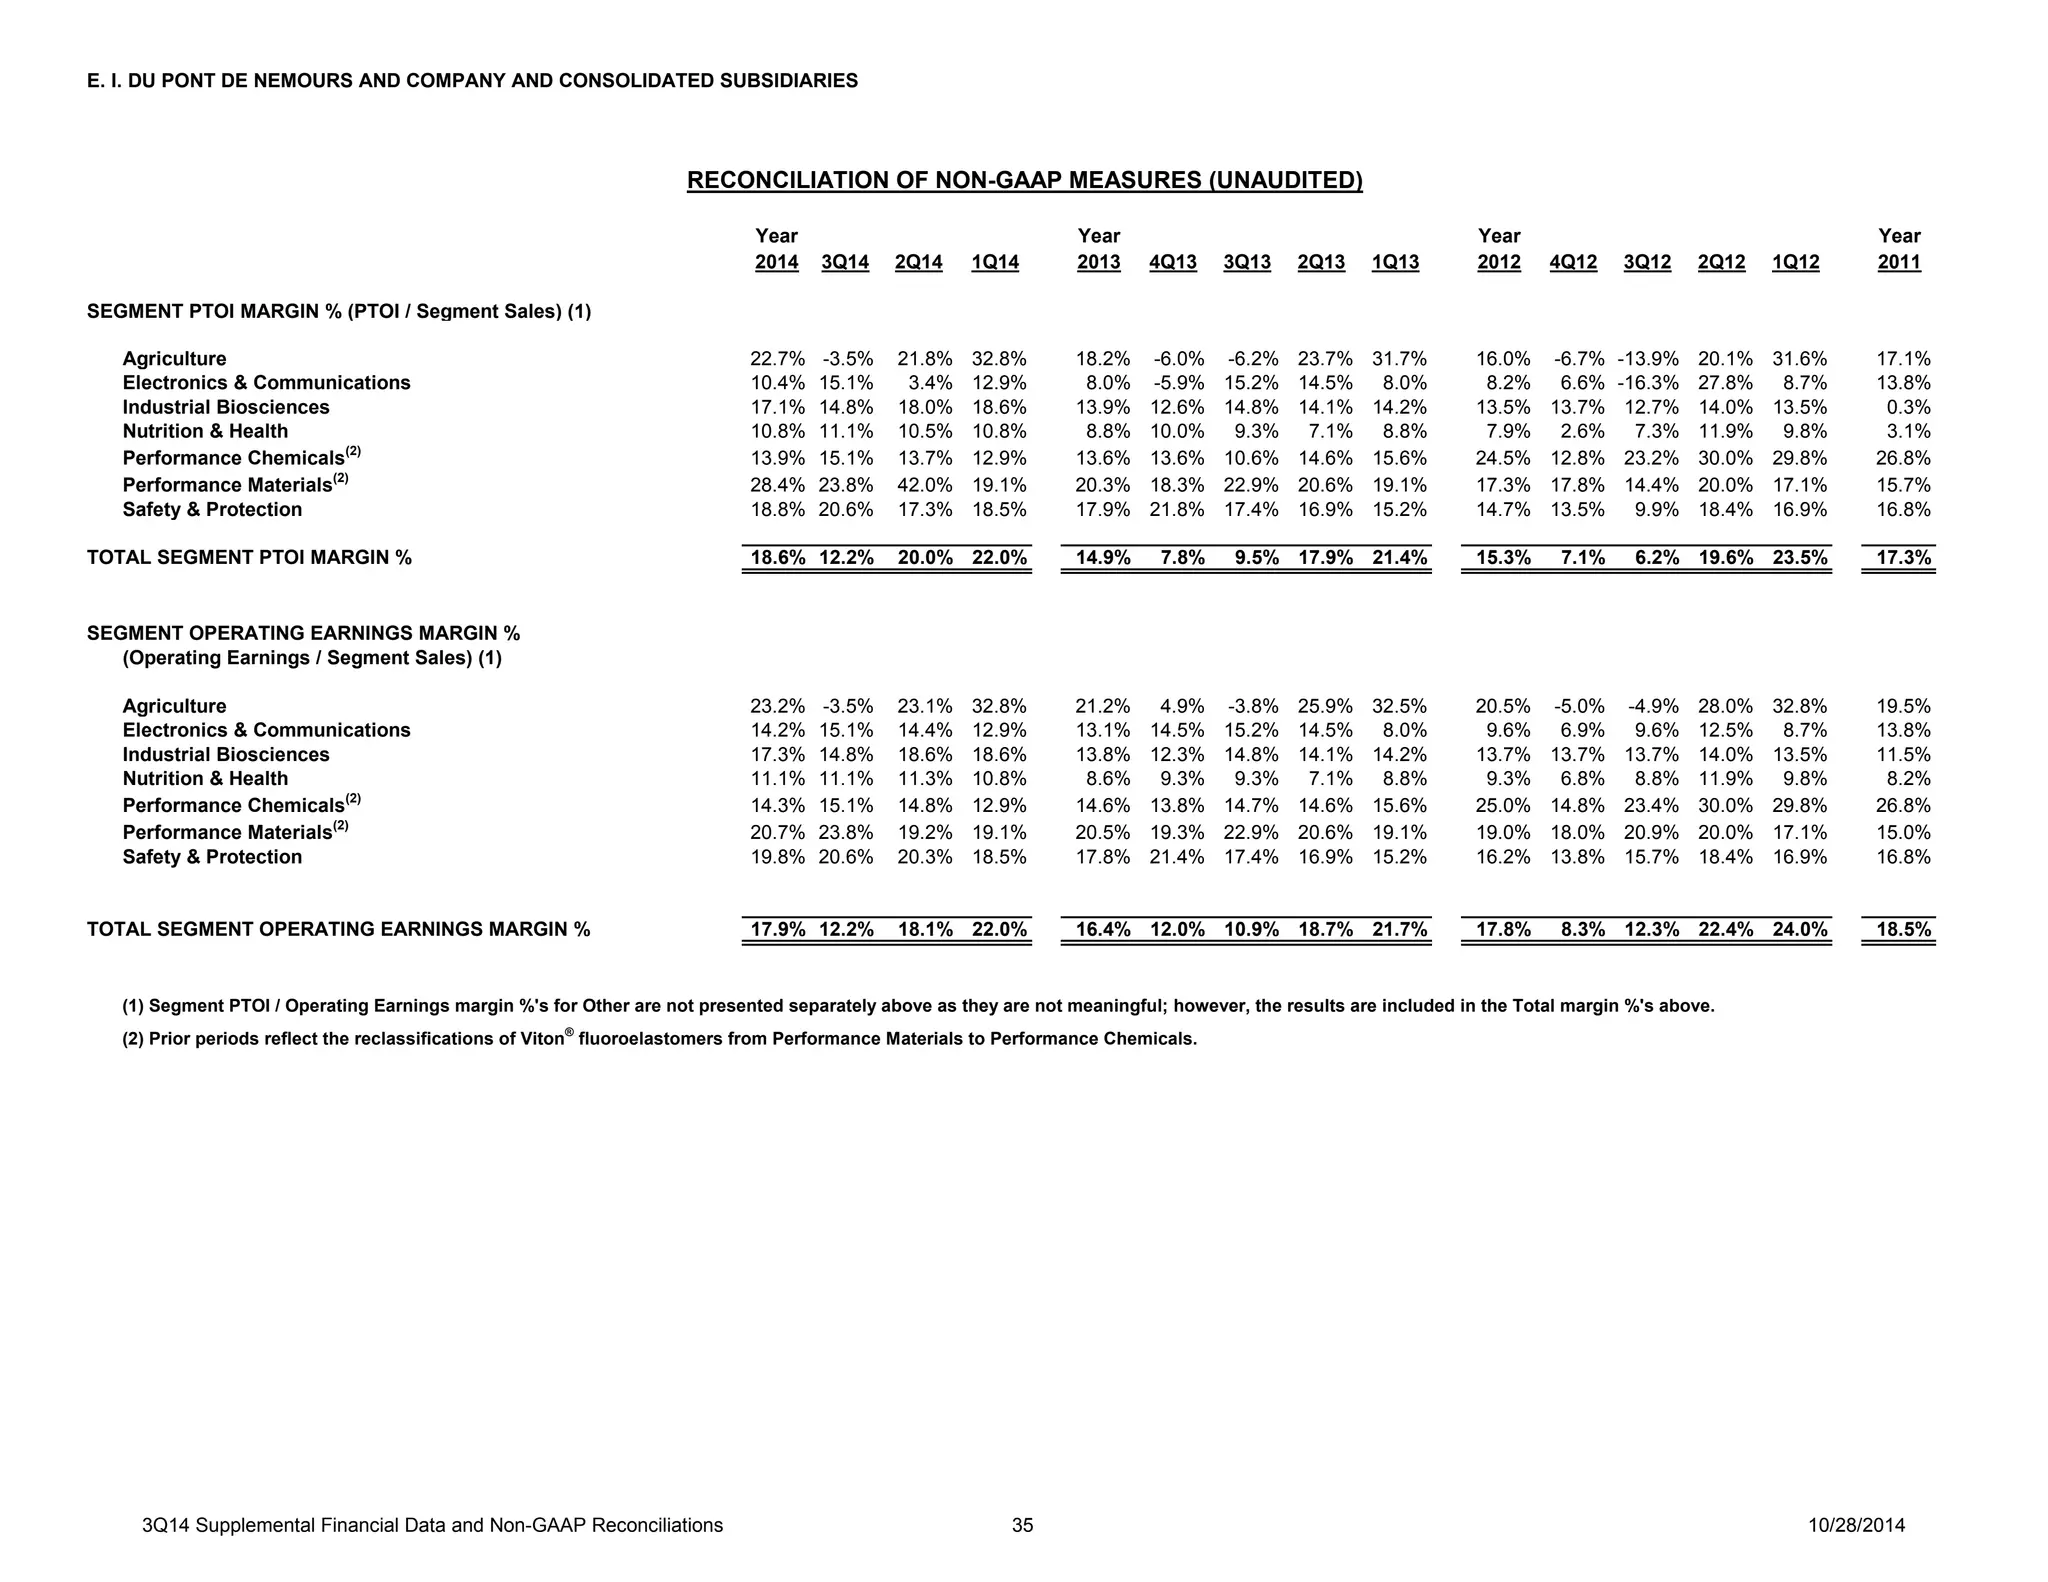
- Segment operating earnings increased 8% to $923 million due to strong results in Safety & Protection from productivity gains and Nutrition & Health from higher volume and lower raw material costs.
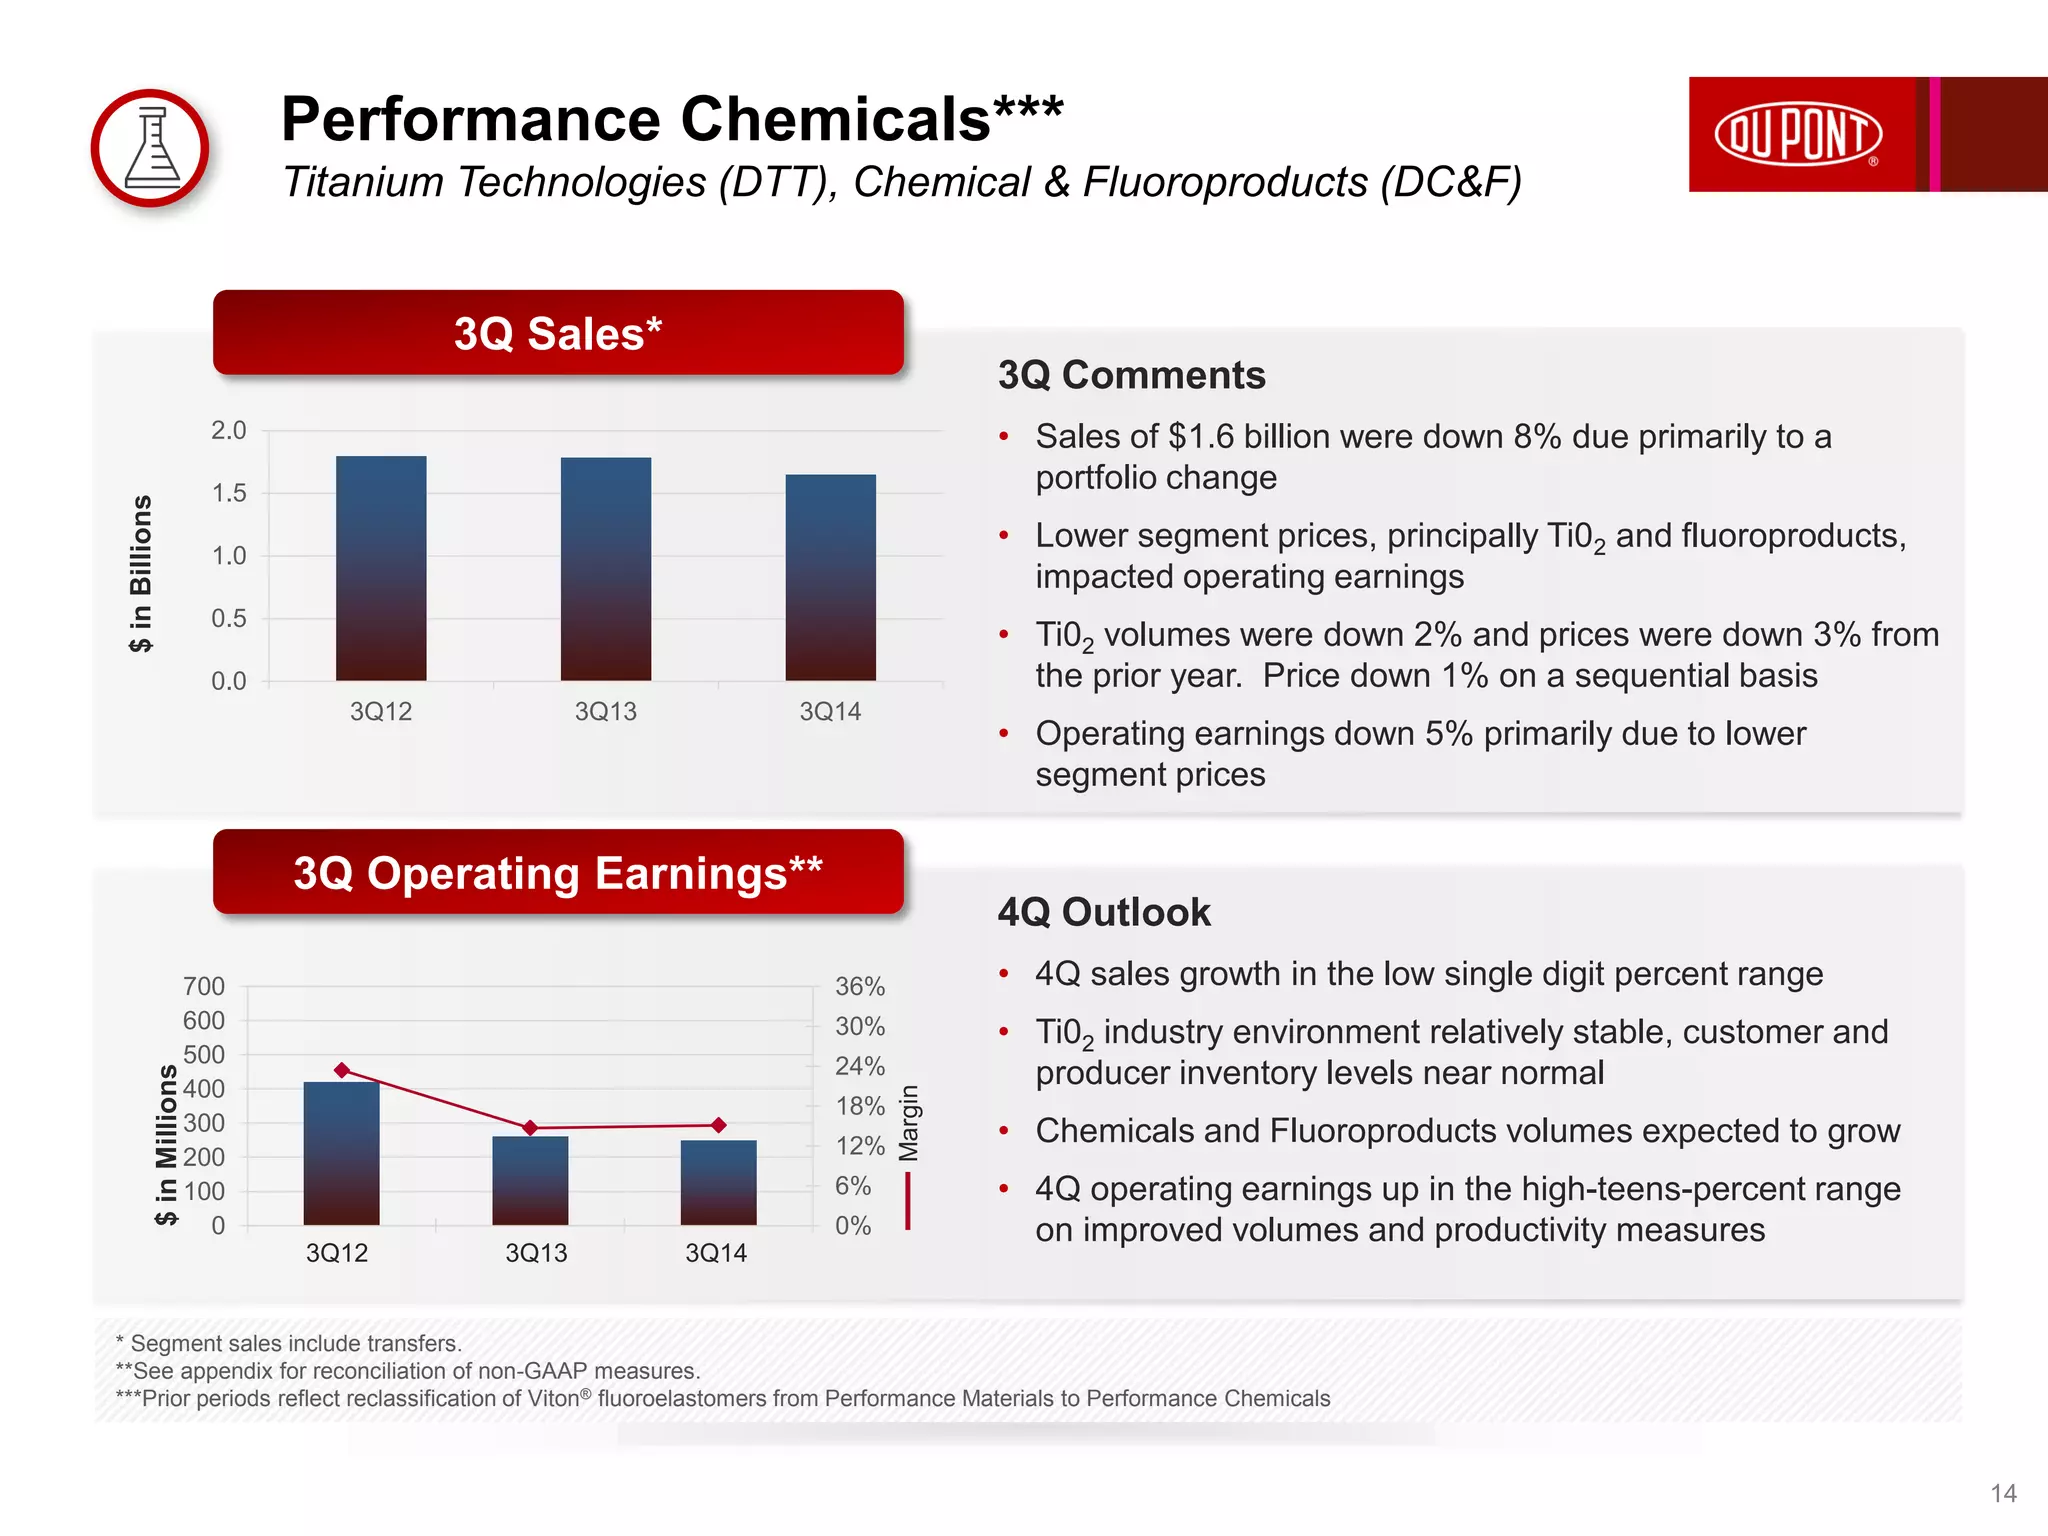
- The outlook for full-year 2014 operating EPS remains $4.00-$4.10 despite some headwinds. Performance Chemicals spin-off remains on track for mid-2015.