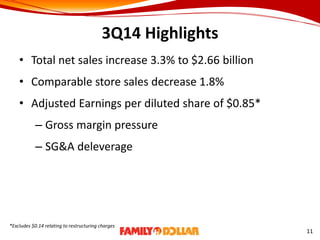
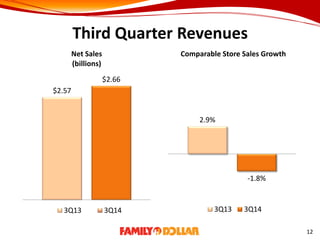
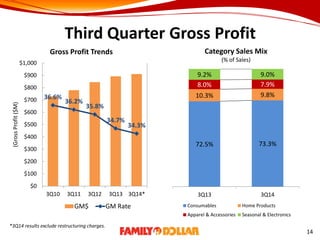
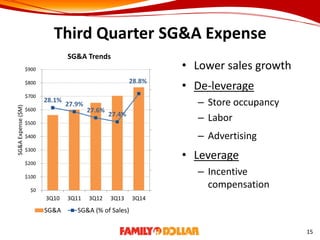
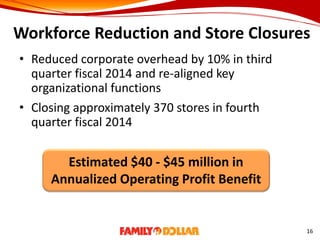
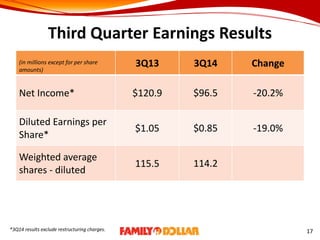
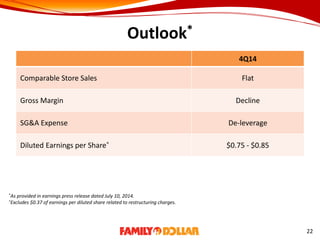
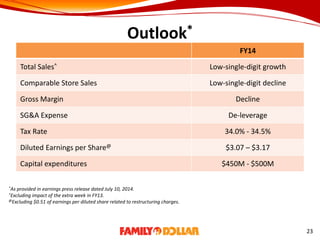
3Q14 Earnings
Conference Call
July 10, 2014
A Word of Caution
Certain statements contained in this presentation which are not historical facts are forward-looking
statements made pursuant to the safe harbor provisions of the Private Securities Litigation Reform
Act of 1995. These forward-looking statements address the Company’s plans, activities or events
which the Company expects will or may occur in the future.
A number of important factors could cause actual results to differ materially from those expressed
in any forward-looking statements. Such factors, risks and uncertainties are set forth under the
headings “Cautionary Statement Regarding Forward-Looking Statements,” or “Risk Factors” or
"Management’s Discussion and Analysis of Financial Condition and Results of Operation" in the
Company’s annual report on Form 10-K and quarterly reports on Form 10-Q filed or to be filed,
respectively, and which are expressly incorporated herein by reference.
You are cautioned not to place undue reliance on these forward-looking statements, which speak
only as of July 10, 2014. The Company does not undertake to update or revise its forward-looking
statements even if experience or future changes make it clear that projected results expressed or
implied in such statements will not be realized, except as may be required by law.
In addition, the amounts and timing of all estimates are subject to change. The actual amounts and
timing may vary materially based on various factors, including the timing of store closings; the
timing and amount of sublease income and other lease expense; factors relating to real estate
including sale proceeds; asset write-downs and other factors affecting inventory value; changes in
management's assumptions; and other factors.
2
Agenda
Introduction & Safe Harbor
Kiley Rawlins, CFA
VP – IR & Communications
Opening Remarks
Howard Levine
Chairman & CEO
Financial Review and Outlook
Mary Winston
Chief Financial Officer
Questions & Answers
Howard Levine
Mary Winston
3
Opening Remarks
Howard Levine
Chairman & CEO
Difficult Operating Environment
• Customers facing
pressures
– Elevated unemployment
levels
– Reductions to key
government assistance
programs
– Healthcare uncertainties
– Energy price volatility
• Competitive
environment
– Elevated traffic-driving
promotions
– Aggressive every day
pricing
5
Improving Trends
• Comparable store sales
• Shrink
• Store manager turnover
• Inventory management
6
Price Investments: Return to Value
• $50+ million annualized
price investment on
nearly 1,000 basic SKUs
• More compelling values
for our customers
• Encouraging early
trends
7
Driving Profitable Growth
• Refine and enhance key-traffic driving
consumables categories
– Refrigerated and frozen food
– Beer & wine
• Improve merchandise markups
– Global sourcing
– Private Brand
• Driving operational efficiency
– Palletized delivery program
8
Delivering Long-term Shareholder Value
• Executing previously announced strategic
actions
• Investing in longer-term strategic initiatives to
improve financial performance and
operational efficiency
• In-depth business review continues with the
goal to unlock further actions to enhance
shareholder value
9
Financial Review and
Outlook
Mary Winston
CFO
3Q14 Highlights
• Total net sales increase 3.3% to $2.66 billion
• Comparable store sales decrease 1.8%
• Adjusted Earnings per diluted share of $0.85*
– Gross margin pressure
– SG&A deleverage
11
*Excludes $0.14 relating to restructuring charges
Third Quarter Revenues
$2.57
$2.66
Net Sales
(billions)
3Q13 3Q14
2.9%
-1.8%
Comparable Store Sales Growth
3Q13 3Q14
12
Assortment Enhancements
• Food
– 400 new items
– Focus on key national brands
– Improved adjacencies
• Household
– New items and formulations
in both national brands and
private brands
13
Third Quarter Gross Profit
72.5% 73.3%
10.3% 9.8%
8.0% 7.9%
9.2% 9.0%
3Q13 3Q14
Category Sales Mix
(% of Sales)
Consumables Home Products
Apparel & Accessories Seasonal & Electronics
36.6%
36.2%
35.8%
34.7%
34.3%
$0
$100
$200
$300
$400
$500
$600
$700
$800
$900
$1,000
3Q10 3Q11 3Q12 3Q13 3Q14*
(GrossProfit($M)
Gross Profit Trends
GM$ GM Rate
*3Q14 results exclude restructuring charges.
14
Third Quarter SG&A Expense
• Lower sales growth
• De-leverage
– Store occupancy
– Labor
– Advertising
• Leverage
– Incentive
compensation
28.1%
27.9%
27.6%
27.4%
28.8%
$0
$100
$200
$300
$400
$500
$600
$700
$800
$900
3Q10 3Q11 3Q12 3Q13 3Q14
SG&AExpense($M)
SG&A Trends
SG&A SG&A (% of Sales)
15
Workforce Reduction and Store Closures
• Reduced corporate overhead by 10% in third
quarter fiscal 2014 and re-aligned key
organizational functions
• Closing approximately 370 stores in fourth
quarter fiscal 2014
16
Estimated $40 - $45 million in
Annualized Operating Profit Benefit
Third Quarter Earnings Results
(in millions except for per share
amounts)
3Q13 3Q14 Change
Net Income* $120.9 $96.5 -20.2%
Diluted Earnings per
Share*
$1.05 $0.85 -19.0%
Weighted average
shares - diluted
115.5 114.2
17*3Q14 results exclude restructuring charges.
$147
$163
$191 $189 $193
$0
$25
$50
$75
$100
$125
$150
$175
$200
$225
$250
3Q10 3Q11 3Q12 3Q13 3Q14
(thousands)
• Anniversary of FY12
consumables expansion
• Consumable assortment
changes
• Well-managed
discretionary inventories
18
Capital Expenditures
$136
$230
$391
$600
$307
$0
$50
$100
$150
$200
$250
$300
$350
$400
$450
$500
$550
$600
$650
3Q10 3Q11 3Q12 3Q13 3Q14
(millions)
• New store openings
($107M)
• Renovation program
($93M)
• Existing stores ($51M)
• Corporate/ IT ($36M)
• Supply Chain ($20M)
Year to Date
19
Store Activity
FY13 FY14
Openings Closings Openings Closings
1Q 125 1 126 1
2Q 126 17 118 21
3Q 129 3 111 3
YTD 380 21 355 25
Ending Store Count 7,801 8,246
Selling square footage (in 000s) 55,994 59,488
Renovations, Relocations and
Expansions
556 585
20
Returning Capital to Shareholders
58 62 67 78 95
272
513
92 75
125
$0
$100
$200
$300
$400
$500
$600
$700
3Q10 3Q11 3Q12 3Q13 3Q14
(millions)
Dividends Share Repurchases
21
Year to Date
Outlook*
4Q14
Comparable Store Sales Flat
Gross Margin Decline
SG&A Expense De-leverage
Diluted Earnings per Share^ $0.75 - $0.85
22
*As provided in earnings press release dated July 10, 2014.
^Excludes $0.37 of earnings per diluted share related to restructuring charges.
Outlook*
FY14
Total Sales^ Low-single-digit growth
Comparable Store Sales Low-single-digit decline
Gross Margin Decline
SG&A Expense De-leverage
Tax Rate 34.0% - 34.5%
Diluted Earnings per Share@ $3.07 – $3.17
Capital expenditures $450M - $500M
23
*As provided in earnings press release dated July 10, 2014.
^Excluding impact of the extra week in FY13.
@Excluding $0.51 of earnings per diluted share related to restructuring charges.
3Q14 Earnings
Conference Call
July 10, 2014

3 q14 earnings presentation final

  • 1.
  • 2.
    A Word ofCaution Certain statements contained in this presentation which are not historical facts are forward-looking statements made pursuant to the safe harbor provisions of the Private Securities Litigation Reform Act of 1995. These forward-looking statements address the Company’s plans, activities or events which the Company expects will or may occur in the future. A number of important factors could cause actual results to differ materially from those expressed in any forward-looking statements. Such factors, risks and uncertainties are set forth under the headings “Cautionary Statement Regarding Forward-Looking Statements,” or “Risk Factors” or "Management’s Discussion and Analysis of Financial Condition and Results of Operation" in the Company’s annual report on Form 10-K and quarterly reports on Form 10-Q filed or to be filed, respectively, and which are expressly incorporated herein by reference. You are cautioned not to place undue reliance on these forward-looking statements, which speak only as of July 10, 2014. The Company does not undertake to update or revise its forward-looking statements even if experience or future changes make it clear that projected results expressed or implied in such statements will not be realized, except as may be required by law. In addition, the amounts and timing of all estimates are subject to change. The actual amounts and timing may vary materially based on various factors, including the timing of store closings; the timing and amount of sublease income and other lease expense; factors relating to real estate including sale proceeds; asset write-downs and other factors affecting inventory value; changes in management's assumptions; and other factors. 2
  • 3.
    Agenda Introduction & SafeHarbor Kiley Rawlins, CFA VP – IR & Communications Opening Remarks Howard Levine Chairman & CEO Financial Review and Outlook Mary Winston Chief Financial Officer Questions & Answers Howard Levine Mary Winston 3
  • 4.
  • 5.
    Difficult Operating Environment •Customers facing pressures – Elevated unemployment levels – Reductions to key government assistance programs – Healthcare uncertainties – Energy price volatility • Competitive environment – Elevated traffic-driving promotions – Aggressive every day pricing 5
  • 6.
    Improving Trends • Comparablestore sales • Shrink • Store manager turnover • Inventory management 6
  • 7.
    Price Investments: Returnto Value • $50+ million annualized price investment on nearly 1,000 basic SKUs • More compelling values for our customers • Encouraging early trends 7
  • 8.
    Driving Profitable Growth •Refine and enhance key-traffic driving consumables categories – Refrigerated and frozen food – Beer & wine • Improve merchandise markups – Global sourcing – Private Brand • Driving operational efficiency – Palletized delivery program 8
  • 9.
    Delivering Long-term ShareholderValue • Executing previously announced strategic actions • Investing in longer-term strategic initiatives to improve financial performance and operational efficiency • In-depth business review continues with the goal to unlock further actions to enhance shareholder value 9
  • 10.
  • 11.
    3Q14 Highlights • Totalnet sales increase 3.3% to $2.66 billion • Comparable store sales decrease 1.8% • Adjusted Earnings per diluted share of $0.85* – Gross margin pressure – SG&A deleverage 11 *Excludes $0.14 relating to restructuring charges
  • 12.
    Third Quarter Revenues $2.57 $2.66 NetSales (billions) 3Q13 3Q14 2.9% -1.8% Comparable Store Sales Growth 3Q13 3Q14 12
  • 13.
    Assortment Enhancements • Food –400 new items – Focus on key national brands – Improved adjacencies • Household – New items and formulations in both national brands and private brands 13
  • 14.
    Third Quarter GrossProfit 72.5% 73.3% 10.3% 9.8% 8.0% 7.9% 9.2% 9.0% 3Q13 3Q14 Category Sales Mix (% of Sales) Consumables Home Products Apparel & Accessories Seasonal & Electronics 36.6% 36.2% 35.8% 34.7% 34.3% $0 $100 $200 $300 $400 $500 $600 $700 $800 $900 $1,000 3Q10 3Q11 3Q12 3Q13 3Q14* (GrossProfit($M) Gross Profit Trends GM$ GM Rate *3Q14 results exclude restructuring charges. 14
  • 15.
    Third Quarter SG&AExpense • Lower sales growth • De-leverage – Store occupancy – Labor – Advertising • Leverage – Incentive compensation 28.1% 27.9% 27.6% 27.4% 28.8% $0 $100 $200 $300 $400 $500 $600 $700 $800 $900 3Q10 3Q11 3Q12 3Q13 3Q14 SG&AExpense($M) SG&A Trends SG&A SG&A (% of Sales) 15
  • 16.
    Workforce Reduction andStore Closures • Reduced corporate overhead by 10% in third quarter fiscal 2014 and re-aligned key organizational functions • Closing approximately 370 stores in fourth quarter fiscal 2014 16 Estimated $40 - $45 million in Annualized Operating Profit Benefit
  • 17.
    Third Quarter EarningsResults (in millions except for per share amounts) 3Q13 3Q14 Change Net Income* $120.9 $96.5 -20.2% Diluted Earnings per Share* $1.05 $0.85 -19.0% Weighted average shares - diluted 115.5 114.2 17*3Q14 results exclude restructuring charges.
  • 18.
    $147 $163 $191 $189 $193 $0 $25 $50 $75 $100 $125 $150 $175 $200 $225 $250 3Q103Q11 3Q12 3Q13 3Q14 (thousands) • Anniversary of FY12 consumables expansion • Consumable assortment changes • Well-managed discretionary inventories 18
  • 19.
    Capital Expenditures $136 $230 $391 $600 $307 $0 $50 $100 $150 $200 $250 $300 $350 $400 $450 $500 $550 $600 $650 3Q10 3Q113Q12 3Q13 3Q14 (millions) • New store openings ($107M) • Renovation program ($93M) • Existing stores ($51M) • Corporate/ IT ($36M) • Supply Chain ($20M) Year to Date 19
  • 20.
    Store Activity FY13 FY14 OpeningsClosings Openings Closings 1Q 125 1 126 1 2Q 126 17 118 21 3Q 129 3 111 3 YTD 380 21 355 25 Ending Store Count 7,801 8,246 Selling square footage (in 000s) 55,994 59,488 Renovations, Relocations and Expansions 556 585 20
  • 21.
    Returning Capital toShareholders 58 62 67 78 95 272 513 92 75 125 $0 $100 $200 $300 $400 $500 $600 $700 3Q10 3Q11 3Q12 3Q13 3Q14 (millions) Dividends Share Repurchases 21 Year to Date
  • 22.
    Outlook* 4Q14 Comparable Store SalesFlat Gross Margin Decline SG&A Expense De-leverage Diluted Earnings per Share^ $0.75 - $0.85 22 *As provided in earnings press release dated July 10, 2014. ^Excludes $0.37 of earnings per diluted share related to restructuring charges.
  • 23.
    Outlook* FY14 Total Sales^ Low-single-digitgrowth Comparable Store Sales Low-single-digit decline Gross Margin Decline SG&A Expense De-leverage Tax Rate 34.0% - 34.5% Diluted Earnings per Share@ $3.07 – $3.17 Capital expenditures $450M - $500M 23 *As provided in earnings press release dated July 10, 2014. ^Excluding impact of the extra week in FY13. @Excluding $0.51 of earnings per diluted share related to restructuring charges.
  • 24.