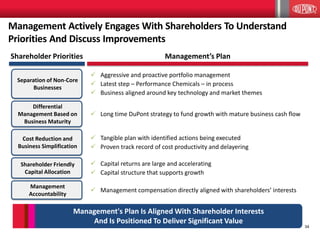
Management's plan is delivering results for shareholders by executing on a strategy to achieve higher growth and higher value. The strategy focuses on innovation, global reach, and operational priorities to advance strategic priorities in key areas like agriculture and nutrition, bio-based industrials, and advanced materials. Management has implemented portfolio changes, productivity initiatives like "Fresh Start" to reduce costs, and returned significant capital to shareholders. The track record since 2009 includes a total shareholder return of 253% that demonstrates management's plan is working to continue driving strong growth for DuPont.
2. 2
Regulation G
The attached charts include company information that does not conform with generally accepted accounting principles (GAAP). Management believes the use of these non-GAAP measures are meaningful to investors because they provide insight with respect to operating results of the company and additional metrics for use in comparison to competitors. These measures should not be viewed as an alternative to GAAP measures of performance. Furthermore, these measures may not be consistent with similar measures used by other companies. This data should be read in conjunction with previously published company reports on Forms 10-K, 10-Q, and 8-K. These reports, are available on the Investor Center of www.dupont.com. Reconciliations of non-GAAP measures to GAAP are also included with this presentation.
Forward-Looking Statements
This document contains forward-looking statements which may be identified by their use of words like āplans,ā āexpects,ā āwill,ā "believes," āintends,ā āestimates,ā āanticipatesā or other words of similar meaning. All statements that address expectations or projections about the future, including statements about the company's strategy for growth, product development, regulatory approval, market position, anticipated benefits of recent acquisitions, timing of anticipated benefits from restructuring actions, outcome of contingencies, such as litigation and environmental matters, expenditures and financial results, are forward looking statements. Forward-looking statements are not guarantees of future performance and are based on certain assumptions and expectations of future events which may not be realized. Forward-looking statements also involve risks and uncertainties, many of which are beyond the companyās control. Some of the important factors that could cause the companyās actual results to differ materially from those projected in any such forward-looking statements are: fluctuations in energy and raw material prices; failure to develop and market new products and optimally manage product life cycles; significant litigation and environmental matters; failure to appropriately manage process safety and product stewardship issues; changes in laws and regulations or political conditions; global economic and capital markets conditions, such as inflation, interest and currency exchange rates; business or supply disruptions; security threats, such as acts of sabotage, terrorism or war, weather events and natural disasters; ability to protect and enforce the company's intellectual property rights; successful integration of acquired businesses and separation of underperforming or non-strategic assets or businesses and successful completion of the proposed spinoff of the Performance Chemicals segment including ability to fully realize the expected benefits of the proposed spinoff. The company undertakes no duty to update any forward-looking statements as a result of future developments or new information.
Developing Markets
Total developing markets is comprised of Developing Asia, Developing Europe, Middle East & Africa, and Latin America. A detailed list of all developing countries is available on the Earnings News Release link on the Investor Center website at www.dupont.com.
3. 3
DuPont is a Science Company
DuPont has a 200-year record of creating value for customers and owners by connecting science to the marketplace to create novel solutions the world needs. Today, DuPont is creating higher growth and higher value for shareholders by leveraging advanced science and technology, market and value chain knowledge, global scale, and disciplined management to drive its next great era of innovation.
4. 4
Discussion Agenda
III. Managementās Plan Is Aligned With Shareholder Priorities
II. Managementās Plan Is Delivering Results
I. DuPont Is Executing On A Plan To Deliver Higher Growth, Higher Value
5. 5
Share Price Performance
12/31/2008 ā 9/30/2014 Capital Returned To Shareholders
Total Capital Returned to
Shareholders (2009 ā 2013)(1)
ā¦And Is Positioned To Continue To Do So
Management Has A Track Record Of Delivering Shareholder Valueā¦
Source: Datastream as of 9/30/2014, Bloomberg, Capital IQ, FactSet
Note: S&P Indices are USD market cap-weighted and assume dividends are re-invested at the closing price applicable on the ex-dividend date
1) Total Capital Returned to Shareholders calculated as dividends and share repurchases as a % of average market capitalization; S&P 500 metrics calculated as the average of the median value for all companies in the index
in each of the five years (2009 ā 2013)
$71.76
$55.24
$0
$10
$20
$30
$40
$50
$60
$70
$80
DuPont Share Price S&P 500 (Indexed to DD as of 12/31/2008)
Total Shareholder Return
DuPont 253%
S&P 500 147%
$1B
$3B
$5B
$7B
$10B
$13B
860
880
900
920
940
2009 2010 2011 2012 2013 2014 YTD
Number of Shares (MM)
Cumulative Dividends Cumulative Buybacks
Basic Shares Outstanding
5.0%
4.2%
DuPont
S&P 500
As of 9/30/14, cumulative dividends exceeded $9B;
$5B share repurchase program announced on 1/28/2014
6. 6
Discussion Agenda
II. Managementās Plan Is Delivering Results
I. DuPont Is Executing On A Plan To Deliver Higher Growth, Higher Value
III. Managementās Plan Is Aligned With Shareholder Priorities
7. 7
Management And Board Remain Focused On Driving Growth
And Enhancing Shareholder Value
Managementās Plan: What Shareholders Should Expect From Us
ā¢ Higher growth, higher value through focused strategic priorities
ā¢ Innovation driven new products and solutions
ā¢ Accelerated growth in developing markets
ā¢ Execution and productivity as a way of life
ā¢ Savings from redesign initiative (āFresh Startā)
ā¢ Ongoing portfolio refinements to increase value
ā¢ Capital structure that supports growth, seasonality and regional needs
8. 8
These Three Strategic Priorities Position DuPont For The Next Wave Of
Innovation And Growth
Path to Future Growth
Agriculture &
Nutrition
Extend our leadership
across the high-value,
science-driven segments
of the Agriculture and
Food value chain
Advanced
Materials
Strengthen and grow our
leading position in
differentiated high-value
materials and leverage
new sciences
Bio-Based
Industrials
Develop world-leading
industrial biotechnology
capabilities to create
transformational new
bio-based businesses
ā¢ Seeds
ā¢ Agricultural Chemicals
ā¢ Specialty Food Ingredients
ā¢ Enzymes
ā¢ Biofuels
ā¢ Biomaterials
ā¢ Advanced Polymers
ā¢ Protective Materials
ā¢ Electronic Materials
ā¢ Alternative Energy
DuPontās Strategy To Build Higher Growth, Higher Value
9. 9
Strategic Priorities Delivering Growth
Agriculture & Nutrition
ā¢ Seeds: Extend germplasm leadership and
drive biotech pipeline for higher crop
yields
ā¢ Agricultural Chemicals: Commercialize
robust pipeline of innovative
productivity-enhancing crop protection
compounds
ā¢ Specialty Food Ingredients: Expand
nutritional offerings in high-growth
emerging and health & wellness markets
Bio-Based Industrials
ā¢ Enzymes: Develop and commercialize
enzymes providing faster targeted
chemistries in high growth applications
ā¢ Biofuels: Bring new forms of alternative
energy to reality for global adoption and
benefit
ā¢ Biomaterials: Leverage bio-based
technologies to develop new offerings
across DuPont businesses
Advanced Materials
ā¢ Advanced Polymers: Develop
technologies to push the performance
boundaries of products in markets
including automotive, aerospace,
packaging, and construction
ā¢ Protective Materials: Develop solutions
to manage environmental and man-made
hazards and risks to safety and health
ā¢ Electronic Materials: Enable faster,
smaller, and more efficient products for
consumer electronics to industrial
applications
ā¢ Alternative Energy: Enable more
efficient solutions for photovoltaic and
energy storage systems
Path to Future Growth
Leveraging DuPontās Science, Markets, Customers, And Infrastructure
To Execute On Our Strategic Priorities
10. 10
Path to Future Growth
Innovation
ā¢Leveraging Multi-disciplinary Science And Technology Platform
ā¢Delivering Renewal, Breakthrough and Transformational New Products
ā¢Strengthening Our Pipeline Using Our 13 Global Innovation Centers
Execution
ā¢Delivering Ongoing Productivity Enhancements
ā¢Improving Customer Experience
ā¢Ensuring Management Accountability
Global Reach
ā¢Driving Penetration In Fast- growing, Developing Markets
ā¢Combining Local Market Knowledge With Leading Science To Deliver Superior Solutions
ā¢Developing Globally Diverse, Talented Employees
Operational Priorities
Our Operational Priorities Advance Our Strategic Priorities
11. 11
Our Full Complement Of Capabilities Drives Solutions From Portfolio Renewal To Transformational Innovation
Innovation
Agriculture
Electronics & Communications
Industrial Biosciences
Nutrition & Health
Performance Materials
Safety & Protection
Ongoing DuPont Solutions
Global Market Insights
Customer Access
Value Chain Knowledge
Market Intelligence
Technical Capabilities
Process Technology
Engineering
Application Development
All Businesses Draw On The Total System
Material Science
Chemistry
Biology
Science
The DuPont Innovation Platform:
12. 12
Innovation
Focus Examples
DuPontās Innovation Platform Delivers Continuous, Sustainable
Growth
ā¢ Engineering
polymers
ā¢ NomexĀ® flame
resistant fiber
ā¢ KevlarĀ® aramid fiber
ā¢ Corn seeds
ā¢ Enhancements to existing products
for current and related market
spaces
ā¢ Improve business profitability and
increase share in existing markets
ā¢ Regional penetration
Portfolio Renewal / Growth
1
ā¢ RynaxypyrĀ® insect
control
ā¢ SolametĀ® pastes
ā¢ OptimumĀ®
AQUAmaxĀ® hybrids
ā¢ Expanded capabilities to deliver
blockbuster new products for
existing market spaces
ā¢ Penetrate new markets with
current technologies
Step Change Innovation
2
ā¢ Bio-Based
opportunities
ā¢ Entirely new businesses based on
new technologies and capabilities
ā¢ Open new markets and
opportunities
Transformational
Innovation
3
Nearly 1,800 New Products, Over 1,000 New Patents Granted,
And 1,800 New Patent Applications Filed In 2013
13. 13
Pipeline Of Both Step-Change And Transformational Innovations
Significant Growth Initiatives ā Selected Examples
Innovation
Our Innovation Platform Delivers A Strong Pipeline Across The Company
Agriculture & Nutrition Bio-Based Industrials Advanced Materials
ā¢ CyazypyrĀ® Insecticide
ā¢ DP4114 Corn
ā¢ Encirca Services
ā¢ Food Ingredients
ā¢ Lumigenā¢ Seed Treatment
ā¢ OptimumĀ® GLYā¢ Canola
ā¢ OptimumĀ® Leptraā¢ hybrids
ā¢ PlenishĀ® Soybeans
ā¢ Probiotics
ā¢ Animal Nutrition
ā¢ Biobutanol
ā¢ Cellulosic Ethanol
ā¢ Coldwater Enzymes
ā¢ Food Enzymes
ā¢ Home & Personal Care Enzymes
ā¢ Renewables
ā¢ Aerospace Innovations
ā¢ KevlarĀ® AP
ā¢ KevlarĀ® Tire Innovation
ā¢ New Silver Conductive Pastes
ā¢ OLEDs
ā¢ Refinery Technology Systems
ā¢ ZytelĀ® Next Gen Nylons
SM
14. 14
Bio-Based Opportunities
DuPont Is Uniquely Positioned To Be At The Forefront Of The
Bio-Based Technology Revolution
Innovation
Bio-Based Technologies Represent A New Wave In Innovation That Draws On
All Aspects Of DuPontās Innovation Platform
Agriculture & Nutrition
ā¢ Pioneer grower
network
ā¢ Participation in entire
farm-to-table value
chain
ā¢ Industry collaborations
ā¢ Agronomy
ā¢ Plant genetics
ā¢ Nutritional science
ā¢ Toxicology
ā¢ Chemistry
ā¢ Elite germplasm pool
ā¢ Regional
testing/growing
capability
ā¢ Formulation technology
ā¢ Chemical synthesis
ā¢ Trait integration
Global Market
Insights
Technical
Capabilities
Science
Bio-Based Industrials
ā¢ Industry pioneer
ā¢ Collaborations in food and
consumer goods markets
ā¢ Biofuels, biomaterials
commercial businesses
ā¢ Enzymology
ā¢ Synthetic biology
ā¢ Fermentation science
ā¢ Chemical engineering
ā¢ Protein engineering
ā¢ Hi-throughput screening
ā¢ Fermentation scale-up
ā¢ Process piloting facilities
Advanced Materials
ā¢ Leading brands
(e.g. KevlarĀ®, TedlarĀ®)
ā¢ Industry partnerships
& collaborations
ā¢ Footprint in 65+
countries
ā¢ Materials science
ā¢ Engineering
ā¢ Chemistry
ā¢ Polymer science
ā¢ Application
development
ā¢ Modeling & prototyping
ā¢ Material & product
testing
ā¢ Global Innovation
Centers
Seed Coatings /
Protection
Renewable
Materials Biologicals
Home &
Packaging Personal Care
Healthier Oils Cellulosic Value
Chains
Energy
Production &
Efficiency
15. 15
$0.9
$2.3
$0.0
$2.0
$4.0
2008 2013
Sales ($B)
China Sales % of Total DuPont
4%
8%
Rapidly Growing
Developing Market Sales
Significant Growth
in China
25 Plants
6 R&D/Technical Centers
5 Offices
14 Joint Ventures
Jiuquan
Beijing
Shenyang
Anyang Laizhou
Zhengzhou
Luohe
Chengdu
Guangzhou
Foshan Dongguan
Shenzhen
Hong Kong
Ningbo
Shanghai
Changshu
Wuxi Zhangjiagang
Kunshan
~6,000 employees
$5.0
$9.7
$0.0
$3.0
$6.0
$9.0
$12.0
2008 2013
Sales ($B)
Developing Market Sales as % of Total DuPont
25%
34%
Developing Markets Represent Significant Opportunities For Growth
(1) Net sales, excluding Performance Chemicals
(1)
DuPontās Global Brand, Agriculture Leadership, And Infrastructure Enhances
Its Capability To Access New Markets
Global Reach
(1)
16. 16
Acquisitions:
Technology/Market Access Driven
Divestitures:
Slower Growth Businesses
Enhanced Portfolio For Higher Growth, Higher Value Through Major
Transactions
Disciplined Portfolio Management Continues To Strengthen The Company
Industrial
Biosciences
Safety &
Protection
Agriculture
Nutrition &
Health
Electronics &
Communications
Performance
Materials
$36.0B
2013 Sales
ā¢ 7 US seed companies
ā¢ Solae ā full ownership
ā¢ MECSTM sulfuric acid technology
ā¢ InnovalightTM liquid silicon inks
for PV
ā¢ Pannar Seed ā full ownership
ā¢ Glass Laminating Solutions/Vinyls
ā¢ Professional products insecticide
assets
ā¢ KocideĀ® and ManKocideĀ® fungicides
(In Process)
ā¢ Liquid Packaging Systems
ā¢ ZeniteĀ® liquid crystal polymer resins
ā¢ SontaraĀ® nonwovens business
ā¢ Borealis specialty polymers JV
Additional Acquisitions
Additional Portfolio Changes
(1) Segment Sales include transfers
(1)
Performance Coatings
(2013, $5.1B)
(2011, $7B) Performance Chemicals
(Mid-2015, ~19% of 2013 Sales)
Execution
17. 17
Committed Focus To Aligning Costs With A Changing Portfolio
Execution
As part of the plan to separate Performance Chemicals, Management initiated
a fresh look at:
ā¢ Organizational design, business necessities and external benchmarks
ā¢ Business processes and optimal means to execute
ā¢ Management structure
Optimization of
The Ongoing
DuPont
Re-alignment of functional support around business units
ā¢ Streamline corporate support, centers-of-excellence and regional support
Reduce complexity
ā¢ Fewer layers of management
ā¢ Clarity on accountability and staffing to support
ā¢ Standardized processes
Outsourcing of non-strategic support activities
āFresh Startā
Initiative
A Detailed Play Book Is In Place And Execution Is Ongoing
18. 18
āFresh Startā Will Have A Significant And Sustainable Benefit
Result Target Annual Savings ($MM)
ā¢ Significant complexity reduction
with clear accountabilities and
performance measurement
ā¢ Core functions will serve business
units at lowest cost
ā¢ Transactional activities in service
centers employing standard
business processes
ā¢ Improved organization agility with
spans, layers and levels better than
benchmark
ā¢ Operational improvements will
increase plant efficiency and
optimize logistics
āFresh Startā Represents Another Step Towards Optimizing
Operational Efficiency
Execution
Cost Reductions
Q4 2015
Run Rate
Cost Reductions
in Final State
Costs Eliminated at
Performance Chemicals
Separation
$375 $375
Redesign, Simplify and
Standardize Company-
Wide Processes
$250 $625
Target Annual Savings:
~Two-Thirds of
Total Plan
$1,000
19. 19
Discussion Agenda
II. Managementās Plan Is Delivering Results
I. DuPont Is Executing On A Plan To Deliver Higher Growth, Higher Value
III. Managementās Plan Is Aligned With Shareholder Priorities
20. 20
Management Has A Strong Track Record Of Delivering Results
2009 ā Current
Clear Strategic Missionā¦
1. Refine the portfolio to achieve
higher growth with less
volatility
2. Improve operational
performance
3. Reduce costs and improve
efficiency
4. Return capital to shareholders
Since The Start Of 2009, Managementās Plan Has Delivered Total Shareholder Return
Of 253%(1) And Will Continue To Drive Strong Future Growth For DuPont
ā¦With Tangible Results
ļ¼ Enhanced portfolio
ļ¼ Realized innovation successes
ļ¼ Strengthened key business lines
ļ¼ Streamlined cost structure
ļ¼ Achieved strong earnings growth and
margin improvement
ļ¼ Simplified management
ļ¼ Accelerated capital return to
shareholders
ļ Driven by strong governance and
accountability
(1) Total Shareholder Return from 12/31/2008 ā 9/30/2014
21. 21
DuPont Performance Chemicals
Upcoming Performance Chemicals Separation Is Another Key
Repositioning Step
Creating Two Highly Competitive Companies With Distinct
Value Creation Strategies
ā¢ Leading technologies
ā¢ Science leverage across businesses
ā¢ Strong applications development
ā¢ Targets secular driven growth
ā¢ Innovative products; robust pipeline
ā¢ Global reach and productivity
ā¢ Leading businesses
ā¢ Customer focused applications development
ā¢ Low cost production
ā¢ Capital productivity
ā¢ Sustainable operator
ā¢ Regulatory leadership and advocacy
Mission: Growth
Differentiated innovation platform
Mission: Cash Generation
Industry leadership and productivity
Enhanced Portfolio
22. 22
New Products Delivered More Than $10 Billion(1) (28%) Of
Revenue In 2013
$ 5.8B
new product revenue
$ 0.4B
new product revenue
$ 3.9B
new product revenue
Agriculture & Nutrition Bio-Based Industrials Advanced Materials
ā¢ Seeds
ā¢ Agricultural Chemicals
ā¢ Specialty Food Ingredients
ā¢ Enzymes
ā¢ Biofuels
ā¢ Biomaterials
ā¢ Advanced Polymers
ā¢ Protective Materials
ā¢ Electronic Materials
ā¢ Alternative Energy
Realized Innovation Successes
(1) 2013 revenue from products introduced in the last four years
Our Innovation Platform Has Proven Successful
23. 23
$0
$1
$2
$3
$4
$5
$6
$7
2008 2011 2013
Segment Adjusted Operating Earnings ($B)
Agriculture Electronics & Communications
Industrial Biosciences Nutrition & Health
Performance Materials Safety & Protection
Performance Chemicals Performance Coatings
$0
$10
$20
$30
$40
2008 2011 2013
Segment Sales ($B)
Agriculture Electronics & Communications
Industrial Biosciences Nutrition & Health
Performance Materials Safety & Protection
Performance Chemicals Performance Coatings
Source: Company Data
(1) Segment sales include transfers. CAGR is calculated excluding Performance Coatings, Performance Chemicals and Other
(2) Segment adjusted operating earnings are calculated using segment pre-tax operating income (GAAP) less significant items; calculations included certain corporate expenses and excluded adjusted operating earnings of
Performance Coatings, Performance Chemicals, Pharma and Other. See non-GAAP reconciliations included within this presentation
Segment Sales (1)
Segment Adjusted Operating Earnings (2)
-
Strategic And Operational Actions Have Resulted In Strong
Performance
DuPontās Ongoing Portfolio Is Well Positioned To Drive Further Growth Through
Greater Emerging Market Penetration, Continued Innovation Success,
And Operational Improvements
Strengthened Key Business Lines
24. 24
DuPontās Businesses Are Competitively Well-Positioned
2013 EBITDA Margin Key Margin Drivers
Note: DuPontās adjusted segment EBITDA margins are calculated using segment pre-tax operating income (GAAP), less significant items; calculations include certain corporate expenses; see non-GAAP
reconciliations included within this presentation
Peer EBITDA margins calendarized to December where possible) exclude non-recurring expenses/income where applicable and a corporate overhead allocated based on gross segment revenue contribution
(1) Using comparable industry segment when applicable
Strengthened Key Business Lines
Peer Universe (1)
DuPont
Improvement
(Since 2008)
Competitive with peers; well-positioned for future growth
due to industry leading R&D pipeline and leading market
positions globally
BASF, Bayer, Dow, FMC,
Monsanto, Syngenta +360bps
15.6%
17.2%
Electronics &
Communications
Peer Average
Meaningful solar market exposure; competitive despite
precious metal pass-through pricing
Air Products, Asahi Kasei,
Dow, Hitachi, Toray +210bps
18.8%
31.0%
Industrial
Biosciences
Peer Average
Diverse portfolio of enzymes plus early stage biomaterials;
only potential peer has narrow portfolio of specialty enzymes
N/A Novozymes
14.8%
21.0%
Nutrition
& Health
Peer Average
Broadest portfolio and leader in each product line; negatively
impacted by guar price fluctuations in 2013; continued
improvement expected
Chr. Hansen, FMC, Ingredion,
Kerry, Royal DSM, Tate &
Lyle
+600bps
21.3%
18.2%
Safety
& Protection
Peer Average
Leading brands and technology
3M, Honeywell, Kimberly-
Clark, Owens Corning, Royal
DSM, Teijin
+80bps
21.5%
12.8%
Performance
Materials
Peer Average
Focus on differentiated, value-added products
BASF, Celanese, Dow,
Eastman, Lanxess, Royal DSM +1360bps
16.7%
7.4%
Performance
Chemicals
Peer Average
Industry-leading margins in cyclical end markets; advantaged
cost structure
Arkema, Daikin, Huntsman,
Kronos, Solvay, Tronox +320bps
22.6%
22.3%
Agriculture
Peer Average
25. 25
Cost Management Is Always A Priority
Cost Reductions
$0B
$1B
$2B
$3B
$4B
2009
2010
2011
2012
2013
ā¢Days Payable Outstanding (DPO) increased by 23%
ā¢Days Sales Outstanding (DSO) decreased by 5%
Streamlined Cost Structure
2009 ā 2013 Cost Saving Initiatives
ļ¼Over $2B cumulative fixed cost savings achieved (exceeded target of $1B(1)), driving segment operating margin improvement
ļ¼Over $3B in cumulative working capital reductions achieved (exceeded target of $1B(1)), funding business growth
ļ¼~$230MM of stranded costs eliminated after Performance Coatings divestiture
ļ¼$130MM of cost synergies realized from Danisco acquisition
Working Capital Savings
$0B
$1B
$2B
$3B
2009
2010
2011
2012
2013
(1)Based on 3-year targets set in 2009
26. 26
Cost Saving Initiatives Will Further Enhance Already Competitive
Overhead Costs And Increase DuPontās Cost Advantage
Streamlined Cost Structure
Proxy Peers
Average SG&A as a % of Net
Sales (CY2009 ā CY2013)
10.4%
31.5% 31.1%
27.5%
22.7% 22.6% 22.2%
20.7%
19.6%
18.5%
18.0%
16.7%
14.1%
11.0%
10.4% 10.4%
9.8%
5.1% 4.9%
0.0%
5.0%
10.0%
15.0%
20.0%
25.0%
30.0%
35.0%
J&J P&G Merck Sygenta Emerson Baxter 3M Ingersoll-
Rand
Kimberly-
Clark
Monsanto DuPont Honeywell United
Technologies
Air Products Johnson
Controls
Caterpillar Dow Boeing
Peer Median: 18.5%
Source: Company Filings (excludes Performance Coatings)
(1) 10.4% represents SG&A as reported; 16.7% represents reported SG&A plus certain costs included in Other Operating Charges on the income statement; these costs include functional and
management expenses supporting the business segments
(1)
27. 27
Adjusted Operating Margins Have Significantly Improved
9.5%
14.1%
16.0%
2008 2011 2013
+650 bps
2008ā2013 Change in
Adjusted Operating Margin(1)
Strong Operating Performance
(1) Segment adjusted operating earnings and margins are calculated using segment pre-tax operating income (GAAP) less significant items; calculations included certain corporate expenses and
excluded adjusted operating earnings and margins of Performance Coatings, Performance Chemicals, Pharma and Other. See non-GAAP reconciliations included within this presentation
+190
bps
2011ā2013
Change in
Adjusted
Operating
Margin(1)
28. 28
5.9%
2.8%
9.3%
14.1%
17.1%
3.4%
29.1%
DuPont
Proxy Peers
S&P
Chemicals
S&P 500
S&P
Materials
$1.0B
$2.8B
$1.2B
$0.8B
$2.2B
$3.6B
2008 2013
Adjusted Operating Earnings After-Tax(1)
EPS CAGR(2)
(CY2008 ā CY2013)
(3)
(4)
(5)
Ex Non-Op Pension
and OPEB
Ex Performance
GAAP Chemicals & Pharma
(6)
Source for peer and market data: Datastream as of 9/30/2014, Bloomberg, Capital IQ, FactSet
(1) Adjusted operating earnings after-tax is defined as income from continuing operations after-tax (GAAP) excluding non-operating pension/OPEB costs and significant items. Reconciliations of non-GAAP measures to GAAP are
included with this presentation
(2) EPS defined as diluted earnings per share from continuing operations. āCAGRā defined as compound annual growth rate
(3) Refer to non-GAAP reconciliations included within this presentation
(4) Proxy Peers consists of 3M, Air Products, Baxter Intl, Boeing, Caterpillar, Dow, Emerson, Honeywell, Johnson Controls, Johnson and Johnson, Kimberly Clark, Merck, Monsanto, Procter and Gamble, Syngenta AG, and United
Technologies; Median EPS CAGR used; Proxy Peer Ingersoll Rand excluded because CAGR is non-meaningful
(5) S&P Chemicals in 2014 consists of Airgas, Air Products, CF Industries, Dow, DuPont, Eastman Chemical, Ecolab, FMC, IFF, LyondellBasell, Monsanto, Mosaic, PPG, Praxair, Sherwin-Williams, and Sigma-Aldrich
(6) S&P Materials in 2014 consists of Air Products, Airgas, Alcoa, Allegheny Technologies, Avery Dennison, Ball, Bemis, CF Industries, Dow Chemical, DuPont, Eastman Chemical, Ecolab, FMC, Freeport-McMoRan, IFF,
International Paper, LyondellBasell, Martin Marietta Materials, MeadWestvaco, Monsanto, Mosaic, Newmont Mining, Nucor, Owens Illinois, PPG, Praxair, Sealed Air, Sherwin-Williams, Sigma-Aldrich, and Vulcan Materials
S trong Operating Performance
Adjusted Operating Earnings Have More Than Doubled And EPS
Growth Has Significantly Outperformed Both Peers And The Market
Adjusted Operating Earnings After-Tax (ex. Perf. Coatings, Perf. Chem. & Pharma)
Perf. Chem. & Pharma Operating Earnings After-Tax GAAP
29. 29
ā¢ Short-term incentives include:
ā¢ Revenue growth
ā¢ Operating EPS growth
ā¢ Cash flow from operations versus budget
ā¢ Individual performance versus goals
ā¢ 80% of business presidentsā short-term
incentives tied to performance of their
Business Units
ā¢ Senior leadership long-term incentives
(PSUs)(1) include:
ā¢ 3 year revenue growth vs. Proxy Peers
ā¢ 3 year Total Shareholder Return vs. Proxy
Peers
Quality of Management Improved Compensation Aligned With Performance
(1) āPSUsā defined as performance-based restricted stock units
ā¢ Consolidated 23 Business Units into 12
ā¢ Reduced senior leadership by >20%
ā¢ Eliminated a layer of leadership
ā¢ 19% of current senior leadership new to
their roles
ā¢ Created specific top and bottom line goals by
Business Unit
ā¢ Established new corporate culture/behaviors
ā¢ Speed and agility
ā¢ Accountability
ā¢ Collaboration
ā¢ Enhanced transparency ā including external
reporting
DuPont Has Taken Numerous Actions To Strengthen Management
Accountability And Align Incentives
Simplified Management
Managementās Interests Are Directly Aligned With Shareholder Value Creation
30. 30
$1B
$3B
$5B
$7B
$10B
$13B
860
880
900
920
940
2009 2010 2011 2012 2013 2014
YTD
Number of Shares (MM)
Cumulative Dividends Cumulative Buybacks
Basic Shares Outstanding
Dividends per Share
$1.64 $1.64 $1.64
$1.70
$1.78
$1.84
2009 2010 2011 2012 2013 2014
Capital Returned To Shareholders
Returned Capital to Shareholders
DuPontās Capital Return Outperforms Peers Given Consistent
Increase Of Dividends And Share Repurchases
(1) Dividend per share based on dividend declarations through 4Q 2014
(2) Proxy Peers consists of 3M, Air Products, Baxter Intl, Boeing, Caterpillar, Dow, Emerson, Honeywell, Ingersoll Rand, Johnson Controls, Johnson and Johnson, Kimberly Clark, Merck, Monsanto, Procter and Gamble, Syngenta
AG, and United Technologies
(3) S&P Chemicals in 2014 consists of Airgas, Air Products, CF Industries, Dow, DuPont, Eastman Chemical, Ecolab, FMC, IFF, LyondellBasell, Monsanto, Mosaic, PPG, Praxair, Sherwin-Williams, and Sigma-Aldrich
(4) S&P Materials in 2014 consists of Air Products, Airgas, Alcoa, Allegheny Technologies, Avery Dennison, Ball, Bemis, CF Industries, Dow Chemical, DuPont, Eastman Chemical, Ecolab, FMC, Freeport-McMoRan, IFF,
International Paper, LyondellBasell, Martin Marietta Materials, MeadWestvaco, Monsanto, Mosaic, Newmont Mining, Nucor, Owens Illinois, PPG, Praxair, Sealed Air, Sherwin-Williams, Sigma-Aldrich, and Vulcan Materials
(5) Total Capital Returned to Shareholders calculated as dividends and share repurchases as a % of average market capitalization; Index metrics calculated as the average of the median value for all companies in the index in
each of the five years (2009 ā 2013)
(1)
Total Capital Returned to
Shareholders (2009 ā 2013)(5)
5.0%
4.6%
3.8%
4.2%
3.1%
DuPont
Proxy Peers
S&P
Chemicals
S&P 500
S&P Materials
(2)
(3)
(4)
As of 9/30/14, cumulative dividends
exceeded $9B; $5B share repurchase
program announced on 1/28/2014
31. 31
Source: Datastream as of 9/30/2014, Bloomberg, Capital IQ, FactSet
(1) Proxy Peers and S&P Indices are USD market cap-weighted and assume dividends are re-invested at the closing price applicable on the ex-dividend date
(2) Proxy Peers consists of 3M, Air Products, Baxter Intl, Boeing, Caterpillar, Dow, Emerson, Honeywell, Ingersoll Rand, Johnson Controls, Johnson and Johnson, Kimberly Clark, Merck, Monsanto, Procter and Gamble, Syngenta
AG, and United Technologies
(3) S&P Chemicals in 2014 consists of Airgas, Air Products, CF Industries, Dow, DuPont, Eastman Chemical, Ecolab, FMC, IFF, LyondellBasell, Monsanto, Mosaic, PPG, Praxair, Sherwin-Williams, and Sigma-Aldrich
(4) S&P Materials in 2014 consists of Air Products, Airgas, Alcoa, Allegheny Technologies, Avery Dennison, Ball, Bemis, CF Industries, Dow Chemical, DuPont, Eastman Chemical, Ecolab, FMC, Freeport-McMoRan, IFF, International
Paper, LyondellBasell, Martin Marietta Materials, MeadWestvaco, Monsanto, Mosaic, Newmont Mining, Nucor, Owens Illinois, PPG, Praxair, Sealed Air, Sherwin-Williams, Sigma-Aldrich, and Vulcan Materials
Total Shareholder Return (12/31/08 ā 9/30/14)(1)
(2)
(3)
(4)
DuPont Has Outperformed Peers And The Market In Total
Shareholder Return
253%
125%
217%
147%
158%
DuPont
Proxy Peers
S&P
Chemicals
S&P 500
S&P Materials
Delivered Shareholder Value
32. 32
DuPontās Effective Governance Practices Contribute To Value Creation
DuPont Has Actively Supported And Adopted Best Practices In Corporate Governance
Accountability and Oversight
Effective Board
Leadership and
Independent
Oversight
ā¢ 12 of 13 directors are independent
ā¢ 4 new directors added in the last three years, and 10 directors added in the
last nine years
ā¢ Executive sessions of independent directors at every board meeting
ā¢ No director sits on more than 2 other public company boards
Enhanced
Shareholder Rights
ā¢ Annual election of directors
ā¢ Majority vote standard
ā¢ Shareholder ability to call special meetings (25%) or act by written consent
ā¢ Simple majority vote standard for bylaw/charter and M&A
ā¢ No poison pill in place
Sustainability Efforts
and Shareholder
Engagement
ā¢ Comprehensive sustainability program and annual reporting
ā¢ Strong track record of shareholder dialogue
ā¢ Responsive to shareholder feedback
Strong Experience
ā¢ Impressive leadership experience in corporate, government, and scientific
roles
ā¢ Track record of successfully evaluating and implementing major
transformations at DuPont
33. 33
Discussion Agenda
II. Managementās Plan Is Delivering Results
I. DuPont Is Executing On A Plan To Deliver Higher Growth, Higher Value
III. Managementās Plan Is Aligned With Shareholder Priorities
34. 34
Management Actively Engages With Shareholders To Understand
Priorities And Discuss Improvements
Shareholder Priorities Managementās Plan
Separation of Non-Core
Businesses
ļ¼ Aggressive and proactive portfolio management
ļ¼ Latest step ā Performance Chemicals ā in process
ļ¼ Business aligned around key technology and market themes
Differential
Management Based on
Business Maturity
ļ¼ Long time DuPont strategy to fund growth with mature business cash flow
Cost Reduction and
Business Simplification
ļ¼ Tangible plan with identified actions being executed
ļ¼ Proven track record of cost productivity and delayering
Shareholder Friendly
Capital Allocation
ļ¼ Capital returns are large and accelerating
ļ¼ Capital structure that supports growth
Management
Accountability
ļ¼ Management compensation directly aligned with shareholdersā interests
Management's Plan Is Aligned With Shareholder Interests
And Is Positioned To Deliver Significant Value
35. 35
DuPontās Plan Will Continue to Create Value For Shareholders
Observations On Proposal For Further Break-Up
(1) Consists of debt breakage costs, separation charges, additional working capital, cash repatriation tax, tax leakage from legal separation, upfront pension contributions, and financing fees
(2) Consists of duplicative overhead, increase in tax rate, and additional interest costs
ā¢ Trian Fund Management has proposed the further separation of DuPont into two entities ā a
company focused on our Agriculture & Nutrition businesses and a company focused on our
Materials businesses ā with substantial additional leverage
ā¢ Members of DuPontās Board and Management team met with Trian a number of times and,
assisted by independent advisors, have reviewed their proposal
ā¢ Observations about their proposal include:
ā Significantly underestimates upfront separation costs(1) and ongoing dis-synergies(2)
ā Has no basis for annual cost savings of $2-4B
ā Creates negative impact of lower credit rating on supplier terms and reduces financial
flexibility necessary for seasonal and regional cash flow management
ā Assumptions overestimate cash flow generation and returns to shareholders
ā Assumes DuPont trades at a sum of the parts discount
37. 37
DuPontās Plan Has Delivered Strong Results
Management Has A Proven Track Record Of Success
Key Areas Results Of Management Actions
Returns ļ¼ Outperformance in TSR and total capital returned to shareholders versus peers
Targets
ļ¼ Track record of exceeding performance targets; Management has exceeded
3-year targets set in 2009 and long-term targets set in 2010(1)
Margins ļ¼ Significant improvement in adjusted operating earnings margins
Growth
ļ¼ Strong adjusted operating EPS growth
ļ¼ Ability to leverage operational priorities to drive new product sales across the
company
Portfolio ļ¼ Proven focus on enhancing DuPontās business portfolio
Efficiency ļ¼ Priority focus on cost reduction and an efficient capital strategy
(1) Targets based on results excluding significant items
38. 38
Management And Board Remain Focused On Driving Growth
And Enhancing Shareholder Value
Managementās Plan: What Shareholders Should Expect From Us
ā¢ Higher growth, higher value through focused strategic priorities
ā¢ Innovation driven new products and solutions
ā¢ Accelerated growth in developing markets
ā¢ Execution and productivity as a way of life
ā¢ Savings from redesign initiative (āFresh Startā)
ā¢ Ongoing portfolio refinements to increase value
ā¢ Capital structure that supports growth, seasonality and regional needs
40. 40
YearYearYear201320112008Total Segment Sales (a)36,046 34,087 26,499 Less: Performance Chemicals (b)6,932 8,055 6,245 Less: Other6 40 160 Total Segment Sales (excluding Performance Chemicals and Other)29,108 25,992 20,094 (a) Segment sales includes transfers. SEGMENT ADJUSTED OPERATING EARNINGSSegment Pre-tax Operating Income (PTOI) (GAAP) (c)5,369 5,881 3,373 Less: Performance Chemicals PTOI (b)941 2,162 619 Less: Other/Pharma PTOI(340) (55) 839 Less: Corporate Expenses (d) 605 496 479 Add: Significant Items (e)487 383 466 Segment Adjusted Operating Earnings (excluding Performance Chemicals and Other/Pharma) (f) (Non-GAAP)4,650 3,661 1,902 (b) Prior periods reflect the reclassifications of VitonĀ® fluoroelastomers from Performance Materials to Performance Chemicals. (e) Represents significant items included in Segment PTOI, excluding those related to Performance Chemicals and Other/Pharma. E. I. DU PONT DE NEMOURS AND COMPANY AND CONSOLIDATED SUBSIDIARIESRECONCILIATION OF NON-GAAP MEASURES (UNAUDITED) (d) Represents total corporate expenses excluding significant items, an estimate of DuPont Performance Coatings residual costs and an estimate for an amount that would be allocated to Performance Chemicals. (f) Segment adjusted operating margin (non-GAAP) is based on total segment sales and segment adjusted operating earnings, excluding Performance Chemicals and Other/Pharma. (dollars in millions) SEGMENT SALES(c) Segment PTOI is defined as income (loss) from continuing operations before income taxes excluding non-operating pension and other postretirement employee benefit costs, exchange gains (losses), corporate expenses and interest.
41. 41
RECONCILIATION OF SEGMENT PRE-TAX OPERATING INCOME (PTOI) TO ADJUSTED EBITDAYear Ended December 31, 2013AgricultureElectronics & CommunicationsNutrition & HealthSafety & ProtectionPerformance Materials (c) Performance Chemicals (c) Industrial BiosciencesSegment PTOI (GAAP) (a)2,132 203 305 694 1,264 941 170 Add: Significant Items Charge/(Benefit) included in Segment PTOI351 131 (6) (4) 16 74 (1) Add: Segment depreciation and amortization358 105 271 198 162 253 81 Less: Corporate Allocations (b)188 41 56 62 100 111 20 Adjusted Segment EBITDA (Non-GAAP)2,653 398 514 826 1,342 1,157 230 Segment Sales11,739 2,549 3,473 3,884 6,239 6,932 1,224 22.6%15.6%14.8%21.3%21.5%16.7%18.8% Year Ended December 31, 2008AgricultureElectronics & CommunicationsNutrition & HealthSafety & ProtectionPerformance Materials (c) Performance Chemicals (c) Segment PTOI (GAAP) (a)1,006 211 18 601 79 619 Add: Significant Items Charge/(Benefit) included in Segment PTOI5 37 17 97 310 56 Add: Segment depreciation and amortization346 86 114 130 206 274 Less: Corporate Allocations (b)113 38 25 64 107 108 Adjusted Segment EBITDA (Non-GAAP)1,244 296 124 764 488 841 Segment Sales6,549 2,194 1,403 3,733 6,215 6,245 19.0%13.5%8.8%20.5%7.9%13.5% (c) Prior periods reflect the reclassifications of Viton Ā® fluoroelastomers from Performance Materials to Performance Chemicals. E. I. DU PONT DE NEMOURS AND COMPANY AND CONSOLIDATED SUBSIDIARIESRECONCILIATION OF NON-GAAP MEASURES (UNAUDITED) (b) Represents total corporate expenses plus unallocated depreciation and amortization, excluding significant items and an estimate of DuPont Performance Coatings residual costs. Adjusted Segment EBITDA Margin (Non-GAAP) Adjusted Segment EBITDA Margin (Non-GAAP) (dollars in millions) (a) Segment PTOI is defined as income (loss) from continuing operations before income taxes excluding non-operating pension and other postretirement employee benefit costs, exchange gains (losses), corporate expenses and interest.
42. 42
YearYear20132008Income From Continuing Operations After Income Taxes (GAAP)2,863 2,083 Add: Significant Items Charge - After-tax423 378 Add: Non-Operating Pension & OPEB Costs / (Credit) - After-tax360 (250) Less: Net Income Attributable to Noncontrolling Interests14 4 Less: Pharma Operating Earnings - After-tax (a)21 666 Less: Performance Chemicals Operating Earnings - After-tax (b), (c)804 537 Adjusted Operating Earnings - After-tax (excluding Performance Chemicals and Pharma) (Non-GAAP)2,807 1,004 RECONCILIATION OF DILUTED EPSGAAP EPS from continuing operations3.04 2.28 Less: Performance Chemicals (b),(c)0.80 0.54 Less: Pharma (a)0.02 0.73 Add: Non-Operating Pension & OPEB Costs / (Credits)0.39 (0.28) EPS (excluding Pharma and Non-Operating Pension & OPEB Costs) (Non-GAAP)2.61 0.73 (a) Pharma operating earnings assumes a 35% tax rate. E. I. DU PONT DE NEMOURS AND COMPANY AND CONSOLIDATED SUBSIDIARIESRECONCILIATION OF NON-GAAP MEASURES (UNAUDITED) (dollars in millions, except per share) (b) Performance Chemicals operating earnings assumes a base income tax rate from continuing operations of 20.8% and 20.4% for 2013 and 2008, respectively. ADJUSTED OPERATING EARNINGS AFTER INCOME TAXES(c) Prior periods reflect the reclassifications of Viton Ā® fluoroelastomers from Performance Materials to Performance Chemicals.