- Ellen Kullman, CEO of DuPont, presented at the 30th Annual Sanford C. Bernstein Strategic Decisions Conference on May 28, 2014.
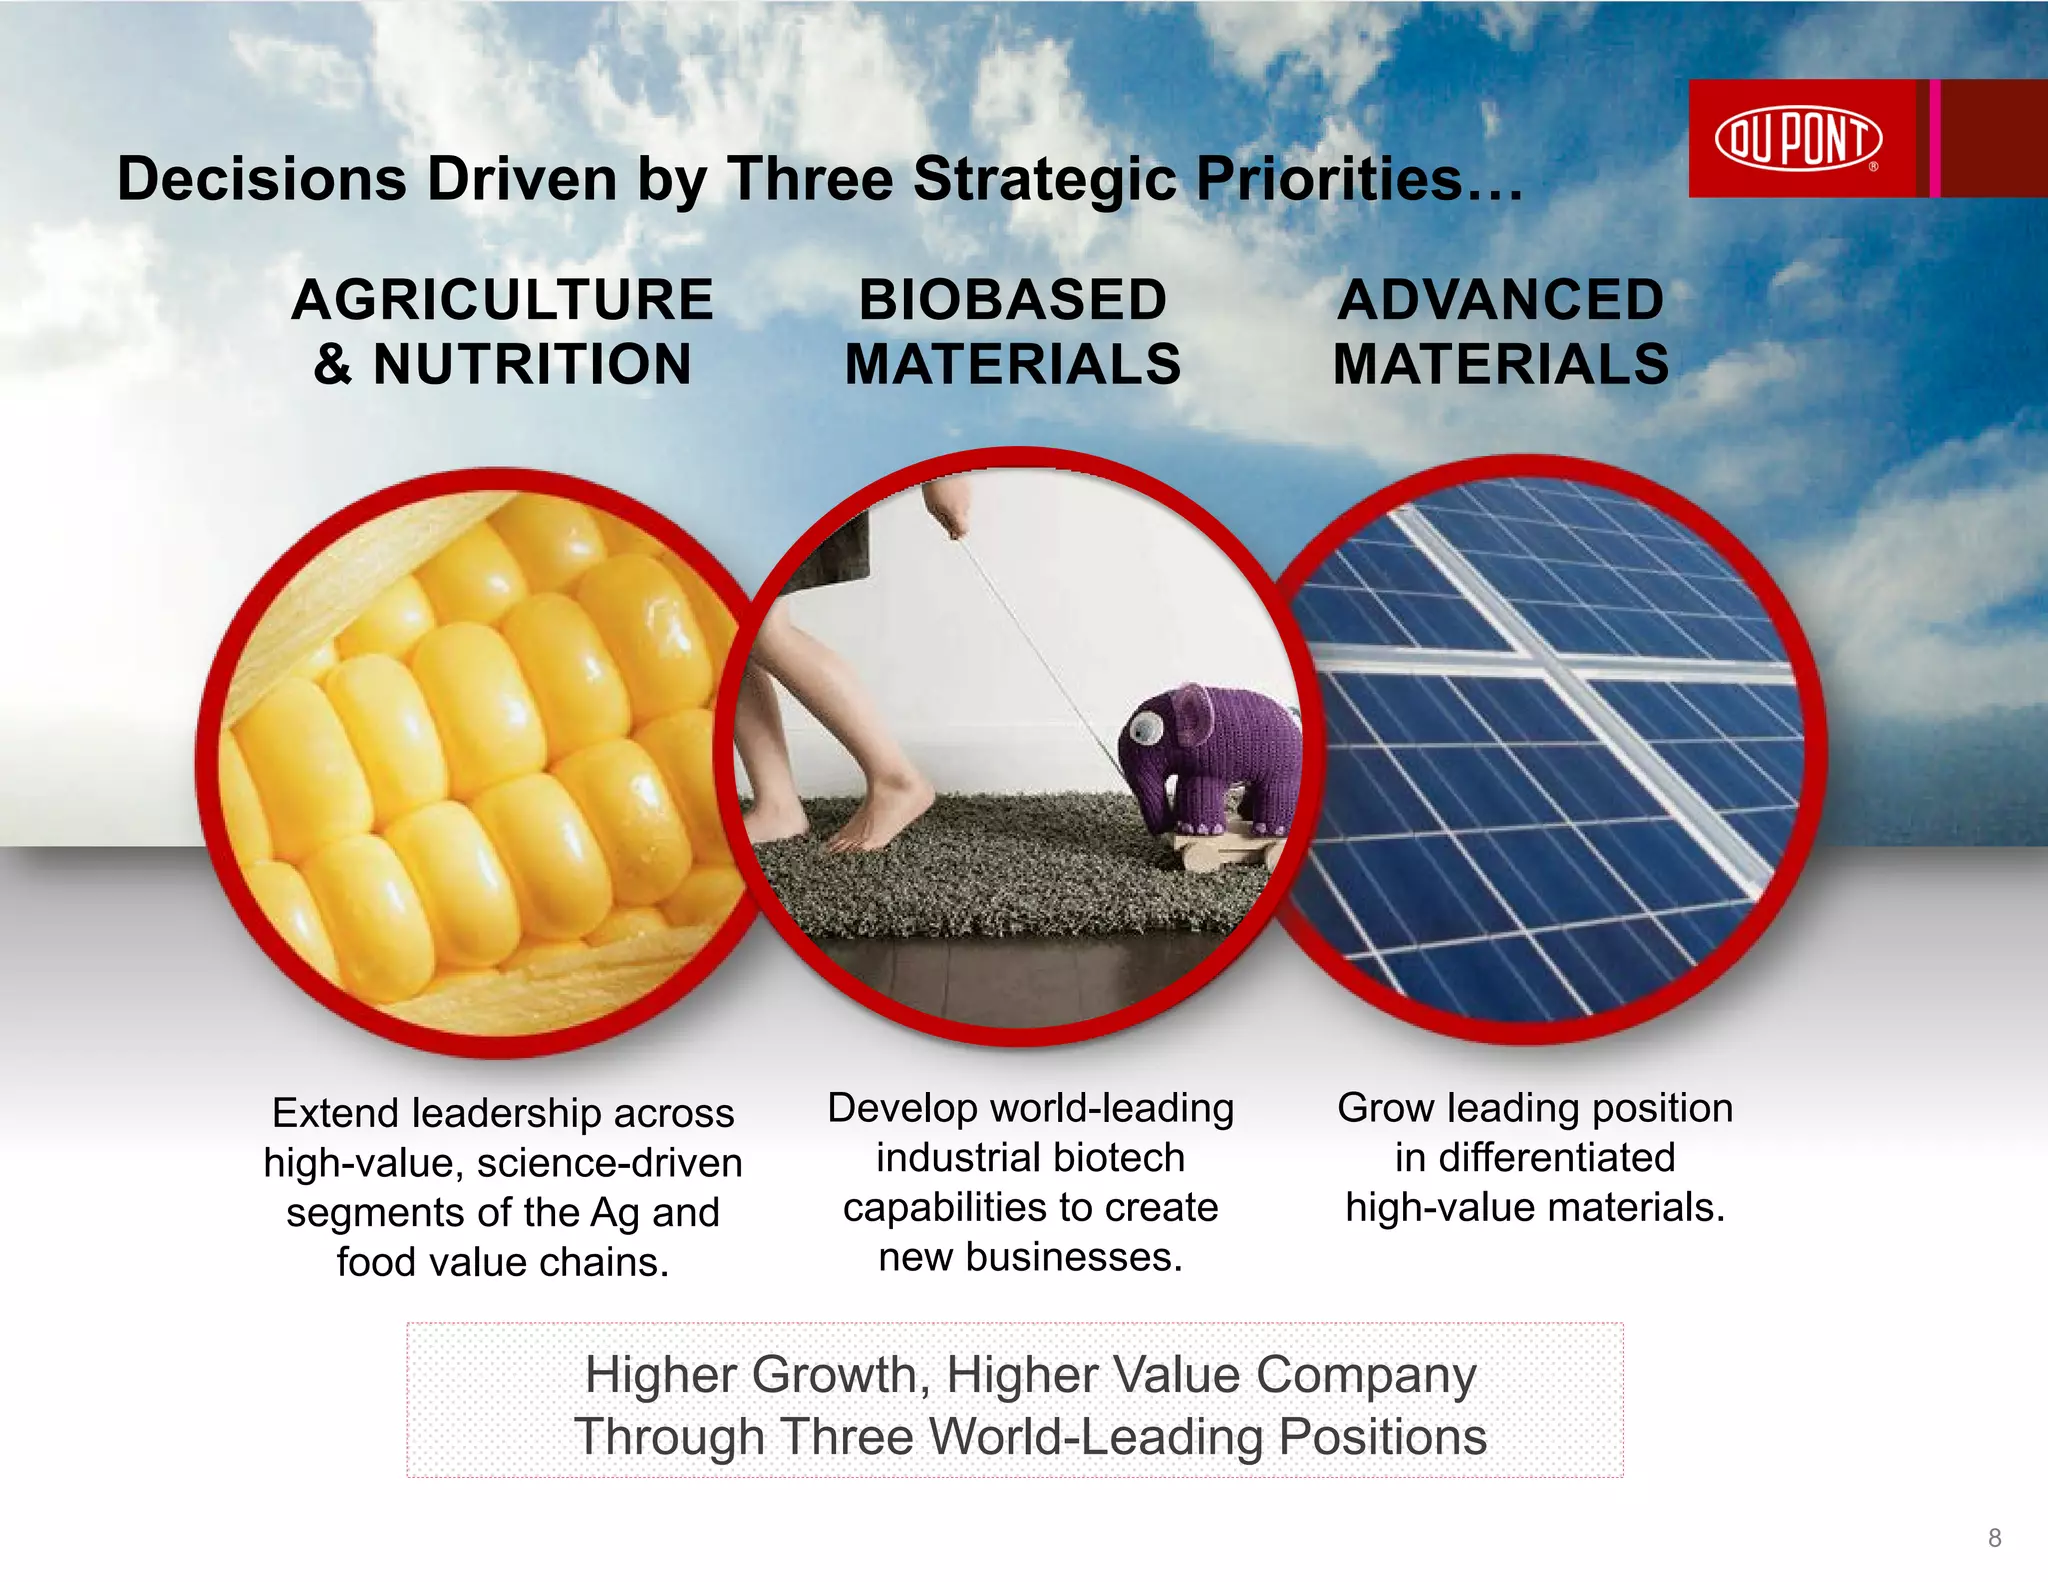
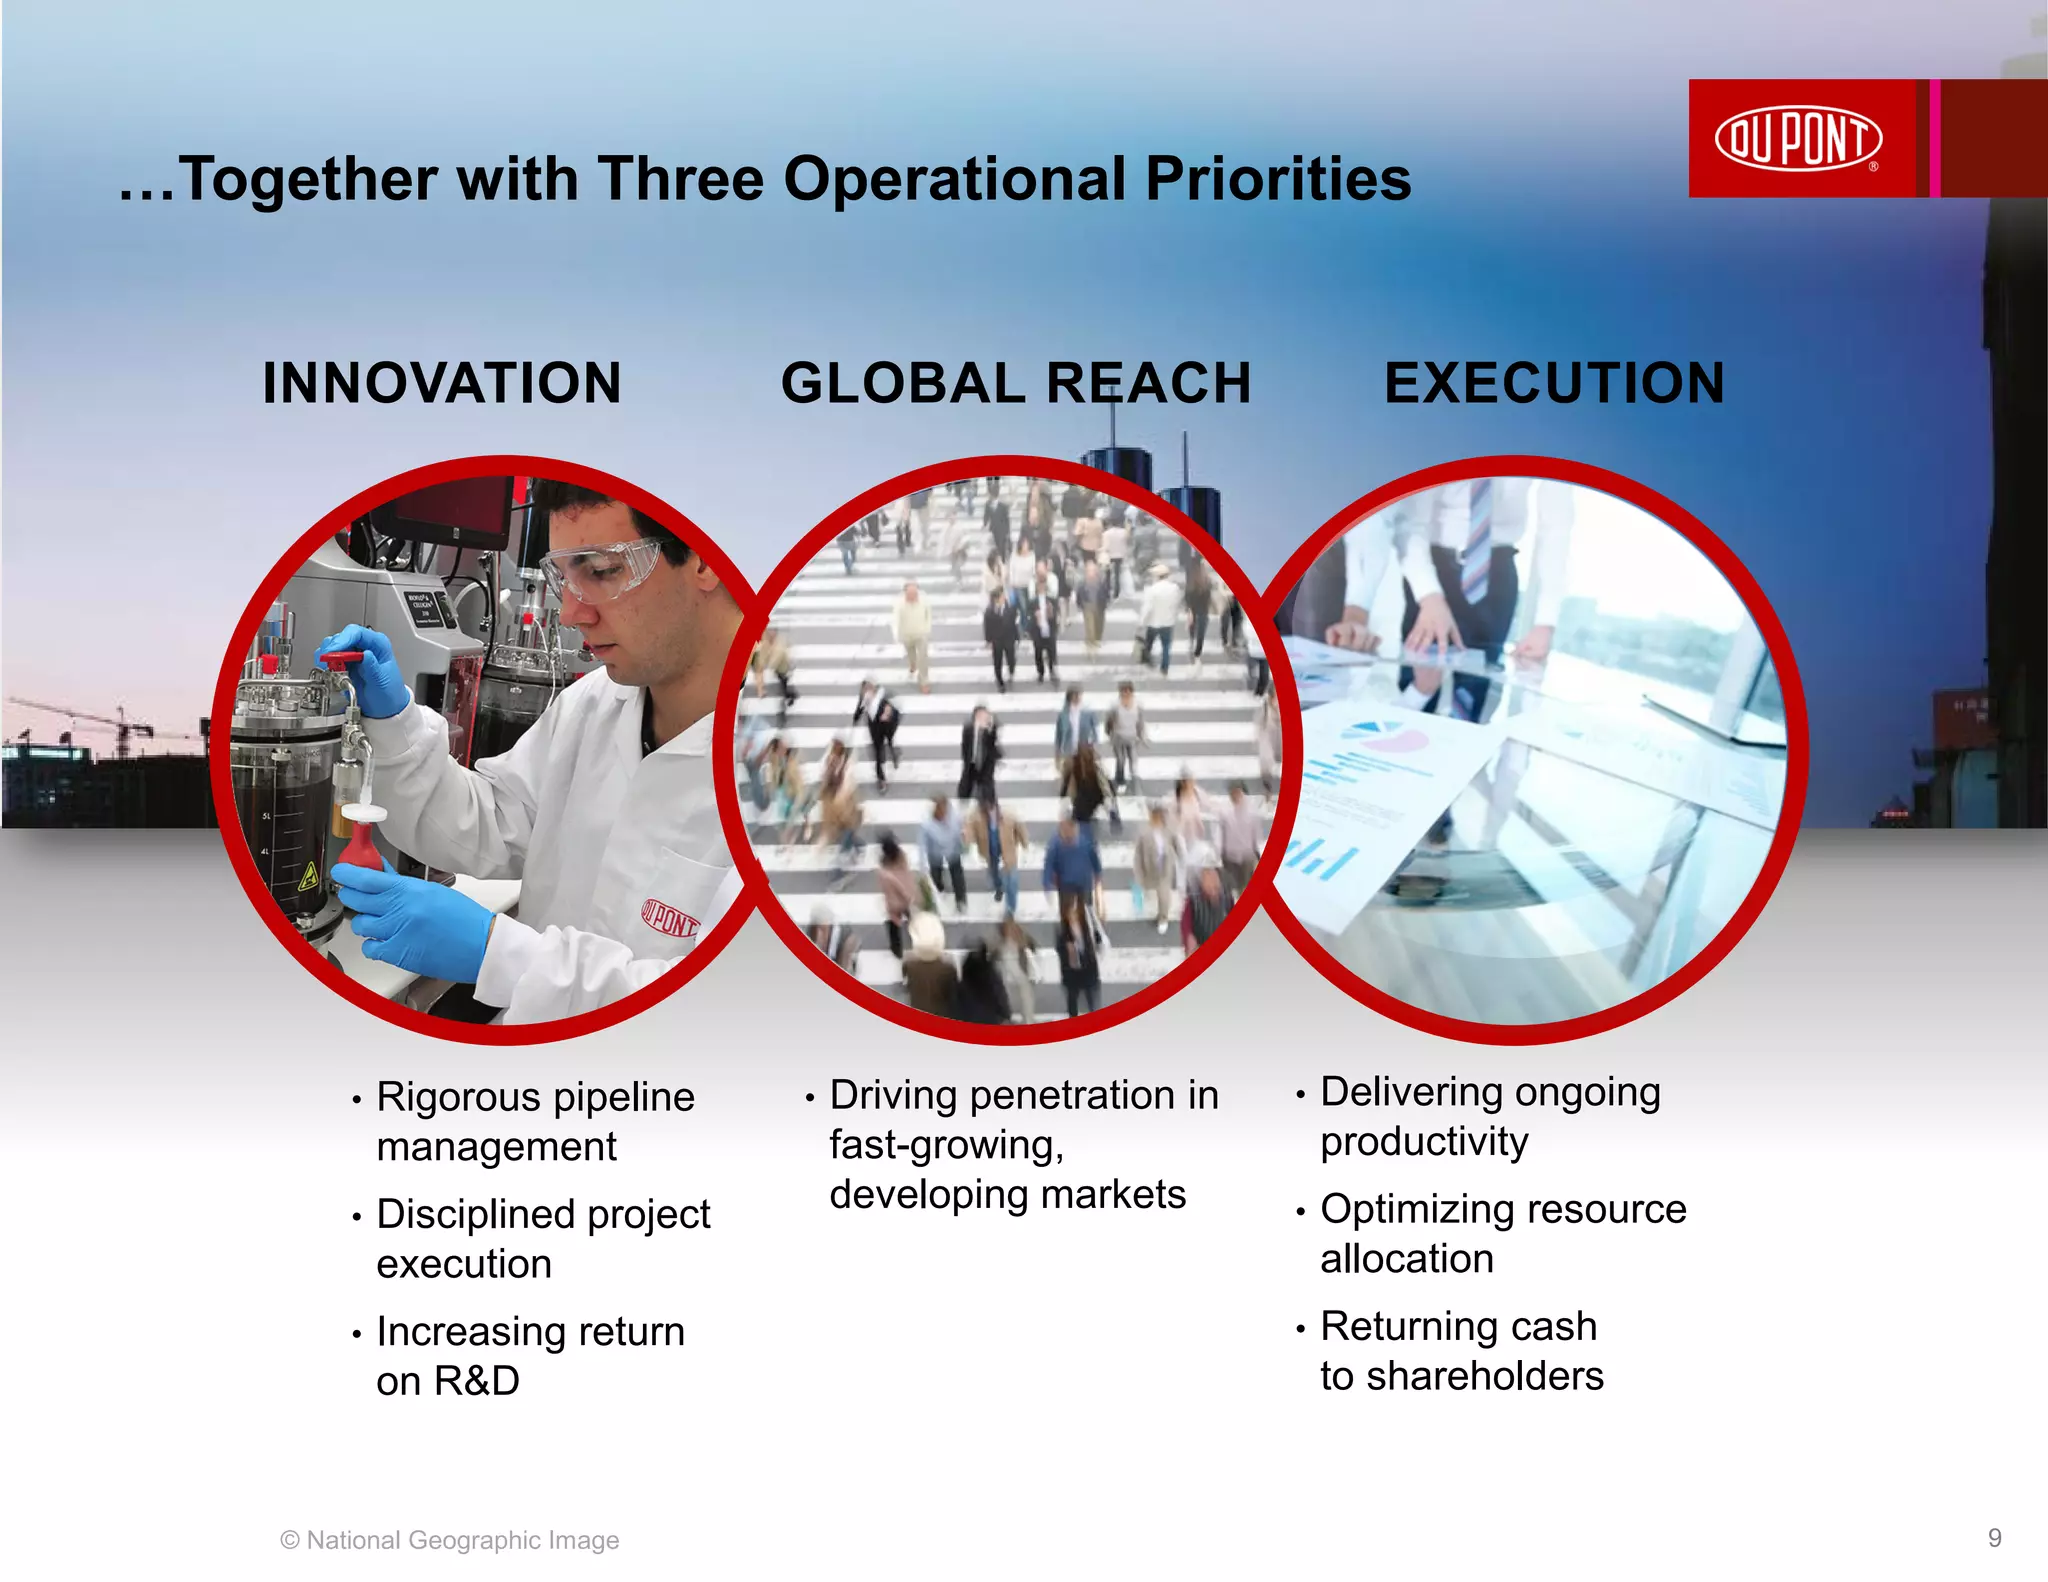
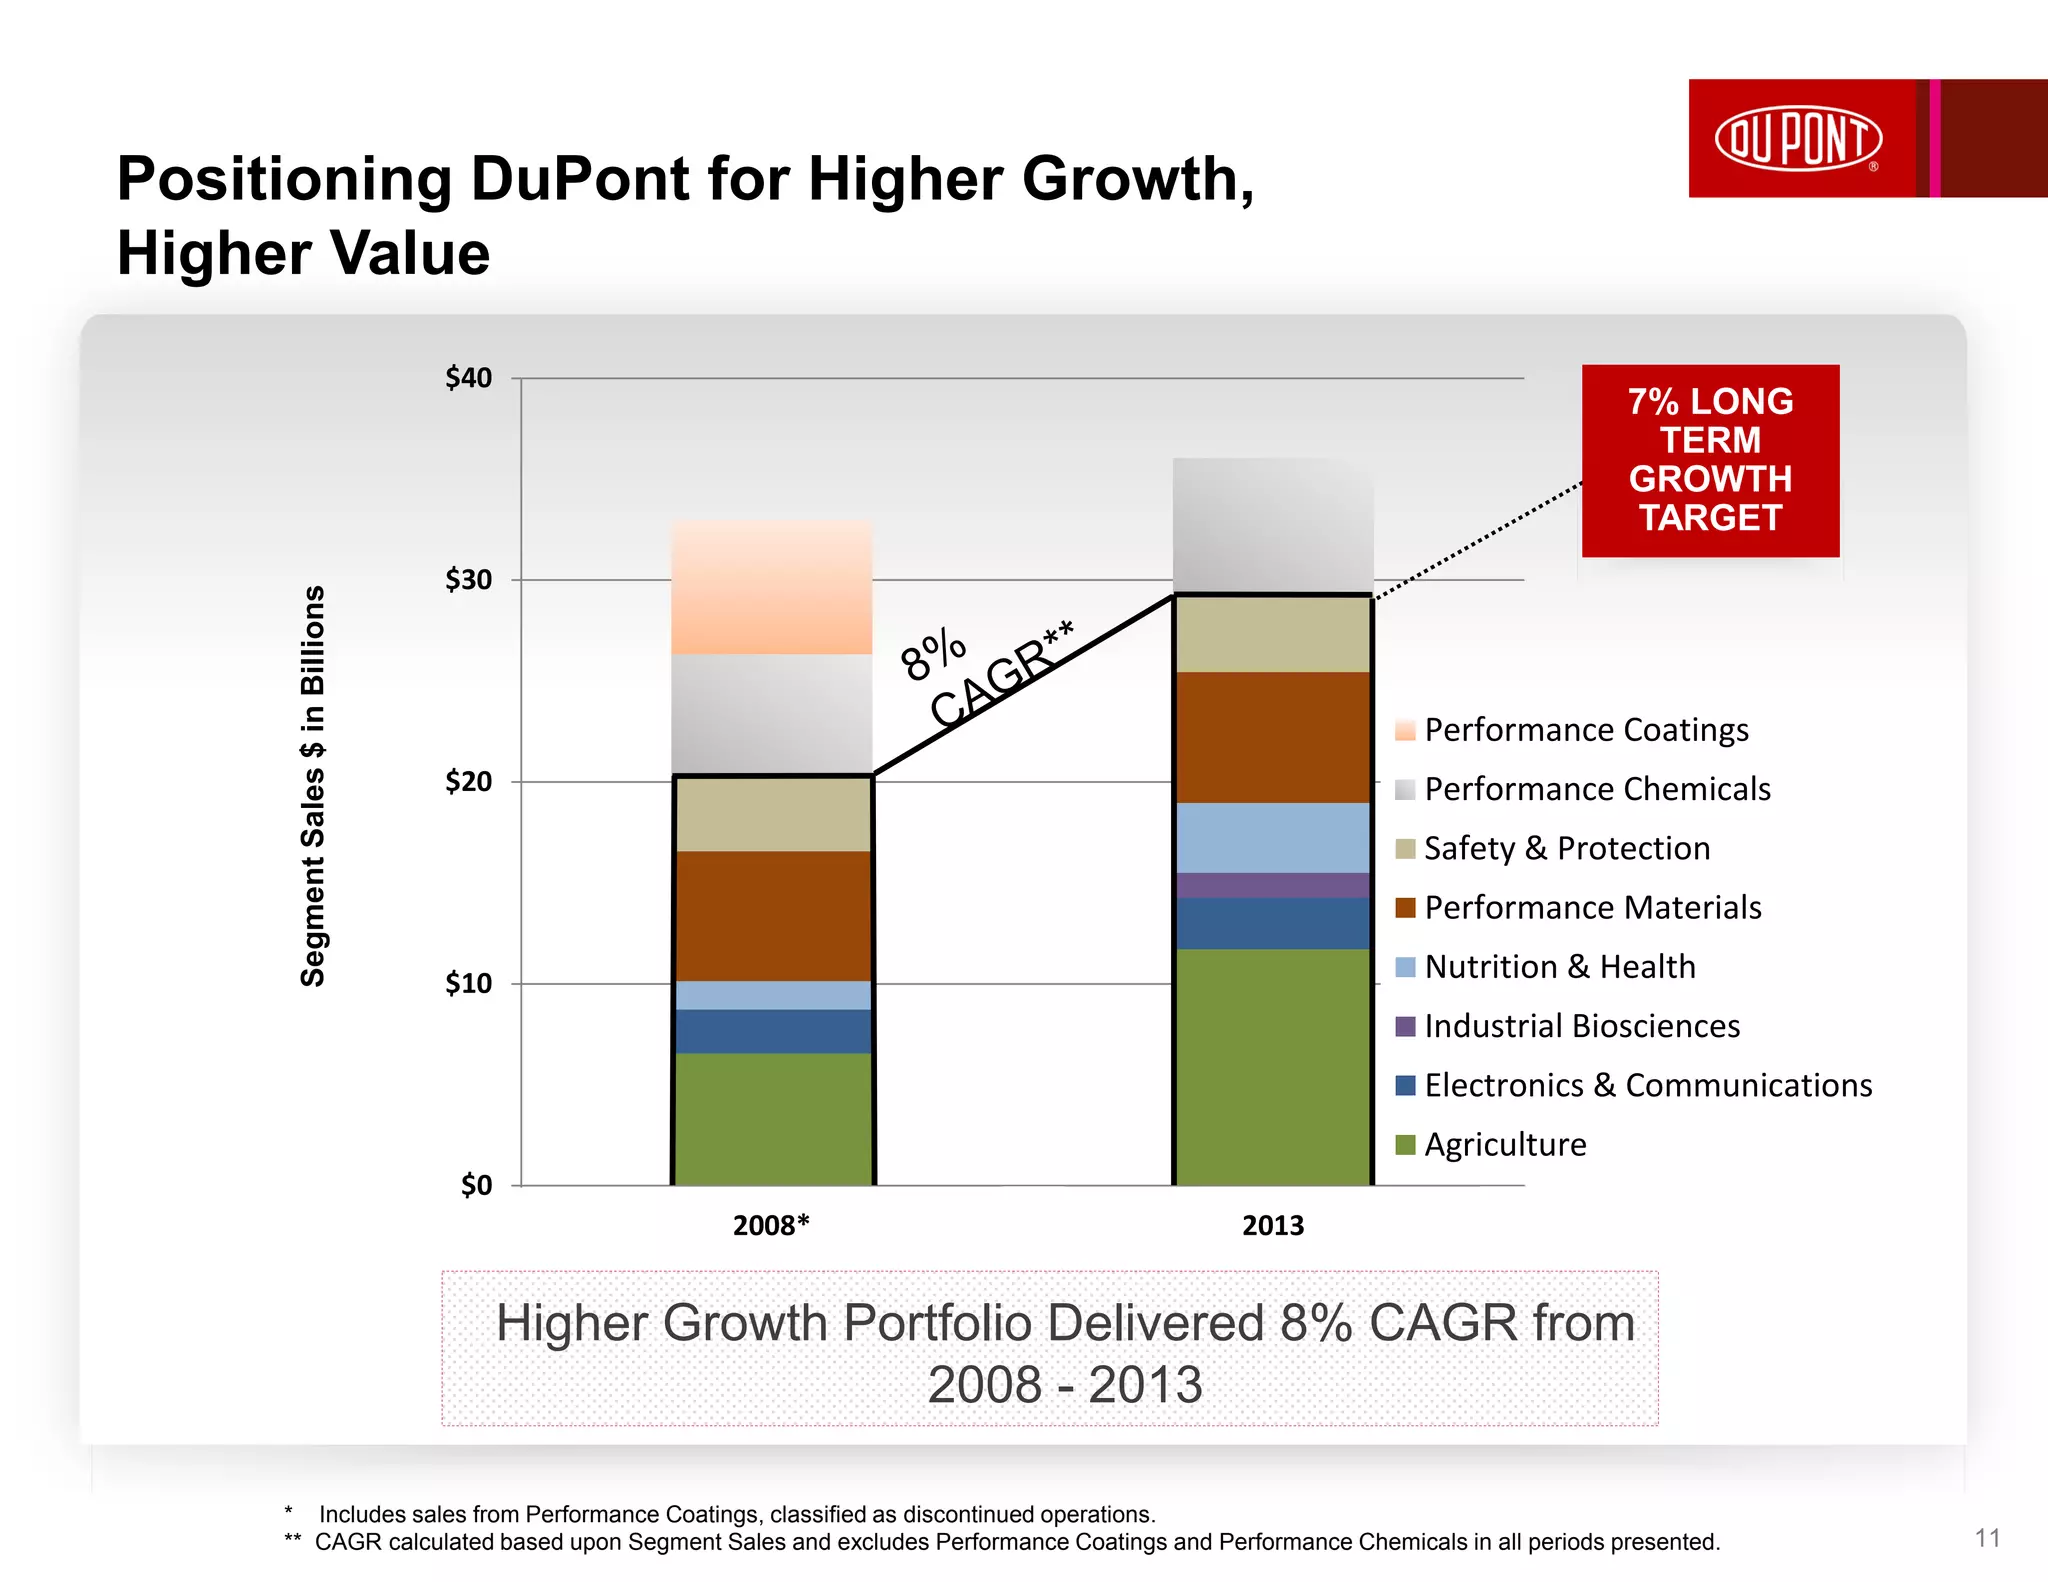
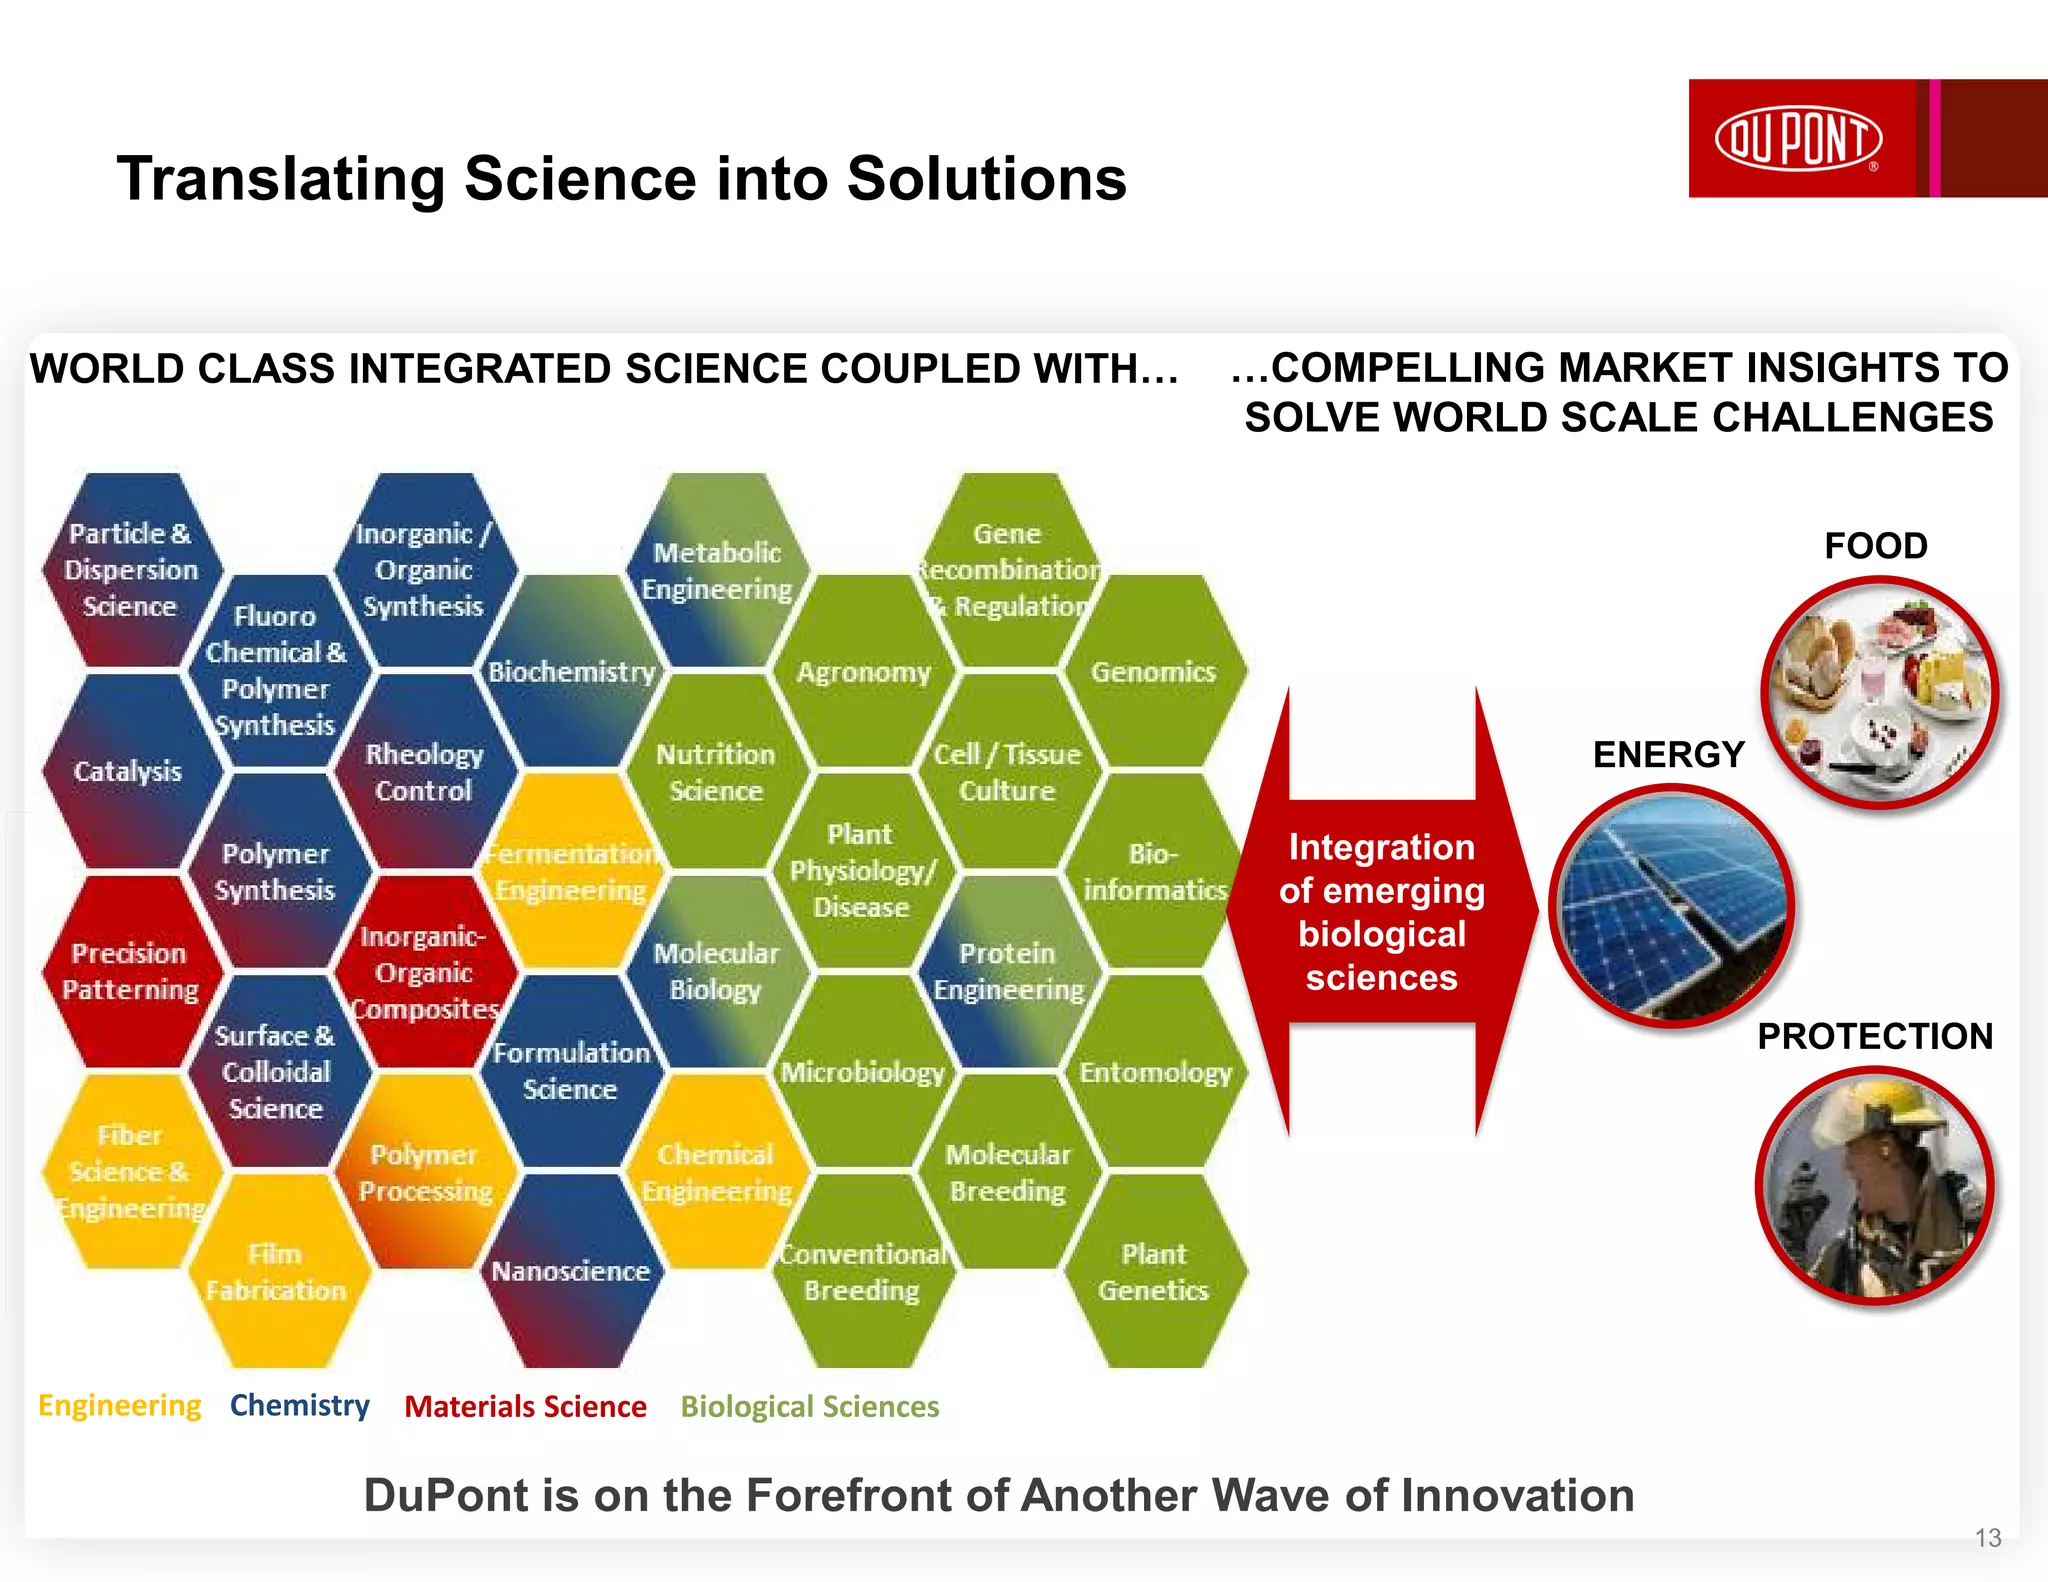
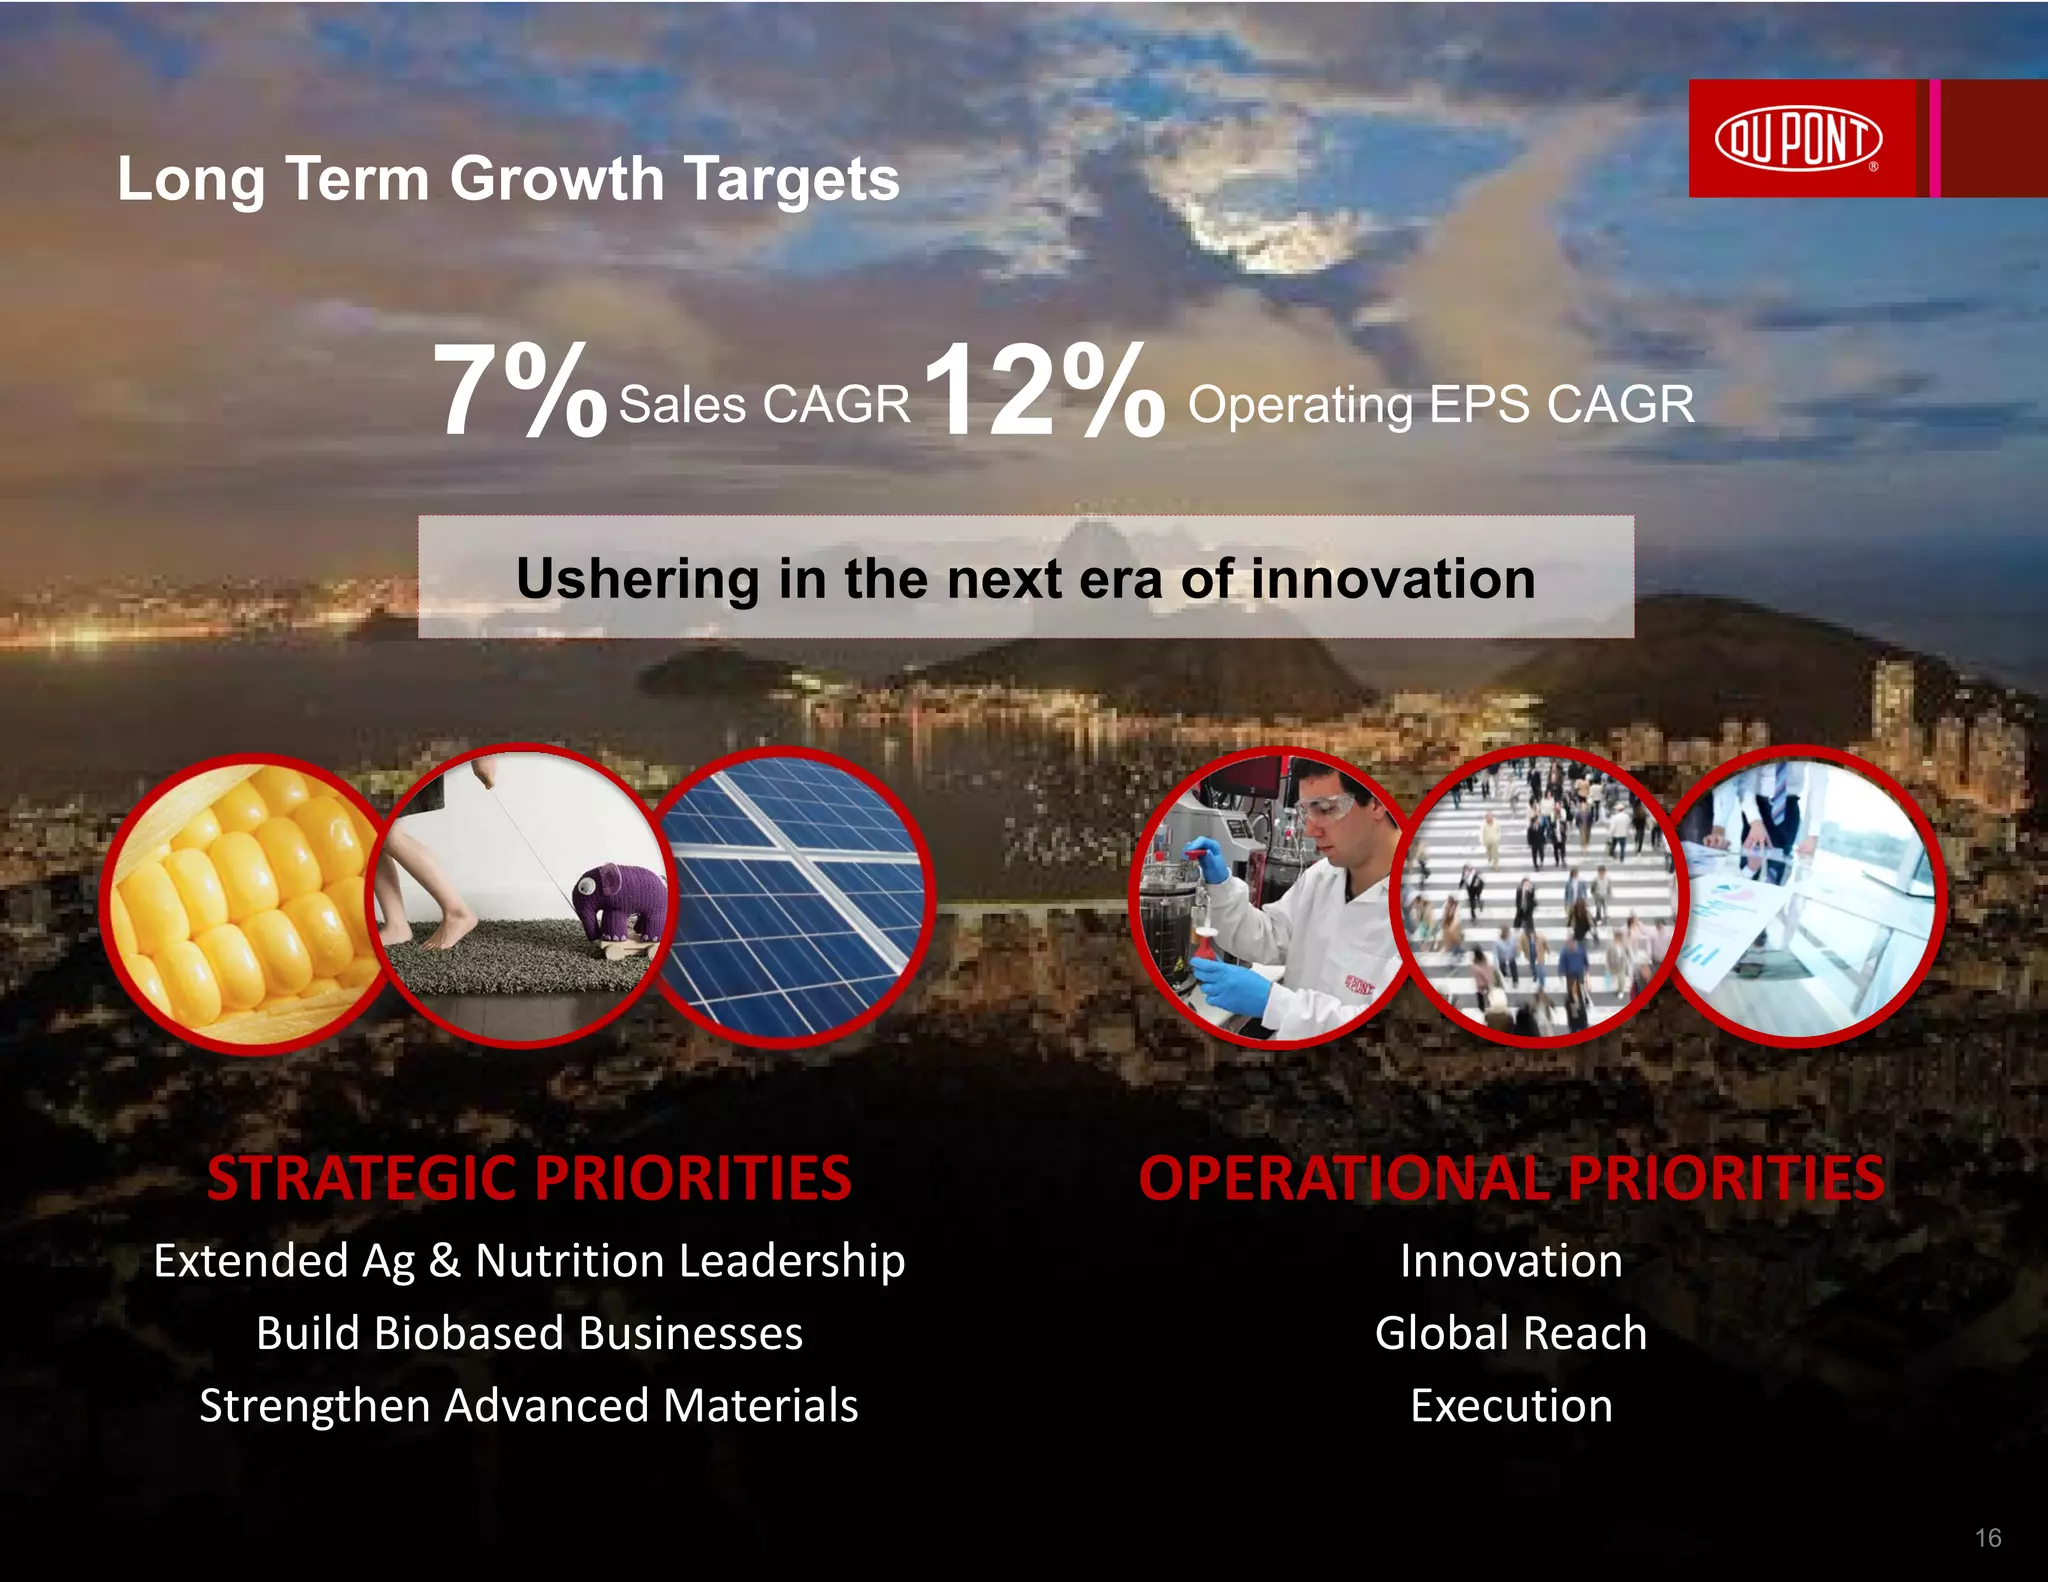
- She outlined DuPont's strategic priorities of extending leadership in agriculture and nutrition, developing biobased materials, and strengthening advanced materials to achieve 7% sales growth and 12% operating EPS growth.
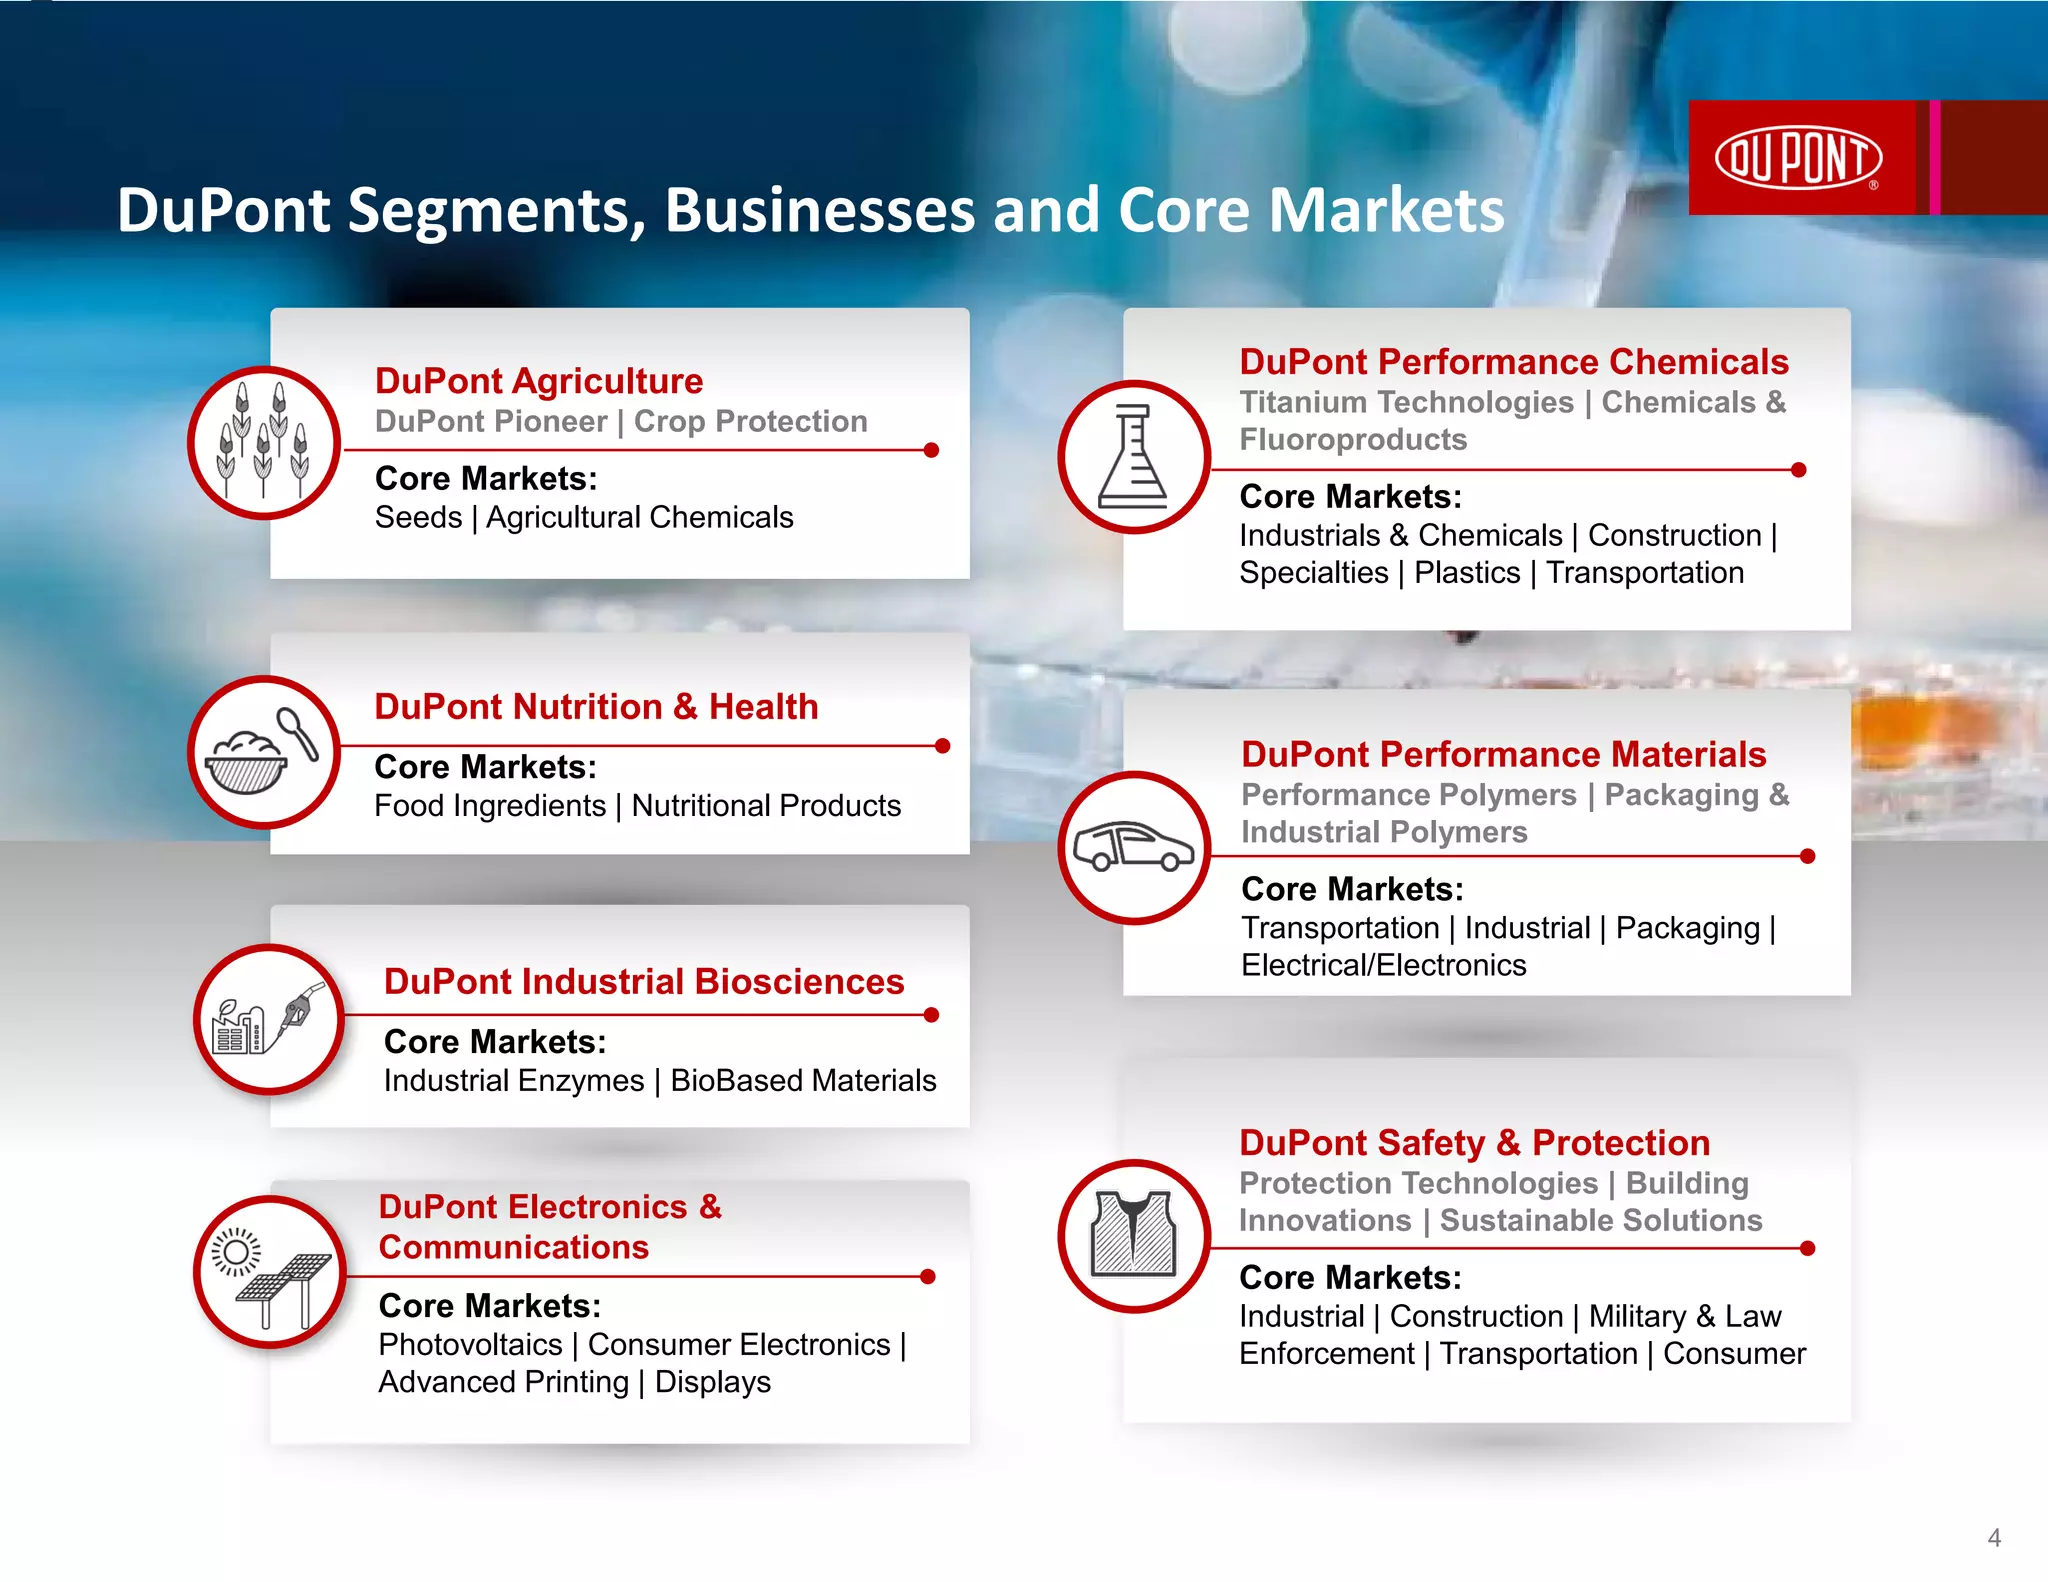
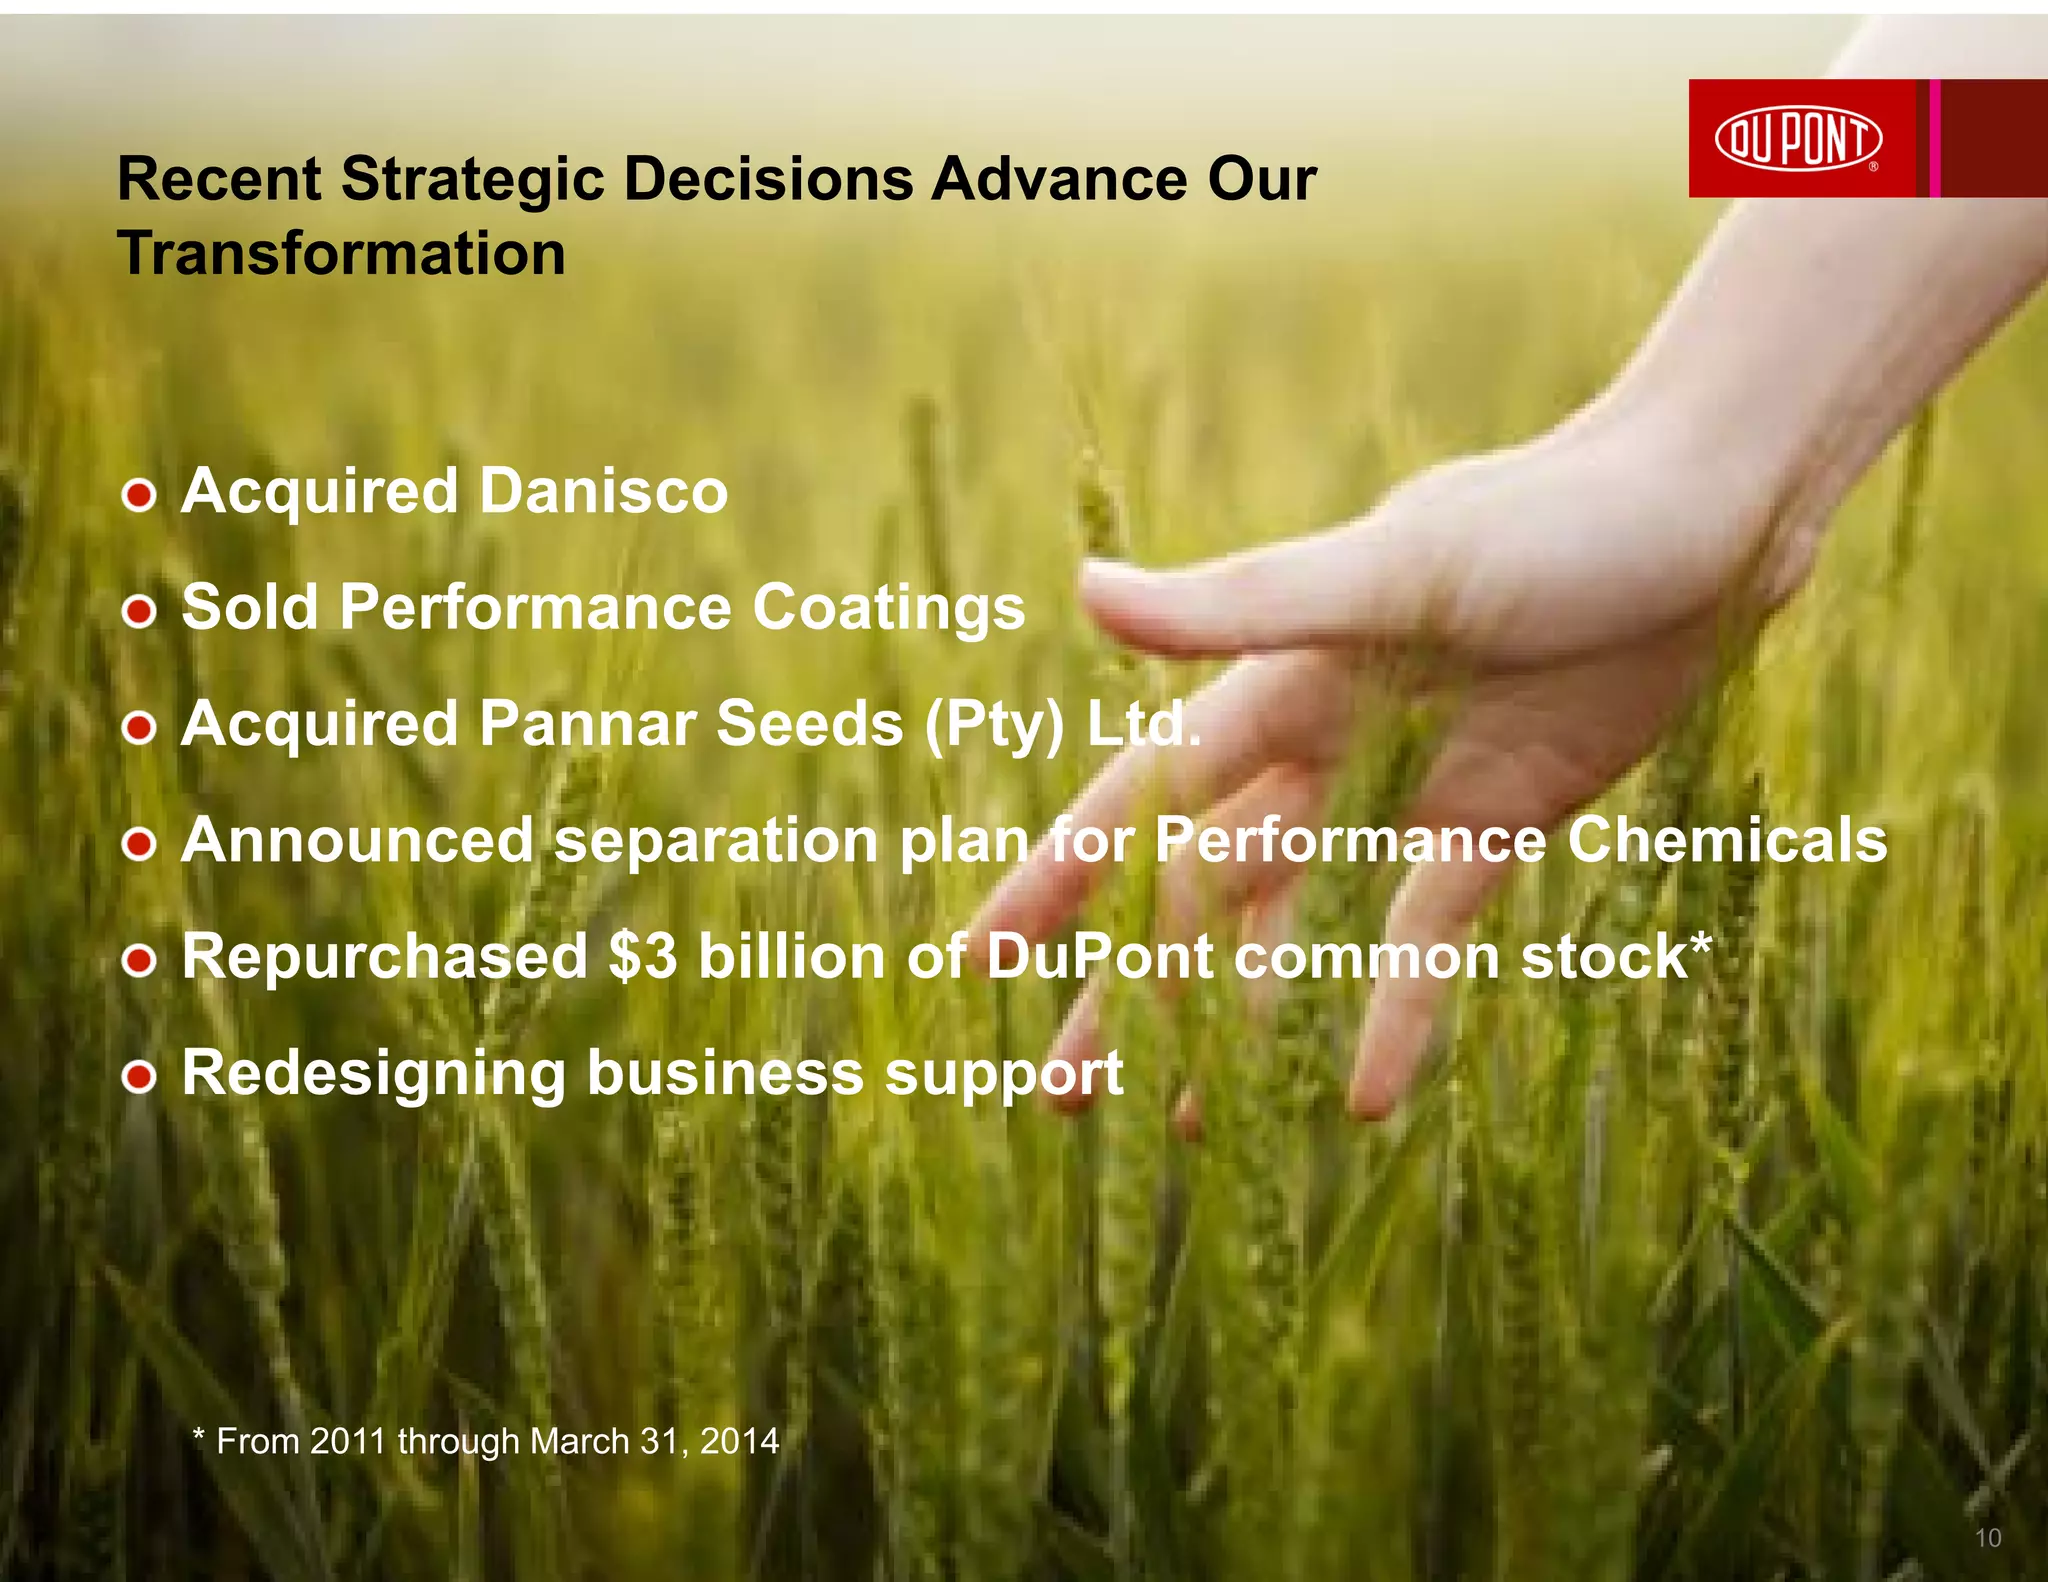
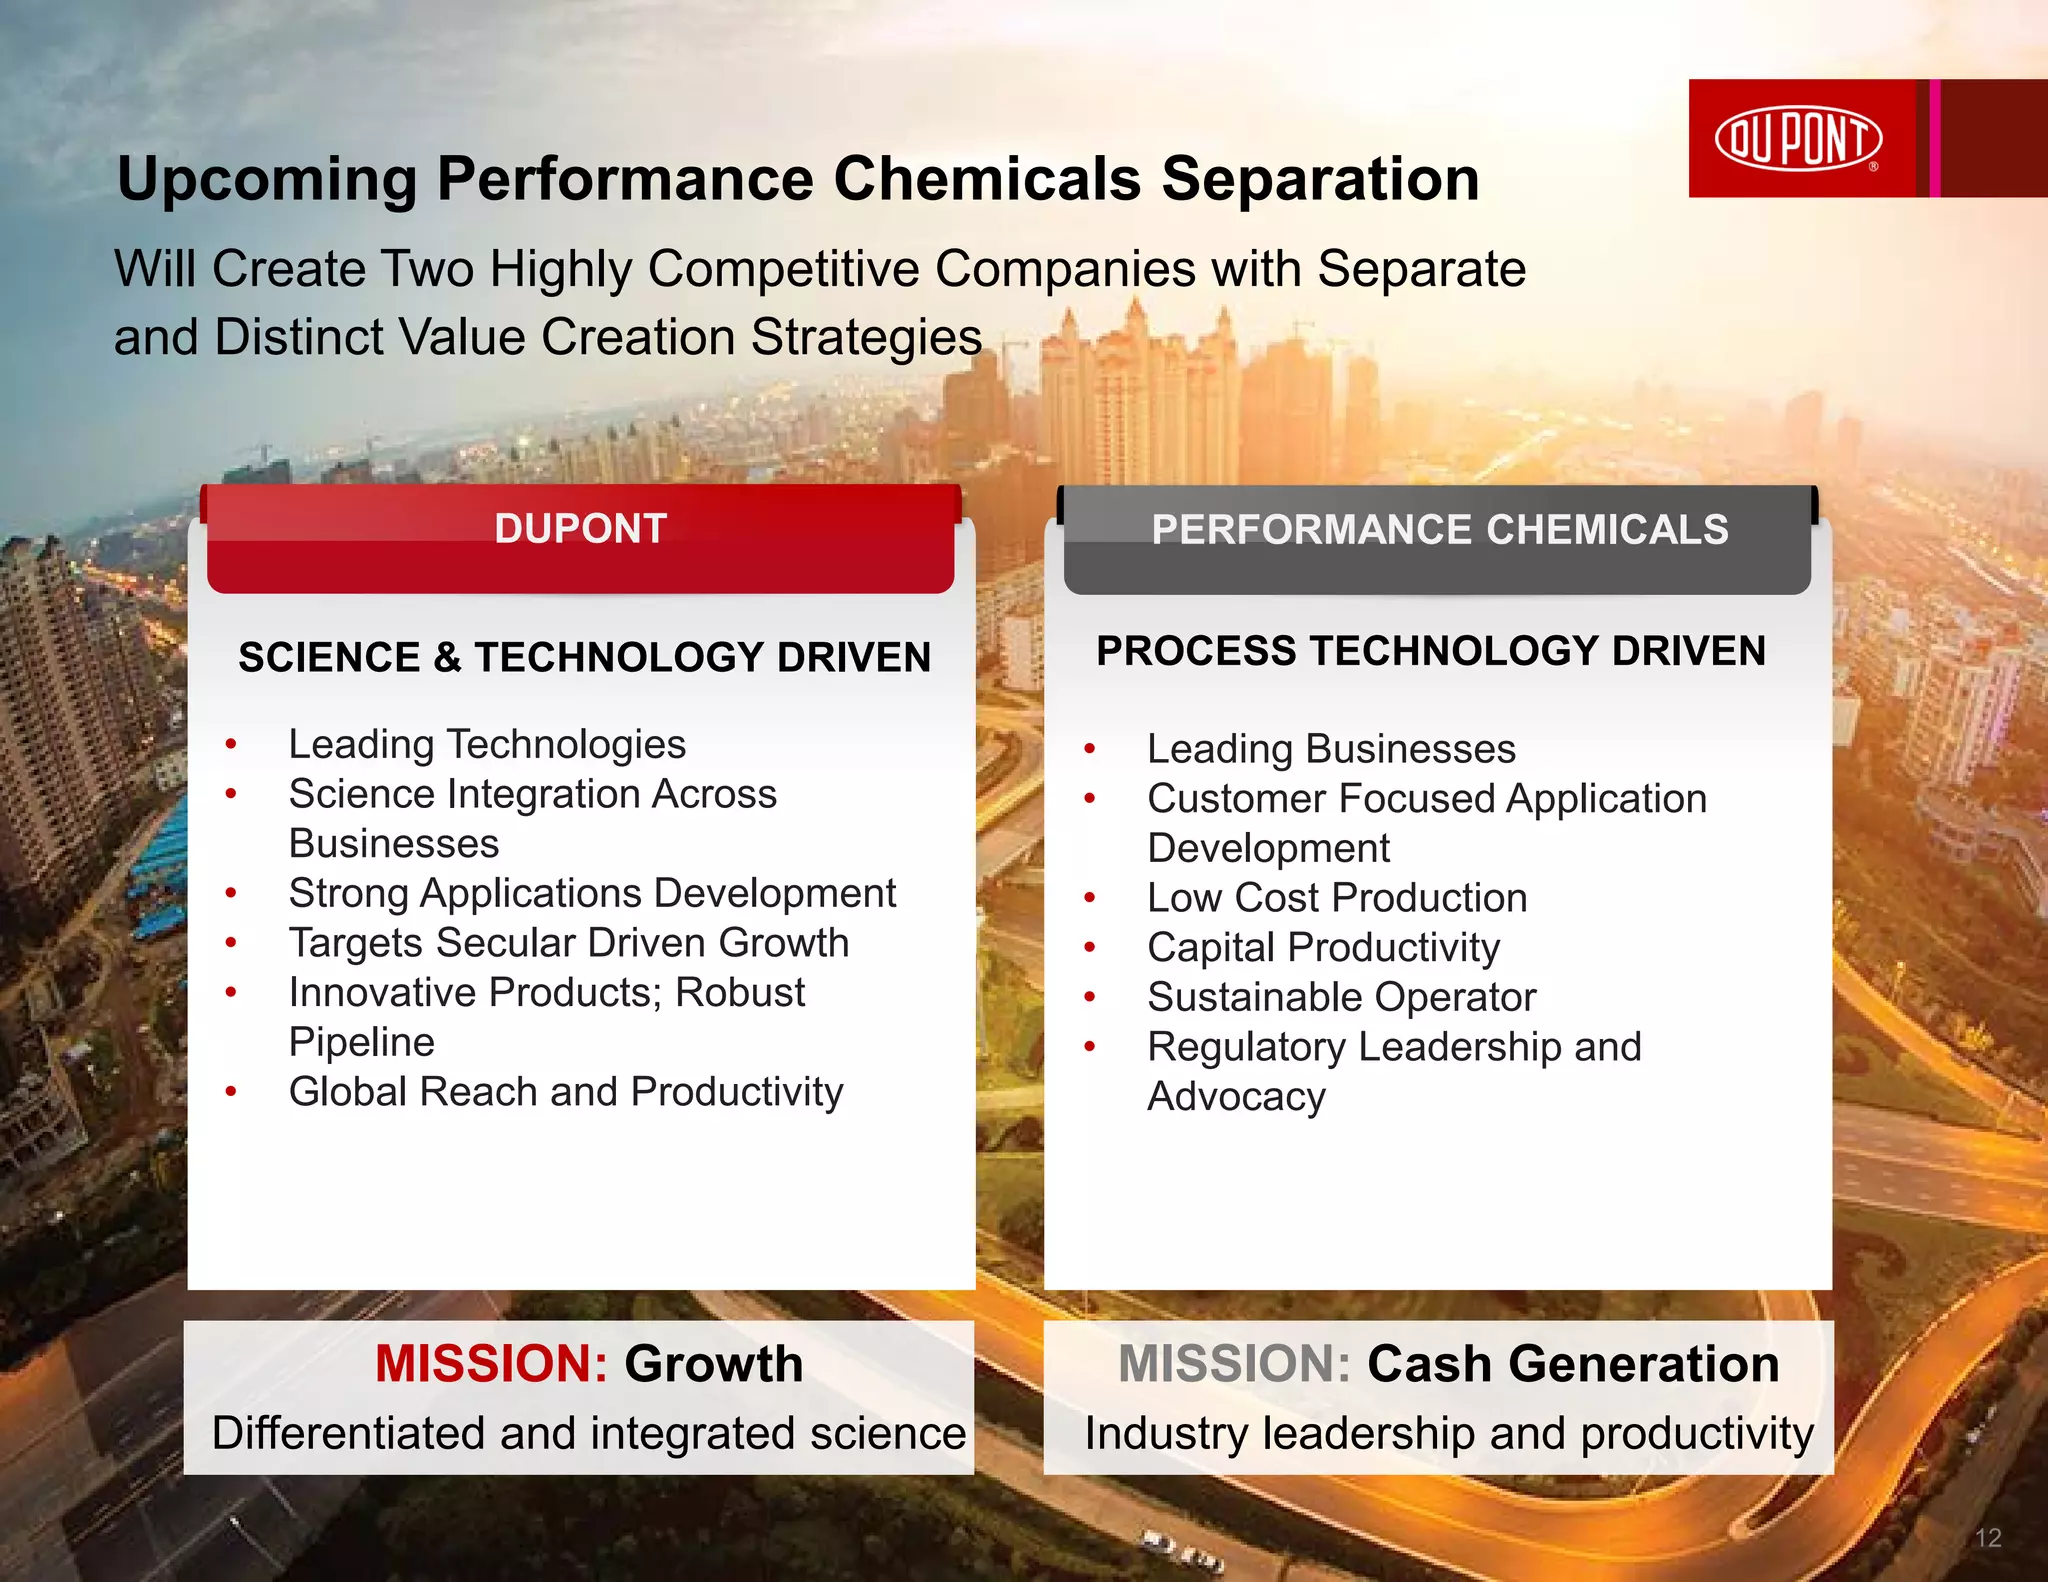
- DuPont is redesigning its business support processes and preparing to separate its Performance Chemicals segment to create two independent, focused companies pursuing different growth strategies.
An overview of Food Machinery and Chemicals Corporation (FMC)’s Managerial hi...Ayesha Majid
FMC Corporation is an American chemical manufacturing company headquartered in Philadelphia, Pennsylvania. As a global leader utilizing advanced technologies and customer-focused research and development, FMC provides innovative and cost-effective solutions to enhance crop yield and quality by controlling a broad spectrum of insects, weeds and disease, as well as in non-agricultural markets for pest control.
Latest presentation on Henkel Adhesive Technologies solution for Electronics & Semiconductor industry. how to improve efficiency and effectiveness in production
Principles of Hospitality Management
An detailed overview about Unilever
If you would like to download these slides, send me via: nguyenpuyen91@gmail.com with your purpose of download.
A compilation of presentations made at the August 17, 2011 opening of the DuPont Thailand Innovation Center. Included is information on DuPont in the ASEAN region and Thailand, as well as photos of the Innovation Center. Photos start on slide 20.
Project of EMBA 2K14 Class (NUST Business Project)
Scope of project was to identify B2B customers of Exxon Mobil in Pakistan , explore segments withing B2B customers portfolio , study and prioritization of sales channel and CRM strategies across different segments.
Group Members
Shiraz Abbasi
Mohsin Khan
Ali Raza Anjum
Mutahir Javed
Raphae Fahim
Ahsan Iqbal
EMBA 2K14 NBS
Exxon Mobil Investor Presentation Deck 2017 MayOILWIRE
Long-term view of supply and demand informs investment plans based on Energy Outlook
- Non-OECD nations drive growth in GDP and energy demand
- Middle class more than doubling to reach almost 5 billion people
- Non-OECD energy use per person remains well below OECD
- Efficiency gains keep OECD demand flat
- Without efficiency gains, global demand growth could be four times projected amount
Market Insights from Top Researchers, Part 2: Market Conditions, Incentives, ...Sustainable Brands
In this data-rich session, top-notch researchers will share their latest observations around the state of play of corporate sustainability within the broader economy, focusing on appetizing new market conditions, incentives, ROI studies and risk management opportunities. Each presentation will be followed by Q&A allowing attendees to glean additional insight on the spot and identify knowledge gaps by discussing the landscape of available data. Expect a wealth of hard information, accompanied by a great opportunity for Q&A with researchers and peers to help inform your strategy for 2014 and beyond.
We have heard about “the global economy” and the impact on a global scale of decisions made centrally and “globalization” using global methods locally. Both of these terms use the word “global” in the sense of taking something from a central location or headquarters facility and rolling it out globally. But what about taking local best practices and leveraging them to customers and clients globally? In this workshop, we will look at how best practices can emerge locally but are often ignored in a global perspective due to their local origin. Many of these best practices are developed “below the radar” and work very well for a local market; however small changes or adaptations could make them of global significance. We will examine cases of local best practices and they were promoted to improve business performance globally. We will also look at things that can go wrong if this is not done correctly and finally, we will highlight ways that a company can discover and apply these practices.
Strategy Summit: Rob Kirschbaum - DSM’s journey from mining to sciencesEngage // Innovate
Strategy summit is our annual strategy & innovation conference where we combine some of the world’s leading thinkers in the field, with break-out workshop sessions.
We’ve looked worldwide for the best cases, the best research and the most incredible examples of leading strategic transformations. It’s a leadership skill few boards and CEO’s master. It’s a leadership skill that will become increasingly important over the coming decades. It’s the theme and focus of the 2nd annual Strategy Summit: Learning to lead strategic transformation.
How a company of 25.000 employees have gone through five waves of transformation, from mining and petrochemicals to advanced Sciences. Rob Kirschbaum has led innovation work at DSM since 2000. He will share his insights into building the innovation engine for longterm transformation.
Rob Kirschbaum
Former VP Open Innovation at Royal DSM
The E P&L is a pioneering tool to help businesses manage their relationship with the natural environment. All businesses rely on natural capital to deliver their products and services. However, as a result of their activities, businesses also impact the environment through their use of land and natural resources and their emissions to air, discharges to water and waste.
Kering developed the E P&L to help measure and understand its impact on natural capital across its supply chain, from raw materials to the delivery of products to customers.
Similar to Dupont Slides Sanford Bernstein final 5 27-14 (20)
1. SANFORD C. BERNSTEIN’S 30TH ANNUAL
STRATEGIC DECISIONS CONFERENCE
MAY 28, 2014
Ellen J. Kullman, Chair of the Board and CEO
E. I. du Pont de Nemours and Company
2. Regulation G
During this presentation we may reference company information that does not conform to generally accepted
accounting principles (GAAP). Management believes that an analysis of this data is meaningful to investors
because it provides insight with respect to ongoing operating results of the company and allows investors to
better evaluate the financial results of the company. These measures should not be viewed as an alternative
to GAAP measures of performance. Furthermore, these measures may not be consistent with similar
measures provided by other companies. This data should be read in conjunction with previously published
company reports on Forms 10-K, 10-Q, and 8-K. These reports, along with reconciliations on non-GAAP
measures to GAAP are available on the Investor Center of www.dupont.com under Key Financials & Filings.
Forward Looking Statements
During the course of this presentation we may make forward-looking statements or provide forward-looking
information. All statements that address expectations or projections about the future are forward-looking
statements. Some of these statements include words such as “plans,” “expects,” “will,” “anticipates,”
"believes," “intends,” and “estimates.” Although they reflect our current expectations, these statements are not
guarantees of future performance, but involve a number of risks, uncertainties, and assumptions. Some of
those risk factors include: fluctuations in energy and raw material prices; failure to develop and market new
products and optimally manage product life cycles; global economic and capital markets conditions; litigation
and environmental matters; changes in laws and regulations or political conditions; business or supply
disruptions; inability to protect and enforce the company’s intellectual property rights; successful integration
of acquired business and divestitures of underperforming or non-strategic assets; and successful completion
of the proposed spinoff of the Performance Chemicals segment including ability to fully realize the expected
benefits of the proposed spinoff. The company does not undertake to update any forward-looking statements
as a result of future developments or new information.
Developing Markets
Total developing markets is comprised of Developing Asia, Developing Europe, Middle East & Africa, and
Latin America. A detailed list of all developing countries is available under Key Financials and Filings on the
Investor Center website at www.dupont.com.
2
6. DuPont Stock Performance
Graph assumes that DuPont common stock, the S&P 500 stock index, and the Dow Jones Industrial
Average were each valued at $100 on December 31, 2008, and that all dividends were reinvested.
$100
$150
$200
$250
$300
$350
2008 2009 2010 2011 2012 2013
DuPont S&P 500 Index Dow Jones Industrial Average
(Versus S&P 500 Index and Dow Jones Industrial Average)
6
7. 2013 Recognitions Reflect Our Commitments
7
National Safety Council
Robert W. Campbell
Award
FORTUNE
Magazine World’s
Most Admired
Companies
Working Mother
Magazine 100 Best
Companies
HRC Corporate
Equality Index
S&P 500 Carbon
Performance Leadership
Index (CPLI)
Carbon Disclosure
Leadership Index
(CDLI)
CDP Global 500
Carbon Performance
Leadership Index
North America
Dow Jones
Sustainability Index
(DJSI)
8. Decisions Driven by Three Strategic Priorities…
AGRICULTURE
& NUTRITION
BIOBASED
MATERIALS
ADVANCED
MATERIALS
Extend leadership across
high-value, science-driven
segments of the Ag and
food value chains.
Develop world-leading
industrial biotech
capabilities to create
new businesses.
Grow leading position
in differentiated
high-value materials.
Higher Growth, Higher Value Company
Through Three World-Leading Positions
8
10. Recent Strategic Decisions Advance Our
Transformation
Acquired Danisco
Sold Performance Coatings
Acquired Pannar Seeds (Pty) Ltd.
Announced separation plan for Performance Chemicals
Repurchased $3 billion of DuPont common stock*
Redesigning business support
10
* From 2011 through March 31, 2014
11. SegmentSales$inBillions
$0
$10
$20
$30
$40
2008* 2013
Performance Coatings
Performance Chemicals
Safety & Protection
Performance Materials
Nutrition & Health
Industrial Biosciences
Electronics & Communications
Agriculture
* Includes sales from Performance Coatings, classified as discontinued operations.
** CAGR calculated based upon Segment Sales and excludes Performance Coatings and Performance Chemicals in all periods presented.
Higher Growth Portfolio Delivered 8% CAGR from
2008 - 2013
Positioning DuPont for Higher Growth,
Higher Value
11
7% LONG
TERM
GROWTH
TARGET
12. Will Create Two Highly Competitive Companies with Separate
and Distinct Value Creation Strategies
SCIENCE & TECHNOLOGY DRIVEN
• Leading Technologies
• Science Integration Across
Businesses
• Strong Applications Development
• Targets Secular Driven Growth
• Innovative Products; Robust
Pipeline
• Global Reach and Productivity
PROCESS TECHNOLOGY DRIVEN
• Leading Businesses
• Customer Focused Application
Development
• Low Cost Production
• Capital Productivity
• Sustainable Operator
• Regulatory Leadership and
Advocacy
PERFORMANCE CHEMICALSDUPONT
MISSION: Growth
Differentiated and integrated science
MISSION: Cash Generation
Industry leadership and productivity
Upcoming Performance Chemicals Separation
12
13. …COMPELLING MARKET INSIGHTS TO
SOLVE WORLD SCALE CHALLENGES
WORLD CLASS INTEGRATED SCIENCE COUPLED WITH…
DuPont is on the Forefront of Another Wave of Innovation
Materials Science
Chemistry
Biological Sciences
Engineering
Integration
of emerging
biological
sciences
ENERGY
PROTECTION
Materials ScienceChemistry Biological SciencesEngineering
Translating Science into Solutions
FOOD
13
14. PREPARING FOR PERFORMANCE
CHEMICALS SEPARATION
• Eliminate stranded costs
• Avoid margin impact from
deleveraging Performance
Chemicals
RECASTING THE NEW DUPONT
• Benchmark business support
• Redesign end-to-end processes
• Simplify, standardize, digitize
• Step-change improvement in
productivity
TOFROM
Redesign of Business Support Underway
14
15. CAPITAL RETURNED TO SHAREHOLDERS
HAS ACCELERATED
• Two dividend increases
• $1B share repurchase with
Performance Coatings proceeds
• Announced $5B share repurchase
program January 2014. Completed
$1B in Q1; expect additional $1B in
2014.$1B
$3B
$5B
$7B
$10B
$0B
$2B
$4B
$6B
$8B
$10B
$12B
2009 2010 2011 2012 2013
CumulativeCapitalReturned
ToShareholders($B)
Cumulative Dividends Cumulative Buybacks
* Common dividends paid to shareholders
Dividends and Share Repurchase
Committed to a
Strong Balance Sheet
Rising Amount of Capital Returned to Shareholders
15
*
16. 7% 12%Sales CAGR Operating EPS CAGR
Ushering in the next era of innovation
OPERATIONAL PRIORITIES
Innovation
Global Reach
Execution
STRATEGIC PRIORITIES
Extended Ag & Nutrition Leadership
Build Biobased Businesses
Strengthen Advanced Materials
Long Term Growth Targets
16