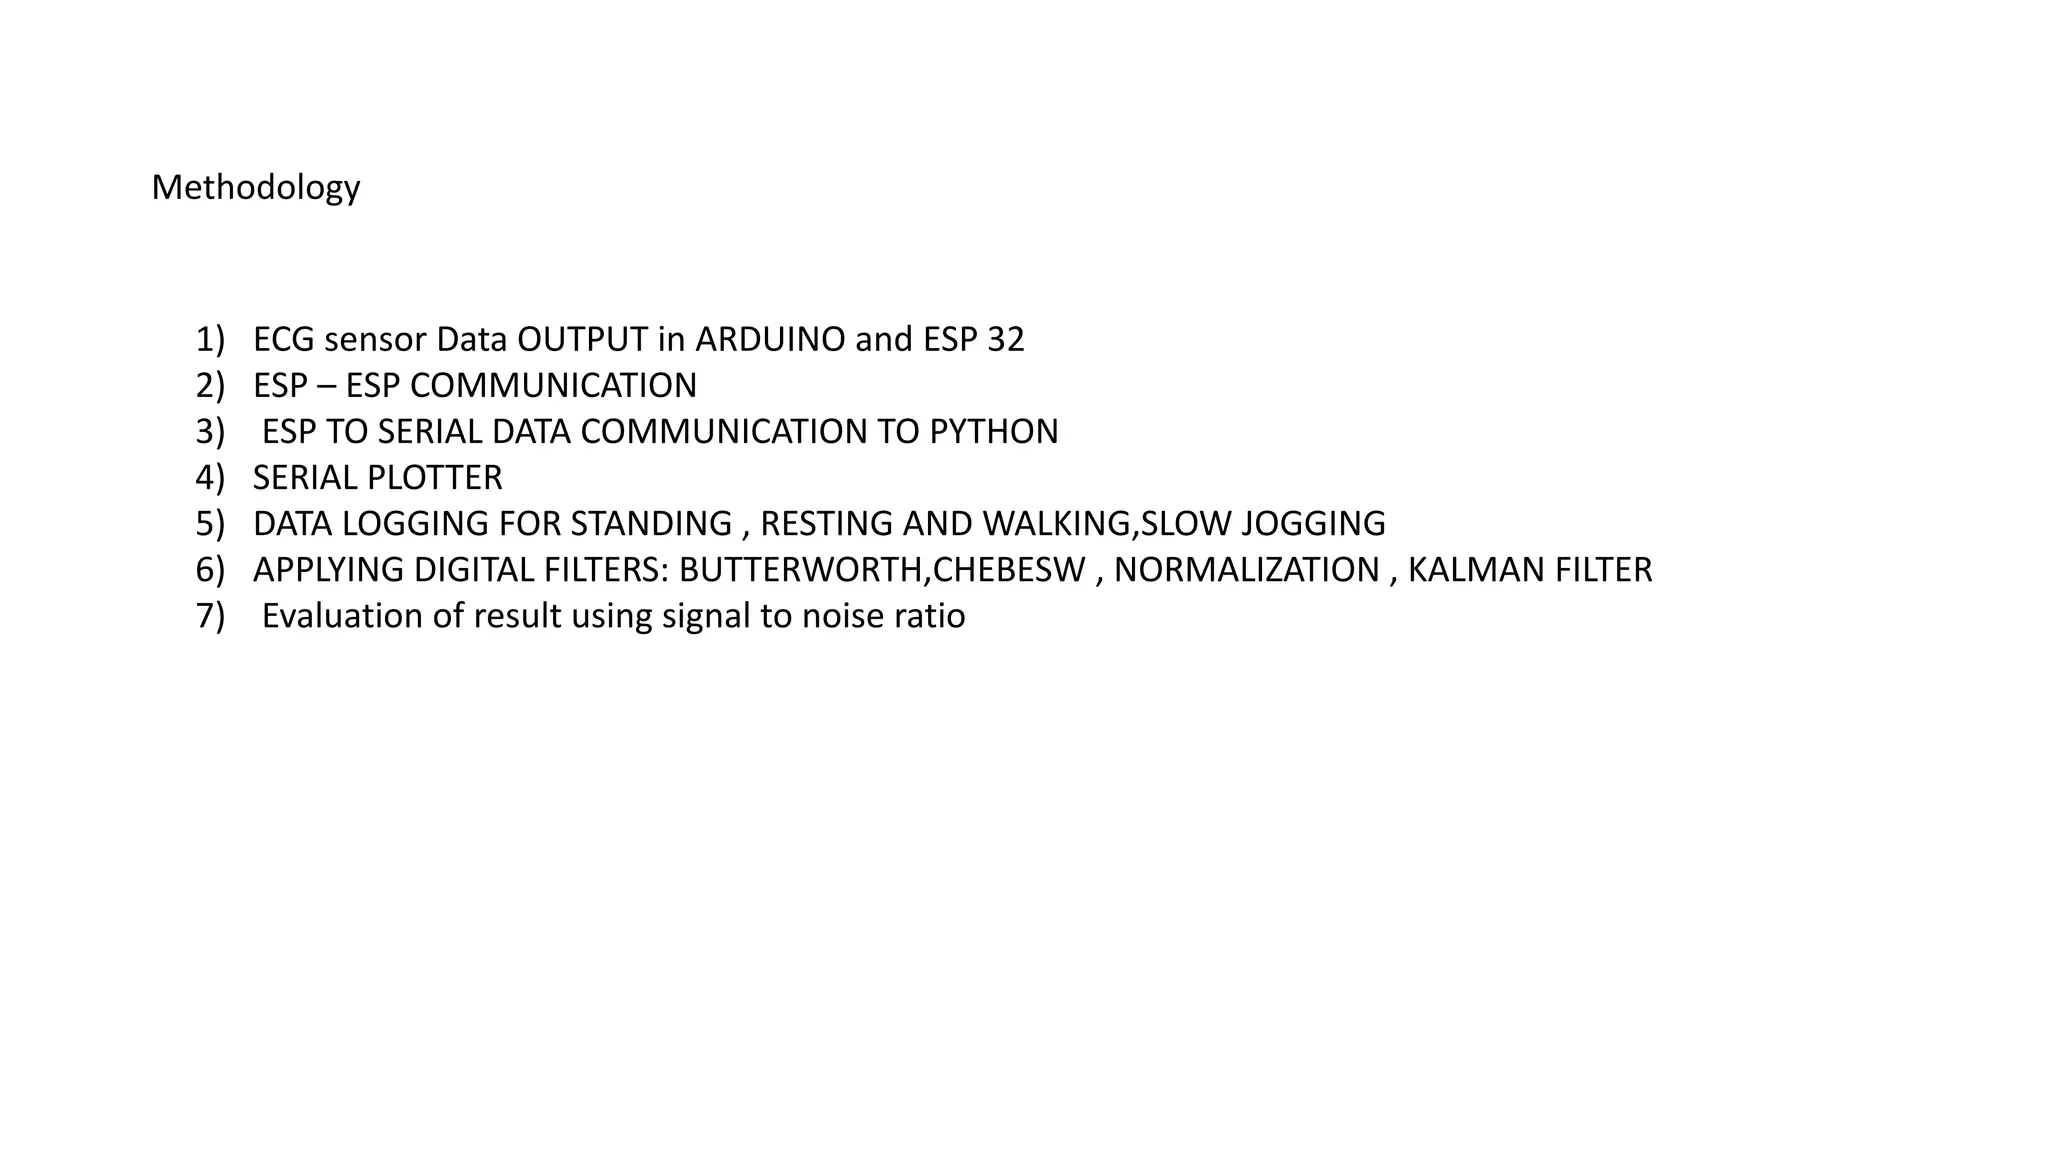
The document outlines the methodology for collecting and processing ECG sensor data wirelessly. It involves:
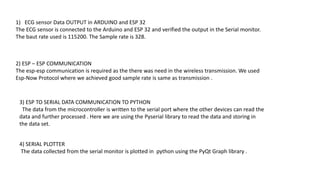
1) Collecting ECG data from sensors connected to an Arduino and ESP32 microcontroller.
2) Transmitting the data wirelessly between ESP microcontrollers using ESP-Now protocol.
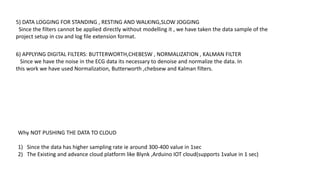
3) Sending the data over serial communication to Python for plotting, filtering, and logging the data during various activities like standing, resting, walking and slow jogging.
4) Applying digital filters like Butterworth, Chebyshev, and Kalman filters to reduce noise in the ECG signals.


![CASE_PRESENTATION_ON_subdural_hematoma(SDH)[1 FINAL PPT]-1.pptx](https://cdn.slidesharecdn.com/ss_thumbnails/casepresentationonsubduralhematomasdh1finalppt-1-260129172522-d405d375-thumbnail.jpg?width=640&height=640&fit=bounds)


