Download as PDF, PPTX


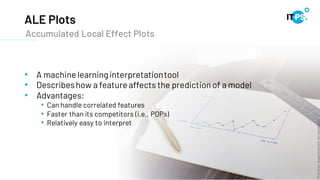
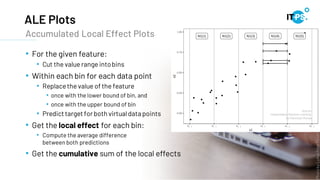
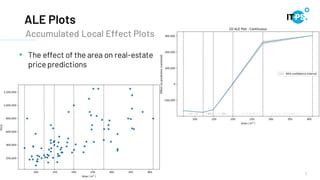


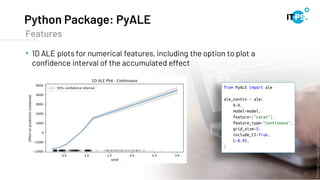
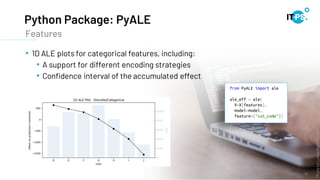
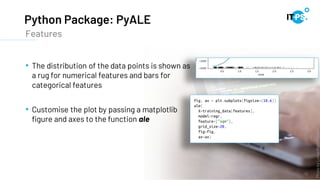
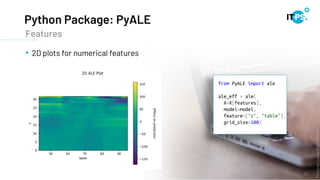


This document discusses machine learning model interpretation using accumulated local effect (ALE) plots. It describes how ALE plots can be used to visualize the effect of individual features on a model's predictions over time. As an example, the document summarizes a project that used ALE plots to analyze the effects of different COVID-19 measures in different countries. Key results included observing the average effect of measures unfolding around 10 days after implementation. The document also introduces a Python package called PyALE that can generate 1D and 2D ALE plots to aid in model interpretation.


![[DSC Europe 25] Milos Belcevic - Product Professional's Journey to Full-Stack...](https://cdn.slidesharecdn.com/ss_thumbnails/1zovd6fgsycdg4wvgvls-milos-belcevic-product-professionals-journey-to-full-stack-product-developer-260123083019-d993120d-thumbnail.jpg?width=640&height=640&fit=bounds)
![[DSC Europe 25] Josip Saban - Career building for data professionals.pptx](https://cdn.slidesharecdn.com/ss_thumbnails/zroflcttkm1vmli0txea-josip-saban-career-building-for-data-professionals-260123083019-587cdb8c-thumbnail.jpg?width=640&height=640&fit=bounds)
![[DSC Europe 25] Raul Cruz Bonilla - Harnessing GEN AI in Fashion, Luxury and ...](https://cdn.slidesharecdn.com/ss_thumbnails/me7nvup5thwqzwzblbvw-raul-cruz-harnessing-ai-en-luxury-260123083019-32ac5a43-thumbnail.jpg?width=640&height=640&fit=bounds)
![[DSC Europe 25] Predrag Maletic - Scaling AI in Banking – Our Strategic Journ...](https://cdn.slidesharecdn.com/ss_thumbnails/qu2onv0aruwlvqtygmxx-predrag-maletic-scaling-ai-in-banking-260123083019-6cf1da1d-thumbnail.jpg?width=640&height=640&fit=bounds)
![[DSC Europe 25] Ekaterina Bubenko - Behind the Curtain: How Data Roles Collab...](https://cdn.slidesharecdn.com/ss_thumbnails/anmv6x8dstqbbzchoklr-ekaterina-bubenko-behind-the-curtain-how-data-roles-collaborate-in-the-ai-era-a-260123083019-4b252ec7-thumbnail.jpg?width=640&height=640&fit=bounds)
![[DSC Europe 25] Paula Garcia Esteban -Building the Future: The Role of Data S...](https://cdn.slidesharecdn.com/ss_thumbnails/9ld1r1bsqpwve8qfvphy-paula-garcia-esteban-building-the-future-260122103838-4171f5cb-thumbnail.jpg?width=640&height=640&fit=bounds)
![[DSC Europe 25] Borko Kozomora - Optimizing business workflows with advances ...](https://cdn.slidesharecdn.com/ss_thumbnails/hbgekyb0txw0xpo4yfml-borko-kozomora-leading-ai-transformation-260122103838-cc29ee38-thumbnail.jpg?width=640&height=640&fit=bounds)
![[DSC Europe 25] Marcos Heidemann - Beyond the Hype: Making AI Coding Assistan...](https://cdn.slidesharecdn.com/ss_thumbnails/eexkhvldrjsopspdjbur-marcos-heidemann-beyond-the-hype-getting-real-value-out-of-ai-assisted-coding-260121115910-7e9d41ec-thumbnail.jpg?width=640&height=640&fit=bounds)
![[DSC Europe 25] Tamas Srancsik - How To Teach Your AI Football? An Argument f...](https://cdn.slidesharecdn.com/ss_thumbnails/bcjh1m9xtbosv20ucftb-tamas-srancsik-how-to-teach-your-ai-football-260121115910-08b53e9e-thumbnail.jpg?width=640&height=640&fit=bounds)
![[DSC Europe 25] Mikhail Rozhkov - AI Product Canvas: From Business Goals to T...](https://cdn.slidesharecdn.com/ss_thumbnails/d53doddtpgfqivmzqel6-mikhail-rozhkov-ai-product-canvas-v1-260121115910-9dd517a7-thumbnail.jpg?width=640&height=640&fit=bounds)
![[DSC Europe 25] Borivoje Kovac - GenAI reaches Trough of Disillusionment, Now...](https://cdn.slidesharecdn.com/ss_thumbnails/cc7matuqthnlzipq4t7u-borivoje-kovac-2025-11-genai-dissilusionment-now-what-260121115051-f922023b-thumbnail.jpg?width=640&height=640&fit=bounds)
![[DSC Europe 25] Georgii Perepechko - Boy Scout Rule in the Age of AI: Leaving...](https://cdn.slidesharecdn.com/ss_thumbnails/gq3wfh4gs82ykjc3odj0-georgii-perepechko-boy-scout-rule-in-the-age-of-ai-260121115051-e034183b-thumbnail.jpg?width=640&height=640&fit=bounds)
![[DSC Europe 25] Matt Quinn - Grounding AI Strategy in Business Value to avoid...](https://cdn.slidesharecdn.com/ss_thumbnails/rqtw68atrsgllyrfphsn-matt-quinn-iq-cloud-dsc-x-grounding-ai-strategy-in-business-value-260121115051-5fcf7df3-thumbnail.jpg?width=640&height=640&fit=bounds)

![[DSC Europe 25] Milos Malesevic - Designing AI-powered solutions for the futu...](https://cdn.slidesharecdn.com/ss_thumbnails/qgbg30httuc2k7eqqypo-1-milos-malesevic-designing-ai-powered-solutions-for-the-future-of-industry-260121115050-c38a5647-thumbnail.jpg?width=640&height=640&fit=bounds)
![[DSC Europe 25] Maja Belusic - Implementing Executive Reports: Turning Data i...](https://cdn.slidesharecdn.com/ss_thumbnails/1xxmgnmzs2ggkss9over-maja-belusic-implementing-executive-reports-260121115050-452d2bfb-thumbnail.jpg?width=640&height=640&fit=bounds)
![[DSC Europe 25] Milovan Jovicic - Beyond AI's Reach: The Enduring Value of Ev...](https://cdn.slidesharecdn.com/ss_thumbnails/pyeij0hurgwq5jugmtnv-2-milovan-jovicic-beyond-ais-reach-the-enduring-value-of-evergreen-design-v2-260120105856-d6ee57e5-thumbnail.jpg?width=640&height=640&fit=bounds)
![[DSC Europe 25] Bojan Djuricic - Predictive Design Process.pdf](https://cdn.slidesharecdn.com/ss_thumbnails/5awdrbedqdek3gqu2ezy-4-the-predictive-design-bojan-djuricic-260120105856-6c399e9b-thumbnail.jpg?width=640&height=640&fit=bounds)
![[DSC Europe 25] Tali Fulman - Guild Meetings, Then What? Building Data Commun...](https://cdn.slidesharecdn.com/ss_thumbnails/fgohhi33rwmhqdowdj5k-tali-fulman-guild-meetings-then-what-building-data-communities-that-actually-ch-260120105855-528492c3-thumbnail.jpg?width=640&height=640&fit=bounds)
![[DSC Europe 25] Jovan Sumarac - Real-World Applications of Computer Vision in...](https://cdn.slidesharecdn.com/ss_thumbnails/fiksms22smcpopvvld03-jovan-sumarac-real-life-applications-of-computer-vision-in-automotive-systems-260120105855-de622abb-thumbnail.jpg?width=640&height=640&fit=bounds)


