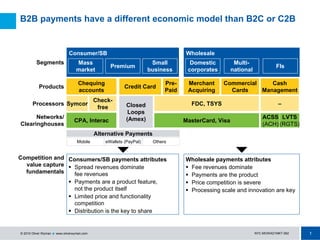
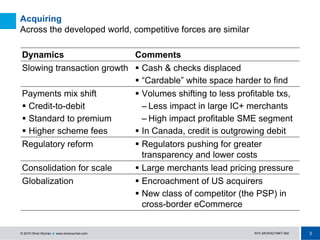
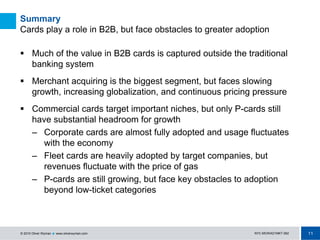
NYC-MOWAD1MKT-062
Financial Services
B2B payments: Cards
Future of Canadian Payments
November 3, 2010
CONFIDENTIAL | www.oliverwyman.com
1NYC-MOWAD1MKT-062© 2010 Oliver Wyman ! www.oliverwyman.com
B2B payments have a different economic model than B2C or C2B
Segments
Products
Processors
Networks/
Clearinghouses
Competition and
value capture
fundamentals
WholesaleConsumer/SB
Consumers/SB payments attributes
! Spread revenues dominate
fee revenues
! Payments are a product feature,
not the product itself
! Limited price and functionality
competition
! Distribution is the key to share
Wholesale payments attributes
! Fee revenues dominate
! Payments are the product
! Price competition is severe
! Processing scale and innovation are key
Alternative Payments
Mobile eWallets (PayPal) Others
Chequing
accounts
Credit Card
Cash
Management
Merchant
Acquiring
Commercial
Cards
FDC, TSYS –
MasterCard, VisaCPA, Interac
ACSS
(ACH)
Closed
Loops
(Amex) LVTS
(RGTS)
Symcor
Check-
free
Pre-
Paid
Mass
market
Premium
Small
business
Domestic
corporates
Multi-
national
FIs
2NYC-MOWAD1MKT-062© 2010 Oliver Wyman ! www.oliverwyman.com
Within North America, banks lost control over the last 30 years
2010 North American Card Payments Market
Total equity valuation: $270-$310 BN (estimated)
Total post-tax earnings: $21 BN (estimated)
Wholly bank-owned
Partially bank-owned
(e.g. equity stake)
Network switching Merchant acquiringIssuing
Processing
$56 BN equity value
9-14x P/E multiple
$70-$90 BN market cap
7-9x P/E multiple
100%
0%
20%
40%
60%
80%
100%20% 40% 60% 80%
$50-$65 BN
market cap
25-30x P/E
multiple
$80-$95 BN market cap
16-18x P/E multiple
First Data
Merchant Alliances
Note: Assumes 25% reduction from peak credit card issuing profit and no debit profits; PE multiple ranges are illustrative and drawn from publicly traded “pure plays”
3NYC-MOWAD1MKT-062© 2010 Oliver Wyman ! www.oliverwyman.com
Acquiring
Across the developed world, competitive forces are similar
Dynamics Comments
Slowing transaction growth ! Cash & checks displaced
! “Cardable” white space harder to find
Payments mix shift
! Credit-to-debit
! Standard to premium
! Higher scheme fees
! Volumes shifting to less profitable txs,
– Less impact in large IC+ merchants
– High impact profitable SME segment
! In Canada, credit is outgrowing debit
Regulatory reform ! Regulators pushing for greater
transparency and lower costs
Consolidation for scale ! Large merchants lead pricing pressure
Globalization ! Encroachment of US acquirers
! New class of competitor (the PSP) in
cross-border eCommerce
4NYC-MOWAD1MKT-062© 2010 Oliver Wyman ! www.oliverwyman.com
Acquiring
National Merchants provide scale; SME merchants generate profits
Large merchants SME
Average margin
10-15bp
(IC+)
65-70bp
(% of face value)
Credit GDV (C$ BN) $100-120 $140-160
Share of revenue 10-15% 85-90%
Canadian market bifurcation
(Similar to all other developed markets)
5NYC-MOWAD1MKT-062© 2010 Oliver Wyman ! www.oliverwyman.com
0% 5% 10% 15% 20%
First Data + alliances
Paymentech
Fifth Third + RBS
Global Payments
Elavon
Moneris
Heartland
TSYS
TD
Transfirst
All other
US Canada
North American merchant acquiring market structure
% of gross sales volume, estimated (2009)
Dominate high-
volume categories
Serve select large
merchant niches
Focus
on SME
Acquiring
Large merchants drive consolidation at the top of the market
45%
Some of the largest merchants are beginning to seek out
cross-border, North American solutions
6NYC-MOWAD1MKT-062© 2010 Oliver Wyman ! www.oliverwyman.com
Commercial Cards
Distinguished from SME by importance of MIS and absence of revolve
Corporate
Cards (T&E)
Procurement
Cards
Fleet
Cards
Small Business
Cards
Purpose Fund employee
travel
Purchase small
ticket items
Purchase gas
and repairs
Source of working
capital lending to SMEs
and to expedite
purchasing
Value
proposition
! Manage travel costs
! Fund employee travel
! Automate low-value
purchasing
! Supplier discounts
! Fraud control
! Fleet management
! Access to credit
! Automate purchasing
Unique
features
! Reporting
! No preset
spending limit
! Level three reporting
! Discount capture
! Odometer capture
! Fraud reporting
! Discount capture
! NA
Market
structure
! American Express dominates
! Some major banks issue Visa/MC
versions, but have low share
! Closed loops lead,
e.g. Wright Express,
Voyager
! Gas company
proprietary cards
! Visa/MC universal
products
! American Express
is material
! Banks are major
players
Revenue
model
! Interchange
! Fees
! Interest income
! Interchange fees
! Other fee income
7NYC-MOWAD1MKT-062© 2010 Oliver Wyman ! www.oliverwyman.com
0
50
100
150
200
250
2006 2007 2008 2009
Spendvolume($BN)
12.6
12.7
12.8
12.9
13.0
13.1
13.2
13.3
RealGDP($TN)
American Express Visa/Mastercard Real GDP ($TN)
Commercial cards – Corporate cards
Slow growth (1.5% CAGR), dominated by American Express (~80% share)
Corporate card spend
AXP share 82% 81% 85% 81%
Source: Nilson report, Bureau of Economic Analysis, Oliver Wyman analysis
Note: Assumes 90/10 split on American Express corporate card volume between T&E and procurement cards
8NYC-MOWAD1MKT-062© 2010 Oliver Wyman ! www.oliverwyman.com
0
1
2
3
4
5
2006 2007 2008 2009
Spendvolume($BN)
$0.0
$0.5
$1.0
$1.5
$2.0
$2.5
$3.0
$3.5
$4.0
$4.5
$5.0
Fleet card spend Weighted average gas price
Commercial cards – Fleet cards
Slow growth, spend fluctuates with the price of gas
Source: Nilson report, Energy Information Administration, Oliver Wyman analysis
9NYC-MOWAD1MKT-062© 2010 Oliver Wyman ! www.oliverwyman.com
75
80
85
90
95
100
105
2006 2007 2008 2009
Spendvolume($BN)
Commercial cards – Procurement cards (P-cards)
A small share of overall B2B spend; American Express is a leader
… but share is low
Source: Nilson report, The Clearing House/Federal Reserve report, Oliver Wyman analysis
Note: Assumes 90/10 split on American Express corporate card volume between T&E and procurement cards
0%
20%
40%
60%
80%
100%
Check Wire ACH Payment
card
%ofB2Btransactions
Spend is growing…
Note: this is share of
transactions, share
of spend is very low
10NYC-MOWAD1MKT-062© 2010 Oliver Wyman ! www.oliverwyman.com
P-cards cards face several obstacles to greater adoption
Obstacle Comments
Process Change
(Buyers & suppliers)
Integration to ERP systems via APIs (e.g. AXP/SAP)
Security
e.g. PCI compliance
Software as a service (SAAS) solutions
Costs
(Interchange & network fees)
1.80% + .10 for standard Level III tx
0.95-1.30% + $35-$40 for large ticket
Applicability
(Expanding internal adoption)
Increasing “cardable” spend (~40% of small
transactions on P-cards in adopting companies)
11NYC-MOWAD1MKT-062© 2010 Oliver Wyman ! www.oliverwyman.com
Summary
Cards play a role in B2B, but face obstacles to greater adoption
! Much of the value in B2B cards is captured outside the traditional
banking system
! Merchant acquiring is the biggest segment, but faces slowing
growth, increasing globalization, and continuous pricing pressure
! Commercial cards target important niches, but only P-cards still
have substantial headroom for growth
– Corporate cards are almost fully adopted and usage fluctuates
with the economy
– Fleet cards are heavily adopted by target companies, but
revenues fluctuate with the price of gas
– P-cards are still growing, but face key obstacles to adoption
beyond low-ticket categories

Andrew Dresner

  • 1.
    NYC-MOWAD1MKT-062 Financial Services B2B payments:Cards Future of Canadian Payments November 3, 2010 CONFIDENTIAL | www.oliverwyman.com
  • 2.
    1NYC-MOWAD1MKT-062© 2010 OliverWyman ! www.oliverwyman.com B2B payments have a different economic model than B2C or C2B Segments Products Processors Networks/ Clearinghouses Competition and value capture fundamentals WholesaleConsumer/SB Consumers/SB payments attributes ! Spread revenues dominate fee revenues ! Payments are a product feature, not the product itself ! Limited price and functionality competition ! Distribution is the key to share Wholesale payments attributes ! Fee revenues dominate ! Payments are the product ! Price competition is severe ! Processing scale and innovation are key Alternative Payments Mobile eWallets (PayPal) Others Chequing accounts Credit Card Cash Management Merchant Acquiring Commercial Cards FDC, TSYS – MasterCard, VisaCPA, Interac ACSS (ACH) Closed Loops (Amex) LVTS (RGTS) Symcor Check- free Pre- Paid Mass market Premium Small business Domestic corporates Multi- national FIs
  • 3.
    2NYC-MOWAD1MKT-062© 2010 OliverWyman ! www.oliverwyman.com Within North America, banks lost control over the last 30 years 2010 North American Card Payments Market Total equity valuation: $270-$310 BN (estimated) Total post-tax earnings: $21 BN (estimated) Wholly bank-owned Partially bank-owned (e.g. equity stake) Network switching Merchant acquiringIssuing Processing $56 BN equity value 9-14x P/E multiple $70-$90 BN market cap 7-9x P/E multiple 100% 0% 20% 40% 60% 80% 100%20% 40% 60% 80% $50-$65 BN market cap 25-30x P/E multiple $80-$95 BN market cap 16-18x P/E multiple First Data Merchant Alliances Note: Assumes 25% reduction from peak credit card issuing profit and no debit profits; PE multiple ranges are illustrative and drawn from publicly traded “pure plays”
  • 4.
    3NYC-MOWAD1MKT-062© 2010 OliverWyman ! www.oliverwyman.com Acquiring Across the developed world, competitive forces are similar Dynamics Comments Slowing transaction growth ! Cash & checks displaced ! “Cardable” white space harder to find Payments mix shift ! Credit-to-debit ! Standard to premium ! Higher scheme fees ! Volumes shifting to less profitable txs, – Less impact in large IC+ merchants – High impact profitable SME segment ! In Canada, credit is outgrowing debit Regulatory reform ! Regulators pushing for greater transparency and lower costs Consolidation for scale ! Large merchants lead pricing pressure Globalization ! Encroachment of US acquirers ! New class of competitor (the PSP) in cross-border eCommerce
  • 5.
    4NYC-MOWAD1MKT-062© 2010 OliverWyman ! www.oliverwyman.com Acquiring National Merchants provide scale; SME merchants generate profits Large merchants SME Average margin 10-15bp (IC+) 65-70bp (% of face value) Credit GDV (C$ BN) $100-120 $140-160 Share of revenue 10-15% 85-90% Canadian market bifurcation (Similar to all other developed markets)
  • 6.
    5NYC-MOWAD1MKT-062© 2010 OliverWyman ! www.oliverwyman.com 0% 5% 10% 15% 20% First Data + alliances Paymentech Fifth Third + RBS Global Payments Elavon Moneris Heartland TSYS TD Transfirst All other US Canada North American merchant acquiring market structure % of gross sales volume, estimated (2009) Dominate high- volume categories Serve select large merchant niches Focus on SME Acquiring Large merchants drive consolidation at the top of the market 45% Some of the largest merchants are beginning to seek out cross-border, North American solutions
  • 7.
    6NYC-MOWAD1MKT-062© 2010 OliverWyman ! www.oliverwyman.com Commercial Cards Distinguished from SME by importance of MIS and absence of revolve Corporate Cards (T&E) Procurement Cards Fleet Cards Small Business Cards Purpose Fund employee travel Purchase small ticket items Purchase gas and repairs Source of working capital lending to SMEs and to expedite purchasing Value proposition ! Manage travel costs ! Fund employee travel ! Automate low-value purchasing ! Supplier discounts ! Supplier discounts ! Fraud control ! Fleet management ! Access to credit ! Automate purchasing Unique features ! Reporting ! No preset spending limit ! Level three reporting ! Discount capture ! Odometer capture ! Fraud reporting ! Discount capture ! NA Market structure ! American Express dominates ! Some major banks issue Visa/MC versions, but have low share ! Closed loops lead, e.g. Wright Express, Voyager ! Gas company proprietary cards ! Visa/MC universal products ! American Express is material ! Banks are major players Revenue model ! Interchange ! Fees ! Interest income ! Interchange fees ! Other fee income
  • 8.
    7NYC-MOWAD1MKT-062© 2010 OliverWyman ! www.oliverwyman.com 0 50 100 150 200 250 2006 2007 2008 2009 Spendvolume($BN) 12.6 12.7 12.8 12.9 13.0 13.1 13.2 13.3 RealGDP($TN) American Express Visa/Mastercard Real GDP ($TN) Commercial cards – Corporate cards Slow growth (1.5% CAGR), dominated by American Express (~80% share) Corporate card spend AXP share 82% 81% 85% 81% Source: Nilson report, Bureau of Economic Analysis, Oliver Wyman analysis Note: Assumes 90/10 split on American Express corporate card volume between T&E and procurement cards
  • 9.
    8NYC-MOWAD1MKT-062© 2010 OliverWyman ! www.oliverwyman.com 0 1 2 3 4 5 2006 2007 2008 2009 Spendvolume($BN) $0.0 $0.5 $1.0 $1.5 $2.0 $2.5 $3.0 $3.5 $4.0 $4.5 $5.0 Fleet card spend Weighted average gas price Commercial cards – Fleet cards Slow growth, spend fluctuates with the price of gas Source: Nilson report, Energy Information Administration, Oliver Wyman analysis
  • 10.
    9NYC-MOWAD1MKT-062© 2010 OliverWyman ! www.oliverwyman.com 75 80 85 90 95 100 105 2006 2007 2008 2009 Spendvolume($BN) Commercial cards – Procurement cards (P-cards) A small share of overall B2B spend; American Express is a leader … but share is low Source: Nilson report, The Clearing House/Federal Reserve report, Oliver Wyman analysis Note: Assumes 90/10 split on American Express corporate card volume between T&E and procurement cards 0% 20% 40% 60% 80% 100% Check Wire ACH Payment card %ofB2Btransactions Spend is growing… Note: this is share of transactions, share of spend is very low
  • 11.
    10NYC-MOWAD1MKT-062© 2010 OliverWyman ! www.oliverwyman.com P-cards cards face several obstacles to greater adoption Obstacle Comments Process Change (Buyers & suppliers) Integration to ERP systems via APIs (e.g. AXP/SAP) Security e.g. PCI compliance Software as a service (SAAS) solutions Costs (Interchange & network fees) 1.80% + .10 for standard Level III tx 0.95-1.30% + $35-$40 for large ticket Applicability (Expanding internal adoption) Increasing “cardable” spend (~40% of small transactions on P-cards in adopting companies)
  • 12.
    11NYC-MOWAD1MKT-062© 2010 OliverWyman ! www.oliverwyman.com Summary Cards play a role in B2B, but face obstacles to greater adoption ! Much of the value in B2B cards is captured outside the traditional banking system ! Merchant acquiring is the biggest segment, but faces slowing growth, increasing globalization, and continuous pricing pressure ! Commercial cards target important niches, but only P-cards still have substantial headroom for growth – Corporate cards are almost fully adopted and usage fluctuates with the economy – Fleet cards are heavily adopted by target companies, but revenues fluctuate with the price of gas – P-cards are still growing, but face key obstacles to adoption beyond low-ticket categories