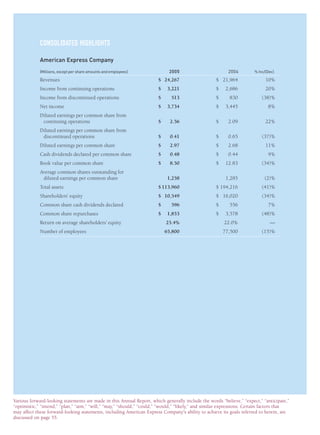
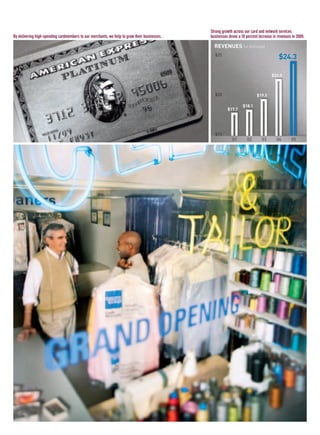
American Express Company reported strong financial results for 2005. Revenues increased 10% to $24.3 billion and income from continuing operations rose 20% to $3.2 billion. Diluted earnings per share from continuing operations grew 22% to $2.56. The spin-off of Ameriprise Financial in September 2005 sharpened the company's focus on its payments and network services businesses. Spending on American Express cards reached a record $484 billion in 2005, up 16% from 2004, driven by higher spending per cardmember and an increase in new cards. The company is well positioned for continued growth with opportunities in expanding its merchant network and increasing its share of the global payments industry.


![We set the tone for 2005 early in the year. In February, we announced our plans to spin off American Express
Financial Advisors as a dividend to shareholders. We successfully completed the spin-off of the renamed
Ameriprise Financial on September 30. This change sharpened our focus on our high-growth, high-return
payments and network services businesses and placed us in a better position to capitalize on a broad range
of growth opportunities.
Our financial performance showed the strength and potential of the businesses that comprise the new American
Express. We achieved record earnings while continuing to substantially increase our investments in future
growth. For the year:
■ income from continuing operations rose 20 percent to $3.2 billion
■ diluted earnings per share from continuing operations rose 22 percent to $2.56
■ revenues rose 10 percent to $24.3 billion
■ pro forma return on equity from continuing operations (excluding Ameriprise) was 31 percent
These results exceeded our long-term targets of 12-to-15 percent earnings per share growth, 8 percent rev-
enue growth, and return on equity of 28-to-30 percent, on average and over time. During the year, we raised
our return on equity target from 18-to-20 percent to the current level to reflect the company’s higher return
potential following the spin-off.
Net income for 2005 rose 8 percent to a record $3.7 billion, while diluted earnings per share increased 11
percent to $2.97. Reported return on equity was 25 percent, up from 22 percent a year ago. These results
include earnings from Ameriprise, which is now no longer a part of our company. For this reason, we believe
looking at income from continuing operations — or those businesses that remain with American Express —
provides a clearer view of our ongoing performance.
INDUSTRY-LEADING CARD GROWTH
Strong growth across our consumer, small business, commercial and network card businesses in the United
States and around the world drove our earnings results.
Worldwide spending on American Express cards rose more than 16 percent to a record $484 billion. No other
major card issuer grew at a faster rate. As a result, we believe we gained share of spending on general purpose
cards in the United States and many of our key international markets.
This growth came from two sources — higher spending per card and more new cardmembers attracted by a
broader array of innovative and increasingly customized products.
Average spending per cardmember grew more than 10 percent as we offered our customers a wider range of
rewards, incentives and choices for using their cards. American Express has the highest-spending cardmem-
AXP / AR.2005
[ 10 ]
AMEX05narL01P01_22v4.qxd 3/1/06 1:35 PM Page 10](https://image.slidesharecdn.com/1041986/85/american-express-Annual-Reports-2005-12-320.jpg)
![$1.00
$1.61
$1.80
$2.09
$2.56
01 02 03 04 05
$3.0
$2.5
$2.0
$1.5
$1.0
$0.5
$0
bers of any card network, and our continuing efforts to deepen relationships with these customers helped us
to expand our lead in 2005.
We also added 5.6 million new cards-in-force during the year, one of our largest annual increases ever. This
brought total cards-in-force to 71 million, a 9 percent increase from a year ago. In growing our cardmember
base, we continued to target the kind of high-spending cardmembers who are synonymous with the
American Express franchise.
While spending is the focus of our business model, lending is an important complement. We had outstand-
ing growth in cardmember loans, which rose 15 percent on a managed basis and 23 percent on a GAAP basis
in 2005. This performance compared favorably to our competitors, most of whom posted only single-digit
gains in managed loans.
As we have grown cardmember spending and lending balances at a rapid pace, we have also maintained strong
credit quality. Write-off rates in both our charge and lending portfolios remained near all-time lows, despite
an industry-wide spike in bankruptcy filings in the second half of the year that stemmed from new federal
legislation in the United States. The impact was well controlled, and we expect the new laws will have a
slightly beneficial effect over the long term.
Overall, the results from our card business in 2005 showed the competitive advantages of our spend-centric
model, the benefits of our business-building investments over the past few years, and our emphasis on
providing superior value to our cardmembers and merchant partners.
A STRONGER, MORE FOCUSED COMPETITOR
Our momentum is strong, and we believe it will be further fueled by our spin-off of Ameriprise. The spin-off
was a major change for American Express, but it was also part of a logical evolution for our company. Enter-
ing 2005, our proprietary card-issuing business was in an excellent competitive position following several
years of rapid growth. In addition, the opening of our network services business in the United States created
new opportunities for us.
In view of the high returns and broad range of growth opportunities across our payments businesses, we con-
cluded that sharpening our focus on these activities would accelerate our growth. Likewise, we believed
Ameriprise would benefit from operating as an independent company. The spin-off gave shareholders an
interest in two outstanding companies, each pursuing its most important priorities and objectives.
AXP / AR.2005
[ 11 ]
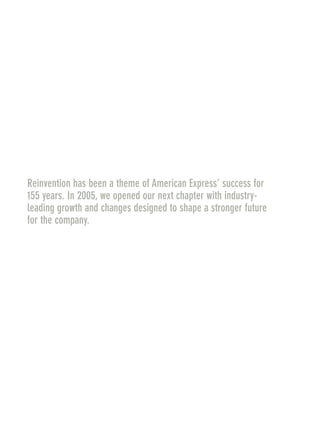
DILUTED EARNINGS PER SHARE FROM CONTINUING OPERATIONS
In 2005, diluted earnings per share from continuing operations rose 22 percent, driven by
higher cardmember spending and a continuing focus on containing costs.
AMEX05narL01P01_22v6.qxd 3/2/06 12:38 AM Page 11](https://image.slidesharecdn.com/1041986/85/american-express-Annual-Reports-2005-13-320.jpg)
![The new American Express is the world’s largest charge and credit card issuer by purchase volume, a network
that processes transactions for nearly 100 financial institutions around the world, the premier global travel
management company, and a respected international bank. We have leadership positions in the consumer,
small business, middle market and large corporate card sectors, offering a diverse range of charge, lending,
co-brand and prepaid products.
Beyond the size and breadth of our businesses, the new American Express has a unique set of competitive and
financial characteristics, including:
■ A business model that focuses on driving cardmember spending, unlike most of our competitors, whose
models are primarily based on lending. This is an important distinction because our model generally
produces higher returns and is less capital-intensive. As a result, we generate strong cash flow that can be
reinvested into business-building activities when market conditions make it advantageous to do so, as well
as high payout ratios to shareholders through share repurchases and dividends.
■ A unique closed-loop network and marketing capabilities that directly link cardmembers with merchants
through targeted offers and incentives. As traditional marketing and advertising channels become more
fragmented, our ability to match high-spending cardmembers with merchants who want to reach motivated
customers becomes increasingly valuable. In essence, we think of American Express as a highly attractive
and efficient consumer marketplace that delivers value to cardmembers and drives business to our mer-
chant partners.
■ A focus on reengineering that has produced annual savings of over $1 billion in each of the past five years.
Having a disciplined approach to enhancing quality, costs and revenues through reengineering and Six
Sigma process improvements frees up funds to invest in growth and gives us additional flexibility to navigate
through different market conditions.
■ A wide range of organic growth opportunities and highly effective capital allocation processes that enable
us to maximize returns, stability and flexibility.
■ World-class capabilities in risk management, information management and customer segmentation that
help facilitate our growth.
■ A brand recognized around the world for exceptional service and customer care.
AXP / AR.2005
[ 12 ]
RETURN ON EQUITY
We continued to exceed our long-term targets for return on equity (ROE). At year end,
pro forma ROE (which is based on continuing operations) was 31 percent. Reported ROE
(which includes results from Ameriprise) was 25 percent. Please see page 26 for more
information about the calculation of these results. In 2005, we raised our long-term ROE
target to 28-to-30 percent from 18-to-20 percent, to reflect the company's higher return
potential following the spin-off of Ameriprise.
11%
20%
21%
22%
25%
31%
01 02 03 04 05
AMEX05narL01P01_22v5.qxd 3/1/06 6:38 PM Page 12](https://image.slidesharecdn.com/1041986/85/american-express-Annual-Reports-2005-14-320.jpg)
![DELIVERING SHAREHOLDER RETURNS
The financial characteristics of the new American Express — earnings growth, return on equity, payout ratio
and valuation — compare favorably with many of the top long-term growth companies, regardless of indus-
try. We believe that managing the business for consistent growth and profitability over the long term should
continue to generate substantial shareholder value.
At year end, our stock’s price-to-earnings ratio was among the highest of any of the top 25 global financial
services companies, reflecting investor confidence in the current strengths of our business and the company’s
long-term potential.
In the lackluster equity market environment of 2005, shares of American Express stock produced a total
return to shareholders of 5 percent. We out-performed the Dow Jones Industrials and most of our peers in
the card industry, performed in line with the S&P 500, and slightly under-performed the S&P Financials,
where most of the gains came from the insurance and brokerage sectors. Cumulatively, over the past three
years, American Express’ stock has out-performed these three key indices and almost all of our peer compa-
nies in total shareholder returns.
In looking at shareholder performance in 2005, it’s also important to recognize the additional value that
American Express shareholders gained from the Ameriprise spin-off. Those who received the spin-off dividend
of Ameriprise shares and held their shares through the end of the year saw them appreciate by more than
14 percent.
American Express returned 48 percent of capital to shareholders in 2005 through share repurchases and
regular dividends. This reflects a more measured approach toward share repurchases in light of the capital
implications of the Ameriprise spin-off. Over the past decade, we have met our capital return target of 65 percent,
on average and over time, and we remain committed to this long-term objective.
A DEEPER LOOK AT RESULTS
Across our lines of business in 2005, American Express moved aggressively to develop and market new prod-
ucts, rewards and services to deliver more value to our customers and earn more of their business. Here is a
deeper look at some of these efforts.
Proprietary Consumer and Small Business Cards
Innovative products, rewards and enhanced services helped increase spending among consumer and small-
business cardmembers around the world. In the United States, billed business rose 15 percent on consumer
cards and 20 percent on small-business cards. In international markets, we saw a 13 percent gain in consumer
and small-business spending, excluding the impact of foreign exchange translation.
AXP / AR.2005
[ 13 ]
AMEX05narL01P01_22v2.qxd 2/28/06 5:41 AM Page 13](https://image.slidesharecdn.com/1041986/85/american-express-Annual-Reports-2005-15-320.jpg)
![Customization has been one of the keys to our success. Increasingly, we are focused on providing highly
targeted value propositions to specific customer groups to drive spending and loyalty. We followed this
strategy in a series of major product launches in the United States, as well as more than 60 new and enhanced
proprietary card offerings in international markets in 2005.
A few examples from the wide range of products we launched include:
■ One from American Express, which automatically contributes a percentage of cardmember purchases to
a high-yield savings account.
■ The co-branded JetBlue Card from American Express, which allows U.S. consumers to earn travel
rewards that can be redeemed for flights on JetBlue.
■ IN:Chicago and IN:LA, the latest in our line-up of “city-centric” cards that provide rewards tailored for
young, urban cardmembers in the United States.
■ Two new fee-free cards in the United States that let cardmembers save on any flight, hotel, car rental or
cruise charges: the Blue Sky Credit Card for consumers and the Platinum Business FreedomPass Credit
Card for small-business owners.
■ Blue from American Express with an ExpressPay chip, giving cardmembers the flexibility of contactless
payment at everyday-spending locations that now include major U.S. chains such as CVS/Pharmacy®,
McDonald’s® and 7-Eleven®.
■ The new Business Gold Rewards card in the U.S., a significantly enhanced version of the Gold Card that
offers additional rewards for small businesses.
■ The Knot Credit Card, for couples planning their weddings, and The Nest Credit Card, for newlyweds.
■ The Nectar Credit Card from American Express, in partnership with the United Kingdom's largest loyalty
program, Loyalty Management U.K.
■ The MINI American Express Card, a BMW-American Express co-brand in Germany.
■ The expansion of existing co-brand card portfolios — including the new SkyPoints™ Credit Card from
Delta and the Singapore Airlines PPS Club Platinum Credit Card.
■ New premium cards including Platinum in Australia, Brazil, Mexico, Hong Kong and Taiwan; and
Centurion in Singapore.
At the same time, we continued to enrich our industry-leading rewards programs for consumer, small
business and corporate customers in other ways. For example, we added a host of new partners to Member-
ship Rewards, giving cardmembers more choices for redeeming their points — including the booking of trips
arranged through our newly redesigned travel Web site. We also signed new partners in the hotel, express
delivery and restaurant industries for OPEN Savings, which gives small-business cardmembers access to
special negotiated rates for savings on a variety of travel and everyday costs.
AXP / AR.2005
[ 14 ]
AMEX05narL01P01_22v5.qxd 3/1/06 6:09 PM Page 14](https://image.slidesharecdn.com/1041986/85/american-express-Annual-Reports-2005-16-320.jpg)
![Efforts like these helped us deepen relationships with our premium cardmembers and attract new ones to
the franchise.
Network Cards
Our fast-expanding Global Network Services (GNS) business also continued to gain momentum in 2005,
providing us with an additional — and increasingly strong — avenue for growth. Spending on cards issued
by our bank partners rose 36 percent globally, network cards-in-force rose 23 percent, and we signed a num-
ber of key issuers in the United States and in several international markets.
As 2005 drew to a close, we marked our first full year of operating our network business in the United States,
an option finally opened to us in October 2004 through a series of court rulings that barred the anticompetitive
practices of Visa and MasterCard. We moved quickly to capitalize on this opportunity, and our rapid progress
clearly illustrates the potential of GNS for both American Express and banks that issue cards on our network.
To date, we’ve signed seven leading U.S. card issuers: MBNA, Citibank, Bank of America, GE Money Bank,
HSBC Bank Nevada N.A., USAA Federal Savings Bank and Juniper Bank, a member of the Barclays Group.
Collectively, the annual billings of these institutions represent about half of the total for the top 100 bank card
issuers in the United States. We are confident that our value proposition will enable us to capture additional
spending on our network and attract more premium cardmembers to the franchise.
MBNA, our first U.S. bank partner, began issuing cards accepted on the American Express network in late
2004. Citibank launched its first cards this past December. With these cards in the marketplace and others in
the pipeline, our GNS business is off to a very promising start in the United States.
Outside the United States, we announced 13 new GNS deals — including those with Lloyds TSB in the United
Kingdom, Standard Chartered Bank in Asia, Banco Patagonia in Argentina and Shinhan Card in South Korea
— which brought our total worldwide to 97 relationships in 109 countries. We also marked historic card
launches in China and Russia with our partners Industrial and Commercial Bank of China (ICBC) and Russian
Standard Bank, respectively, and positioned ourselves in two emerging markets that offer great potential.
Importantly, GNS enables us to enter new markets and expand our presence in others quickly and cost-
effectively, by leveraging our existing network and the distribution capabilities of banks with whom we partner.
AXP / AR.2005
[ 15 ]
NEW PRODUCTS
American Express continued to design
new products for attractive segments of
the card market. Our focus: providing
premium-value products and services to
high-spending cardmembers.
AMEX05narL01P01_22v6.qxd 3/2/06 12:46 PM Page 15](https://image.slidesharecdn.com/1041986/85/american-express-Annual-Reports-2005-17-320.jpg)
![Commercial Cards
In the highly competitive corporate payments arena, we strengthened our position as the leading provider of
corporate cards, generating double-digit increases in commercial-card spending worldwide. Billings in the
global middle market — a key area of opportunity for our company — grew by 19 percent. Based on this
performance, we believe we gained share of commercial-card spending in the United States and in key inter-
national markets.
These results reflect our ability to provide dedicated service for corporations and their employees, targeted
savings programs, and global expense management solutions. In 2005, we enhanced our products and services
for large corporations and midsize businesses. For example, we:
■ added more rewards and features to American Express Business ExtrAA, a co-branded card with American
Airlines, which now offers rebates on all published American Airlines fares;
■ launched several new co-branded cards with airline and loyalty program partners, including Aeroplan,
Alitalia and British Airways, all of which offer midsize companies sizable discounts and rebates on air
travel; and
■ enhanced our data management capabilities, offering corporate clients new tools for analyzing and manag-
ing hotel costs, tracking global expenses and obtaining Value Added Tax refunds.
Merchant Services
We continued to broaden our global merchant network in 2005. We welcomed millions of new establish-
ments around the world, extended long-term partnerships with key accounts and expanded card acceptance
in emerging categories such as rent, recurring billing and quick-service restaurants. On average, during 2005
American Express added a new merchant location that accepts our cards every 16 seconds.
While giving our cardmembers more places and more ways to use their American Express cards will always
be important to us, we are just as focused on helping our merchant partners build their businesses. We deliver
higher-spending customers to their doors. For example, in the United States, average spending on American
Express cards is about four times higher than on MasterCard and Visa cards. Moreover, with our marketing
expertise and database capabilities, we work closely with merchants to create targeted offers for the American
Express cardmembers they most want to reach. In turn, our cardmembers benefit from the significant savings,
exclusive access, upgrades and other types of rewards that American Express provides.
In 2005, we continued to strengthen our partnerships with merchants and expand our broad array of incentive
programs such as My WishList, a seasonal online promotion that gives cardmembers access to many valuable
AXP / AR.2005
[ 16 ]
PARTNERING WITH MERCHANTS
Working closely with partners, we deliver
customized cardmember offers to help
merchants grow their businesses. On
average, during 2005 we added a new
merchant location to our network every
16 seconds, expanding card acceptance
globally and giving our cardmembers more
places and more ways to use their
American Express cards.
AMEX05narL01P01_22v3.qxd 3/1/06 2:09 AM Page 16](https://image.slidesharecdn.com/1041986/85/american-express-Annual-Reports-2005-18-320.jpg)
![offers, and Business Savings, which gives smaller establishments that accept our cards significant discounts
on the services of some of our largest merchant partners. In essence, as I noted earlier, we are creating a highly
efficient marketplace with our closed-loop network, and we’ve seen the results in our industry-leading growth
in cardmember spending and gains in our share of spending with many top merchants.
Prepaid Services
Sales of American Express Gift Cards more than doubled from a year ago, as demand for these products
continued to rise. We significantly expanded the number of places where consumers can purchase our gift
cards, adding about 30,000 new retail and banking locations in 2005. In the United States, we also introduced
gift cards for specific groups of recipients and occasions, such as children, teens and birthdays. Multi-purpose
gift cards, like those from American Express, offer a more convenient choice for gift-giving than cash, checks
or store-specific gift cards.
As for our original prepaid product, the American Express Travelers Cheque, sales declined slightly from a
year ago due to increased competition from other forms of payment. Average Travelers Cheques outstanding,
a key driver of profitability for this product, rose slightly. During the year, we announced an agreement with
Thomas Cook in the United Kingdom for the travel agency to sell American Express Travelers Cheques
through its branch network, in call centers and on its Web site.
Travel
American Express is the world’s premier travel management company. Our travel business supports our brand,
our global presence and our ability to serve our cardmembers’ needs around the world. In 2005, we grew
worldwide travel sales by 4 percent, while continuing to adapt to a very challenging industry environment.
Our U.S. Consumer Travel business had a particularly strong year, posting a 27 percent gain in revenue.
Online sales rose significantly, with the average transaction size increasing nearly 60 percent in 2005, our first
full year since we launched a new travel Web site. We also broadened our selection of cruise and tour pack-
ages and enabled cardmembers to redeem Membership Rewards points to pay for their trips, an option that
has proved extremely popular.
In Business Travel, average transaction revenue fell as more volume moved online, but overall operating
margins improved because of continuing progress in the ongoing transformation of our business model. In
2005, we stepped up our efforts to reduce expenses, enhance services and increase our flexibility. These
actions position us to compete more effectively — both online and offline — in an industry environment that
we expect will continue to be difficult.
American Express Bank
American Express Bank provides financial services to banks worldwide and to high-net-worth and affluent
individuals outside the United States. Commissions and fees rose on solid growth in payment volumes and
AXP / AR.2005
[ 17 ]
AMEX05narL01P01_22v2.qxd 2/28/06 5:46 AM Page 17](https://image.slidesharecdn.com/1041986/85/american-express-Annual-Reports-2005-19-320.jpg)
![Private Bank holdings. Private Bank assets under management rose 10 percent, topping $20 billion for the
first time ever. In the Financial Institutions Group, global payment volumes increased by 21 percent.
The Bank continued its strategy of shifting resources to its higher-return, lower-risk businesses. Exiting
corporate lending over the past five years has significantly improved its return on equity and risk profile.
Additionally, the Bank continues to align its products and services more closely with the card business. Pri-
vate Bank services have become a key offering for Centurion cardmembers, and American Express cards are
available to clients as an integrated part of their relationship with the Private Bank.
MANAGING CHALLENGES
While we produced excellent results across our businesses in 2005, the question we — or any business for
that matter — must answer is whether we can sustain strong performance. We are confident the answer is
yes, based on our steady momentum since 2001 as well as the steps we have taken to increase our financial
strength and capitalize on our competitive advantages and growth opportunities.
Of course, no business operates in a vacuum. We, and the payments industry as a whole, face clear and
significant challenges into 2006 and beyond. I want to highlight three of them — discount rate pressure, the
uncertain economic environment, and industry saturation — and then explain why I believe American
Express is well positioned to navigate through these challenges and to execute our growth strategy.
DISCOUNT RATE PRESSURE ■ Two factors have combined to focus attention on the fees that card net-
works charge merchants: regulatory actions in several countries and private merchant litigation, primarily in
the United States. While Visa and MasterCard have been the main target of these actions, we are not immune
from a spillover effect.
I’ll begin with the regulatory environment. In countries including Australia and Mexico, government author-
ities have scrutinized interchange rates set by the Visa and MasterCard networks and, in some cases, acted to
restrict them. The regulators’ actions have hinged on two principles: the notion that Visa and MasterCard
member banks are working collectively to set prices, and that because those associations have market power
they have substantially harmed competition.
American Express has not been directly affected by these regulations because we are fundamentally different
from our network competitors. We are a single entity, not an association of banks, and we set our discount rate
directly with each merchant. Although our network is open to other card issuers, they do not play a role in
setting merchant pricing. In addition, we do not have monopolistic power. Merchants are not required to accept
our cards, but choose to do so because we provide premium value in return for the fees we charge.
AXP / AR.2005
[ 18 ]
AMEX05narL01P01_22v4.qxd 3/1/06 2:38 PM Page 18](https://image.slidesharecdn.com/1041986/85/american-express-Annual-Reports-2005-20-320.jpg)
![In certain countries where regulations have forced our competitors to lower their fees, we have lowered our
merchant discount rates to reflect competitive trends, but not as much as the associations. At the same time,
we have increased billed business and locations-in-force in these countries, further illustrating the advantages
of our spend-centric model and the clear value we provide to merchants.
In the United States, the activity around interchange has focused on private litigation, following a long pat-
tern of rising interchange fees on the part of Visa and MasterCard. We are confident that the legal theories
advanced in these cases do not apply to us because of the fundamental differences between our business
model and that of the bank card associations.
We will continue to closely monitor the regulatory and legal developments that can affect our discount rate,
which we expect will take some time to play out fully.
UNCERTAIN ECONOMIC ENVIRONMENT ■ Another issue facing American Express and the payments
industry as a whole is the impact of a potential economic slowdown. No company is insulated from the effects
of economic cycles. However, the actions we have taken since 2001 to become more flexible and improve our
risk profile have made us better able to manage through them. We have a diverse range of products, customer
groups and revenue sources. We can direct investment spending with increased precision and speed, enabling
us to adapt quickly to changing economic conditions. And our ongoing reengineering efforts should continue
to generate cost savings and revenues across our business that we can either reinvest or let flow to the bottom
line, depending on market circumstances. In short, we have a variety of levers available to respond to short-
term conditions while managing our business for the long term.
INDUSTRY SATURATION ■ The last issue I’d like to address is a perception that the market for charge and
credit cards, particularly in the United States, is fully mature. Industry observers who hold this view cite
declining response rates to myriad card offers and slowing receivables growth among many issuers. While we
acknowledge that competition in the payments industry is greater than ever, we think there is significant room
for growth.
Our cardmembers spent a record $484 billion on their American Express cards last year, more than on any
other card issuer’s products, but this represents only a small portion of the total opportunity. Consider the
following:
■ Of the estimated $28 trillion dollars that consumers worldwide spend annually, only 14 percent takes place
on credit, charge and debit cards. Therefore, the potential to grow is substantial.
AXP / AR.2005
[ 19 ]
MEMBERSHIP REWARDS AS PAYMENT
Cardmembers can now use Membership
Rewards points to pay for any airline
ticket, hotel room or cruise available on
our redesigned travel Web site. This
service, called Membership Rewards as
Payment, gives customers more ways to
redeem their points. In just a few short
months, it has become one of the most
popular options on our Web site.
AMEX05narL01P01_22v2.qxd 2/28/06 5:48 AM Page 19](https://image.slidesharecdn.com/1041986/85/american-express-Annual-Reports-2005-21-320.jpg)
![AXP / AR.2005
[ 20 ]
■ Similarly, cash and checks are used for the vast majority of small-business spending. We estimate that U.S.
small businesses use cards for less than 15 percent of their spending, and that amount is likely to be even
lower internationally.
■ Midsize companies worldwide use cards for less than 10 percent of major purchases such as travel and
entertainment and office supplies, although many can clearly benefit from the savings and expense man-
agement services that American Express provides.
Given the competitive advantages of our business model and the differentiated appeal of our products and
brand for high-spending consumers and business clients, we believe we are well positioned to capture this
substantial opportunity.
CAPITALIZING ON OPPORTUNITY
At a time of mergers and consolidation across the financial services industry, most of American Express’
growth in recent years has come from our existing businesses. While we remain open to making an acquisi-
tion if it would accelerate our growth and business strategies, we are focused on organic opportunities in both
traditional and emerging areas of our business.
There is significant potential to grow spending and lending within our existing customer base, as well as to
deepen relationships with corporate and small-business customers. And we have proven our ability to
expand our franchise by attracting new high-value customers in both our proprietary payments and network
businesses. Continuing to do these things well will enable us to capture a greater portion of the vast and
growing market opportunity that I outlined earlier. Even small percentage increases in average cardmember
spending and cards-in-force can translate into substantial revenue gains.
In addition, we have a range of emerging opportunities that build upon our existing capabilities.
■ Global Network Services (GNS) — Our GNS business is off to a great start in the United States, but it’s only
in the early stages of growth. We have signed an impressive group of major banks to issue cards on our
network. Combining their extensive distribution capabilities with our brand power and network gives us
added opportunities to grow spending, increase cards-in-force and expand our merchant coverage. Mean-
while, we have great potential to grow our network business internationally, building upon the momen-
tum we have already established.
HELPING MIDSIZE BUSINESSES
Helping midsize companies manage
employee spending is an excellent growth
opportunity for American Express.
In 2005, we launched corporate cards in
partnership with British Airways, Aeroplan
and Alitalia that deliver travel discounts
and rebates to midsize businesses that
were traditionally available only to larger
companies.
AMEX05narL01P01_22v4.qxd 3/1/06 2:39 PM Page 20](https://image.slidesharecdn.com/1041986/85/american-express-Annual-Reports-2005-22-320.jpg)
![■ Emerging markets — Economic growth and the rapid advance of consumer spending in countries such as
China, Russia and India are exciting developments. In 2005, we introduced our first cards in China and
Russia in partnership with ICBC and Russian Standard Bank. With well over a billion potential cardmem-
bers and plastic penetration in the low single digits, these markets hold significant promise. As plastic
spending and the consumer credit infrastructure evolve, we see considerable opportunity here over the
moderate to long term.
■ Global middle market — This continues to be an excellent growth opportunity for American Express, as we
focus on leveraging our strengths in the corporate sector to bring expense management and other services
to midsize businesses around the world. These companies spend more than $900 billion annually on travel
and entertainment, office equipment and supplies, shipping, and other incidental costs — all expenses that
we can help them manage. While we have made great progress in this area, we are only just scratching the
surface.
■ Alternative payments and new industries — From buying a cup of coffee with the wave of a “contactless”
card to making monthly rent payments with American Express, our cardmembers have many new ways to
use their cards instead of cash. The same is true for prepaid Gift Cards designed to take the place of cash
and checks for gift-giving. We will continue to develop new payment alternatives that are faster and more
convenient for consumers.
With such a wide variety of opportunities already in our pipeline and strong momentum moving us forward,
we feel confident in our ability to sustain our growth over the long term.
COMMITMENT TO SERVICE
Our ultimate goal is to be one of the most respected companies in the world, regardless of industry, based on
long-term financial performance and honorable conduct. It’s not just about results, but how we achieve them
— with a commitment to integrity and service.
This commitment starts at the top with our Board of Directors, which provides invaluable guidance. On behalf of
our employees and shareholders, I want to thank our Directors for their dedication to the company. In particular,
I would like to recognize William G. Bowen who, having reached the mandatory retirement age, will not stand
for reelection to the Board in 2006. We are grateful for his 18 years of distinguished service to American Express
and we will miss his wise counsel. In another change, in January 2006 we welcomed Peter Chernin, President
and Chief Operating Officer of News Corporation, as a new Director. Peter will make an outstanding addition to
our Board.
While the dedication of senior leaders is essential, our ability to live up to our values ultimately depends on
the tens of thousands of American Express employees who personify our brand. What we stand for was never
AXP / AR.2005
[ 21 ]
AMEX05narL01P01_22v2.qxd 2/28/06 5:50 AM Page 21](https://image.slidesharecdn.com/1041986/85/american-express-Annual-Reports-2005-23-320.jpg)
![so powerfully expressed as it was in 2005, when the world endured multiple natural disasters that claimed
lives and destroyed property on a massive scale. During these crises, American Express people across the com-
pany reached out to aid cardmembers, merchants and travelers in ways that have come to typify our service
— in other words, above and beyond all reasonable expectations. They helped move people out of stricken
regions. They reunited families. They extended emergency loans, credit and sometimes even cash to card-
members and merchants in need. They helped promote the restoration of tourism in regions trying to recover
in the aftermath of the disasters. And they gave generously, volunteering thousands of hours and donating
nearly $2 million to relief efforts. In addition the American Express Foundation and the company contributed
another $3.5 million to help aid the recovery.
While we have a longstanding tradition of going above and beyond in times of crisis, the everyday actions of
employees are what enable us to carry out our strategies and deliver for our cardmembers, partners and share-
holders. I believe we have one of the most talented and committed workforces of any company.
Our 2005 Employee Survey, which set a record for participation, showed that we are maintaining consistently
high satisfaction levels. Workplace quality is important to us, and we work hard to foster an environment in
which people of all backgrounds feel they can succeed and grow. We are proud that American Express was
included on 28 best places to work lists in major media worldwide in 2005, and that we retained the number
one ranking in the consumer credit category in Fortune’s annual America’s Most Admired Companies list. In
2006, we will roll out new programs to further strengthen our leadership and talent management capabili-
ties. We are committed to creating a work environment that not only ensures employee satisfaction, but
inspires and enables our people to reach higher.
I have often said that the people of American Express are our greatest asset. Strategies and business models
only lay the groundwork. For more than 155 years, our people have made our success possible through every
phase of this company’s reinvention. Above all else, they give me the confidence that our next chapter promises
to be the best yet.
Sincerely,
Kenneth I. Chenault, Chairman and Chief Executive Officer
FEBRUARY 27, 2006
AXP / AR.2005
[ 22 ]
AMEX05narL01P01_22v4.qxd 3/1/06 2:40 PM Page 22](https://image.slidesharecdn.com/1041986/85/american-express-Annual-Reports-2005-24-320.jpg)
![FINANCIAL REVIEW
The financial section of American Express Company’s
(the Company) Annual Report consists of this Financial
Review, the Consolidated Financial Statements and the
related notes that follow. The following discussion is
designed to provide perspective and understanding to
the Company’s consolidated financial condition and
results of operations. Certain key terms are defined in
the Glossary of Selected Terminology at the end of
this discussion.
Executive Overview
American Express Company is a leading global pay-
ments, network and travel company. The Company
offers a broad range of products including charge and
credit cards; stored value products such as Travelers
Cheques and gift cards; travel agency services and travel,
entertainment and purchasing expense management
services; network services and merchant acquisition and
merchant processing for our network partners and pro-
prietary payments businesses; and international bank-
ing products. The Company’s various products are sold
globally to diverse customer groups, including consum-
ers, small businesses, mid-market companies, large cor-
porations and banking institutions. These products are
sold through various channels including direct mail,
on-line applications, targeted sales-forces and direct
response advertising.
The Company generates revenue from a variety of
sources including global payments, such as charge and
credit cards, travel services and stored value products,
including Travelers Cheques. Charge and credit cards
generate revenue for the Company primarily in four dif-
ferent ways:
® Discount revenue, the Company’s largest single
revenue source, which represents fees charged to mer-
chants when cardmembers use their cards to purchase
goods and services on our network,
® Finance charge revenue, which is earned on
outstanding balances related to the cardmember lend-
ing portfolio,
® Card fees, which are earned for annual membership,
and other commissions and fees such as foreign
exchange conversion fees and card-related fees and
assessments, and
® Securitization income, net which reflects the earn-
ings related to cardmember loans financed through
securitization activities. Refer to the Glossary for fur-
ther information.
In addition to funding and operating costs associated
with these activities, other major expense categories are
expenses related to marketing and reward programs that
add new cardmembers and promote cardmember loy-
alty and spending, and provisions for anticipated card-
member credit and fraud losses.
The Company believes that its “spend-centric” business
model (in which it focuses primarily on generating rev-
enues by driving spending on its cards and secondarily
by finance charges and fees) has significant competitive
advantages. For merchants, the higher spending
represents greater value to them in the form of loyal cus-
tomers and higher sales, which gives the Company the
ability to earn a premium discount rate and invest in
greater value-added services for merchants. As a result
of the higher revenues generated from higher spending,
the Company has the flexibility to offer more attractive
rewards and other incentives to cardmembers, which in
turn create an incentive to spend more on their cards.
Discontinued Operations
On September 30, 2005, the Company completed the
spin-off of Ameriprise Financial, Inc. (Ameriprise),
formerly known as American Express Financial
Corporation, the Company’s financial planning and
financial services business, with the distribution of
Ameriprise common stock to the Company’s sharehold-
ers in a tax-free transaction for U.S. federal income tax
purposes. The net assets distributed to shareholders
have been treated as a dividend and charged to retained
earnings. In addition, during the third quarter of 2005,
the Company completed certain dispositions including
the sale of American Express Tax and Business Services,
Inc. (TBS), its tax, accounting and consulting business.
The operating results and assets and liabilities related to
Ameriprise and certain dispositions (including TBS)
prior to disposal have been reflected as discontinued
operations in the Consolidated Financial Statements.
Financial Review
AXP / AR.2005
[ 24 ]](https://image.slidesharecdn.com/1041986/85/american-express-Annual-Reports-2005-26-320.jpg)
![Segment Reporting
Effective September 30, 2005, the Company realigned
its segment presentation to reflect the spin-off of
Ameriprise. The new segments are: U.S. Card Services,
International Card & Global Commercial Services,
Global Network & Merchant Services, and Corporate
& Other.
U.S. Card Services includes the U.S. proprietary con-
sumer card business, OPEN from American Express, the
global Travelers Cheques and Prepaid Services business
and the American Express U.S. Consumer Travel Net-
work. As noted above, charge and credit cards generate
revenue for the Company primarily through discount
revenue, net finance charge revenue, card fees and secu-
ritization income, net. Prepaid Services, including Trav-
elers Cheques, earn investment income as cash is
invested prior to encashment of Travelers Cheques or
use of other prepaid products, in addition to other fees.
International Card & Global Commercial Services pro-
vides proprietary consumer cards and small business
cards outside the United States. International Card &
Global Commercial Services also offers global corporate
products and services, including Corporate Card, issued
to individuals through a corporate account established
by their employer; Business Travel, which helps busi-
nesses manage their travel expenses through a variety of
travel-related products and services; and Corporate Pur-
chasing Solutions, an account established by a company
to pay for everyday business expenses such as office and
computer supplies. International Card & Global Com-
mercial Services also includes American Express Bank
Ltd., which provides financial products and services
to retail customers and wealthy individuals outside
the United States and financial institutions around
the world.
International Card & Global Commercial Services
derives its revenues from a number of sources including
discount revenue from business billed on its proprietary
card and corporate payment and expense management
products, net finance charge revenue, net interest
income from its international banking operation and
various revenues and fees from its corporate travel man-
agement services and other products.
Global Network & Merchant Services consists of the
Merchant Services businesses and Global Network Ser-
vices. Global Network Services develops and manages
relationships with third parties that issue American
Express branded cards. The Global Merchant Services
businesses develop and manage relationships with mer-
chants that accept American Express branded cards;
authorize and record transactions; pay merchants; and
provide a variety of value-added point-of-sale and back
office services. Global Network & Merchant Services
works with merchant and bank partners to develop and
market product propositions, operate systems that
enable third parties to interface with the American
Express global network and provide network functions
that include operations, service delivery, authorization,
clearing, settlement and brand advertising, new product
development and marketing.
Global Network & Merchant Services derives its
revenues primarily from discount revenue charged to
merchants. Other revenues include royalties, contribu-
tions from joint venture partnerships and fees charged
to merchants and partners for services.
Corporate & Other consists of corporate functions and
auxiliary businesses including, for 2003 and 2004, the
leasing product line of the Company’s small business
financing unit, American Express Business Finance Cor-
poration, which was sold in 2004.
The Company creates shareholder value by focusing on
the following elements:
® Driving growth, principally organically, through
related business opportunities or joint ventures and
selected acquisitions;
® Delivering returns well in excess of the Company’s
cost of capital; and
® Distributing excess capital to shareholders through
dividends and stock repurchases.
Financial Review
AXP / AR.2005
[ 25 ]](https://image.slidesharecdn.com/1041986/85/american-express-Annual-Reports-2005-27-320.jpg)
![Overall, it is management’s priority to increase
shareholder value over the moderate to long-term by
achieving the following long-term financial targets, on
average and over time:
® Earnings per share growth of 12 to 15 percent;
® Revenue growth of at least 8 percent; and
® Return on shareholders’ equity of 28 to 30 percent (18
to 20 percent prior to the Ameriprise spin-off).
During 2005, the Company met or exceeded its earnings
per share, revenue and return on equity targets, illustrat-
ing the benefits of the strong business momentum
achieved through the business-building investments
made over the past few years. After the completion of
the Ameriprise spin-off in 2005, the Company raised its
return on equity target from 18 to 20 percent to 28 to
30 percent. Reported return on shareholders’ equity for
2005 was 25 percent which exceeded our target prior
to the spin-off and which is calculated on a trailing
12-month basis using reported net income over average
total shareholders’ equity including discontinued opera-
tions (prior to disposal).
Pro forma return on shareholders’ equity, determined
using income from continuing operations over the
average of the month-end shareholders’ equity at
September 30, 2005 through December 31, 2005, was
31 percent. Management believes pro forma return on
shareholders’ equity is a better comparison to the 28–30
percent target post spin-off as the earnings and capital
from discontinued operations reflected in the calcula-
tion of reported return on shareholders’ equity are not
included in the 28–30 percent target.
A summary of the Company’s recent financial perfor-
mance follows:
Years Ended December 31,
(Millions, except per share
amounts and ratio data) 2005 2004
Percent
Increase
Revenues $ 24,267 $ 21,964 10%
Expenses $ 20,019 $ 18,133 10
Income from
continuing
operations $ 3,221 $ 2,686 20
Net income $ 3,734 $ 3,445 8
Earnings per common
share from
continuing
operations —
diluted $ 2.56 $ 2.09 22
Earnings per common
share — diluted $ 2.97 $ 2.68 11
Return on average
shareholders’
equity(a)
25.4% 22.0% —
(a)Calculated based on $3.7 billion of net income and $14.7 billion of
average shareholders’ equity for the trailing twelve months ending
December 31, 2005. Pro forma return on average shareholders’ equity
was 31.5 percent for 2005 and was calculated based on $3.2 billion of
income from continuing operations and $10.2 billion of average month-
end shareholders’ equity for the quarter ending December 31, 2005.
See Consolidated Results of Operations below for
discussion of the Company’s results.
The Company follows U.S. generally accepted account-
ing principles (GAAP). In addition to information pro-
vided on a GAAP basis, the Company discloses certain
data on a “managed basis.” This information, which
should be read only as a supplement to GAAP informa-
tion, assumes, in the Consolidated Selected Statistical
Information and U.S. Card Services segment, there have
been no cardmember lending securitization transac-
tions, and certain tax-exempt investment income had
been earned on a taxable basis. In addition, the Inter-
national Card & Global Commercial Services segment
reflects a reclassification of certain foreign exchange ser-
vices as revenues on a managed basis. These managed
basis adjustments, and management’s rationale for such
presentation, are discussed further in U.S. Card Services
and International Card & Global Commercial Services
sections below under “Differences between GAAP and
Managed Basis Presentation.”
Certain reclassifications of prior period amounts have
been made to conform to the current presentation
throughout this Annual Report. Certain of the state-
ments in this Annual Report are forward-looking
statements within the meaning of the Private Securities
Litigation Reform Act of 1995. See Forward-Looking
Statements at the end of this discussion.
Financial Review
AXP / AR.2005
[ 26 ]](https://image.slidesharecdn.com/1041986/85/american-express-Annual-Reports-2005-28-320.jpg)
![Critical Accounting Policies
The Company’s significant accounting policies are described in Note 1 to the Consolidated Financial Statements. The following
provides information about critical accounting policies that are important to the Consolidated Financial Statements and that
require significant management assumptions and judgments about the effect of matters that are uncertain. These policies relate
to reserves for cardmember losses, reserve for Membership Rewards costs and asset securitizations.
Reserves for cardmember losses
Critical Accounting Policies Assumptions/Approach Used
Effect if Actual Results Differ
from Assumptions
Reserves for losses relating to
cardmember loans and receivables
represent management’s estimate
of the amount necessary to absorb
losses inherent in the Company’s
outstanding portfolio of loans
and receivables.
Reserves for these losses are
primarily based upon models that
analyze several specific portfolio
statistics, including average
write-off rates for various stages
of receivable aging (i.e., current,
30 days, 60 days, 90 days) over a
24-month period and average
bankruptcy and recovery rates.
Also, to a lesser extent, these
reserves reflect management’s
judgment regarding overall
adequacy. In exercising its
judgment to adjust reserves that
are calculated by the analytic
model, management considers
emerging trends and the level of
coverage of past-due accounts, as
well as external indicators, such
as leading economic indicators,
unemployment rate, consumer
confidence index, purchasing
manager’s index, bankruptcy
filings and the legal and
regulatory environment.
To the extent historical credit
experience is not indicative of
future performance or other
assumptions used by management
do not prevail, loss experience
could differ significantly, resulting
in either higher or lower future
provisions for losses, as applicable.
As of December 31, 2005, a 20
basis point change in the average
write-off rate on cardmember loans
and receivables balances would
change the reserve for losses by
approximately $140 million.
Financial Review
AXP / AR.2005
[ 27 ]](https://image.slidesharecdn.com/1041986/85/american-express-Annual-Reports-2005-29-320.jpg)
![Reserve for Membership Rewards costs
Critical Accounting Policies Assumptions/Approach Used
Effect if Actual Results Differ
from Assumptions
The Membership Rewards program
is the largest card-based rewards
program in the world, with more
than 1,300 redemption partners
worldwide. The program allows
cardmembers to earn one point for
virtually every dollar charged on
eligible, enrolled American Express
Cards. Many cards offer the ability
to earn double points for certain
types of purchases. Membership
Rewards points are redeemable in a
wide selection of reward categories,
including travel, merchandise and
gift certificates. Points have no
expiration date, and there is no
limit on the number of points one
can earn. A majority of spending by
cardmembers earns points under
this program. Participation,
redemptions and the related
expense under the program have
been increasing. Although the
expense for rewards is recorded as
part of marketing, promotion,
rewards and cardmember services,
the benefits are seen in higher
revenues, lower attrition and faster
speed of payment.
The Company establishes balance
sheet reserves to cover the cost
of future reward redemptions
for points earned to date.
The reserve for Membership
Rewards is estimated using
models that analyze redemption
statistics since the inception of
the program and reflect, to a
lesser extent, management’s
judgment regarding overall
adequacy. The provision for the
cost of Membership Rewards is
based upon points earned that are
expected to be ultimately
redeemed by cardmembers and
the current weighted-average cost
per point of redemption. The
estimated points to be redeemed
by cardmembers are measured
based on many factors including
past redemption behavior of
cardmembers, product type on
which the points are earned,
year of program enrollment, and
spend level. Past behavior is used
to predict when current enrollees
will leave the program and their
ultimate redemption rate on the
points earned to date, but not
yet redeemed. The weighted-
average cost per point is affected
by the mix of rewards redeemed.
The Company continually
evaluates its reserve methodology
for Membership Rewards based
on developments in redemption
patterns, cost per point redeemed
and other factors.
The balance sheet reserve for
unredeemed points is impacted over
time by enrollment levels, amount
of points earned and redeemed,
weighted-average cost per point,
redemption choices made by
cardmembers, reward offerings by
partners and other Membership
Rewards program changes. The
calculation is most sensitive to
changes in the estimated ultimate
redemption rate. This rate is based
on the expectation that a large
majority of all points earned will
eventually be redeemed.
As of December 31, 2005, if the
global ultimate redemption rate
changed by 100 basis points, the
balance sheet reserve would change
by approximately $150 million.
Financial Review
AXP / AR.2005
[ 28 ]](https://image.slidesharecdn.com/1041986/85/american-express-Annual-Reports-2005-30-320.jpg)
![Asset securitizations
Critical Accounting Policies Assumptions/Approach Used
Effect if Actual Results Differ
from Assumptions
Certain estimates and assumptions
are required to determine the
fair value of the Company’s
subordinated retained interests,
including an interest-only strip,
and gains or losses recorded at the
time of sale when the Company
securitizes cardmember loans.
Estimates and assumptions are
generally based on projections
of finance charges and fees paid
related to the securitized assets,
net credit losses, average loan life,
the contractual fee to service the
securitized assets and a discount
rate commensurate with the risk
inherent in the subordinated
retained interests.
Changes in the estimates and
assumptions used may have
an impact on the Company’s
gain or loss calculation and
the valuation of its subordinated
retained interests.
As of December 31, 2005, the total
fair value of all subordinated
retained interests was $279 million.
A 10 percent adverse change in the
key estimates and assumptions
referred to in the previous column,
would result in a decrease in the
total fair value of approximately
$30 million.
Financial Review
AXP / AR.2005
[ 29 ]](https://image.slidesharecdn.com/1041986/85/american-express-Annual-Reports-2005-31-320.jpg)
![Consolidated Results of Operations
Summary of the Company’s Financial Performance
Years Ended December 31,
(Millions, except per share
amounts and ratio data) 2005 2004 2003
Revenues $ 24,267 $ 21,964 $ 19,549
Expenses $ 20,019 $ 18,133 $ 16,134
Income from
continuing
operations $ 3,221 $ 2,686 $ 2,335
Net income $ 3,734 $ 3,445 $ 2,987
Earnings per common
share from
continuing
operations —
diluted $ 2.56 $ 2.09 $ 1.80
Earnings per common
share — diluted $ 2.97 $ 2.68 $ 2.30
Return on average
shareholders’
equity(a)
25.4% 22.0% 20.6%
(a)Calculated based on $3.7 billion of net income and $14.7 billion of
average shareholders’ equity for the trailing twelve months ending
December 31, 2005. Pro forma return on average shareholders’ equity
was 31.5 percent for 2005 and was calculated based on $3.2 billion of
income from continuing operations and $10.2 billion of average month-
end shareholders’ equity for the quarter ending December 31, 2005.
Selected Statistical Information
Years Ended December 31,
(Billions, except percentages
and where indicated) 2005 2004 2003
Card billed business(a)
:
United States $ 354.6 $ 304.8 $ 262.1
Outside the United
States 129.8 111.3 90.1
Total $ 484.4 $ 416.1 $ 352.2
Total cards-in-force
(millions)(a)
:
United States 43.0 39.9 36.4
Outside the United
States 28.0 25.5 24.1
Total 71.0 65.4 60.5
Basic cards-in-force
(millions)(a)
:
United States 32.8 30.3 27.7
Outside the United
States 23.2 21.0 19.9
Total 56.0 51.3 47.6
Average discount rate(b)
2.57% 2.60% 2.62%
Average basic cardmember
spending (dollars)(a)
$ 10,445 $ 9,460 $ 8,367
Average fee per card
(dollars)(a)
$ 35 $ 34 $ 35
Travel sales $ 20.6 $ 19.9 $ 16.0
Travel commissions and
fees/sales 8.6% 9.0% 9.4%
Worldwide Travelers
Cheque and prepaid
products:
Sales $ 19.7 $ 19.9 $ 19.2
Average outstanding $ 7.1 $ 7.0 $ 6.6
Average investments $ 7.8 $ 7.5 $ 7.1
Investment yield(c)
5.1% 5.4% 5.4%
Tax equivalent yield —
managed(c)
7.9% 8.4% 8.4%
International banking
Total loans $ 7.1 $ 6.9 $ 6.5
Private banking
holdings $ 20.3 $ 18.6 $ 16.2
(a)Card billed business includes activities related to proprietary cards, cards
issued under network partnership agreements, cash advances on propri-
etary cards and certain insurance fees charged on proprietary cards.
Cards-in-force include proprietary cards and cards issued under network
partnership agreements. Average basic cardmember spending and aver-
age fee per card are computed from proprietary card activities only.
(b)Computed as follows: Discount Revenue from all card spending (proprietary
and Global Network Services) at merchants divided by all billed business
(proprietary and Global Network Services) generating discount revenue at
such merchants. Only merchants acquired by the Company are included in
the computation. Discount rates have been retrospectively adjusted on a his-
torical basis from those previously disclosed, primarily to retain in the com-
putation the Global Network Services partner portion of discount revenue,
as well as the Company’s portion of discount revenue.
(c)Investment yield represents earnings on certain tax-exempt securities.
The tax equivalent yield — managed represents earnings on such tax-
exempt securities as if it had been earned on a taxable basis and assumes
an income tax-rate of 35 percent. See the U.S. Card Services segment
for additional information on managed basis presentation.
Financial Review
AXP / AR.2005
[ 30 ]](https://image.slidesharecdn.com/1041986/85/american-express-Annual-Reports-2005-32-320.jpg)
![Years Ended December 31,
(Billions, except percentages
and where indicated) 2005 2004 2003
Worldwide cardmember
receivables:
Total receivables $ 34.2 $ 31.1 $ 28.4
90 days past due
as a % of total 1.6% 1.8% 1.9%
Loss reserves
(millions): $ 942 $ 806 $ 916
% of receivables 2.8% 2.6% 3.2%
% of 90 days
past due 177% 146% 171%
Net loss ratio as a %
of charge volume 0.26% 0.26% 0.28%
Worldwide cardmember
lending — owned
basis(a)
:
Total loans $ 33.1 $ 26.9 $ 25.8
30 days past due as
a % of total 2.5% 2.4% 2.7%
Loss reserves (millions):
Beginning balance $ 972 $ 998 $ 1,030
Provision 1,227 1,016 1,121
Net write-offs (1,155) (1,040) (1,148)
Other (48) (2) (5)
Ending balance $ 996 $ 972 $ 998
% of loans 3.0% 3.6% 3.9%
% of past due 122% 151% 145%
Average loans $ 28.3 $ 25.9 $ 22.6
Net write-off rate 4.1% 4.0% 5.1%
Net finance charge
revenue/average
loans 9.1% 8.6% 9.0%
Worldwide cardmember
lending — managed
basis(b)
:
Total loans $ 54.3 $ 47.2 $ 45.3
30 days past due
as a % of total 2.4% 2.4% 2.7%
Loss reserves (millions):
Beginning balance $ 1,475 $ 1,541 $ 1,529
Provision 2,097 1,931 2,188
Net write-offs (2,055) (1,957) (2,171)
Other (48) (40) (5)
Ending balance $ 1,469 $ 1,475 $ 1,541
% of loans 2.7% 3.1% 3.4%
% of past due 114% 129% 127%
Average loans $ 48.9 $ 45.4 $ 41.6
Net write-off rate 4.2% 4.3% 5.2%
Net finance charge
revenue/average
loans 9.3% 9.0% 9.4%
(a)GAAP basis measurement reflects only cardmember loans included in the
Company’s Consolidated Balance Sheets.
(b)Includes on-balance sheet owned cardmember loans and off-balance
sheet securitized cardmember loans. See the U.S. Card Services segment
for additional information on managed basis presentation.
***
The following discussions regarding Consolidated
Results of Operations and Consolidated Liquidity and
Capital Resources are presented on a basis consistent
with GAAP unless otherwise noted.
Results of Operations for the Three Years Ended
December 31, 2005
The Company’s 2005 consolidated income from con-
tinuing operations rose 20 percent to $3.2 billion and
diluted earnings per share (EPS) from continuing opera-
tions rose 22 percent to $2.56. Consolidated income
from continuing operations for 2004 increased 15 per-
cent from 2003 and diluted EPS from continuing opera-
tions for 2004 increased 16 percent from 2003.
The Company’s 2005 consolidated net income rose
8 percent to $3.7 billion and diluted EPS rose 11 percent
to $2.97 as compared to 2004. Net income for 2005
includes $513 million of income from discontinued
operations as compared to $830 million in 2004. The
decrease in income from discontinued operations pri-
marily reflected the distribution of Ameriprise Common
Stock to the Company’s shareholders on September 30,
2005 while 2004 consolidated net income included a
full year of results from the discontinued operations.
Consolidated net income for 2004 increased 15 percent
from 2003.
Net income and EPS in 2004 reflected the $71 million
($109 million pretax) or $0.06 per diluted share
impact of the Company’s previously disclosed adoption
of the American Institute of Certified Public Accoun-
tants Statement of Position 03-1, “Accounting and
Reporting by Insurance Enterprises for Certain
Nontraditional Long-Duration Contracts and for Sepa-
rate Accounts.” The adoption of SOP 03-1 related to dis-
continued operations.
Both the Company’s revenues and expenses are affected
by changes in the relative values of non-U.S. currencies
to the U.S. dollar. The currency rate changes increased
both revenue and expense growth by less than 1 per-
centage point in 2005 and approximately 2 percentage
points in both 2004 and 2003.
Results from continuing operations for 2005 included
$286 million ($186 million after-tax) of reengineering
costs, principally related to $193 million of restructuring
costs within the business travel, international operations,
and the finance and technology areas, $242 million of
tax benefits related to the finalization of state tax returns
Financial Review
AXP / AR.2005
[ 31 ]](https://image.slidesharecdn.com/1041986/85/american-express-Annual-Reports-2005-33-320.jpg)
![and resolution of IRS audits of previous years’ tax
returns, a $123 million ($80 million after-tax) increase
in the provision for losses recorded in the fourth quarter
2005 reflecting substantially higher losses related to
increased bankruptcy filings resulting from the
October 17, 2005 change in bankruptcy legislation, a
$113 million ($73 million after-tax) benefit from the
recovery of September 11, 2001 related insurance
claims, and a $49 million ($32 million after-tax) provi-
sion to reflect the estimated costs related to Hurricane
Katrina. 2004 results from continuing operations
included a $117 million ($76 million after-tax) net gain
on the fourth quarter sale of the equipment leasing
product line, a charge of $115 million ($75 million after-
tax) reflecting a reconciliation of securitization-related
cardmember loans for balances accumulated over the
prior five-year period as a result of a computational
error, $99 million ($64 million after-tax) in restructur-
ing charges and a $60 million ($39 million after-tax)
benefit for a reduction in merchant-related reserves.
Revenues
Consolidated revenues for 2005 were $24.3 billion, up
10 percent from $22.0 billion in 2004. Revenues
increased due to higher discount revenues, increased
cardmember lending net finance charge revenue and
greater securitization income. Consolidated revenues
for 2004 were 12 percent higher than 2003 due prima-
rily to higher discount revenues as well as increased
travel and other commissions and fees.
Discount revenue for 2005 rose 14 percent to $11.7 bil-
lion as compared to 2004 as a result of a 16 percent
increase in worldwide billed business, a 10 percent
increase in average spending per proprietary basic card
and 9 percent growth in cards-in-force, offset in part by
a lower average discount rate. Selective repricing initia-
tives, continued changes in the mix of business and
volume-related pricing discounts will likely continue to
result in some erosion of the average discount rate over
time. U.S. billed business was up 16 percent reflecting
growth of 15 percent within the Company’s consumer
card business, a 20 percent increase in small business
spending and a 11 percent improvement in Corporate
Services volumes. Excluding the impact of foreign
exchange translation, total billed business outside the
U.S. increased 15 percent reflecting double-digit propri-
etary growth in all regions, with the largest increases in
Canada and Latin America. Additionally, within the
proprietary business, billed business outside the U.S.
reflected 13 percent growth in consumer and small busi-
ness spending, as well as a 14 percent increase in
Corporate Services volumes. Billed business related
to Global Network Services increased 36 percent
during 2005.
The increase in overall cards-in-force reflected both pro-
prietary and Global Network Services activities and
strong average customer retention levels. In the U.S. and
outside the U.S., 3.1 million and 2.5 million cards were
added during 2005, respectively. The increase in average
spending per proprietary basic card reflected a 9 percent
increase in the U.S. and a 13 percent increase outside
the U.S. Discount revenue rose 17 percent to $10.2 bil-
lion during 2004 as a result of an 18 percent increase
in billed business, from both growth in cards-in-force
and higher average cardmember spending per propri-
etary basic card, partially offset by a lower discount rate.
Cardmember lending net finance charge revenue of $2.6
billion in 2005 rose 16 percent, reflecting growth in
average worldwide lending balances on an owned basis
and a higher portfolio yield. During 2004, cardmember
lending net finance charge revenue increased 9 percent
to $2.2 billion as the 15 percent growth in the average
balance of the owned lending portfolio was partially off-
set by a lower average yield.
Securitization income, net increased 11 percent to $1.3
billion in 2005 on a greater average balance of securi-
tized loans, a higher trust portfolio yield and a decrease
in the trust portfolio write-offs, partially offset by greater
interest expense due to a higher coupon rate paid to cer-
tificate holders and an increase in the payment speed of
trust assets. Securitization income, net of $1.1 billion in
2004 was consistent with 2003.
Expenses
Consolidated expenses for 2005 were $20.0 billion, up
10 percent from $18.1 billion in 2004. The increase in
2005 was primarily driven by higher marketing, promo-
tion, rewards and cardmember services expenses,
greater provisions for losses and benefits, and increased
expenses for human resources, partially offset by lower
other expenses. Consolidated expenses in 2005
included $286 million of reengineering costs reflecting
$164 million of restructuring related severance costs,
principally within the business travel, international
operations, and finance and technology areas. Severance
costs are included in human resources expenses.
Restructuring costs also included $29 million related to
other exit costs and are included in other expenses. Con-
solidated expenses in 2005 also included a $49 million
provision to reflect the estimated costs related to Hur-
ricane Katrina, which was included in provisions for
Financial Review
AXP / AR.2005
[ 32 ]](https://image.slidesharecdn.com/1041986/85/american-express-Annual-Reports-2005-34-320.jpg)
![losses and benefits, and $16 million of spin-off expenses
related to Ameriprise principally included in profes-
sional services. These expenses were partially offset by
a $113 million benefit from the recovery of insurance
claims associated with September 11, 2001, included as
a reduction of other expenses. Consolidated expenses
for 2004 were 12 percent higher than 2003 driven by
higher marketing, promotion, rewards and cardmember
services expense and greater human resources costs,
partially offset by lower provisions for losses.
Marketing, promotion, rewards and cardmember
services expenses in 2005 increased 18 percent to
$5.8 billion versus a year ago reflecting higher market-
ing and promotion expenses and greater reward costs.
The increase in marketing and promotion expenses was
primarily driven by the Company’s ongoing global
brand advertising campaign and continued focus on
business-building initiatives. The growth in rewards
costs is attributed to volume growth, a higher redemp-
tion rate and strong cardmember loyalty program
participation. Marketing, promotion, rewards and
cardmember services expenses increased 30 percent
in 2004 to $5.0 billion as a result of higher cardmember
rewards and services expenses reflecting higher volumes
and greater rewards program participation and penetra-
tion, the continuation of brand and product advertising,
and an increase in selected card acquisition activities.
Human resources expenses in 2005 increased 6 percent
to $4.8 billion compared to 2004 due to severance
related costs resulting from the restructuring initiatives
noted above, higher management incentives, including
an additional year of stock-based compensation
expenses, merit increases and increased employee
benefit expenses, which were partially offset by
reengineering benefits. Human resources expenses
increased 16 percent in 2004 to $4.5 billion due to
increased costs related to management incentives, merit
increases and employee benefit expenses as well as the
impact of severance costs related to the reengineering of
certain operations.
Total provisions for losses and benefits in 2005
increased 22 percent over last year to $2.8 billion, as the
charge card and lending provisions rose 25 percent and
19 percent, respectively, and the other provisions grew
by 28 percent. The charge card and lending growth
reflected strong volume increases within both activities,
and higher provision rates mostly due to substantially
higher write-offs during the fourth quarter of 2005
within the lending business due to the October 17, 2005
change in the bankruptcy legislation as well as a $49
million provision during the year to reflect the estimated
costs related to Hurricane Katrina. Total provisions for
losses and benefits in 2004 declined 4 percent to $2.3
billion primarily due to a 7 percent reduction in card-
member lending provisions partially offset by the $115
million reconciliation of securitization-related card-
member loans charge in other provisions. Also, during
2004, a $60 million benefit was recorded for the reduc-
tion in merchant-related reserves.
The effective tax rate was 24 percent in 2005 compared
to 30 percent in 2004 and 32 percent in 2003. The
decrease in the effective tax rate for 2005 reflected the
impact of $242 million of tax benefits related to the
finalization of state tax returns and resolution of IRS
audits of previous years’ tax returns. Unless similar
adjustments arise, the Company’s effective tax rate in
2006 is expected to be more aligned with tax rates for
continuing operations in 2003 and 2004. However, the
actual rate in 2006 will depend on various factors,
including the profitability and mix of the Company’s
businesses, legislative developments and results of tax
audits, among others.
The effective tax rate was lower in 2004 as compared to
2003 primarily as a result of one-time and ongoing ben-
efits related to the changes in international funding
strategy during 2004, favorable variances between esti-
mates of foreign tax expense and returns actually filed
and favorable tax audit experience.
Discontinued Operations
Income from discontinued operations, net of tax for 2005
decreased 38 percent to $513 million from $830 million
in 2004 due to spin-off related costs of $127 million after-
taxpartiallyoffsetbya$63millionnetafter-taxgainoncer-
tain dispositions, primarily TBS. Additionally, as discussed
earlier, 2005 results from discontinued operations are
included through September 30, 2005 whereas 2004
included a full year of results from discontinued opera-
tions. Income from discontinued operations, net of tax
increased 25 percent in 2004 from 2003 primarily due to
improved results of Ameriprise. The discontinued opera-
tions generated revenues of $5.8 billion, $7.2 billion and
$6.3 billion for 2005, 2004 and 2003, respectively.
Consolidated Liquidity and Capital Resources
Capital Strategy
The Company generates equity capital primarily
through net income to fund current needs and future
business growth and to maintain a targeted debt rating.
Equity capital generated in excess of these needs is
Financial Review
AXP / AR.2005
[ 33 ]](https://image.slidesharecdn.com/1041986/85/american-express-Annual-Reports-2005-35-320.jpg)
![returned to shareholders through dividends and the
share repurchase program. The maintenance of a solid
equity capital base provides the Company with a strong
and stable debt rating and uninterrupted access to
diversified sources of financing to fund growth in its
assets, such as cardmember receivables and loans and
other items. The Company maintains flexibility in its
equity capital planning and has developed a contin-
gency funding plan described below to help ensure
that it has adequate sources of financing in difficult
economic or market environments.
The Company believes allocating capital to its growing
businesses with a return on risk-adjusted equity in
excess of their cost of capital will continue to build
shareholder value. The Company’s philosophy is to
retain earnings sufficient to enable it to meet its growth
objectives and, to the extent capital exceeds investment
opportunities, return excess capital to shareholders.
Assuming the Company achieves its financial objectives
of 12 to 15 percent EPS growth, 28 to 30 percent return
on shareholders’ equity and at least 8 percent revenue
growth, on average and over time, it will seek to return
to shareholders an average of 65 percent of capital gen-
erated, subject to business mix, acquisitions and rating
agency requirements. During 2005, through dividends
and share repurchases, excluding the dividend from the
Ameriprise spin-off, the Company returned approxi-
mately 48 percent of total capital generated to its share-
holders. The Company paid $597 million in dividends
and continued share repurchases as discussed below.
Since the inception of the Company’s current share
repurchase program in 1994, approximately 65 percent
of capital generated has been returned to shareholders.
The Company maintains sufficient equity capital to sup-
port its businesses. Flexibility is maintained to shift
capital among business units as appropriate. For
example, the Company may infuse additional capital
into subsidiaries to maintain capital at targeted levels,
which include consideration of debt ratings and regu-
latory requirements. These infused amounts can affect
both American Express Parent Company (Parent Com-
pany) capital and liquidity levels. The Company
maintains discretion to manage these effects, including
the issuance of public debt or the reduction of projected
common share buybacks. Additionally, the Company
may transfer short-term funds within the Company to
meet liquidity needs, subject to and in compliance with
various contractual and regulatory constraints.
Share Repurchases
The Company has in place a share repurchase program
to return equity capital in excess of its business needs
to shareholders. These share repurchases both offset the
issuance of new shares as part of employee compensa-
tion plans and reduce shares outstanding. The Company
repurchases its common shares primarily by open mar-
ket purchases. Common shares may also be purchased
from the Company-sponsored Incentive Savings Pro-
gram (ISP) to facilitate the ISP’s required disposal of
shares when employee-directed activity results in an
excess common share position. Such purchases are
made at market price without commissions or other
fees. During 2005, the Company purchased 34.6 million
common shares at an average price of $53.59, represent-
ing 30 million common shares at an average price of
$53.87 during the nine months ended September 30,
2005 (prior to the spin-off of Ameriprise) and 4 million
common shares at an average price of $51.33 during the
three months ended December 31, 2005 (after the spin-
off of Ameriprise). The lower repurchase activity during
2005 versus prior years reflects a more measured
approach to repurchases in light of the capital implica-
tions of the Ameriprise spin-off. Since the inception
of the share repurchase program in September 1994,
530 million shares have been acquired under total
authorizations to repurchase up to 570 million shares,
including purchases made under past agreements with
third parties.
Cash Flows
Cash Flows from Operating Activities
For the year ended December 31, 2005, net cash pro-
vided by operating activities was $8.0 billion. The Com-
pany generated net cash provided by operating activities
in amounts greater than net income for both the years
ended December 31, 2005 and 2004 primarily due to
provisions for losses and benefits, which represent
expenses in the Consolidated Statements of Income but
do not require cash at the time of provision. Similarly,
depreciation and amortization represent non-cash
expenses. In addition, net cash was provided by fluctua-
tions in other operating assets and liabilities. These
accounts vary significantly in the normal course of busi-
ness due to the amount and timing of various payments.
Net cash provided by operating activities was higher in
2004 than 2003, as a result of higher net income in
Financial Review
AXP / AR.2005
[ 34 ]](https://image.slidesharecdn.com/1041986/85/american-express-Annual-Reports-2005-36-320.jpg)
![2004. In addition, net cash was provided by fluctuations
in the Company’s operating assets and liabilities.
Management believes cash flows from operations,
available cash balances and short-term borrowings
will be sufficient to fund the Company’s operating
liquidity needs.
Cash Flows from Investing Activities
The Company’s investing activities primarily include
funding cardmember loans and receivables and the
Company’s available-for-sale investment portfolio.
For the year ended December 31, 2005, net cash of
$17.3 billion was used in investing activities primarily
due to net increases in cardmember receivables and
loans and cash spun-off to Ameriprise.
For the year ended December 31, 2004, net cash used
in investing activities decreased from 2003. The
decrease reflects a decrease in net cash used in investing
activities attributable to discontinued operations, par-
tially offset by an increase in purchases of investments.
Cash Flows from Financing Activities
The Company’s financing activities primarily include the
issuance of debt and taking customer deposits in addition
to the sale of investment certificates. The Company also
regularly repurchases its common shares.
In 2005, net cash provided by financing activities
was $6.4 billion primarily due to a net increase in
customers’ deposits.
In 2004, financing activities provided net cash greater
than in 2003, primarily due to a larger net increase in
total debt compared to 2003 offset by a net decrease in
customer deposits in 2004 versus a net increase in 2003
and higher share repurchase activity in 2004.
Financing Activities
The Company is committed to maintaining cost-
effective, well-diversified funding programs to support
current and future asset growth in its global businesses.
Its funding plan is structured to meet expected and
changing business needs to fund asset balances effi-
ciently and cost-effectively through diversified sources
of financing, to help ensure the availability of financing
in unexpected periods of stress, and to be integrated into
the asset-liability management of interest rate expo-
sures. In addition to its funding plan described below,
the Company’s contingent funding strategy is designed
to allow for the continued funding of business opera-
tions through difficult economic, financial market and
business conditions when access to its regular funding
sources could become diminished or interrupted.
The Company’s card businesses are the primary asset
generating businesses with significant assets in both
domestic and international cardmember receivable
and lending activities. As such, the Company’s most
significant borrowing and liquidity needs are associ-
ated with these card businesses. The Company pays
merchants for card transactions and bills cardmembers
accordingly. The Company funds merchant payments
during the period cardmember loans and receivables
are outstanding.
The following discussion includes information on both
a GAAP and managed basis. The managed basis presen-
tation includes debt issued in connection with the Com-
pany’s lending securitization activities, which are off-
balance sheet. The Company’s management views and
executes funding requirements on a managed basis
because asset securitization is just one of several ways
for the Company to fund cardmember loans.
Funding Strategy
The Company’s funding needs are met primarily
through the following sources:
® Commercial paper,
® Bank notes, institutional CDs and Fed Funds,
® Medium-term notes and senior unsecured debentures,
® Asset securitizations, and
® Long-term committed bank borrowing facilities in
selected non-U.S. markets.
The Company funds its cardmember receivables and
loans primarily through five entities. American Express
Credit Corporation (Credco) finances the vast majority
of worldwide cardmember receivables, while American
Express Centurion Bank (Centurion Bank) and Ameri-
can Express Bank, FSB (FSB) principally fund cardmem-
ber loans originated from the Company’s U.S. lending
activities. Two trusts are used by the Company in
connection with the securitization and sale of U.S.
receivables and loans generated in the ordinary course
of the Company’s card businesses. In 2005 and 2004,
the Company had uninterrupted access to the money
and capital markets to fund its business operations.
Financial Review
AXP / AR.2005
[ 35 ]](https://image.slidesharecdn.com/1041986/85/american-express-Annual-Reports-2005-37-320.jpg)
![The Company’s debt offerings are placed either directly
to investors, as in the case of its commercial paper pro-
gram through Credco, or through securities brokers or
underwriters. In certain international markets, bank
borrowings are used to partially fund cardmember
receivables and loans. During 2005 and 2004, the Com-
pany diversified its funding base by borrowing under
committed bank credit facilities as part of a change in
local funding strategies in select international markets.
Diversity of funding sources by type of debt instrument,
by maturity and by investor base provides additional
insulation from unforeseen events in the short-term
debt market. The Company had the following consoli-
dated debt, on both a GAAP and managed basis, and
customer deposits outstanding at December 31, 2005
and 2004:
(Billions) 2005 2004
Short-term debt $ 15.6 $ 14.3
Long-term debt 30.8 32.7
Total debt (GAAP basis) $ 46.4 $ 47.0
Off-balance sheet securitizations 21.2 20.3
Total debt (managed basis) $ 67.6 $ 67.3
Customer deposits $ 24.6 $ 20.1
Short-term debt is defined as any debt with an original
maturity of 12 months or less. The commercial paper
market represents the primary source of short-term
funding for the Company. Credco’s commercial paper is
a widely recognized name among short-term investors
and is a principal source of debt for the Company. At
December 31, 2005, Credco had $6.7 billion of com-
mercial paper outstanding, net of certain short-term
investments. The outstanding amount, net of certain
short-term investments, increased $2.9 billion or 76
percent from a year ago. Average commercial paper out-
standing, net of certain short-term investments, was
$6.1 billion and $5.7 billion in 2005 and 2004,
respectively. Credco currently manages the level of
commercial paper outstanding, net of certain short-
term investments, such that the ratio of its com-
mitted bank credit facility to total short-term debt,
which consists mainly of commercial paper, is not less
than 100 percent.
Centurion Bank and FSB raise short-term debt through
various instruments. Bank notes issued and Fed
Funds purchased by Centurion Bank and FSB totaled
approximately $5.9 billion as of December 31, 2005.
Centurion Bank and FSB also raise customer deposits
through the issuance of certificates of deposit to retail
and institutional customers. As of December 31, 2005,
Centurion Bank and FSB held $5.2 billion in customer
deposits. Centurion Bank and FSB each maintain $400
million of committed bank credit lines as a backup to
short-term funding programs. Long-term funding needs
are met principally through the sale of cardmember
loans in securitization transactions. The Asset/Liability
Committees of Centurion Bank and FSB provide man-
agement oversight with respect to formulating and rati-
fying funding strategy and to ensuring that all funding
policies and requirements are met.
The Company had short-term debt at December 31,
2005 and 2004 as follows:
(Billions, except percentages) 2005 2004
Short-term debt $ 15.6 $ 14.3
Short-term debt percentage
of total debt (GAAP basis) 33.7% 30.5%
Medium- and long-term debt is raised through the offer-
ing of debt securities in the U.S. and international capital
markets. Medium-term debt is generally defined as any
debt with an original maturity greater than 12 months
but less than 36 months. Long-term debt is generally
defined as any debt with an original maturity greater
than 36 months. At December 31, 2005, the Company
had the following amounts of medium- and long-term
debt outstanding:
(Billions)
Medium-term
Debt
Long-term
Debt
Total Medium-
and Long-term
Debt
American Express
Parent Company $ 2.0 $ 3.2 $ 5.2
American Express
Credit Corporation 8.6 8.3 16.9
American Express
Centurion Bank 3.0 1.4 4.4
American Express
Bank, FSB 2.4 — 2.4
American Express
Receivables
Financing Corp V
LLC — 1.2 1.2
Other Subsidiaries 0.1 0.6 0.7
Total $ 16.1 $ 14.7 $ 30.8
In 2005, medium- and long-term debt with maturities
ranging from 2 to 10 years was issued. The Company’s
2005 term offerings, which include those made by
Credco, Centurion Bank, FSB and the American Express
Issuance Trust (the Charge Trust), which is consolidated
by American Express Receivables Financing Corpora-
tion V LLC (RFC V), all directly or indirectly wholly-
owned subsidiaries of American Express Travel Related
Services Company, Inc. (TRS); and the AmericanFinancial Review
AXP / AR.2005
[ 36 ]](https://image.slidesharecdn.com/1041986/85/american-express-Annual-Reports-2005-38-320.jpg)
![Express Credit Account Master Trust (the Lending
Trust), are presented in the following table on a man-
aged basis:
(Billions) Amount
American Express Credit Corporation:
Fixed and Floating Rate Medium-Term Notes $ 4.7
American Express Centurion Bank:
Floating Rate Medium-Term Notes $ 0.9
American Express Bank, FSB:
Floating Rate Medium-Term Notes $ 1.0
American Express Receivables Financing
Corp V LLC:
Floating Rate Senior and Subordinated Notes $ 1.2
American Express Credit Account Master Trust:
Trust Investor Certificates (off-balance sheet) $ 5.4
Compared to the 2004 long-term funding activity, the
long-term debt issues in 2005 have longer average
maturities and a wider distribution along the maturity
spectrum to reduce and spread out the refinancing
requirement in future periods.
In 2006, the Company along with its subsidiaries,
Credco, Centurion Bank and FSB, as well as through its
securitization trusts, expects to issue approximately $24
billion in medium- and long-term debt to fund business
growth and refinance a portion of maturing medium-
and long-term debt. The Company expects that its
planned funding during the next year will be met
through a combination of sources similar to those on
which it currently relies. However, the Company con-
tinues to assess its needs and investor demand and may
change its funding mix. The Company’s funding plan is
subject to various risks and uncertainties, such as dis-
ruption of financial markets, market capacity and
demand for securities offered by the Company, regula-
tory changes, ability to sell receivables and the perfor-
mance of receivables previously sold in securitization
transactions. Many of these risks and uncertainties are
beyond the Company’s control.
The Company also maintains contingent liquidity
resources for alternative funding sources principally
through an investment liquidity portfolio discussed
below. In addition, as of December 31, 2005, Credco
had the ability to issue approximately $3 billion of debt
securities under shelf registration statements filed with
the Securities and Exchange Commission (SEC).
The Company believes that its funding strategy allows
for the continued funding of business operations
through difficult economic, financial market and busi-
ness conditions.
The Company’s funding strategy is designed to maintain
high and stable debt ratings from the major credit rating
agencies, Moody’s, Standard & Poor’s and Fitch Ratings.
Maintenance of high and stable debt ratings is critical to
ensuring the Company has continuous access to the
capital and credit markets. It also enables the Company
to reduce its overall borrowing costs. At December 31,
2005, its debt ratings were as follows:
Moody’s
Standard
& Poor’s
Fitch
Ratings
Short-term P-1 A-1 F1
Senior unsecured A1 A+ A+
The Company actively manages the risk of liquidity and
cost of funds resulting from the Company’s financing
activities. Management believes a decline in the
Company’s long-term credit rating by two levels could
result in the Company having to significantly reduce
its commercial paper and other short-term borrowings.
Remaining borrowing requirements would be addressed
through other means such as the issuance of long-
term debt, additional securitizations, increased deposit
taking, the sale of investment securities or drawing on
existing credit lines. This would result in higher interest
expense on the Company’s commercial paper and other
debt, as well as higher fees related to unused lines
of credit. The Company believes a two level down-
grade is highly unlikely due to its capital position and
growth prospects.
Parent Company Funding
Total Parent Company long-term debt outstanding was
$5.2 billion and $5.7 billion at December 31, 2005 and
2004, respectively. At December 31, 2005 and 2004, the
Parent Company had $4.3 billion of debt or equity secu-
rities available for issuance under shelf registrations filed
with the SEC.
The Board of Directors authorized a Parent Company
commercial paper program. This program would be
supported by a $2.1 billion multi-purpose committed
bank credit facility that expires incrementally through
2009. There was no Parent Company commercial paper
outstanding during 2005 and 2004, and no borrowings
have been made under its bank credit facility.
Financial Review
AXP / AR.2005
[ 37 ]](https://image.slidesharecdn.com/1041986/85/american-express-Annual-Reports-2005-39-320.jpg)
![Asset Securitizations
The Company periodically securitizes cardmember
receivables and loans arising from its card business. The
securitization market provides the Company with cost-
effective funding. Securitization of cardmember receiv-
ables and loans is accomplished through the transfer of
those assets to a trust, which in turn issues securities to
third-party investors collateralized by the transferred
assets. The proceeds from issuance are distributed to the
Company, through its wholly-owned subsidiaries, as
consideration for the transferred assets. Securitization
transactions are accounted for as either a sale or secured
borrowing, based upon the structure of the transaction.
Securitization of cardmember receivables generated
under designated consumer charge card accounts is
accomplished through the transfer of cardmember
receivables to the Charge Trust, beginning in 2005 when
the trust was established, or the American Express Master
Trust (AEMT), in periods prior to July 2005. AEMT was
dissolved during the third quarter of 2005. Securitiza-
tions of these receivables are accounted for as secured
borrowings because the Charge Trust and AEMT are not
qualifying special purpose entities (QSPE). Accordingly,
the related assets being securitized are not accounted for
as sold and continue to be reported as owned assets on
the Company’s Consolidated Balance Sheets. The related
securities issued to third-party investors are reported as
long-term debt on the Company’s Consolidated Balance
Sheets. As of December 31, 2005 and 2004, the Charge
Trust and AEMT held total assets of $9.9 billion and $7.4
billion, respectively.
Securitization of cardmember loans generated under
designated consumer lending accounts is accomplished
through the transfer of cardmember loans to a QSPE, the
Lending Trust. Securitizations of loans transferred to the
Lending Trust are accounted for as sales. Accordingly,
the Company removes the loans from its Consolidated
Balance Sheets and recognizes both a gain on sale and
other retained interests in the securitization as discussed
below. As of December 31, 2005 and 2004, the Lending
Trust held total assets of $28.9 billion and $24.7 billion,
respectively, of which $21.2 billion and $20.3 billion,
respectively, had been sold.
The Company’s continued involvement with the secu-
ritized cardmember loans includes the process of man-
aging and servicing the securitized loans through its
subsidiary, TRS, for which it earns a fee. In addition, the
Company, through its subsidiaries, maintains an undi-
vided, pro-rata interest in all loans transferred (or sold),
which is referred to as seller’s interest, and is generally
equal to the balance of the loans in the Lending Trust
less the investors’ portion of those assets. As the amount
of the loans in the Lending Trust fluctuates due to
customer payments, new charges and credit losses, the
carrying amount of the seller’s interest will vary. How-
ever, the seller’s interest is required to be maintained at
a minimum level of 7 percent of the outstanding
invested amount in the Lending Trust. As of
December 31, 2005, the amount of seller’s interest was
approximately 25 percent of outstanding invested
amount, well above the minimum requirement.
The Company also retains subordinated interests in the
securitized loans. Such interests include one or more
investments in tranches of the securitization and an
interest-only strip. As of December 31, 2005 and 2004,
the fair value of the subordinated retained interests was
$279 million and $315 million, respectively.
Under the respective terms of the Lending Trust and the
Charge Trust agreements, the occurrence of certain
events could result in either trust being required to
paydown the investor certificates and notes before their
expected payment dates over an early amortization
period. An example of such an event is, for either trust,
the failure of the securitized assets to generate specified
yields over a defined period of time.
No such events have occurred during 2005 and 2004,
and the Company does not expect an early amortization
trigger event to occur prospectively. In the event of a
paydown of the Lending Trust, $21.2 billion of assets
would revert to the balance sheet and an alternate source
of funding of a commensurate amount would have to be
obtained. Had a total paydown of the Lending Trust
hypothetically occurred at a single point in time at
December 31, 2005, the cumulative negative effect on
results of operations would have been approximately
$751 million pretax to re-establish reserves and to
derecognize the retained interests related to these
securitizations that would have resulted when the
securitized loans reverted back onto the balance sheet.
Virtually no financial statement impact would occur from
a paydown of the Charge Trust, but an alternate source of
funding for the $1.2 billion of securities outstanding at
December 31, 2005 would have to be obtained.
With respect to both the Lending Trust and the Charge
Trust, a decline in the actual or implied short-term credit
rating of TRS below A-1/P-1 will trigger a requirement that
TRS, as servicer, transfer collections on the securitized
assets to investors on a daily, rather than a monthly, basis
or make alternative arrangements with the rating agencies
Financial Review
AXP / AR.2005
[ 38 ]](https://image.slidesharecdn.com/1041986/85/american-express-Annual-Reports-2005-40-320.jpg)
![to allow TRS to continue to transfer collections on a
monthly basis. Such alternative arrangements include
obtaining appropriate guarantees for the performance of
the payment and deposit obligations of TRS, as servicer.
No officer, director or employee holds any equity inter-
est in the trusts or receives any direct or indirect
compensation from the trusts. The trusts in the Compa-
ny’s securitization programs do not own stock of the
Company or the stock of any affiliate. Investors in the
securities issued by the trusts have no recourse against
the Company if cash flows generated from the securi-
tized assets are inadequate to service the obligations of
the trusts.
Liquidity
The Company balances the trade-offs between having
too much liquidity, which can be costly and limit
financial flexibility, with having inadequate liquidity,
which may result in financial distress during a liquidity
event (see Contingent Liquidity Planning section
below). The Company considers various factors in
determining its liquidity needs, such as economic and
financial market conditions, seasonality in business
operations, growth in business segments, cost and avail-
ability of alternative liquidity sources and credit rating
agency considerations.
The Company believes that its existing sources of
funding provide sufficient depth and breadth to meet
normal operating needs. In addition, alternative
liquidity sources are available, mainly in the form of the
liquidity portfolio, securitizations of cardmember
receivables and loans and committed bank credit
facilities, to provide uninterrupted funding over a
twelve-month period should access to unsecured debt
sources become impaired.
Liquidity Portfolio
During the normal course of business, funding activities
may raise more proceeds than are necessary for
immediate funding needs. These amounts are invested
principally in short-term overnight, highly liquid
instruments. In addition, in the fourth quarter of 2003,
the Company began a program to develop a liquidity
portfolio in which proceeds raised from such borrow-
ings are invested in longer term, highly liquid instru-
ments, such as U.S. Treasury securities. At December 31,
2005, the Company held $5.0 billion of U.S. Treasury
notes under this program.
The invested amounts of the liquidity portfolio pro-
vide back-up liquidity, primarily for the commercial
paper program at Credco, and also flexibility for
other short-term funding programs at Centurion Bank
and FSB. Instruments held within this program will be
of the highest credit quality and most liquid of invest-
ment instruments available. The Company can easily
sell these securities or enter into sale/repurchase agree-
ments to immediately raise cash proceeds to meet
liquidity needs.
Committed Bank Credit Facilities
The Company maintained committed bank credit facili-
ties with 43 large financial institutions totaling $13.4
billion, of which $3.3 billion was outstanding under
these facilities. During 2005, the Company renewed and
extended a total of $7 billion of these credit line facili-
ties. Credco has the right to borrow a maximum amount
of $12.6 billion (including amounts outstanding) under
these facilities, with a commensurate maximum $2.1
billion reduction in the amount available to the Parent
Company. The Company’s facilities expire as follows
(billions): 2006, $2.0; 2009, $6.4; and 2010, $5.0.
The availability of the credit lines is subject to the
Company’s compliance with certain financial covenants,
including the maintenance by the Company of
consolidated tangible net worth of at least $4.1 billion
($9.0 billion prior to the spin-off of Ameriprise), the
maintenance by Credco of a 1.25 ratio of combined
earnings and fixed charges to fixed charges, and the
compliance by Centurion Bank and FSB with appli-
cable regulatory capital adequacy guidelines. At
December 31, 2005, the Company’s consolidated tan-
gible net worth was approximately $9.2 billion, Credco’s
ratio of combined earnings and fixed charges to fixed
charges was 1.41 and Centurion Bank and FSB each
exceeded the Federal Deposit Insurance Corporation’s
well-capitalized regulatory capital adequacy guidelines.
Committed bank credit facilities do not contain material
adverse change clauses, which may preclude borrowing
under the credit facilities. The facilities may not be ter-
minated should there be a change in the Company’s
credit rating.
In addition, TRS, Centurion Bank, Credco, American
Express Overseas Credit Corporation Limited, a wholly-
owned subsidiary of Credco, and American Express Bank
Ltd. have established a program for the issuance, outside
the United States, of debt instruments to be listed on the
Luxembourg Stock Exchange. The maximum aggregate
principal amount of debt instruments outstanding at any
one time under the program cannot exceed $6.0 billion. Financial Review
AXP / AR.2005
[ 39 ]](https://image.slidesharecdn.com/1041986/85/american-express-Annual-Reports-2005-41-320.jpg)
![At December 31, 2005 and 2004, $3.1 billion and
$3.4 billion of debt, respectively, were outstanding under
this program.
Contingent Liquidity Planning
The Company has developed a contingent funding plan
that enables it to meet its daily funding obligations when
access to unsecured funds in the debt capital markets is
impaired or unavailable. This plan is designed to ensure
that the Company and all of its main operating entities
could continuously maintain normal business operations
for a twelve-month period in which its access to unse-
cured funds is interrupted. In addition, the Company
maintains substantial flexibility to reduce its operating
cash uses, such as through its share repurchase program,
and the delay or deferment of certain operating expenses.
The funding sources that would be relied upon depend
on the exact nature of such a hypothetical liquidity cri-
sis; nonetheless, the Company’s liquidity sources are
designed with the goal of ensuring there is sufficient
cash on hand to fund business operations over a twelve-
month period regardless of whether the liquidity crisis
was caused by an external, industry or Company spe-
cific event. The contingent funding plan also addresses
operating flexibilities in quickly making these funding
sources available to meet all financial obligations. The
simulated liquidity crisis is defined as a sudden and
unexpected event that temporarily impairs access to or
makes unavailable funding in the unsecured debt mar-
kets. The contingent funding plan includes access to
diverse sources of alternative funding. Such sources
include but are not limited to its liquidity investment
portfolio, committed bank lines, intercompany borrow-
ings, sale of consumer and small business loans and
cardmember receivables through its existing securitiza-
tion programs and sale of other eligible receivables. The
Company estimates that, under a worst case liquidity
crisis scenario, it has in excess of $37.6 billion in alter-
nate funding sources available to cover cash needs over
the first 60 days after a liquidity crisis has occurred.
Contingent Securitization Capacity
A key source in the Company’s contingent funding
plan is asset securitization. Management expects that
$27.2 billion of additional consumer loans, small busi-
ness loans and cardmember receivables could be sold to
existing securitization trusts. The Company has added,
through the establishment of the Charge Trust, the
capabilities to sell a wider variety of cardmember
receivable portfolios to further enhance the Company’s
flexibility in accessing diverse funding sources on a
contingency basis.
The Company believes that the securitized financing
would be available even through adverse conditions due
to the structure, size and relative stability of the secu-
ritization market. Proceeds from secured financings
completed during a liquidity crisis could be used to
meet current obligations, to reduce or retire other con-
tingent funding sources such as bank credit lines, or a
combination of the two. However, other factors affect
the Company’s ability to securitize loans and receiv-
ables, such as credit quality of the assets and the legal,
accounting, regulatory and tax environment for securi-
tization transactions. Material changes in any of these
factors may potentially limit the Company’s ability to
securitize its loans and receivables and could introduce
certain risks to the Company’s ability to meet its finan-
cial obligations. In such a case, the use of investment
securities, asset dispositions, asset monetization strate-
gies and flexibility to reduce operating cash needs could
be utilized to meet its liquidity needs.
Off-Balance Sheet Arrangements and
Contractual Obligations
The Company has identified both on- and off-balance
sheet transactions, arrangements, obligations and
other relationships that may have a material current or
future effect on its financial condition, changes in
financial condition, results of operations or liquidity and
capital resources.
Contractual Obligations
The contractual obligations identified in the table below
include both on- and off-balance sheet transactions that
represent material expected or contractually committed
future obligations of the Company. Purchase obligations
include agreements to purchase goods and services that
are enforceable and legally binding on the Company and
that specify significant terms, including: fixed or mini-
mum quantities to be purchased; fixed, minimum or
variable price provisions; and the approximate timing of
the transaction.
Financial Review
AXP / AR.2005
[ 40 ]](https://image.slidesharecdn.com/1041986/85/american-express-Annual-Reports-2005-42-320.jpg)
![Payments due by year
(Millions) Total 2006 2007–2008 2009–2010
2011 and
thereafter
On-Balance Sheet:
Long-term debt $ 30,781 $ 5,384 $ 11,430 $ 9,877 $ 4,090
Other long-term liabilities 4,815 1,617 1,187 816 1,195
Off-Balance Sheet:
Lease obligations 2,172 229 385 272 1,286
Purchase obligations(a)
3,523 1,508 1,413 596 6
Total $ 41,291 $ 8,738 $ 14,415 $ 11,561 $ 6,577
(a)The purchase obligation amounts include expected spend by period under contracts that were in effect at December 31, 2005. Minimum contractual
payments associated with purchase obligations, including termination payments, were $360 million.
The Company also has certain contingent obligations for
worldwide business arrangements. These payments
relate to contractual agreements with partners entered
into as part of the ongoing operation of the Company’s
business, primarily with co-brand partners. The
contingent obligations under such arrangements were
$3.3 billion as of December 31, 2005.
In addition to the off-balance sheet contractual obli-
gations noted above, the Company has off-balance sheet
arrangements that include guarantees, retained interests
in structured investments, unconsolidated variable
interest entities and other off-balance sheet arrange-
ments as more fully described below.
Guarantees
The Company’s principal guarantees are associated with
cardmember services provided to enhance the value of
owning an American Express card. At December 31,
2005, the Company had guarantees totaling approxi-
mately $97 billion related to cardmember protection
plans, as well as other guarantees in the ordinary course
of business that are within the scope of Financial
Accounting Standards Board (FASB) Interpretation
No. 45, “Guarantor’s Accounting and Disclosure
Requirements for Guarantees, Including Indirect Guar-
antees of Indebtedness of Others” (FIN 45). Expenses
relating to actual claims under these guarantees for 2005
and 2004 were approximately $15 million and $20 mil-
lion, respectively.
The Company had $1.1 billion of bank standby letters
of credit and bank guarantees and other letters of credit
within the scope of FIN 45. At December 31, 2005, the
Company held approximately $936 million of collateral
supporting standby letters of credit and guarantees.
Additionally, at December 31, 2005 the Company had
$493 million of loan commitments and other lines of
credit as well as $529 million of bank standby letters of
credit, bank guarantees and bank commercial and other
bank letters of credit that were outside the scope of
FIN 45. At December 31, 2005, the Company held $337
million of collateral supporting these bank, commercial
and other letters and lines of credit.
See Note 11 to the Consolidated Financial Statements for
further discussion regarding the Company’s guarantees.
Retained Interests In Assets Transferred To
Unconsolidated Entities
The Company held, as an investment, $70 million of
subordinated retained interests from securitizations and
$209 million of an interest-only strip in the cardmember
loan securitization trust at December 31, 2005. See the
Consolidated Liquidity and Capital Resources section
and Note 5 to the Consolidated Financial Statements for
details regarding the Company’s securitization trusts.
Certain Other Off-Balance Sheet Arrangements
At December 31, 2005, the Company had approxi-
mately $213 billion of unused credit available to
cardmembers, as part of established lending product
agreements. Total unused credit available to cardmem-
bers does not represent potential future cash
requirements as a significant portion of this unused
credit will likely not be drawn. The Company’s charge
card products have no pre-set limit and, therefore, are
not reflected in unused credit available to cardmembers.
As discussed in the Consolidated Liquidity and Capital
Resources section, the Company’s securitizations of
cardmember loans are also off-balance sheet. The Com-
pany’s cardmember receivables securitizations remain
on the Consolidated Balance Sheets.
See Note 11 to the Consolidated Financial Statements
for further discussion regarding the Company’s other
off-balance sheet arrangements.
Financial Review
AXP / AR.2005
[ 41 ]](https://image.slidesharecdn.com/1041986/85/american-express-Annual-Reports-2005-43-320.jpg)
![Risk Management
Introduction
Risk management is a key lever in driving profitable
growth at the Company. By creating transparent limits
on risk exposures, optimizing investment decision-
making and identifying unacceptable risks, risk man-
agement plays a fundamental role in the Company’s
efforts to create shareholder value.
In addition to business risk, the Company recognizes
three fundamental sources of risk:
® Credit Risk,
® Market Risk, and
® Operational Risk.
These risk types are interrelated and span the Company’s
business units and geographic locations. Given the
nature and scope of these risks, the Company believes
in centrally managing them at an enterprise level. Fur-
ther, management has adopted well-defined principles
regarding credit, market and operational risk to guide
the Company’s business strategy and achieve long-term
shareholder objectives. The Company views underwrit-
ing credit risk as a significant lever in driving profitable
growth. Market risk is hedged or managed within estab-
lished parameters to sustain such earnings growth,
while operational risk arising from the Company’s busi-
ness activities is carefully monitored to maintain it
within acceptable limits.
Principles
The implementation of the Company’s risk management
objectives is based on the following three principles:
® Independence of risk management oversight;
® Management of risk exposures through Board-
approved risk limits; and
® Ultimate business ownership for risk-return deci-
sion making.
The Company’s risk management leaders partner with
business unit managers in making risk-return decisions
by utilizing standardized risk metrics with predictable
outcomes. The measurement and reporting of these
risks are performed independently by risk management
leaders. However, business unit managers ultimately
remain accountable for the outcome of risk-return
decisions within these established limits.
Governance
Risk management governance at the Company begins
with Board oversight of risk management parameters.
The Board’s Audit Committee approves the Company’s
risk management objectives, as well as major risk limits,
policies and key process controls. Supporting the Board
in its oversight function is the Global Leadership Team
(GLT) and the Enterprise Risk Management Committee
(ERMC). In addition to risk-return decision-making, the
GLT works with the ERMC to increase awareness
throughout the Company of risk-return tradeoffs on a
daily basis. The ERMC leads the Company’s overall risk
management activities by measuring and monitoring
enterprise-wide risk, and establishing enterprise-wide
risk management policies and practices.
Daily risk management occurs at the business unit level
where the processes and infrastructure necessary to
measure and manage risk are integrated into business
unit goals. Business unit managers, in partnership with
independent risk management leaders, make decisions
regarding the assumption of risks that are within estab-
lished limits and confined to an individual business
unit. The Company has also developed a process that
provides increased scrutiny throughout the risk manage-
ment governance structure and requires higher levels
of approval for exposures above defined risk thresholds
or that may impact different business units.
The escalation process is designed so that the large major-
ity of transactions and initiatives can continue to be
accommodated within existing business unit risk man-
agement processes, while ensuring that risks with
enterprise-wide implications receive enhanced scrutiny.
Roles and Responsibilities
The ERMC is chaired by the Company’s Chief Risk
Officer. Given the key role of credit risk in the Company
business model, credit officers responsible for (i) card-
member credit risk management services, (ii) the
centralized functional responsibilities for worldwide
card fraud and information management, and (iii) bank-
ing services, all report directly to the Chief Risk Officer.
In addition, as the Chair of the ERMC, the Chief Risk
Officer is also responsible for managing and controlling
overall credit, market and operational risk exposures
throughout the Company.
In addition to the Chief Risk Officer, the ERMC is
composed of:
® The senior risk leaders responsible for enter-
prise-wide market and operational risk (including
Internal Audit);
® The enterprise-wide leaders of compliance, control-
lership and technologies; and
Financial Review
AXP / AR.2005
[ 42 ]](https://image.slidesharecdn.com/1041986/85/american-express-Annual-Reports-2005-44-320.jpg)
![® The senior risk leaders of the Company’s three
operating segments: U.S. Card Services, International
Card & Global Commercial Services and Global
Network & Merchant Services.
As the most senior risk management entity, the ERMC
draws on its significant enterprise-wide risk expertise to
analyze risk comprehensively and determine acceptable
risk thresholds across the Company.
In order to enhance its enterprise-wide risk assessment,
the ERMC continues to upgrade risk management capa-
bilities in order to better measure, manage and transpar-
ently report on risk concentrations. The ERMC also
launches focused risk management initiatives to assess
the drivers of significant exposures.
Credit Risk Management Process
Credit risk is defined as the risk of loss from obligor or
counterparty default. Leadership for overall credit risk
management at the Company rests with the Chief Risk
Officer as Chairman of the ERMC. Credit risks in the
Company can be divided into two broad categories, each
with distinct risk management tools and metrics: con-
sumer credit risk and institutional credit risk.
Consumer Credit Risk
Consumer credit risk arises principally from the Com-
pany’s portfolio of cardmember receivables and loans.
Since such portfolio consists of millions of borrowers
across multiple geographies, occupations and social seg-
ments, its risk is substantially reduced through diversi-
fication. In addition, the Company benefits from the fact
that the credit profile of its cardmembers is better than
that of its many competitors, which is a combined result
of its underwriting and customer management policy
and of reward programs and other incentives embedded
in the structure of the Company’s products. The level of
consumer credit risk losses is more driven by general
economic and legal conditions than by borrower-
specific events.
Consumer credit risk is managed within a highly orga-
nized structure of Board-approved policies covering all
facets of credit extension, including approvals, authori-
zations, line management and fraud prevention. The
policies ensure consistent application of credit manage-
ment principles and standardized reporting of asset
quality and loss recognition metrics across domestic and
international portfolios. Moreover, consumer credit risk
management is supported by sophisticated proprietary
scoring and decision-making models.
Credit underwriting decisions are made based on a
sophisticated evaluation of product economics and
customer behavior predictions. The Company has
developed unique decision logic for each customer
interaction, including prospect targeting, new accounts,
line assignment, line management, balance transfer,
cross sell and account management. Each decision has
benefited from sophisticated modeling capability that
uses the most up-to-date information on customers,
including extensive payment history, purchase data and
insights from proprietary data feeds from all three
credit bureaus.
In addition to the impact of improved risk management
processes, the Company’s overall consumer credit per-
formance has also benefited from the shifting mix of the
portfolio towards products that reward the customer for
spending. Rewards attract higher spending from pre-
mium customers, which in turn leads to lower credit
loss rates.
While consumer credit risk indicators have continued to
show steady progress, the Company’s objective of driv-
ing profitable growth may be accomplished by the
launch of new products or of existing products in new
markets, which may exhibit higher loss rates.
The asset quality of the consumer portfolio is discussed
in U.S. Card Services’ Results of Operations section.
Institutional Credit Risk
Institutional credit risk arises within the Company’s cor-
porate card, large establishment services and network
services businesses. Unlike consumer credit risk, insti-
tutional credit risk is characterized by a lower loss
frequency but higher severity that, although affected by
general economic conditions, is generally linked to
more borrower-specific events. The Company’s senior
risk officers recognize that the absence of large losses in
any given year or over several years is not representative
of the risk of an institutional portfolio, given the infre-
quency of loss events in such a portfolio.
In 2005, the ERMC executed a major project to upgrade
risk management practices relating to institutional
credit risk exposures. This project delivered a set of
guidelines and escalation procedures for scrutinizing
institutional exposures based on the size and risk of
Company exposures. The ERMC enhanced its infra-
structure for gathering, classifying, quantifying and dis-
tributing its institutional credit exposure data so as to
embed it in all decision-making throughout the Company. Financial Review
AXP / AR.2005
[ 43 ]](https://image.slidesharecdn.com/1041986/85/american-express-Annual-Reports-2005-45-320.jpg)
![Additionally, a specific airline risk group was created in
order to ensure these institutional relationships, which
have become a key component of the Company’s spend-
centric business model, are appropriately assessed as to
their risk.
Market Risk Management Process
Market risk represents the loss in value of portfolios and
financial instruments due to adverse changes in market
variables. The Company’s non-trading related market
risk consists of:
® Interest rate risk in its card, insurance and certificate
businesses; and
® Foreign exchange risk in its international operations.
Market risk is centrally managed by the corporate trea-
surer who also acts as the Vice Chairman of the ERMC.
Within each business, market risk exposures are moni-
tored and managed by various asset liability committees
within the parameters of Board-approved policies cover-
ing derivative financial instruments, funding and invest-
ments. With respect to derivative financial instruments,
the value of such instruments is derived from an under-
lying variable or multiple variables, including commod-
ity, equity, foreign exchange and interest rate indices or
prices. These instruments enable the end users to
increase, reduce or alter exposure to various market risks
and, as such, are an integral component of the Company’s
market risk and related asset liability management strat-
egy and processes. Use of derivative financial instruments
is incorporated into the discussion below as well as
Note 10 to the Consolidated Financial Statements.
Market exposure is a byproduct of the delivery of prod-
ucts and services to cardmembers. Interest rate risk is
generated by funding cardmember charges and fixed
rate loans with variable rate borrowings. Such assets and
liabilities generally do not create naturally offsetting
positions as it relates to basis, re-pricing, or maturity
characteristics. By using derivative financial instru-
ments, such as interest rate swaps, the interest rate pro-
file can be adjusted to maintain and manage a desired
profile. A portion of interest rate risk exposure usually
remains unhedged, to enable the Company to take a
view on interest rate changes. In addition, foreign
exchange risk is generated by cardmember cross-
currency charges, foreign currency denominated
balance sheet exposures and foreign currency earnings
in international units. The Company hedges this market
exposure to the extent it is economically justified
through various means including the use of derivative
financial instruments, such as foreign exchange forward
and cross-currency swap contracts, which can help
“lock in” the Company’s exposure to specific currencies
at a specified rate. As a general matter, virtually all
foreign exchange risk arising from cardmember cross-
currency charges, foreign currency balance sheet
exposures and foreign currency earnings is risk man-
aged to reduce the Company’s exposure to currency rate
fluctuations.
For the Company’s charge card and fixed rate lending
products interest rate exposure is managed through a
combination of shifting the mix of funding toward
fixed rate debt and through the use of derivative
instruments, with an emphasis on interest rate swaps,
that effectively fix interest expense for the length of the
swap. The Company endeavors to lengthen the maturity
of interest rate hedges in periods of falling interest rates
and to shorten their maturity in periods of rising interest
rates. For the majority of its cardmember loans, which
are linked to a floating rate base and generally reprice
each month, the Company uses floating rate funding.
The Company regularly reviews its strategy and may
modify it. Non-trading interest rate derivative financial
instruments, primarily interest rate swaps, with notional
amounts of approximately $22 billion and $38 billion
were outstanding at December 31, 2005 and 2004,
respectively. These derivatives generally qualify for
hedge accounting. A portion of these derivatives out-
standing as of December 31, 2005 extend to 2015.
The detrimental effect on the Company’s pretax earnings
of a hypothetical 100 basis point increase in interest
rates would be approximately $180 million ($158 mil-
lion related to the U.S. dollar), based on the 2005
year-end positions. This effect, which is calculated using
a static asset liability gapping model to quantify the
impact of a 100 basis point shift, is primarily a function
of the extent of variable rate funding of charge card
and fixed rate lending products, to the degree that
interest rate exposure is not managed by derivative
financial instruments.
The Company’s foreign exchange risk arising from
cross-currency charges and balance sheet exposures, for-
eign currency earnings and translation exposure of for-
eign operations is managed primarily by entering into
agreements to buy and sell currencies on a spot or for-
ward basis as well as foreign currency options. At Decem-
ber 31, 2005 and 2004, foreign currency products with
total notional amounts of approximately $30 billion and
$37 billion, respectively were outstanding. Derivative
hedging activities related to cross-currency charges,
Financial Review
AXP / AR.2005
[ 44 ]](https://image.slidesharecdn.com/1041986/85/american-express-Annual-Reports-2005-46-320.jpg)
![balance sheet exposures and foreign currency earnings
generally do not qualify for hedge accounting. Derivative
hedging activities related to translation exposure of for-
eign operations generally qualify for hedge accounting.
With respect to cross-currency charges and balance
sheet exposures, including related foreign exchange for-
ward contracts outstanding, the effect on the Company’s
earnings of a hypothetical 10 percent change in the
value of the U.S. dollar would be immaterial as of
December 31, 2005. With respect to foreign currency
earnings, the adverse impact on pretax income of a 10
percent strengthening of the U.S. dollar related to antici-
pated overseas operating results for the next twelve
months, including related foreign exchange option con-
tracts entered into in January 2006, would hypotheti-
cally be $65 million as of December 31, 2005. With
respect to translation exposure of foreign operations,
including related foreign exchange forward contracts
outstanding, a 10 percent change in the U.S. dollar
would result in a $12 million reduction in equity as of
December 31, 2005.
In conjunction with its international banking opera-
tions, the Company also uses derivative financial instru-
ments to manage market risk related to specific interest
rate, foreign exchange and price risk exposures arising
from deposits, loans and debt and equity securities
holdings as well as its limited trading positions, dis-
cussed below. At December 31, 2005 and 2004, interest
rate products related to trading and non-trading posi-
tions with notional amounts totaling approximately $17
billion and $12 billion, respectively, were outstanding.
Additionally, equity products related to trading and
non-trading positions with notional amounts of $740
million and $582 million, respectively, were outstand-
ing at December 31, 2005 and 2004. These derivatives
generally do not qualify for hedge accounting.
As noted, market risk arises from the international
banking trading activities in foreign exchange (both
directly through daily exchange transactions as well as
through foreign exchange derivatives), interest rate
derivatives (primarily swaps), equity derivatives and
securities trading. Proprietary positions taken in foreign
exchange instruments, interest rate risk instruments and
the securities portfolios are monitored daily against
Value-at-Risk (VaR) limits. The VaR methodology used
to measure the daily exposure from trading activities is
calculated using a parametric technique using a
correlation matrix based upon historical data.
The VaR measure uses a 99 percent confidence interval
to estimate potential trading losses over a one-day
period. The average VaR for trading activities was less
than $1 million for both 2005 and 2004.
Operational Risk Management Process
The Company defines operational risk as the risk of not
achieving business objectives due to failed processes,
people or information systems, or from the external
environment (e.g., natural disasters). The Company rec-
ognizes that operational risk is inherent in all business
activities and can impact an organization through direct
or indirect financial loss, brand or reputational damage,
customer dissatisfaction, or legal or regulatory penalties.
The management of operational risk is an important
priority for the Company. To mitigate such operational
risks, the Company has developed a comprehensive
operational risk program that enables the identification,
measurement, monitoring and reporting of inherent and
emerging operational risks. During 2005, this program,
utilizing the same process risk self assessment method-
ology used to facilitate compliance with Section 404 of
the Sarbanes Oxley Act, has been extended to
non-financial operational risk self assessments. An
operational risk management reporting process that
provides business unit leaders with operational risk
information on a quarterly basis to help them assess the
overall operational risks of their business unit has also
been implemented. These initiatives have resulted in
improved operational risk intelligence and a heightened
level of preparedness to manage operational risk
events and conditions that may adversely impact the
Company’s operations.
The Company’s operational risk governance structure
includes an Operational Risk Management Committee,
which is responsible for maintaining the operational risk
framework and related policies and for overseeing the
implementation of the Company’s operational risk pro-
gram. The Committee is chaired by the Chief Opera-
tional Risk Officer and Vice Chairman of the ERMC and
has member representation from business units and
support groups. The business units have the responsi-
bility for implementing the framework as well as the
day-to-day management of operational risk, creating a
partnership that ensures close monitoring and increas-
ing awareness for operational risk.
Financial Review
AXP / AR.2005
[ 45 ]](https://image.slidesharecdn.com/1041986/85/american-express-Annual-Reports-2005-47-320.jpg)
![Business Segment Results
Effective September 30, 2005, the Company realigned its
segment presentation to reflect the spin-off of Ameriprise.
The new segments are: U.S. Card Services, International
Card & Global Commercial Services, Global Network &
Merchant Services, and Corporate & Other.
Results of the business segments reflect essentially each
segment as a stand-alone business. The management
reporting process that derives these results allocates
income and expense using various methodologies as
described below.
Revenues
The Company applies a transfer pricing methodology
for the allocation of discount revenue and certain other
revenues between segments. Discount revenue is earned
by segments based on the volume of merchant business
generated by cardmembers at predetermined rates.
Within the U.S. Card Services and International Card &
Global Commercial Services segments, discount rev-
enue reflects the issuer component of the overall dis-
count rate and within the Global Network & Merchant
Services segment, discount revenue reflects the network
component of the overall discount rate. Net finance
charge revenue and net card fees are directly attributable
to the segment in which they are reported.
Expenses
Marketing, promotion, rewards and cardmember ser-
vices expenses are reflected in each segment based on
actual expenses incurred within the segment, with the
exception of brand advertising, which is reflected in the
Global Network & Merchant Services segment. The pro-
vision for losses reflects credit-related expenses as
incurred within each segment.
Human resources and other expenses reflect expenses
incurred directly within each segment as well as
expenses related to the Company’s support services,
which are allocated to each segment based on support
service activities directly attributable to the segment.
Other overhead expenses are allocated to segments
based on each segment’s level of pretax income. Financ-
ing requirements are managed on a consolidated basis.
Funding costs are allocated to segments based on
segment funding requirements.
Capital
Each business segment is allocated capital based on
business model operating requirements, risk measures
and regulatory capital requirements. Business model
requirements include capital needed to support
operations and specific balance sheet items. The risk
measures include considerations for credit, market and
operational risk. Regulatory capital requirements
include the capital amounts defined for well-capitalized
financial institutions.
Income Taxes
Income tax provision (benefit) is allocated to each busi-
ness segment based on the effective tax rates applicable
to various businesses that comprise the segment.
As discussed more fully below, U.S. Card Services’ and
International Card & Global Commercial Services’
results are presented on a managed basis and Global
Network & Merchant Services’ and Corporate & Other
results are presented on a basis consistent with GAAP.
U.S. Card Services
Differences between GAAP and Managed
Basis Presentation
The Company presents certain information on a
managed basis because that is the way the Company’s
management views and manages the business.
For U.S. Card Services, managed basis means the pre-
sentation assumes there have been no securitization
transactions, i.e., all securitized cardmember loans and
related income effects are reflected as if they were in the
Company’s balance sheets and income statements,
respectively. Management believes that a full picture of
trends in the Company’s cardmember lending business
can only be derived by evaluating the performance of
both securitized and non-securitized cardmember
loans. Asset securitization is just one of several ways for
the Company to fund cardmember loans. Use of a man-
aged basis presentation, including non-securitized
and securitized cardmember loans, presents a more
accurate picture of the key dynamics of the cardmem-
ber lending business, avoiding distortions due to the
mix of funding sources at any particular point in
time. The Company does not currently securitize
international loans.
U.S. Card Services’ owned portfolio (i.e., on-balance
sheet) is primarily comprised of cardmember receiv-
ables generated by the Company’s charge card products
and unsecuritized cardmember loans. The Company
securitizes cardmember loans as part of its financing
strategy; consequently, the level of unsecuritized card-
member loans is primarily a function of the Company’s
financing requirements. Delinquency, reserve coverageFinancial Review
AXP / AR.2005
[ 46 ]](https://image.slidesharecdn.com/1041986/85/american-express-Annual-Reports-2005-48-320.jpg)
![and net write-off rates have historically been broadly
comparable between the Company’s owned and
managed portfolios.
On a GAAP basis, results reflect net securitization
income, which is comprised of the non-credit provision
components of the net gains and charges from securi-
tization activities, the amortization and related impair-
ment charges, if any, of the interest-only strip, excess
spread related to securitized loans, net finance charge
revenue on retained interests in securitized loans, and
servicing income, net of related discounts or fees. Excess
spread, which is the net positive cash flow from interest
and fee collections allocated to the investor’s interests
after deducting the interest paid on investor certificates,
credit losses, contractual servicing fees and other
expenses is recognized in securitization income as it is
earned. See Selected Statistical Information below for
data relating to U.S. Card Services’ owned loan portfolio.
During 2005, 2004 and 2003, U.S. Card Services rec-
ognized net gains, including the credit components, of
$21 million ($14 million after-tax), $26 million ($17
million after-tax) and $124 million ($81 million after-
tax), respectively, from net securitization activities. In
2005, the net gains consisted of $181 million of income
from the securitization of $5.4 billion of cardmember
loans, including the impact of the related credit reserves
on the sold loans. This amount was partially offset by
$160 million of charges related to the maturity of $4.5
billion of previously outstanding issuances. In 2004, the
net gains consisted of $230 million of income from the
securitization of $3.9 billion of cardmember loans,
including the impact of the related credit reserves on the
sold loans, and the sale of $1.4 billion of certain retained
interests from previous securitization activities. This
amount was partially offset by $204 million of charges
related to the maturity of $3.0 billion of securitizations
and changes in interest-only strip assumptions.
Management views any net gains from securitizations as
discretionary benefits to be used for card acquisition
expenses, which are reflected in both marketing, pro-
motion, rewards and cardmember services and other
operating expenses. Consequently, the managed basis
presentation for 2005, 2004 and 2003 assumes that
the impact of this net activity was offset by higher
marketing, promotion, rewards and cardmember ser-
vices expenses of $13 million, $16 million and $74 mil-
lion, respectively, and other operating expenses of $8
million, $10 million and $50 million, respectively.
Accordingly, the incremental expenses, as well as the
impact of this net activity, have been eliminated in the
managed basis presentations.
The managed basis presentation for U.S. Card Services
also reflects an increase to interest income recorded to
enable management to evaluate tax exempt investments
on a basis consistent with taxable investment securities.
On a GAAP basis, interest income associated with tax
exempt investments is recorded based on amounts
earned. Accordingly, information presented on a man-
aged basis assumes that tax exempt securities earned
income at rates as if the securities produced taxable
income with a corresponding increase in the provision
for income taxes.
Financial Review
AXP / AR.2005
[ 47 ]](https://image.slidesharecdn.com/1041986/85/american-express-Annual-Reports-2005-49-320.jpg)
![The following table reconciles the GAAP basis for certain U.S. Card Services income statement line items to the
managed basis information, where different.
Years Ended December 31, GAAP Basis
(Millions) 2005 2004 2003
Revenues:
Discount revenue,
net card fees
and other $ 8,897 $ 7,893 $ 7,102
Cardmember
lending:
Finance charge
revenue 2,408 1,776 1,574
Interest expense 616 406 303
Net finance
charge
revenue 1,792 1,370 1,271
Securitization
income, net 1,260 1,132 1,105
Total revenues 11,949 10,395 9,478
Expenses:
Marketing,
promotion,
rewards and
cardmember
services 3,911 3,325 2,644
Provision for losses 1,676 1,508 1,481
Human resources
and other
operating
expenses 3,763 3,422 3,397
Total expenses 9,350 8,255 7,522
Pretax segment
income 2,599 2,140 1,956
Income tax provision 765 622 558
Segment income $ 1,834 $ 1,518 $ 1,398
Securitization Effect
Tax Equivalent
Effect Managed Basis
2005 2004 2003 2005 2004 2003 2005 2004 2003
$ 210 $ 210 $ 193 $ 226 $ 228 $ 228 $ 9,333 $ 8,331 $ 7,523
2,692 2,222 2,172 5,100 3,998 3,746
739 384 317 1,355 790 620
1,953 1,838 1,855 3,745 3,208 3,126
(1,260) (1,132) (1,105) — — —
903 916 943 226 228 228 13,078 11,539 10,649
(13) (16) (74) 3,898 3,309 2,570
924 942 1,067 2,600 2,450 2,548
(8) (10) (50) 3,755 3,412 3,347
$ 903 $ 916 $ 943 10,253 9,171 8,465
226 228 228 2,825 2,368 2,184
$ 226 $ 228 $ 228 $ 991 $ 850 $ 786
Financial Review
AXP / AR.2005
[ 48 ]](https://image.slidesharecdn.com/1041986/85/american-express-Annual-Reports-2005-50-320.jpg)
![Selected Statistical Information
Years Ended December 31,
(Billions, except percentages
and where indicated) 2005 2004 2003
Card billed business $ 292.8 $ 251.7 $ 214.7
Total cards-in-force
(millions) 37.5 35.0 32.7
Basic cards-in-force
(millions) 27.7 25.7 24.0
Average basic cardmember
spending (dollars) $ 10,996 $ 10,118 $ 9,054
U.S. Consumer Travel
Travel sales $ 1.9 $ 1.5 $ 1.2
Travel commissions
and fees/sales 8.7% 8.9% 8.6%
Worldwide Travelers Cheque
and prepaid products:
Sales $ 19.7 $ 19.9 $ 19.2
Average outstanding $ 7.1 $ 7.0 $ 6.6
Average investments $ 7.8 $ 7.5 $ 7.1
Investment yield(a) 5.1% 5.4% 5.4%
Tax equivalent
yield — managed(a) 7.9% 8.4% 8.4%
Total segment assets $ 70.3 $ 58.3 $ 53.0
Segment capital $ 5.1 $ 4.5 $ 3.7
Return on segment capital 39.3% 38.2% 39.1%
Cardmember receivables:
Total receivables $ 19.2 $ 17.4 $ 16.1
90 days past due as
a % of total 1.8% 2.0% 2.2%
Net loss ratio as a %
of charge volume 0.30% 0.30% 0.34%
Cardmember lending —
owned basis:
Total loans $ 24.8 $ 19.6 $ 17.7
30 days past due loans
as a % of total 2.3% 2.4% 2.6%
Average loans $ 21.0 $ 17.9 $ 16.4
Net write-off rate 3.9% 3.9% 5.0%
Net finance charge
revenue/average loans 8.5% 7.7% 7.8%
Cardmember lending —
managed basis:
Total loans $ 46.0 $ 39.9 $ 37.0
30 days past due loans
as a % of total 2.3% 2.5% 2.7%
Average loans $ 41.5 $ 37.3 $ 35.2
Net write-off rate 4.1% 4.3% 5.2%
Net finance charge
revenue/average loans 9.0% 8.6% 8.9%
(a)Investment yield represents earnings on certain tax-exempt securities.
The tax equivalent yield — managed represents earnings on such tax-
exempt securities as if it had been earned on a taxable basis and assumes
an income tax rate of 35 percent.
Results of Operations for the Three Years Ended
December 31, 2005
The following discussion of U.S. Card Services’ segment
results of operations is presented on a managed basis.
U.S. Card Services reported segment income of $1.8 bil-
lion in 2005, a 21 percent increase from $1.5 billion in
2004, which increased 9 percent from 2003.
Revenues
In 2005, U.S. Card Services’ revenues increased 13 per-
cent to $13.1 billion primarily due to higher discount
revenue, net card fees and other, and increased card-
member lending net finance charge revenue. Discount
revenue, net card fees and other of $9.3 billion in 2005,
rose 12 percent from 2004, largely due to increases in
billed business volumes. The 16 percent increase in
billed business in 2005 reflected a 9 percent increase in
spending per proprietary basic card and a 7 percent
growth in cards-in-force. Within the U.S. consumer
business,billedbusinessgrew15percentandsmallbusi-
ness volumes rose 20 percent in 2005. Cardmember
lending net finance charge revenue of $3.7 billion in
2005 rose 17 percent compared to 2004, primarily due
to 11 percent growth in average lending balances and a
higher portfolio yield. Revenues of $11.5 billion in 2004
were 8 percent higher than 2003 as a result of increased
discount revenues, net card fees and other, and card-
member lending net finance charge revenue.
Expenses
During 2005, U.S. Card Services’ expenses increased
12 percent to $10.3 billion, primarily due to higher mar-
keting, promotion, rewards and cardmember services
expenses, greater human resources expenses and other
operating expenses and higher provisions for losses.
Expenses in 2005 included $10 million in aggregate
reengineering charges principally relating to the restruc-
turing of travel operations. These charges represent
employee severance obligations and are included in
human resources expense. Expenses in 2004 of $9.2 bil-
lion were 8 percent higher than 2003 primarily due to
higher marketing, promotion, rewards and cardmember
services, greater human resources expenses and other
operating expenses, partially offset by reduced provi-
sions for losses and interest costs.
Financial Review
AXP / AR.2005
[ 49 ]](https://image.slidesharecdn.com/1041986/85/american-express-Annual-Reports-2005-51-320.jpg)
![Marketing, promotion, rewards and cardmember
services expenses increased 18 percent in 2005 to
$3.9 billion reflecting the Company’s increased
business-building activities and volume-related rewards
expense growth. Total provisions for losses increased 6
percent in 2005 due to strong volume increases within
both charge and lending activities, higher provision
rates, reflecting the impact of the new bankruptcy leg-
islation, and a $38 million provision for the estimated
costs related to Hurricane Katrina. In 2004, a $115
million securitization reconciliation charge was
recorded. Human resources and other operating
expenses of $3.8 billion in 2005 increased 10 percent
from 2004 primarily due to greater interest costs and
higher management incentives, including an additional
year of stock-based compensation expenses, merit
increases, and increased employee benefit costs. In
addition, operating expenses rose reflecting volume-
related costs.
The effective tax rate was 35 percent in 2005 versus
36 percent in 2004 and 2003.
International Card & Global
Commercial Services
Differences between GAAP and Managed
Basis Presentation
The table below provides selected income statement
data of International Card & Global Commercial
Services for 2005, 2004 and 2003 on a GAAP basis.
On a GAAP basis, amounts earned related to the sale
and purchase of foreign currencies for customers as part
of the foreign exchange business are included with other
foreign exchange items that are reflected in other oper-
ating expenses. Management views these foreign
exchange services as a revenue generating activity
and makes operating decisions based upon that infor-
mation. On a managed basis, these revenues are
included in other revenue with a corresponding increase
in other operating expenses. The amount of foreign
exchange services reclassified on a managed basis
increased other revenue and other operating expenses
by $135 million, $172 million and $161 million in
2005, 2004 and 2003, respectively, from the amounts
reported on a GAAP basis.
GAAP Basis
Years Ended December 31,
(Millions) 2005 2004 2003
Revenues:
Discount revenue, net
card fees and other $ 8,354 $ 7,789 $ 6,796
Cardmember lending:
Finance charge
revenue 1,035 907 821
Interest expense 351 267 212
Net finance charge
revenue 684 640 609
Total revenues 9,038 8,429 7,405
Expenses:
Marketing, promotion,
rewards and
cardmember services 1,269 1,130 829
Provision for losses
and benefits 1,023 740 735
Human resources and
other operating
expenses 5,597 5,443 4,767
Total expenses 7,889 7,313 6,331
Pretax segment income 1,149 1,116 1,074
Income tax provision 215 335 359
Segment income $ 934 $ 781 $ 715
Financial Review
AXP / AR.2005
[ 50 ]](https://image.slidesharecdn.com/1041986/85/american-express-Annual-Reports-2005-52-320.jpg)
![Selected Statistical Information
Years Ended December 31,
(Billions, except percentages
and where indicated) 2005 2004 2003
Card billed business $ 168.5 $ 148.6 $ 125.5
Total cards-in-force
(millions) 22.7 21.6 21.3
Basic cards-in-force
(millions) 18.0 17.2 17.2
Average basic cardmember
spending (dollars) $ 9,641 $ 8,610 $ 7,458
Global Corporate &
International Consumer
Travel
Travel sales $ 18.8 $ 18.4 $ 14.8
Travel commissions and
fees/sales 8.6% 9.0% 9.5%
International banking
Total loans $ 7.1 $ 6.9 $ 6.5
Private banking
holdings $ 20.3 $ 18.6 $ 16.2
Total segment assets $ 51.7 $ 47.9 $ 42.3
Segment capital $ 4.1 $ 3.8 $ 3.4
Return on segment capital 24.1% 22.0% 22.6%
Cardmember receivables:
Total receivables $ 14.5 $ 13.7 $ 12.3
90 days past due as a %
of total 1.3% 1.5% 1.4%
Net loss ratio as a % of
charge volume 0.21% 0.19% 0.19%
Cardmember lending:
Total loans $ 8.3 $ 7.3 $ 7.3
30 days past due loans
as a % of total 2.8% 2.3% 2.3%
Average loans $ 7.4 $ 6.7 $ 6.0
Net write-off rate 4.7% 5.2% 5.6%
Net finance charge
revenue/average loans 9.3% 9.6% 10.2%
Results of Operations for the Three Years Ended
December 31, 2005
The following discussion of International Card & Global
Commercial Services’ results of operations is presented
on a managed basis.
International Card & Global Commercial Services
reported segment income of $934 million for 2005, a
19 percent increase from $781 million in 2004, which
increased 9 percent from 2003.
Revenues
In 2005, International Card & Global Commercial
Services’ discount revenue, net card fees and other rev-
enues increased 7 percent to $8.5 billion driven prima-
rily by increases in both spending and cards-in-force, as
well as greater volume-related foreign exchange conver-
sion fees and higher card-related assessments, which
were partially offset by lower travel revenues. The
13 percent increase in billed business in 2005 reflects
a 12 percent increase in spending per proprietary basic
card as a result of increases in international consumer,
small business and global corporate spending and a
5 percent growth in cards-in-force. Cardmember lend-
ing net finance charge revenue of $684 million in 2005
rose 7 percent as compared to 2004, primarily due to
11 percent growth in the average lending balances,
partially offset by a higher cost of funds. Revenues of
$8.6 billion in 2004 were 14 percent higher than 2003
as a result of increased discount revenue, net card fees
and other revenues.
Expenses
During 2005, International Card & Global Commercial
Services’ expenses increased 7 percent to $8.0 billion
primarily due to increased provisions for losses and ben-
efits, higher marketing and promotion expenses, greater
reward costs and other operating expenses. Expenses in
2005 included $168 million in aggregate reengineering
charges principally relating to the restructuring of activi-
ties in the Corporate Travel business and international
operations. These restructuring charges include $88
million of employee severance obligations included in
human resources expense and $12 million of other exit
costs, primarily relating to the termination of certain real
estate property leases. Expenses in 2004 of $7.5 billion
were 15 percent higher than 2003 primarily due to
increased human resources and other operating
expenses, higher marketing and promotion expenses
and greater reward costs.
Marketing, promotion, rewards and cardmember
services expenses increased 12 percent in 2005 to
$1.3 billion reflecting greater rewards costs and
higher marketing and promotion expenses due to the
Company’s ongoing business-building initiatives. Total
provisions for losses and benefits increased 38 percent
in 2005 compared to 2004 primarily due to strong
volume increases within both charge and lending
activities and higher provision rates. Human resources
and other operating expenses increased 2 percent
to $5.7 billion in 2005 from 2004 reflecting higher
reengineering expenses, which were partially offset by
lower human resources costs and other reengineering-
related savings.
Financial Review
AXP / AR.2005
[ 51 ]](https://image.slidesharecdn.com/1041986/85/american-express-Annual-Reports-2005-53-320.jpg)
![The effective tax rate was 19 percent in 2005 versus 30
percent in 2004 and 33 percent in 2003. The effective
tax rate was lower in 2005 as compared to 2004 prima-
rily due to tax benefits of $33 million, resulting from the
resolution of IRS audits of previous years’ returns, in
addition to the positive effect of changes in the
Company’s international funding strategy in 2004.
Global Network & Merchant Services
Selected Income Statement Data
Years Ended December 31, (Millions) 2005 2004 2003
Revenues:
Discount revenue, fees
and other $ 2,842 $ 2,639 $ 2,347
Expenses:
Marketing and
promotion 604 389 289
Provision/(benefit)
for losses 66 (2) 67
Human resources and
other operating
expenses 1,302 1,348 1,225
Total expenses 1,972 1,735 1,581
Pretax segment income 870 904 766
Income tax provision 306 330 280
Segment income $ 564 $ 574 $ 486
Selected Statistical Information
Years Ended December 31,
(Billions, except percentages
and where indicated) 2005 2004 2003
Global Card billed
business $ 484.4 $ 416.1 $ 352.2
Global Network &
Merchant Services:
Total segment assets $ 4.5 $ 3.9 $ 4.2
Segment capital $ 1.3 $ 1.1 $ 1.0
Return on segment capital 48.4% 55.8% 49.0%
Global Network Services:
Card billed business $ 24.0 $ 17.7 $ 13.2
Total cards-in-force
(millions) 10.8 8.8 6.5
Results of Operations for the Three Years Ended
December 31, 2005
Revenues
Global Network & Merchant Services reported segment
income of $564 million in 2005, a 2 percent decrease
from $574 million in 2004, which increased 18 percent
from 2003.
In 2005, Global Network & Merchant Services revenues
increased 8 percent to $2.8 billion due to higher dis-
count revenue, fees and other revenues primarily due to
growth in network-related discount revenue generated
from strong growth in network volumes, partially offset
by a decrease in other revenues as a result of the 2004
sale of the ATM business and the impact of a lower over-
all discount rate. Cards-in-force rose 23 percent in 2005
from 2004 reflecting growth in new partners. Revenues
of $2.6 billion in 2004 were 12 percent higher than
2003 as a result of increased discount revenue and fees.
Expenses
During 2005, Global Network & Merchant Services
expenses increased 14 percent to $2.0 billion reflecting
higher marketing and promotion expenses, increased
costs for provisions for loss offset by a decrease in
human resources expenses and other operating
expenses. Expenses in 2005 included $3 million in
aggregate reengineering charges principally relating to
the restructuring of certain operations. These charges
represent employee severance obligations included
in human resources expense. Expenses in 2004 of
$1.7 billion were 10 percent higher than 2003 primarily
due to greater marketing and promotion, higher human
resources and other operating expenses, partially offset
by decreased costs for provisions for losses.
Marketing and promotion expenses increased 55
percent in 2005 to $604 million reflecting higher
marketing and promotion expenses primarily due to the
ongoing costs of the “MyLife, MyCard” brand advertis-
ing campaign. Provision for losses increased substan-
tially in 2005 primarily due to a $60 million benefit in
2004 resulting from the reduction in merchant-related
reserves. Human resources and other operating
expenses decreased 3 percent to $1.3 billion in 2005
due in part to the third quarter of 2004 sale of the ATM
business and a larger internally allocated interest
expense credit that recognizes the network business’
Financial Review
AXP / AR.2005
[ 52 ]](https://image.slidesharecdn.com/1041986/85/american-express-Annual-Reports-2005-54-320.jpg)
![accounts payable-related funding benefit, partially offset
by greater salary and benefit costs, which reflect head-
count growth due to Global Network Services business-
building initiatives.
The effective tax rate was 35 percent in 2005 versus 36
percent in 2004 and 37 percent in 2003. The effective
tax rate was lower in 2005 as compared to 2004 prima-
rily as a result of favorable tax audit experience.
Corporate & Other
Corporate & Other had net expense of $111 million,
$187 million and $264 million in 2005, 2004 and 2003,
respectively. Net expense in 2005 reflects $159 million
of tax benefits resulting from the resolution of prior
years’ tax items, a $73 million ($47 million after-tax)
benefit related to the settlement of an insurance claim
associated with September 11, 2001 and $105 million
($68 million after-tax) of reengineering costs.
Airline Industry Matters
Historically, the Company has not experienced signi-
ficant revenue declines resulting from a particular
airline’s scaling-back or closure of operations due to
bankruptcy or other financial challenges because the
volumes generated from the airline are typically shifted
to other participants in the industry that accept the
Company’s card products. Nonetheless, the Company is
exposed to business and credit risk in the airline indus-
try primarily through business arrangements where the
Company has remitted payment to the airline for a card-
member purchase of tickets that have not yet been used
or “flown.” This creates a potential exposure for the
Company in the event that the cardmember is not able
to use the ticket and the Company, based on the facts
and circumstances, credits the cardmember for the
unused ticket. Historically, this type of exposure has not
generated any significant losses for the Company
because of the need for an airline that is operating under
bankruptcy protection to continue accepting credit and
charge cards and honoring requests for credits and
refunds in the ordinary course of business, and in fur-
therance of its reorganization and its formal assumption,
with bankruptcy court approval, of its card acceptance
agreement, including approval of the Company’s right to
hold cash to cover these potential exposures to provide
credits to cardmembers. Typically, as an airline’s finan-
cial situation deteriorates the Company delays payment
to the airlines thereby increasing cash held to protect
itself in the event of an ultimate liquidation of the airline.
The Company’s goal in these distressed situations is to
hold sufficient cash over time to ensure that upon liq-
uidation the cash held is equivalent to the credit expo-
sure related to any unused tickets.
Separately, as part of Delta Airlines’ (Delta) decision to
file for protection under Chapter 11 of the Bankruptcy
Code, the Company agreed with Delta to restructure cer-
tain of its financial arrangements with the airline. In par-
ticular, Delta agreed to repay to the Company an aggre-
gate $557 million, primarily the Company’s prepayment
of Delta SkyMiles rewards points. Contemporaneously
with the repayment, the Company lent to Delta
$350 million as part of Delta’s post-petition, debtor-in-
possession (DIP) financing under the Bankruptcy Code.
At December 31, 2005 the remaining principal balance
was $300 million. This post-petition facility continues
to be structured as an advance against the Company’s
obligations to purchase Delta SkyMiles rewards points
under the Company’s co-brand and Membership
Rewards agreements and will be amortized ratably each
month beginning in July 2006 through November
2007. The Company’s post-petition facility is secured by
(i) senior liens on Delta assets specifically related to its
American Express co-brand, Membership Rewards and
card acceptance relationships and (ii) liens subordinate
to senior liens on all other Delta assets including the
assets and shares of certain Delta subsidiaries.
In addition, given the depth of the Company’s business
relationships with Delta through the SkyMiles Credit
Card and Delta’s participation as a key partner in the
Company’s Membership Rewards program, in the event
Delta’s reorganization under the bankruptcy laws is not
successful or otherwise negatively impacts the Compa-
ny’s relationship with Delta, the Company’s future finan-
cial results could be adversely impacted. As previously
disclosed, American Express’ Delta SkyMiles Credit
Card co-brand portfolio accounts for less than 10 per-
cent of the Company’s worldwide billed business
and less than 15 percent of worldwide managed lend-
ing receivables.
Other Reporting Matters
Accounting Developments
See Recently Issued Accounting Standards section of
Note 1 to the Consolidated Financial Statements.
Financial Review
AXP / AR.2005
[ 53 ]](https://image.slidesharecdn.com/1041986/85/american-express-Annual-Reports-2005-55-320.jpg)
![Glossary of Selected Terminology
Asset securitizations — Asset securitization involves
the transfer and sale of receivables or loans to a special
purpose entity, a separate legal entity, created for the
securitization activity, typically a trust. The trust, in
turn, issues securities, commonly referred to as
asset-backed securities that are collateralized by the
transferred receivables or loans. The trust utilizes the
proceeds from the sale of such securities to pay the
purchase price for receivables or loans that were sold
into the trust.
Average discount rate — Computed as follows: Discount
revenue from all card spending (proprietary and Global
Network Services) at merchants divided by all billed
business (proprietary and Global Network Services)
generating discount revenue at such merchants. Only
merchants acquired by the Company are included in the
computation. Discount rates have been restated on a his-
torical basis from those previously disclosed, primarily
to retain in the computation the Global Network Ser-
vices partner portion of the discount revenue, as well as
the Company’s portion of discount revenue.
Basic cards-in-force — Represents the number of cards
issued and outstanding to the primary account owners
and does not include additional supplemental cards
issued on such accounts.
Billed business — Represents the dollar amount of
charges on all American Express cards; also referred to
as spend or charge volume. Proprietary billed business
includes charges made on the Company’s proprietary
cards-in-force, cash advances on proprietary cards and
certain insurance fees charged on proprietary cards
while non-proprietary billed business represents the
charges through the Company’s global network on cards
issued by the Company’s network partners.
Cardmember — The individual holder of an issued
American Express branded charge or credit card.
Cardmember lending net finance charge revenue — Repre-
sents the net revenue earned on outstanding cardmember
loans. Cardmember lending finance charges are assessed
using the average daily balance method. They are recog-
nized based upon the principal amount outstanding in
accordance with the terms of the applicable account
agreement until the outstanding balance is paid or
written-off. Cardmember lending finance charges are pre-
sented net of the interest expense incurred by the Com-
pany to finance lending receivables.
Cardmember loans — Represents the outstanding
amount due from cardmembers for charges made on
their American Express credit cards, as well as any inter-
est charges and card-related fees due from the
cardmember. Cardmember loans also include balances
with extended payment terms on certain charge
card products.
Cardmember receivables — Represents the outstanding
amount due from cardmembers for charges made on
their American Express charge cards as well as any
card-related fees.
Cards-in-force — Represents the number of cards that
are issued and outstanding. Total consumer cards-in-
force includes basic cards issued to the primary account
owner and any supplemental cards which represent
additional cards issued on that account. Total small
business and corporate cards-in-force include basic
cards issued to employee cardmembers. Proprietary
cards-in-force represent card products where the Com-
pany owns the cardmember relationship including card
issuance, billing and credit management and strategic
plans such as marketing, promotion and development
of card products and offerings. Proprietary cards-in-
force include co-brand and affinity cards. For non-
proprietary cards-in-force, the Company maintains the
responsibility to acquire and service merchants that
accept the Company’s cards and the cardmember rela-
tionship is owned by the Company’s network partners
that issue the cards. Most of the Company’s network
partners provide cards-in-force data to the Company on
a one-month lag basis.
Charge cards — Represents cards that carry no pre-set
spending limits and are primarily designed as a method
of payment and not as a means of financing purchases
of goods or services. Cardmembers generally must pay
the full amount billed each month. No finance charges
are assessed on charge cards.
Credit cards — Represents cards that have a range
of revolving payment terms, grace periods and rate and
fee structures.
Discount revenue — Represents revenue earned from fees
charged to merchants with whom the Company has
entered into a card acceptance agreement for processing
cardmember transactions. The discount fee is generally
deducted from the Company’s payment reimbursing
the merchant.
Financial Review
AXP / AR.2005
[ 54 ]](https://image.slidesharecdn.com/1041986/85/american-express-Annual-Reports-2005-56-320.jpg)
![Interest-only strip — Interest-only strips are generated
from U.S. Card Services’ securitization activity and are
a form of retained interest held by the Company in the
securitization. This financial instrument represents
the present value of estimated future excess spread
expected to be generated by the securitized assets over
the estimated life of those assets. Excess spread is the net
positive cash flow from interest and fee collections allo-
cated to the third-party investors’ interests in the secu-
ritization after deducting the interest paid on the inves-
tor certificates, credit losses, contractual servicing fees
and other expenses.
Loss reserves as a percentage of loans — Represents the
amount of loss reserves expressed as a percentage of the
outstanding loan balance.
Loss reserves as a percentage of past due accounts — Rep-
resents the reserve coverage of past due accounts.
Net card fees — Represents the card membership fees
earned during the period. These fees are recognized as
revenue over the card membership period (typically one
year) covered by the card fee, net of provision for pro-
jected refunds of card fees for cancellation of card mem-
bership. Similarly, card acquisition costs are deferred
and amortized into operating expenses over the card
membership period covered by the card fee.
Net finance charge revenue/average loans — Represents
net finance charge revenue divided by average loans for
the period.
Net loss ratio — Represents the ratio of write-offs, net of
recoveries on cardmember receivables expressed as a
percentage of the total charge card volume.
Net write-off rate — Represents the amount of loans
written-off, net of recoveries as a percentage of the
average loan balance during the period.
Past due loans as a percentage of total loans — Represents
the percentage of loans that are 30 days or more past due
compared to the total amount of loans outstanding.
Return on average total shareholders’ equity — Computed
on a trailing 12-month basis using total shareholders’
equity as included in the Consolidated Financial State-
ments prepared in accordance with U.S. GAAP.
Return on segment capital — Computed on a trailing
12-month basis using equity capital allocated to seg-
ments based upon specific business operational needs,
risk measures and regulatory capital requirements.
Securitization income, net — Net securitization income
includes non-credit provision components of the net
gains and charges from securitization activities, impair-
ment charges, if any, of the related interest-only strip,
excess spread related to securitized cardmember loans,
net finance charge revenue on retained interests in secu-
ritized cardmember loans and servicing income, net of
related discounts or fees. Excess spread is the net posi-
tive cash flow from interest and fee collections allocated
to the third-party investors’ interests in the securitiza-
tion after deducting the interest paid on the investor
certificates, credit losses, contractual servicing fees
and other expenses. Excess spread is recognized as it
is earned.
Stored value and prepaid products — Include Travelers
Cheques and other prepaid products such as gift
cheques and cards as well as reloadable Travelers
Cheque cards. These products are sold as safe and
convenient alternatives to currency and represent pre-
paid financial instruments for the holders to use for pur-
chasing goods and services.
Travel sales — Represents the total dollar amount of travel
transaction volume for airline, hotel, car rental and other
travel arrangements made for consumers and corporate
clients. The Company earns revenue on these transactions
by charging a transaction or management fee.
Forward-Looking Statements
This report includes forward-looking statements, which
are subject to risks and uncertainties. The words
“believe,” “expect,” “anticipate,” “optimistic,” “intend,”
“plan,” “aim,” “will,” “may,” “should,” “could,” “would,”
“likely,” and similar expressions are intended to identify
forward-looking statements. Readers are cautioned not
to place undue reliance on these forward-looking state-
ments, which speak only as of the date on which they
are made. The Company undertakes no obligation to
update or revise any forward-looking statements. Fac-
tors that could cause actual results to differ materially
from these forward-looking statements include, but are
not limited to, the following: the Company’s ability to
generate sufficient net income to achieve a return on
equity on a GAAP basis of 28 percent to 30 percent; the
Company’s ability to grow its business and meet or
exceed its return on shareholders’ equity target by rein-
vesting approximately 35 percent of annually-generated
capital, and returning approximately 65 percent of such
capital to shareholders, over time, which will depend on
Financial Review
AXP / AR.2005
[ 55 ]](https://image.slidesharecdn.com/1041986/85/american-express-Annual-Reports-2005-57-320.jpg)
![the Company’s ability to manage its capital needs and
the effect of business mix, acquisitions and rating agency
requirements; consumer and business spending on the
Company’s credit and charge card products and Travel-
ers Cheques and other prepaid products and growth in
card lending balances, which depend in part on the
ability to issue new and enhanced card and prepaid
products, services and rewards programs, and increase
revenues from such products, attract new cardmembers,
reduce cardmember attrition, capture a greater share of
existing cardmembers’ spending, sustain premium dis-
count rates on its card products in light of regulatory and
market pressures, increase merchant coverage, retain
cardmembers after low introductory lending rates have
expired, and expand the Global Network Services busi-
ness; the Company’s ability to introduce new products,
reward program enhancements and service enhance-
ments on a timely basis during 2006; the success of the
Global Network Services business in partnering with
banks in the United States, which will depend in part
on the extent to which such business further enhances
the Company’s brand, allows the Company to leverage
its significant processing scale, expands merchant cov-
erage of the network, provides Global Network Services’
bank partners in the United States the benefits of greater
cardmember loyalty and higher spend per customer,
and merchant benefits such as greater transaction vol-
ume and additional higher spending customers; the
continuation of favorable trends, including increased
travel and entertainment spending, and the overall level
of consumer confidence; the costs and integration of
acquisitions; the success, timeliness and financial
impact (including costs, cost savings and other benefits
including increased revenues), and beneficial effect on
the Company’s operating expense to revenue ratio, both
in the short-term and over time, of reengineering initia-
tives being implemented or considered by the Company,
including cost management, structural and strategic
measures such as vendor, process, facilities and opera-
tions consolidation, outsourcing (including, among oth-
ers, technologies operations), relocating certain func-
tions to lower-cost overseas locations, moving internal
and external functions to the Internet to save costs, and
planned staff reductions relating to certain of such
reengineering actions; the Company’s ability to reinvest
the benefits arising from such reengineering actions
in its businesses; the ability to control and manage
operating, infrastructure, advertising and promotion
expenses as business expands or changes, including the
ability to accurately estimate the provision for the cost
of the Membership Rewards program; the Company’s
ability to manage credit risk related to consumer debt,
business loans, merchant bankruptcies and other credit
trends and the rate of bankruptcies, which can affect
spending on card products, debt payments by indi-
vidual and corporate customers and businesses that
accept the Company’s card products and returns on the
Company’s investment portfolios; bankruptcies,
restructurings or similar events affecting the airline or
any other industry representing a significant portion of
the Company’s billed business, including any potential
negative effect on particular card products and services
and billed business generally that could result from the
actual or perceived weakness of key business partners
in such industries; the triggering of obligations to make
payments to certain co-brand partners, merchants, ven-
dors and customers under contractual arrangements
with such parties under certain circumstances; a down-
turn in the Company’s businesses and/or negative
changes in the Company’s and its subsidiaries’ credit rat-
ings, which could result in contingent payments under
contracts, decreased liquidity and higher borrowing
costs; risks associated with the Company’s agreements
with Delta Air Lines to prepay $300 million for the
future purchases of Delta SkyMiles rewards points; fluc-
tuations in foreign currency exchange rates; fluctuations
in interest rates, which impact the Company’s borrowing
costs and return on lending products; accuracy of esti-
mates for the fair value of the assets in the Company’s
investment portfolio and, in particular, those invest-
ments that are not readily marketable, including the
valuation of the interest-only strip relating to the Com-
pany’s lending securitizations; the potential negative
effect on the Company’s businesses and infrastructure,
including information technology, of terrorist attacks,
disasters or other catastrophic events in the future;
political or economic instability in certain regions or
countries, which could affect lending and other com-
mercial activities, among other businesses, or restric-
tions on convertibility of certain currencies; changes in
laws or government regulations; outcomes and costs
associated with litigation and compliance and regula-
tory matters; competitive pressures in all of the Compa-
ny’s major businesses; and other risks that are previously
disclosed in this report.
Financial Review
AXP / AR.2005
[ 56 ]](https://image.slidesharecdn.com/1041986/85/american-express-Annual-Reports-2005-58-320.jpg)
![MANAGEMENT’S REPORT ON INTERNAL CONTROL
OVER FINANCIAL REPORTING
The management of American Express Company (the
Company) is responsible for establishing and maintain-
ing adequate internal control over financial reporting.
The Company’s internal control over financial reporting
is a process designed to provide reasonable assurance
regarding the reliability of financial reporting and
the preparation of financial statements for external
purposes in accordance with generally accepted
accounting principles in the United States of America,
and includes those policies and procedures that:
® Pertain to the maintenance of records that, in reason-
able detail, accurately and fairly reflect the transac-
tions and dispositions of the assets of the Company;
® Provide reasonable assurance that transactions are
recorded as necessary to permit preparation of finan-
cial statements in accordance with generally accepted
accounting principles, and that receipts and expendi-
tures of the Company are being made only in
accordance with authorizations of management and
directors of the Company; and
® Provide reasonable assurance regarding prevention or
timely detection of unauthorized acquisition, use or
disposition of the Company’s assets that could have a
material effect on the financial statements.
Because of its inherent limitations, internal control over
financial reporting may not prevent or detect misstate-
ments. Also, projections of any evaluation of effective-
ness to future periods are subject to the risk that controls
may become inadequate because of changes in condi-
tions, or that the degree of compliance with the policies
or procedures may deteriorate.
The Company’s management assessed the effectiveness
of the Company’s internal control over financial report-
ing as of December 31, 2005. In making this assessment,
the Company’s management used the criteria set forth
by the Committee of Sponsoring Organizations of the
Treadway Commission (COSO) in Internal Control —
Integrated Framework.
Based on management’s assessment and those
criteria, we believe that, as of December 31, 2005, the
Company’s internal control over financial reporting
is effective.
PricewaterhouseCoopers LLP, the Company’s indepen-
dent registered public accounting firm, has issued an
audit report appearing on the following page on our
assessment of the effectiveness of the Company’s
internal control over financial reporting as of
December 31, 2005.
Management’s Report
on Internal Control
Over Financial
Reporting
AXP / AR.2005
[ 57 ]](https://image.slidesharecdn.com/1041986/85/american-express-Annual-Reports-2005-59-320.jpg)
![REPORT OF INDEPENDENT REGISTERED
PUBLIC ACCOUNTING FIRM
The Board of Directors and Shareholders of
American Express Company
We have completed an integrated audit of American
Express Company’s 2005 consolidated financial
statements and of its internal control over financial
reporting as of December 31, 2005 in accordance with
the standards of the Public Company Accounting Over-
sight Board (United States). Our opinions, based on our
audit, are presented below.
Consolidated financial statements
In our opinion, the accompanying consolidated balance
sheet and the related consolidated statements of income,
of shareholders’ equity and of cash flows present fairly,
in all material respects, the financial position of
American Express Company and its subsidiaries (the
“Company”) at December 31, 2005, and the results of
their operations and their cash flows for the year then
ended in conformity with accounting principles gener-
ally accepted in the United States of America. These
financial statements are the responsibility of the Com-
pany’s management. Our responsibility is to express an
opinion on these financial statements based on our
audit. We conducted our audit of these statements in
accordance with the standards of the Public Company
Accounting Oversight Board (United States). Those
standards require that we plan and perform the audit to
obtain reasonable assurance about whether the financial
statements are free of material misstatement. An audit of
financial statements includes examining, on a test basis,
evidence supporting the amounts and disclosures in the
financial statements, assessing the accounting principles
used and significant estimates made by management,
and evaluating the overall financial statement presenta-
tion. We believe that our audit provides a reasonable
basis for our opinion.
Internal control over financial reporting
Also, in our opinion, management’s assessment,
included in the accompanying Management’s Report on
Internal Control over Financial Reporting, that the
Company maintained effective internal control over
financial reporting as of December 31, 2005 based on
criteria established in Internal Control — Integrated
Framework issued by the Committee of Sponsoring
Organizations of the Treadway Commission (COSO), is
fairly stated, in all material respects, based on those
criteria. Furthermore, in our opinion, the Company
maintained, in all material respects, effective internal
control over financial reporting as of December 31,
2005, based on criteria established in Internal Control —
Integrated Framework issued by the COSO. The
Company’s management is responsible for maintaining
effective internal control over financial reporting and for
its assessment of the effectiveness of internal control
over financial reporting. Our responsibility is to express
opinions on management’s assessment and on the effec-
tiveness of the Company’s internal control over financial
reporting based on our audit. We conducted our audit
of internal control over financial reporting in accordance
with the standards of the Public Company Accounting
Oversight Board (United States). Those standards
require that we plan and perform the audit to obtain
reasonable assurance about whether effective internal
control over financial reporting was maintained in all
material respects. An audit of internal control over
financial reporting includes obtaining an understanding
of internal control over financial reporting, evaluating
management’s assessment, testing and evaluating the
design and operating effectiveness of internal control,
and performing such other procedures as we consider
necessary in the circumstances. We believe that our
audit provides a reasonable basis for our opinions.
A company’s internal control over financial reporting is
a process designed to provide reasonable assurance
regarding the reliability of financial reporting and the
preparation of financial statements for external
purposes in accordance with generally accepted
accounting principles. A company’s internal control
over financial reporting includes those policies and pro-
cedures that (i) pertain to the maintenance of records
that, in reasonable detail, accurately and fairly reflect
the transactions and dispositions of the assets of the
company; (ii) provide reasonable assurance that trans-
actions are recorded as necessary to permit preparation
of financial statements in accordance with generally
accepted accounting principles, and that receipts and
expenditures of the company are being made only in
accordance with authorizations of management and
directors of the company; and (iii) provide reasonable
assurance regarding prevention or timely detection ofReport of Independent
Registered Public
Accounting Firm
AXP / AR.2005
[ 58 ]](https://image.slidesharecdn.com/1041986/85/american-express-Annual-Reports-2005-60-320.jpg)
![unauthorized acquisition, use, or disposition of the
company’s assets that could have a material effect on the
financial statements.
Because of its inherent limitations, internal control
over financial reporting may not prevent or detect
misstatements. Also, projections of any evaluation of
effectiveness to future periods are subject to the risk that
controls may become inadequate because of changes in
conditions, or that the degree of compliance with the
policies or procedures may deteriorate.
New York, New York
February 27, 2006
Report of Independent
Registered Public
Accounting Firm
AXP / AR.2005
[ 59 ]](https://image.slidesharecdn.com/1041986/85/american-express-Annual-Reports-2005-61-320.jpg)
![REPORT OF INDEPENDENT REGISTERED
PUBLIC ACCOUNTING FIRM
The Board of Directors and Shareholders of
American Express Company
We have audited the accompanying consolidated
balance sheet of American Express Company as of
December 31, 2004, and the consolidated statements of
income, shareholders’ equity, and cash flows for the
years ended December 31, 2004 and 2003. These finan-
cial statements are the responsibility of the Company’s
management. Our responsibility is to express an opin-
ion on these financial statements based on our audits.
We conducted our audits in accordance with the stan-
dards of the Public Company Accounting Oversight
Board (United States). Those standards require that we
plan and perform the audit to obtain reasonable assur-
ance about whether the financial statements are free of
material misstatement. An audit includes examining, on
a test basis, evidence supporting the amounts and dis-
closures in the financial statements. An audit also
includes assessing the accounting principles used and
significant estimates made by management, as well as
evaluating the overall financial statement presentation.
We believe that our audits provide a reasonable basis for
our opinion.
In our opinion, the financial statements referred to
above present fairly, in all material respects, the consoli-
dated financial position of American Express Company
at December 31, 2004, and the consolidated results of
its operations and its cash flows for the years ended
December 31, 2004 and 2003, in conformity with U.S.
generally accepted accounting principles.
We also have audited, in accordance with the standards
of the Public Company Accounting Oversight Board
(United States), the effectiveness of American Express
Company’s internal control over financial reporting as of
December 31, 2004, based on criteria established in
Internal Control — Integrated Framework issued by the
Committee of Sponsoring Organizations of the Tread-
way Commission and our report dated February 18,
2005 (not included herein) expressed an unqualified
opinion thereon.
New York, New York
February 18, 2005, except for notes 2 and 19, as to
which the date is February 27, 2006
Report of Independent
Registered Public
Accounting Firm
AXP / AR.2005
[ 60 ]](https://image.slidesharecdn.com/1041986/85/american-express-Annual-Reports-2005-62-320.jpg)
![THIS PAGE INTENTIONALLY LEFT BLANK
AXP / AR.2005
[ 61 ]](https://image.slidesharecdn.com/1041986/85/american-express-Annual-Reports-2005-63-320.jpg)
![CONSOLIDATED STATEMENTS OF INCOME
American Express Company
Years Ended December 31, (Millions, except per share amounts) 2005 2004 2003
Revenues
Discount revenue $ 11,730 $ 10,249 $ 8,781
Cardmember lending net finance charge revenue 2,580 2,224 2,042
Net card fees 2,033 1,909 1,835
Travel commissions and fees 1,780 1,795 1,507
Other commissions and fees 2,456 2,284 1,960
Securitization income, net 1,260 1,132 1,105
Other investment and interest income, net 1,055 997 1,005
Other 1,373 1,374 1,314
Total 24,267 21,964 19,549
Expenses
Marketing, promotion, rewards and cardmember services 5,841 4,965 3,820
Human resources 4,829 4,538 3,917
Provisions for losses and benefits:
Charge card 1,038 833 853
Cardmember lending 1,349 1,130 1,218
Investment certificates and other 386 301 283
Total 2,773 2,264 2,354
Professional services 2,308 2,141 1,972
Occupancy and equipment 1,428 1,353 1,258
Interest 920 814 860
Communications 457 474 462
Other 1,463 1,584 1,491
Total 20,019 18,133 16,134
Pretax income from continuing operations 4,248 3,831 3,415
Income tax provision 1,027 1,145 1,080
Income from continuing operations 3,221 2,686 2,335
Income from discontinued operations, net of tax 513 830 665
Cumulative effect of accounting change related to discontinued
operations, net of tax (Note 1) — (71) (13)
Net income $ 3,734 $ 3,445 $ 2,987
Earnings Per Common Share — Basic:
Continuing operations $ 2.61 $ 2.13 $ 1.82
Discontinued operations 0.42 0.66 0.52
Cumulative effect of accounting change — (0.05) (0.01)
Net income $ 3.03 $ 2.74 $ 2.33
Earnings Per Common Share — Diluted:
Continuing operations $ 2.56 $ 2.09 $ 1.80
Discontinued operations 0.41 0.65 0.51
Cumulative effect of accounting change — (0.06) (0.01)
Net income $ 2.97 $ 2.68 $ 2.30
Average common shares outstanding for earnings
per common share:
Basic 1,233 1,259 1,284
Diluted 1,258 1,285 1,298
See Notes to Consolidated Financial Statements.
Consolidated
Statements of Income
AXP / AR.2005
[ 62 ]](https://image.slidesharecdn.com/1041986/85/american-express-Annual-Reports-2005-64-320.jpg)
![CONSOLIDATED BALANCE SHEETS
American Express Company
December 31, (Millions, except share data) 2005 2004
Assets
Cash and cash equivalents (Note 1) $ 7,126 $ 7,808
Accounts receivable and accrued interest:
Cardmember receivables, less reserves: 2005, $942; 2004, $806 33,216 30,270
Other receivables, less reserves: 2005, $66; 2004, $57 2,281 2,128
Investments (Note 3) 21,334 21,675
Loans: (Note 4)
Cardmember lending, less reserves: 2005, $996; 2004, $972 32,108 25,933
International banking, less reserves: 2005, $64; 2004, $95 7,049 6,790
Other, less reserves: 2005, $37; 2004, $17 1,644 1,533
Land, buildings and equipment — at cost, less accumulated depreciation:
2005, $2,868; 2004, $2,682 2,230 2,380
Other assets 6,972 8,558
Assets of discontinued operations (Note 2) — 87,141
Total assets $ 113,960 $ 194,216
Liabilities and Shareholders’ Equity
Customers’ deposits $ 24,579 $ 20,107
Travelers Cheques outstanding 7,175 7,287
Accounts payable 7,824 7,319
Investment certificate reserves 6,872 5,501
Short-term debt (Note 8) 15,633 14,316
Long-term debt (Note 8) 30,781 32,676
Other liabilities 10,547 10,315
Liabilities of discontinued operations (Note 2) — 80,675
Total liabilities 103,411 178,196
Shareholders’ Equity
Common shares, $.20 par value, authorized 3.6 billion shares; issued and
outstanding 1,241 million shares in 2005 and 1,249 million shares in
2004 (Note 9) 248 250
Additional paid-in capital 8,652 7,316
Retained earnings 1,788 8,196
Accumulated other comprehensive (loss) income :
Net unrealized securities gains, net of tax: 2005, ($88); 2004, ($409) 137 760
Net unrealized derivatives gains (losses), net of tax: 2005, $(77); 2004, $77 143 (142)
Foreign currency translation adjustments, net of tax: 2005, $34; 2004, $55 (400) (344)
Minimum pension liability, net of tax: 2005, $10; 2004, $8 (19) (16)
Total accumulated other comprehensive (loss) income (139) 258
Total shareholders’ equity 10,549 16,020
Total liabilities and shareholders’ equity $ 113,960 $ 194,216
See Notes to Consolidated Financial Statements.
Consolidated
Balance Sheets
AXP / AR.2005
[ 63 ]](https://image.slidesharecdn.com/1041986/85/american-express-Annual-Reports-2005-65-320.jpg)
![CONSOLIDATED STATEMENTS OF CASH FLOWS
American Express Company
Years Ended December 31, (Millions) 2005 2004 2003
Cash Flows from Operating Activities
Net income $ 3,734 $ 3,445 $ 2,987
Less: Income from discontinued operations, net of tax (513) (830) (665)
Add: Cumulative effect of accounting change related to discontinued operations,
net of tax — 71 13
Income from continuing operations 3,221 2,686 2,335
Adjustments to reconcile income from continuing operations to net cash provided
by operating activities:
Provisions for losses and benefits 2,816 2,399 2,451
Depreciation and amortization 602 600 563
Deferred taxes, acquisition costs and other (226) 934 (196)
Stock-based compensation 254 181 103
Changes in operating assets and liabilities, net of effects of acquisitions
and dispositions:
Accounts receivable and accrued interest (623) (716) (411)
Other operating assets 528 304 48
Accounts payable and other liabilities 1,243 854 650
(Decrease) increase in Travelers Cheques outstanding (111) 468 187
Net cash flow provided by (used in) operating activities attributable to
discontinued operations 341 1,433 (3,192)
Net cash provided by operating activities 8,045 9,143 2,538
Cash Flows from Investing Activities
Sale of investments 3,795 4,884 1,063
Maturity and redemption of investments 7,545 3,348 6,029
Purchase of investments (11,824) (10,623) (5,987)
Net increase in cardmember loans/receivables (12,459) (7,656) (7,021)
Proceeds from cardmember receivable securitizations 1,197 — —
Maturities of cardmember receivable securitizations (1,750) (1,050) (2,085)
Proceeds from cardmember loan securitizations 5,386 3,888 3,442
Maturities of cardmember loan securitizations (4,463) (3,000) (1,000)
Loan operations and principal collections, net (399) (489) (883)
Purchase of land, buildings and equipment (608) (616) (888)
Sale of land, buildings and equipment 248 252 80
Dispositions (acquisitions), net of cash sold/acquired (136) 1,347 (749)
Cash spun-off to Ameriprise (3,678) — —
Net cash used in investing activities attributable to discontinued operations (113) (1,895) (4,362)
Net cash used in investing activities (17,259) (11,610) (12,361)
Cash Flows from Financing Activities
Net increase (decrease) in customers’ deposits 5,331 (488) 2,267
Sale of investment certificates 5,728 4,579 4,139
Redemption of investment certificates (4,296) (3,561) (3,988)
Net decrease in debt with maturities of three months or less (339) (3,453) (712)
Issuance of debt 14,389 19,791 18,952
Principal payments on debt (14,426) (9,449) (16,498)
Redemption of preferred beneficial interests securities — — (500)
Issuance of American Express common shares and other 1,129 1,055 348
Repurchase of American Express common shares (1,853) (3,578) (1,391)
Dividends paid (597) (535) (471)
Net cash provided by financing activities attributable to discontinued operations 1,377 1,815 3,695
Net cash provided by financing activities 6,443 6,176 5,841
Effect of exchange rate changes on cash (10) 42 (150)
Net (decrease) increase in cash and cash equivalents (2,781) 3,751 (4,132)
Cash and cash equivalents at beginning of year includes cash of discontinued
operations: 2005, $2,099; 2004, $2,189; 2003, $6,349 9,907 6,156 10,288
Cash and cash equivalents at end of year includes cash of discontinued
operations: 2004, $2,099; 2003, $2,189 $ 7,126 $ 9,907 $ 6,156
See Notes to Consolidated Financial Statements.
Consolidated
Statements of
Cash Flows
AXP / AR.2005
[ 64 ]](https://image.slidesharecdn.com/1041986/85/american-express-Annual-Reports-2005-66-320.jpg)
![CONSOLIDATED STATEMENTS OF SHAREHOLDERS’ EQUITY
American Express Company
Three years ended December 31, 2005 (Millions) Total
Common
Shares
Additional
Paid-in
Capital
Accumulated
Other
Comprehensive
Income/(Loss)
Retained
Earnings
Balances at December 31, 2002 $ 13,861 $ 261 $ 5,675 $ 319 $ 7,606
Comprehensive income:
Net income 2,987 2,987
Change in net unrealized securities gains (173) (173)
Change in net unrealized derivatives losses (323) (323)
Derivatives losses reclassified to earnings 415 415
Foreign currency translation adjustments (80) (80)
Minimum pension liability adjustment 34 34
Total comprehensive income 2,860
Repurchase of common shares (1,391) (7) (160) (1,224)
Other changes, primarily employee plans 488 3 566 (81)
Cash dividends declared:
Common, $0.38 per share (495) (495)
Balances at December 31, 2003 15,323 257 6,081 192 8,793
Comprehensive income:
Net income 3,445 3,445
Change in net unrealized securities gains (171) (171)
Change in net unrealized derivatives losses 6 6
Derivatives losses reclassified to earnings 298 298
Foreign currency translation adjustments (66) (66)
Minimum pension liability adjustment (1) (1)
Total comprehensive income 3,511
Repurchase of common shares (3,578) (14) (338) (3,226)
Other changes, primarily employee plans 1,320 7 1,573 (260)
Cash dividends declared:
Common, $0.44 per share (556) (556)
Balances at December 31, 2004 16,020 250 7,316 258 8,196
Comprehensive income:
Net income 3,734 3,734
Change in net unrealized securities gains (607) (607)
Change in net unrealized derivatives gains (losses) 319 319
Derivative gains reclassified to earnings (44) (44)
Foreign currency translation adjustments (81) (81)
Minimum pension liability adjustment (2) (2)
Total comprehensive income 3,319
Spin-off of Ameriprise (7,746) 18 (7,764)
Repurchase of common shares (1,853) (7) (209) (1,637)
Other changes, primarily employee plans 1,405 5 1,545 (145)
Cash dividends declared:
Common, $0.48 per share (596) (596)
Balances at December 31, 2005 $10,549 $ 248 $ 8,652 $(139) $ 1,788
See Notes to Consolidated Financial Statements.
Consolidated
Statements of
Shareholders’ Equity
AXP / AR.2005
[ 65 ]](https://image.slidesharecdn.com/1041986/85/american-express-Annual-Reports-2005-67-320.jpg)
![NOTES TO CONSOLIDATED
FINANCIAL STATEMENTS
NOTE 1 Summary of Significant
Accounting Policies
The Company
American Express Company (the Company) is a leading
global payments, network and travel company. The Com-
pany offers a broad range of products including charge
and credit cards; stored value products such as Travelers
Cheques and gift cards; travel agency services and travel,
entertainment and purchasing expense management ser-
vices; network services and merchant acquisition and
merchant processing for our network partners and pro-
prietary payments businesses. The Company’s various
products are sold globally to diverse customer groups,
including consumers, small businesses, mid-market
companies, large corporations and banking institutions.
These products are sold through various channels includ-
ing direct mail, on-line applications, targeted sales-forces
and direct response advertising.
Discontinued operations
On September 30, 2005, the Company completed
the spin-off of Ameriprise Financial, Inc. (Ameriprise),
formerly known as American Express Financial
Corporation, the Company’s financial planning and
financial services business. In addition, during the third
quarter of 2005, the Company completed certain
dispositions including the sale of American Express Tax
and Business Services, Inc. (TBS), its tax, accounting
and consulting business. The operating results and
assets and liabilities related to Ameriprise and certain
dispositions (including TBS) prior to disposal have been
reflected as discontinued operations in the Consolidated
Financial Statements (see Note 2). In addition, the cash
flows associated with discontinued operations are pre-
sented separately in the accompanying Consolidated
Statements of Cash Flows, which is a revision from the
cash flow presentation as of September 30, 2005. Unless
otherwise noted, amounts in these Notes to the Consoli-
dated Financial Statements exclude amounts attribut-
able to discontinued operations.
Segment reporting
Effective September 30, 2005, the Company realigned
its segment presentation to reflect the spin-off of
Ameriprise. The new segments are: U.S. Card Services,
International Card & Global Commercial Services,
Global Network & Merchant Services, and Corporate &
Other. See Note 19 for further discussion regarding the
Company’s segments.
Principles of Consolidation
The Company consolidates all non-variable interest
entities in which it holds a greater than 50 percent vot-
ing interest. Entities in which the Company holds a
greater than 20 percent but less than 50 percent voting
interest are accounted for under the equity method. All
other investments are accounted for under the cost
method unless the Company determines that it exercises
significant influence over the entity by means other than
voting rights, in which case these entities are accounted
for under the equity method.
The Company also consolidates all Variable Interest
Entities (VIEs) for which it is considered to be the pri-
mary beneficiary pursuant to Financial Accounting
Standards Board (FASB) Interpretation No. 46, “Con-
solidation of Variable Interest Entities,” as revised (FIN
46(R)). The determination as to whether an entity is a
VIE is based on the amount and characteristics of the
entity’s equity. In general, FIN 46(R) requires a VIE to
be consolidated when an enterprise has a variable inter-
est for which it is deemed to be the primary beneficiary,
which means that it will absorb a majority of the VIE’s
expected losses or receive a majority of the VIE’s
expected residual return.
Qualifying Special Purpose Entities (QSPEs) under
Statement of Financial Accounting Standards (SFAS)
No. 140, “Accounting for Transfers and Servicing of
Financial Assets and Extinguishments of Liabilities,” are
not consolidated. Such QSPEs include those that the
Company utilizes in connection with cardmember lend-
ing securitizations at U.S. Card Services. Other entities
where the Company has an interest or is the sponsor or
transferor are evaluated using the control, risk and
reward criteria as outlined under U.S. generally
accepted accounting principles (GAAP).
All significant intercompany transactions are elimi-
nated. Certain reclassifications of prior period amounts
have been made to conform to the current presentation.
Foreign Currency Translation
Assets and liabilities denominated in foreign curren-
cies are translated into U.S. dollars based upon
exchange rates prevailing at the end of each year.
The resulting translation adjustments, along with any
related hedge and tax effects, are included in accumu-
lated other comprehensive (loss) income, a component
of shareholders’ equity. Revenues and expenses are
translated at the average month end exchange rates dur-
ing the year. Gains and losses related to non-functional
currency transactions, including non-U.S. operations
Notes to Consolidated
Financial Statements
AXP / AR.2005
[ 66 ]](https://image.slidesharecdn.com/1041986/85/american-express-Annual-Reports-2005-68-320.jpg)
![where the functional currency is the U.S. dollar, are
reported net in other revenue or other expense, depend-
ing on the nature of the activity, in the Company’s
Consolidated Statements of Income. Net foreign cur-
rency transaction gains (losses) amounted to approxi-
mately $5 million, $(113) million and $(94) million in
2005, 2004 and 2003, respectively.
Amounts Based on Estimates and Assumptions
Accounting estimates are an integral part of the Consoli-
dated Financial Statements. In part, they are based upon
assumptions concerning future events. Among the more
significant assumptions are those that relate to reserves
for cardmember credit losses, asset securitizations and
Membership Rewards as discussed in detail below.
These accounting estimates reflect the best judgment of
management and actual results could differ.
Revenues
The Company generates revenue from a variety of sources
including global payments, such as charge and credit
cards, travel services and investments funded by the sale
of stored value products, including Travelers Cheques.
Discount revenue
The Company earns discount revenue from fees charged
to service establishments with whom the Company has
entered into card acceptance agreements for processing
cardmember transactions. The discount is generally
deducted from the payment to the service establishment
and recorded as discount revenue at the time the charge
is captured.
Cardmember lending net finance charge revenue
Cardmember lending finance charges are assessed using
the average daily balance method for receivables owned
and are recognized based upon the principal amount
outstanding in accordance with the terms of the appli-
cable account agreement until the outstanding balance
is paid or written-off. Cardmember lending net finance
charge revenue is presented net of interest expense of
$869 million, $571 million and $483 million for 2005,
2004 and 2003, respectively.
Net card fees
Card fees are recognized as revenue over the card mem-
bership period covered by the card fee, net of provision
for projected refunds of card fees for cancellation of card
membership. Similarly, direct card acquisition costs are
deferred and amortized into operating expenses over the
card membership period covered by the card fee.
Travel commissions and fees
Customer revenue is earned by charging a transaction
or management fee for airline or other transactions.
Customer-related fees and other revenues are recog-
nized at the time a client books travel arrangements.
Travel suppliers pay commissions on airline tickets
issued and on sales and transaction volumes, based on
contractual agreements. These revenues are recognized
at the time a ticket is purchased. Other travel suppliers
that pay commissions on hotels and car rentals are gen-
erally not under firm contractual agreements, and,
therefore, revenue is recognized when cash is received.
Other commissions and fees
Other commissions and fees include foreign exchange
conversion fees and other card-related assessments,
which are primarily recognized in the period charged to
the cardmember. Fees related to the Company’s Mem-
bership Rewards program are recognized over the
period covered by the fee.
Securitization income, net
Net securitization income includes non-credit provision
components of the net gains and charges from securi-
tization activities, impairment charges, if any, of the
related interest-only strip, excess spread related to secu-
ritized cardmember loans, net finance charge revenue
on retained interests in securitized cardmember loans
and servicing income, net of related discounts or fees.
Excess spread is the net positive cash flow from interest
and fee collections allocated to the third-party investors’
interests in the securitization after deducting the interest
paid on the investor certificates, credit losses, contrac-
tual servicing fees and other expenses. Excess spread is
recognized as it is earned. See Note 5 for further infor-
mation regarding securitizations.
Other investment and interest income, net
Investment income for the Company’s performing fixed
income securities is generally accrued as earned using
the effective interest method, which makes an adjust-
ment of the yield for security premiums and discounts,
fees and other payments, so that the related security rec-
ognizes a constant rate of return on the outstanding bal-
ance throughout its term.
Notes to Consolidated
Financial Statements
AXP / AR.2005
[ 67 ]](https://image.slidesharecdn.com/1041986/85/american-express-Annual-Reports-2005-69-320.jpg)
![Investment income for the Company’s international
banking and other loans is accrued on unpaid principal
balances in accordance with the terms of the loans
unless collection of interest is in doubt, in which case
interest income is recognized only to the extent it is
received in cash. Generally, the accrual of interest on
these loans and advances is discontinued at the time the
loan is 90 days delinquent, depending on loan type, or
when an impairment is determined. When there is
doubt regarding the ultimate collectibility of outstand-
ing balances, all cash received is applied to reduce the
carrying value of the loan or advance. Fees are amortized
over the life of the loan or advance using the effective
interest method. Other investment income and interest
income is presented net of interest expense of $321 mil-
lion, $220 million and $216 million for 2005, 2004 and
2003, respectively, related primarily to the Company’s
international banking operations.
Expenses
Stock-based compensation
Effective July 1, 2005, the Company adopted SFAS No.
123 (revised 2004), “Share-Based Payment (SFAS No.
123(R)),” using the modified prospective application.
SFAS No. 123(R) requires entities to measure and rec-
ognize the cost of employee services received in
exchange for an award of equity instruments based on
the grant-date fair value of the award and applies to (i)
new awards, (ii) awards modified, repurchased, or can-
celled after the adoption date, and (iii) any outstanding
awards accounted for under APB Opinion No. 25,
“Accounting for Stock Issued to Employees,” for which
all requisite service has not yet been rendered. The
adoption of SFAS No. 123(R) did not have a material
impact on the Company’s financial statements since the
Company has been expensing share based awards
granted after January 1, 2003 under the provisions of
SFAS No. 123, “Accounting for Stock-Based Compen-
sation” (SFAS No. 123). The Company recognizes the
cost of these awards on a straight line basis over their
vesting periods. Also, SFAS No. 123(R) requires compa-
nies to calculate the pool of income tax benefits that
were previously recorded in additional paid-in capital
and are available to absorb future income tax benefit
deficiencies that can result from the exercise or maturity
of stock awards. The Company has calculated its pool
based on the actual income tax benefits received from
exercises and maturities of stock awards granted after
the effective date of SFAS No. 123, January 1, 1995.
The following table illustrates the effect on net income
and earnings per common share (EPS) assuming the
Company had followed the fair value recognition
provisions of SFAS No. 123(R) for all outstanding and
unvested stock options and other stock-based compen-
sation for the three years ended December 31, 2005:
(Millions, except per share amounts) 2005 2004 2003
Net income as reported $ 3,734 $ 3,445 $ 2,987
Add: Stock-based employee compensation expense included in reported net
income, net of related tax effects(a)
207 184 113
Deduct: Total stock-based employee compensation expense determined under
fair value based method, net of related tax effects(a)
(216) (368) (383)
Pro forma net income $ 3,725 $ 3,261 $ 2,717
Basic EPS:
As reported $ 3.03 $ 2.74 $ 2.33
Pro forma $ 3.02 $ 2.59 $ 2.12
Diluted EPS:
As reported $ 2.97 $ 2.68 $ 2.30
Pro forma $ 2.96 $ 2.54 $ 2.09
(a)Includes amounts related to discontinued operations.
Marketing, promotion, rewards and
cardmember services
These expenses include the costs of rewards programs
(including Membership Rewards which is discussed fur-
ther in the other liabilities section), protection plans and
complimentary services provided to cardmembers,
except that cash paid to cardmembers under cash-back
programs is recorded as a reduction to revenues. These
expenses also include advertising costs which are
expensed in the year in which the advertising first
takes place.
Balance Sheet
Cash and cash equivalents
The Company has defined cash equivalents to include
time deposits and other highly liquid investments with
original maturities of 90 days or less. The Company
classified restricted cash totaling $451 million and
Notes to Consolidated
Financial Statements
AXP / AR.2005
[ 68 ]](https://image.slidesharecdn.com/1041986/85/american-express-Annual-Reports-2005-70-320.jpg)
![$552 million at December 31, 2005 and 2004,
respectively, in other assets in cases where cash cannot
be utilized for operations.
Accounts receivable
Cardmember receivables
Cardmember receivables represent amounts due from
charge card customers and are recorded at the time that
a cardmember enters into a point-of-sale transaction at
a service establishment. Cardmember receivable bal-
ances are presented on the balance sheet net of reserves
for losses, which are discussed below, and typically
include principal and any related accrued fees.
Reserves for losses — cardmember receivables
The Company’s reserves for losses relating to cardmember
receivables represent management’s estimate of the
incurred losses inherent in the Company’s outstanding
portfolio of receivables. Management’s evaluation process
requires certain estimates and judgments. Reserves for
these losses are primarily based upon models that analyze
specific portfolio statistics and also reflect, to a lesser
extent, management’s judgment regarding overall
adequacy. The analytic models take into account several
factors, including average write-off rates for various stages
of receivable aging (i.e., current, 30 days, 60 days, 90 days)
over a 24-month period and average bankruptcy and
recovery rates. Management considers whether adjust-
ments to the analytic models are necessary based on other
factors such as the level of coverage of past-due accounts,
as well as external indicators, such as leading economic
indicators, unemployment rate, consumer confidence
index, purchasing manager’s index, bankruptcy filings and
thelegalandregulatoryenvironment.Cardmemberreceiv-
able balances are written-off when management deems
amounts to be uncollectible, which is generally deter-
mined by the number of days past due. In general, bank-
ruptcy and deceased accounts are written-off upon notifi-
cation, while other accounts are written-off when 360 days
past due. To the extent historical credit experience is not
indicative of future performance or other assumptions
used by management do not prevail, actual loss experience
could differ significantly, resulting in either higher or lower
future provisions for losses, as applicable.
Investments
Available-for-Sale investment securities are carried at
fair value on the balance sheet with unrealized gains
(losses) recorded in equity, net of income tax provisions
(benefits). Gains and losses are recognized in results of
operations upon disposition of the securities. Gains and
losses on investments (other than trading securities)
are recognized using the specific identification method
on a trade date basis. In addition, realized losses are
also recognized when management determines that a
decline in value is other-than-temporary, which requires
judgment regarding the amount and timing of recovery.
Indicators of other-than-temporary impairment for debt
securities include issuer downgrade, default or bank-
ruptcy. The Company also considers the extent to which
cost exceeds fair value, the duration and size of that gap,
and management’s judgment about the issuer’s current
and prospective financial condition. Fair value is gener-
ally based on quoted market prices. Trading investments
are carried at fair value on the balance sheet with the
changes in fair value recorded in results of operations.
Loans
Cardmember lending
Cardmember loans represent amounts due from cus-
tomers of the Company’s lending products, and are
recorded at the time that a cardmember enters into a
point-of-sale transaction at a service establishment.
These loans are presented on the balance sheet net of
reserves for cardmember losses, which are explained
further below, and include accrued interest receivable
and fees as of the balance sheet date. Additionally,
cardmember loans include balances with extended pay-
ment terms on certain charge card products. The Com-
pany’s policy is to cease accruing for interest receivable
once a related cardmember loan is greater than 180 days
past due.
Reserve for losses — cardmember lending
The Company’s reserves for losses relating to card-
member loans represent management’s estimate of the
incurred losses inherent in the Company’s outstanding
loan portfolio. Management’s evaluation process requires
certain estimates and judgments. Reserves for these losses
are primarily based upon models that analyze specific
portfolio statistics and also reflect, to a lesser extent, man-
agement’s judgment regarding overall adequacy. The ana-
lytic models take into account several factors, including
average write-off rates for various stages of receivable
aging (i.e., current, 30 days, 60 days, 90 days) over a
24-month period and average bankruptcy and recovery
rates. Management considers whether adjustments to the
analytic model are necessary based on other factors such
as the level of coverage of past-due accounts, as well as
external indicators, such as leading economic indicators,
unemployment rate, consumer confidence index,
purchasing manager’s index, bankruptcy filings and the
legal and regulatory environment. Notes to Consolidated
Financial Statements
AXP / AR.2005
[ 69 ]](https://image.slidesharecdn.com/1041986/85/american-express-Annual-Reports-2005-71-320.jpg)
![Cardmember loans are written-off when management
deems amounts to be uncollectible, which is generally
determined by the number of days past due. In general,
bankruptcy and deceased accounts are written-off upon
notification, while other accounts are written-off when
180 days past due. To the extent historical credit
experience is not indicative of future performance or
other assumptions used by management do not prevail,
actual loss experience could differ significantly, resulting
in either higher or lower future provisions for losses,
as applicable.
International banking
International banking loans primarily represent
amounts due from consumers, high net worth individu-
als, banks and other institutions, and corporations.
Consumer and private banking loans include unsecured
lines of credit, installment loans, mortgage loans and
auto loans to retail customers as well as secured lending
to high net worth individuals. Loans to banks and other
institutions represent trade-related financing and other
extensions of credit. Corporate loans represent commer-
cial and industrial loans as well as mortgage and real
estate loans to corporate customers. International
banking loans are stated at the principal amount out-
standing net of unearned income and are presented on
the balance sheet net of reserves for losses which are
discussed below.
Reserve for losses — international banking
For smaller-balance consumer loans, management
establishes reserves for incurred losses inherent in the
portfolio. Generally, these loans are written-off in full
when an impairment is determined or when the loan
becomes 120 or 180 days past due, depending on loan
type. Loans, other than smaller-balance consumer loans
(including loans impaired under SFAS No. 114,
“Accounting by Creditors for Impairment of a Loan”),
are placed on nonperforming status when payments of
principal or interest are 90 days past due or if, in man-
agement’s opinion, the borrower is unlikely to meet its
contractual obligations. The allowance for impaired
loans is measured as the excess of the loan’s recorded
investment over either the present value of expected
principal and interest payments discounted at the loan’s
effective interest rate or, if more practical for collateral
dependent loans, the fair value of collateral. For floating
rate impaired loans, the effective interest rate is fixed
at the rate in effect at the date the impairment criteria
are met.
Other loans
Other loans primarily represent installment loans,
revolving credit due from U.S. Card Services’ customers,
loans and interest-bearing advances to airline partners.
Interest-bearing advances to airline partners will be
reduced by mileage credits purchased from these part-
ners through 2008.
Asset securitizations
The Company periodically securitizes cardmember
receivables and loans. Securitization of the Company’s
cardmember receivables and loans is accomplished
through the transfer of those assets to a trust, which in
turn issues securities that are collateralized by the trans-
ferred assets to third-party investors. The Company
accounts for its transfers of financial assets in accordance
with SFAS No. 140. In order for a securitization of
financial assets to be accounted for as a sale under
SFAS No. 140, the transferor must surrender control
over those financial assets to the extent that consider-
ation other than beneficial interests in the transferred
assets is received in exchange. Cardmember loans are
transferred to a qualifying special purpose entity, and
such transactions are structured to meet the sales criteria
of SFAS No. 140. Accordingly, when loans are sold
through securitizations, the Company removes the
loans from its Consolidated Balance Sheets and recog-
nizes both a gain on sale and the retained interests in
the securitization.
Cardmember receivables are transferred to a special
purpose entity, a trust which does not meet the require-
ments for treatment as a qualifying sale under
SFAS No. 140. Therefore, securitizations of cardmember
receivables are accounted for as secured borrowings
in accordance with SFAS No. 140.
Land, buildings and equipment
Land, buildings and equipment
Buildings and equipment, including leasehold improve-
ments, are carried at cost less accumulated depreciation.
Costs incurred during construction, as well as related
interest, are capitalized and are depreciated once an
asset is placed in service. Depreciation is generally com-
puted using the straight-line method over the estimated
useful lives of assets, which range from three to eight
years for equipment. Buildings are depreciated based
upon their estimated useful life at the acquisition date
which generally ranges from 39 to 50 years. Leasehold
improvements are depreciated using the straight-line
Notes to Consolidated
Financial Statements
AXP / AR.2005
[ 70 ]](https://image.slidesharecdn.com/1041986/85/american-express-Annual-Reports-2005-72-320.jpg)
![method over the lesser of the remaining term of the
leased facility or the economic life of the improvement
which ranges from 5 to 10 years.
Software development costs
The Company capitalizes certain costs associated with
the acquisition or development of internal-use software.
Once the software is ready for its intended use, these
costs are amortized on a straight-line basis over the soft-
ware’s estimated useful life of five years.
Goodwill and other intangible assets
Goodwill
Goodwill represents the excess of acquisition cost of an
acquired company over the fair value of assets acquired
and liabilities assumed. Goodwill is included in other
assets on the Consolidated Balance Sheets. The Com-
pany evaluates goodwill for impairment annually and
whenever events and circumstances make it likely that
impairment may have occurred, such as a significant
adverse change in the business climate or a decision to
sell or dispose of a reporting unit. In determining
whether impairment has occurred, the Company
generally uses a comparative market multiples approach
for calculating fair value.
Intangible assets
Intangible assets, including purchased credit card rela-
tionships, other customer relationships and other intan-
gible assets are amortized over their estimated useful
lives unless they are deemed to have indefinite useful
lives. Intangible assets are included in other assets on the
Consolidated Balance Sheets. The Company evaluates
intangible assets annually for impairment and whenever
events and circumstances make it likely that impairment
may have occurred, such as a significant adverse change
in the business climate or a decision to sell or dispose
of a reporting unit. For intangible assets subject to amor-
tization, impairment is recognized if the carrying
amount is not recoverable and the carrying amount
exceeds the fair value of the intangible asset.
Other liabilities
Membership Rewards
The Company’s Membership Rewards program allows
enrolled cardmembers to earn points that can be
redeemed for a broad range of rewards including travel,
entertainment, retail certificates and merchandise. The
Company establishes balance sheet reserves to cover the
cost of future reward redemptions for points earned to
date. The reserve for Membership Rewards is estimated
using models that analyze historical redemption statistics
since the inception of the program and reflect, to a
lesser extent, management’s judgment regarding overall
adequacy. The provision for the cost of Membership
Rewards, which is included in marketing, promotion,
rewards and cardmember services, is based upon points
earned that are expected to be ultimately redeemed by
cardmembers and the current weighted-average cost per
point of redemption. The estimated points to be
redeemed by cardmembers are based on many factors
including past redemption behavior of cardmembers,
card product type, year of program enrollment and card
spend level. Past behavior is used to estimate when
current enrollees will leave the program and their ulti-
mate redemption rate on points earned to date, but not
yet redeemed.
The liability for Membership Rewards was $3.1 billion
and $2.5 billion at December 31, 2005 and 2004,
respectively, and is included in other liabilities.
Derivative financial instruments and hedging activities
SFAS No. 133, “Accounting for Derivative Instruments
and Hedging Activities,” as amended, establishes
accounting and reporting requirements for derivative
financial instruments, including hedging activities.
SFAS No. 133 requires that all derivatives are recognized
on balance sheet at fair value as either assets or liabilities
in the Company’s Consolidated Balance Sheets. The fair
value of the Company’s derivative financial instruments
are determined using either market quotes or valuation
models that are based upon the net present value of esti-
mated future cash flows and incorporate current market
data inputs. The Company reports its derivative assets
and liabilities in other assets and other liabilities, respec-
tively, on a net by counterparty basis where management
believes it has the legal right of offset under enforceable
netting agreements. The accounting for the change in
the fair value of a derivative instrument depends on its
intended use and the resulting hedge designation, if any.
Cash flow hedges
For derivative financial instruments that qualify as cash
flow hedges, the effective portions of the gain or loss on
the derivatives are recorded in accumulated other
comprehensive (loss) income and reclassified into
earnings when the hedged item or transactions impact
earnings. The amount that is reclassified into earnings
is presented in the income statement with the hedged
instrument or transaction impact, generally, in net other
investment and interest income or interest expense. Any
ineffective portion of the gain or loss, as determined
by the accounting requirements, is reported as a
component of other revenue. If a hedge is de-designated
or terminated prior to maturity, the amount previously
Notes to Consolidated
Financial Statements
AXP / AR.2005
[ 71 ]](https://image.slidesharecdn.com/1041986/85/american-express-Annual-Reports-2005-73-320.jpg)
![recorded in accumulated other comprehensive (loss)
income is recognized into earnings over the period
that the hedged item impacts earnings. For any
hedge relationships that are discontinued because it is
probable that the forecasted transaction will not
occur according to the original strategy, any related
amounts previously recorded in accumulated other
comprehensive (loss) income are recognized into
earnings immediately.
Fair value hedges
For derivative financial instruments that qualify as fair
value hedges, changes in the fair value of the derivatives
as well as of the corresponding hedged assets, liabilities
or firm commitments are recorded in earnings as a
component of other revenue. If a fair value hedge is
de-designated or terminated prior to maturity, previous
adjustments to the carrying value of the hedged item are
recognized into earnings to match the earnings pattern
of the hedged item.
Net investment hedges in foreign operations
For derivative financial instruments that qualify as net
investment hedges in foreign operations, the effective
portions of the change in fair value of the derivatives are
recorded in accumulated other comprehensive (loss)
income as part of the cumulative translation adjustment.
Any ineffective portions of net investment hedges
are recognized in other revenue during the period
of change.
Non-designated derivatives and trading activities
For derivative financial instruments that do not qualify
for hedge accounting, are not designated under SFAS
No. 133 as hedges or are comprised of customer or
proprietary trading activities, changes in fair value are
reported in current period earnings generally as a com-
ponent of other revenue, other operating expenses or
interest expense, depending on the type of derivative
instrument and the nature of the transaction.
Derivative financial instruments that qualify for
hedge accounting
Derivative financial instruments that are entered into for
hedging purposes are designated as such at the time that
the Company enters into the contract. As required by
SFAS No. 133, for all derivative financial instruments
that are designated for hedging activities, the Company
formally documents all of the hedging relationships
between the hedge instruments and the hedged items at
the inception of the relationships. Management also for-
mally documents its risk management objectives and
strategies for entering into the hedge transactions. The
Company formally assesses, at inception and on a quar-
terly basis, whether derivatives designated as hedges are
highly effective in offsetting the fair value or cash flows
of hedged items. Such assessments are usually made
through the application of statistical measures. The
Company only applies the “short cut” method of hedge
accounting in very limited cases when such require-
ments are strictly met. In accordance with its risk man-
agement policies, the Company generally structures its
hedges with very similar terms to the hedged items;
therefore, when applying the accounting requirements,
the Company generally recognizes insignificant
amounts of ineffectiveness through earnings. If it is
determined that a derivative is not highly effective as a
hedge, the Company will discontinue the application of
hedge accounting.
Income taxes
The Company, its 80 percent or more owned U.S. sub-
sidiaries and certain non-U.S. subsidiaries file a consoli-
dated federal income tax return. Deferred tax assets and
liabilities are determined based on the differences
between the financial statement and tax bases of assets
and liabilities using the enacted tax rates expected to be
in effect for the years in which the differences are
expected to reverse. A valuation allowance is established
when management determines that it is more likely than
not that the benefit of the deferred tax asset will not be
realized. The Company does not provide for federal
income taxes on foreign earnings intended to be perma-
nently reinvested outside the United States.
The Company is under continuous examination by the
Internal Revenue Service (IRS) and tax authorities in
other countries and states in which the Company has
significant business operations. The tax years under
examination vary by jurisdiction. The Company rou-
tinely assesses the likelihood of additional assessments
in each of the taxing jurisdictions resulting from these
examinations. Tax reserves have been established that
the Company believes to be adequate in relation to the
potential for additional assessments. Once established,
Notes to Consolidated
Financial Statements
AXP / AR.2005
[ 72 ]](https://image.slidesharecdn.com/1041986/85/american-express-Annual-Reports-2005-74-320.jpg)
![reserves are adjusted when there is more information
available, a change in circumstance or when an event
occurs necessitating a change to the reserves.
Recently Issued Accounting Standards
Effective July 1, 2005, the Company adopted SFAS No.
123(R), using the modified prospective application as
discussed earlier.
In December 2004, the FASB issued FASB Staff Position
(FSP) FAS 109-2, “Accounting and Disclosure Guidance
for the Foreign Earnings Repatriation Provision within
the American Jobs Creation Act of 2004 (the Act)” (FSP
FAS 109-2), which would allow additional time beyond
the financial reporting period of enactment to evaluate
the effect of the Act on the Company’s plan for reinvest-
ment or repatriation of foreign earnings for purposes of
calculating the income tax provision. The Company did
not repatriate any foreign earnings as a result of the Act.
Effective January 1, 2004, the Company adopted the
American Institute of Certified Public Accountants
Statement of Position 03-1, “Accounting and Reporting
by Insurance Enterprises for Certain Nontraditional
Long-Duration Contracts and for Separate Accounts”
(SOP 03-1). The adoption of SOP 03-1 as of January 1,
2004 resulted in a cumulative effect of accounting
change which related to discontinued operations, that
reduced first quarter 2004 results by $71 million ($109
million pretax).
On November 3, 2005, the FASB issued FSP FAS 115-1,
“The Meaning of Other-Than-Temporary Impairment
and Its Application to Certain Investments.” The Com-
pany believes its current procedures are consistent with
the requirements of FSP FAS 115-1.
In January 2003, the FASB issued FIN 46 which
addresses consolidation by business enterprises of vari-
able interest entities and was subsequently revised in
September 2003. The consolidation of FIN 46-related
entities resulted in a cumulative effect of accounting
change, related to discontinued operations, that
reduced 2003 net income through a non-cash charge of
$13 million ($20 million pretax). See Note 6 for further
discussion of variable interest entities.
NOTE 2 Discontinued Operations
On September 30, 2005, the Company completed the
distribution of Ameriprise common stock to the
Company’s shareholders in a tax-free transaction for
U.S. federal income tax purposes. The Ameriprise
distribution was treated as a non-cash dividend to
shareholders and, as such, reduced the Company’s
shareholders’ equity by $7.7 billion, which included an
approximate $1.1 billion capital contribution to
Ameriprise in connection with the distribution. Accord-
ingly, the Company’s Consolidated Balance Sheet as of
December 31, 2005 reflects the non-cash dividend and
a decrease in assets and liabilities.
In addition, during 2005, the Company completed
certain dispositions (including TBS) for cash proceeds
of approximately $190 million. These dispositions
resulted in a net after-tax gain of approximately $63 mil-
lion during the third quarter of 2005.
The operating results and assets and liabilities of
discontinued operations are presented separately in the
Company’s Consolidated Financial Statements and the
notes to the Consolidated Financial Statements have been
adjusted to exclude discontinued operations. Summary
operating results of the discontinued operations for the
years ended December 31, 2005, 2004 and 2003 were:
(Millions) 2005(a)
2004 2003
Revenues(b)
$ 5,813 $ 7,161 $ 6,298
Pretax income from
discontinued operations(c)
$ 690 $ 1,120 $ 832
(a)2005 results are lower than previous periods reflecting dispositions as of
September 30, 2005.
(b)Includes revenues from certain dispositions other than Ameriprise
(principally TBS) of approximately $325 million, $398 million and
$382 million for the three years ended December 31, 2005, 2004 and
2003, respectively.
(c)Income tax provision for the years ended December 31, 2005, 2004 and
2003 was $177 million, $290 million and $167 million, respectively.
In addition to income from discontinued operations, in
2004 and 2003, the Company recognized charges from
the cumulative effects of accounting changes related to
discontinued operations (See Note 1). Included in the
assets that were discontinued as of September 30, 2005
was approximately $670 million of goodwill.
Notes to Consolidated
Financial Statements
AXP / AR.2005
[ 73 ]](https://image.slidesharecdn.com/1041986/85/american-express-Annual-Reports-2005-75-320.jpg)
![A summary of the assets and liabilities of the discontin-
ued operations at December 31 is as follows:
(Millions) 2004
Assets:
Investments $ 39,134
Separate account assets 35,901
Deferred acquisition costs 3,838
Other assets 8,268
Total assets $ 87,141
Liabilities:
Insurance and annuity reserves $ 32,966
Investment certificate reserves 5,831
Separate account liabilities 35,901
Other liabilities 5,977
Total liabilities $ 80,675
Net Assets $ 6,466
Accumulated other comprehensive income, net of tax,
associated with discontinued operations at December 31,
2004 was $360 million, including $407 million of net
unrealized securities gains and $29 million of net unre-
alized derivative losses.
NOTE 3 Investments
The following is a summary of investments at December 31:
(Millions) 2005 2004
Available-for-Sale, at fair value
State and municipal obligations $ 7,120 $ 7,381
U.S. Government and
agencies obligations 5,033 4,060
Mortgage and other asset-
backed securities 3,838 4,322
Corporate debt securities 3,202 3,751
Foreign government bonds
and obligations 716 750
Other 1,194 1,171
Total Available-for-Sale, at
fair value 21,103 21,435
Trading, at fair value 231 240
Total Investments $ 21,334 $ 21,675
Available-for-Sale Investments
Investments classified as Available-for-Sale at December 31 are distributed by type as presented below:
2005 2004
(Millions) Cost
Gross
Unrealized
Gains
Gross
Unrealized
Losses
Fair
Value Cost
Gross
Unrealized
Gains
Gross
Unrealized
Losses
Fair
Value
State and municipal
obligations $ 6,832 $ 293 $ (5) $ 7,120 $ 6,982 $ 404 $ (5) $ 7,381
U.S. Government and
agencies obligations 5,080 1 (48) 5,033 4,109 1 (50) 4,060
Mortgage and other asset-
backed securities 3,900 13 (75) 3,838 4,295 50 (23) 4,322
Corporate debt securities 3,170 79 (47) 3,202 3,627 137 (13) 3,751
Foreign government bonds
and obligations 718 7 (9) 716 741 16 (7) 750
Other 1,184 10 — 1,194 1,158 13 — 1,171
Total $ 20,884 $ 403 $ (184) $ 21,103 $ 20,912 $ 621 $ (98) $ 21,435
Notes to Consolidated
Financial Statements
AXP / AR.2005
[ 74 ]](https://image.slidesharecdn.com/1041986/85/american-express-Annual-Reports-2005-76-320.jpg)
![The following table provides information about Available-for-Sale investments with gross unrealized losses and the
length of time that individual securities have been in a continuous unrealized loss position as of December 31, 2005:
(Millions) Less than 12 months 12 months or more Total
Description of Securities
Fair
Value
Gross
Unrealized
Losses
Fair
Value
Gross
Unrealized
Losses
Fair
Value
Gross
Unrealized
Losses
State and municipal obligations $ 392 $ (4) $ 19 $ (1) $ 411 $ (5)
U.S. Government and
agencies obligations 1,716 (17) 2,893 (31) 4,609 (48)
Mortgage and other asset-
backed securities 1,803 (31) 1,298 (44) 3,101 (75)
Corporate debt securities 750 (15) 821 (32) 1,571 (47)
Foreign government bonds
and obligations 283 (2) 58 (7) 341 (9)
Other 10 — 6 — 16 —
Total $ 4,954 $ (69) $ 5,095 $ (115) $ 10,049 $ (184)
In evaluating potential other-than-temporary impairments, the Company considers the extent to which amortized
cost exceeds fair value and the duration and size of that difference. A key metric in performing this evaluation is
the ratio of fair value to amortized cost. The following table summarizes the unrealized losses of temporary impair-
ments by ratio of fair value to cost as of December 31, 2005:
(Millions, except
number of securities) Less than 12 months 12 months or more Total
Ratio of Fair Value to
Amortized Cost
Number of
Securities
Fair
Value
Gross
Unrealized
Losses
Number of
Securities
Fair
Value
Gross
Unrealized
Losses
Number of
Securities
Fair
Value
Gross
Unrealized
Losses
95%–100% 700 $ 4,940 $ (67) 254 $ 4,862 $ (97) 954 $ 9,802 $ (164)
90%–95% 12 11 (1) 17 177 (10) 29 188 (11)
Less than 90% 1 3 (1) 63 56 (8) 64 59 (9)
Total 713 $ 4,954 $ (69) 334 $ 5,095 $ (115) 1,047 $ 10,049 $ (184)
Substantially all of the gross unrealized losses on the
securities are attributable to changes in interest rates.
Credit spreads and specific credit events associated with
individual issuers can also cause unrealized losses
although these impacts are not significant as of
December 31, 2005.
The securities which have fair value to cost ratio of less
than 90−95 percent are comprised primarily of Federal
National Mortgage Association and Federal Home
Loan Mortgage Corporation issued mortgage-backed
securities, as well as foreign government and specific
corporate issued bonds. The Company expects that all
contractual principal and interest will be received on
these securities.
The unrealized losses in the other categories are not
concentrated in any individual industries or with any
individual securities. The Company monitors the
investments and metrics discussed above on a quarterly
basis to identify and evaluate investments that have indi-
cations of possible other-than-temporary impairment.
The Company has the ability and intent to hold these
securities for a time sufficient to recover a significant
amount of their amortized cost.
The change in net unrealized securities gains (losses) in
other comprehensive income includes the following
components: (i) unrealized gains (losses) that arose from
changes in market value of securities that were held dur-
ing the period (holding gains (losses)) and (ii) gains
(losses) that were previously unrealized, but have been
recognized in current period net income due to sales and
other-than-temporary impairments of Available-for-Sale
securities (reclassification for realized (gains) losses).
Notes to Consolidated
Financial Statements
AXP / AR.2005
[ 75 ]](https://image.slidesharecdn.com/1041986/85/american-express-Annual-Reports-2005-77-320.jpg)
![The following table presents these components of other
comprehensive (loss) income net of tax for the years
ended December 31:
(Millions, net of tax) 2005 2004 2003
Holding losses $ (187) $ (83) $ (157)
Reclassification for
realized gains (11) (35) (31)
Other (losses) gains (18) (53) 15
Net unrealized securities
losses in other
comprehensive
(losses) income $ (216) $(171) $ (173)
As of December 31, 2004, net unrealized securities
gains, net of tax, reflected in accumulated other compre-
hensive income were $760 million, including $407 mil-
lion associated with discontinued operations. For 2005
activity, excluded from the table above is $391 million
of net change in accumulated other comprehensive
income related to discontinued operations. As of
December 31, 2005, net unrealized securities gains, net
of tax, reflected in accumulated other comprehensive
income were $137 million.
The following is a distribution of investments
classified as Available-for-Sale by maturity as of
December 31, 2005:
(Millions) Cost
Fair
Value
Due within 1 year $ 4,764 $ 4,744
Due after 1 year through 5 years 4,382 4,380
Due after 5 years through
10 years 1,392 1,454
Due after 10 years 6,350 6,588
16,888 17,166
Mortgage and other asset-
backed securities 3,900 3,838
Equity securities 26 29
Retained interests in lending
securitizations 70 70
Total $ 20,884 $ 21,103
The expected payments on mortgage and other asset-
backed securities and retained interests in lending
securitizations may not coincide with their contractual
maturities. As such, these securities, as well as equity
securities, are not included in the maturities distribution.
The table below includes purchases, sales and maturities
of investments classified as Available-for-Sale for the
years ended December 31:
(Billions) 2005 2004
Purchases $ 12 $ 11
Sales $ 4 $ 5
Maturities $ 8 $ 3
Included in net investment income are gross realized
gains and losses on sales of securities, as well as other-
than-temporary losses on investments classified as
Available-for-Sale, as noted in the following table for the
years ended December 31:
(Millions) 2005 2004 2003
Gross investment gains from
sales and prepayments:
U.S. Card Services $ 13 $ 15 $ 26
International Card &
Global Commercial
Services 8 6 27
Corporate & Other — 2 —
Total $ 21 $ 23 $ 53
Gross investment losses from
sales and prepayments:
U.S. Card Services $ (3) $ — $ (1)
International Card &
Global Commercial
Services (1) (1) (4)
Corporate & Other — — (1)
Total $ (4) $ (1) $ (6)
Other-than-temporary
impairments:
U.S. Card Services $ — $ (7) $ —
International Card &
Global Commercial
Services — (1) (11)
Corporate & Other — (2) —
Total $ — $ (10) $ (11)
Trading Investments
Trading investments are comprised principally of cer-
tain foreign government bonds and seed money invest-
ments in mutual funds for which the Company’s equity
ownership is less than 20 percent. There were $16 mil-
lion, $13 million and $9 million of net gains for 2005,
2004 and 2003, respectively, related to trading invest-
ments held at each balance sheet date.
Notes to Consolidated
Financial Statements
AXP / AR.2005
[ 76 ]](https://image.slidesharecdn.com/1041986/85/american-express-Annual-Reports-2005-78-320.jpg)
![NOTE 4 Loans
Loans at December 31 consisted of:
(Millions) 2005 2004
Cardmember lending $ 33,104 $ 26,905
International banking:
Consumer and private banking 4,822 4,825
Banks and other institutions 2,268 1,984
Corporate 23 76
Total international banking 7,113 6,885
Other 1,681 1,550
Total loans — gross 41,898 35,340
Less: Loan loss reserves 1,097 1,084
Total $ 40,801 $ 34,256
The following table presents changes in loan loss reserves:
(Millions) 2005 2004
Balance, January 1 $ 1,084 $ 1,121
Provision(a)
1,381 1,188
Write-offs(b)
(1,516) (1,319)
Recoveries and other(c)
148 94
Balance, December 31 $ 1,097 $ 1,084
(a)Provision for the years ended December 31, 2005 and 2004 includes
$1,349 million and $1,130 million, respectively, related to cardmember
lending and $32 million and $58 million, respectively, related to
international banking and other.
(b)Write-offs for the years ended December 31, 2005 and 2004 include
$1,449 million and $1,205 million, respectively, related to cardmember
lending and $67 million and $114 million, respectively, related to
international banking and other.
(c)Recoveries and other for the years ended December 31, 2005 and 2004
include $124 million and $49 million, respectively, related to cardmem-
ber lending and $24 million and $45 million, respectively, related to
international banking and other.
NOTE 5 Securitized Loans
The Company periodically securitizes cardmember
loans through the American Express Credit Account
Master Trust (the Lending Trust), which in turn issues
securities collateralized by the transferred cardmember
loans to third-party investors. Such securities represent
undivided interests in the transferred cardmember
loans. The Company, through its subsidiaries, is
required to maintain an undivided interest in the trans-
ferred cardmember loans, which is referred to as seller’s
interest, and is generally equal to the balance of the loans
in the Lending Trust less the investors’ portion of those
assets. Seller’s interest is reported as loans on the Com-
pany’s Consolidated Balance Sheets. Any billed finance
charges related to the transferred cardmember loans are
reported as other receivables on the Company’s Consoli-
dated Balance Sheets. The Company retains servicing
responsibilities for the transferred cardmember loans,
through its subsidiary, American Express Travel Related
Services Company, Inc. (TRS), and earns a related fee.
Pursuant to SFAS No. 140, no servicing asset or liability
is recognized at the time of a securitization, as
management believes that the Company receives
adequate compensation relative to current market ser-
vicing fees. As of December 31, 2005 and 2004, the
Lending Trust held total assets of $28.9 billion and
$24.7 billion, respectively, of which $21.2 billion and
$20.3 billion had been sold.
The Company also retains subordinated interests in the
securitized cardmember loans. Such subordinated
retained interests include one or more investments in
tranches of the securitization and an interest-only strip.
The investments in the tranches of the securitization are
accounted for at fair value as Available-for-Sale invest-
ment securities in accordance with SFAS No. 115 and
are reported in investments on the Company’s Consoli-
dated Balance Sheets. As of December 31, 2005 and
2004, the ending fair value of these subordinated
retained interests was $70 million and $108 million,
respectively. The interest-only strip is also accounted for
at fair value consistent with a SFAS No. 115 Available-
for-Sale investment and is reported in other assets. The
fair value of the interest-only strip is the present value
of estimated future excess spread expected to be gener-
ated by the securitized loans over the estimated life of
those loans. Excess spread, which is the net positive cash
flow from interest and fee collections allocated to the
investors’ interests after deducting the interest paid on
investor certificates, credit losses, contractual servicing
fees and other expenses, is recognized in securitization
income as it is earned. As of December 31, 2005 and
2004, the fair value of the interest-only strip was $209
million and $207 million, respectively.
At the time of a cardmember loan securitization, the
Company typically records a gain on sale, which is cal-
culated as the difference between the proceeds from the
sale and the book basis of the cardmember loans sold.
That book basis on sold cardmember loans is deter-
mined by allocating the carrying amount of the card-
member loans, net of applicable credit reserves, between
the cardmember loans sold and the interests retained
based on their relative fair values. Such fair values are
based on market prices at date of transfer for the sold
cardmember loans and on the estimated present value
of future cash flows for retained interests. Gains on sale
from securitizations are reported in securitization
income on the Company’s Consolidated Statements of
Income, except for the component resulting from the
release of credit reserves upon sale, which is reported as
a reduction of provision for losses from cardmember
Notes to Consolidated
Financial Statements
AXP / AR.2005
[ 77 ]](https://image.slidesharecdn.com/1041986/85/american-express-Annual-Reports-2005-79-320.jpg)
![lending. Securitization transaction costs are offset
against the gains on sales at the time of the transaction.
During 2005, 2004 and 2003, the Company sold
$5.4 billion, $3.9 billion and $3.5 billion, respectively,
of cardmember loans, or $5.4 billion, $3.9 billion and
$3.1 billion, respectively, net of the Company’s invest-
ments in subordinated retained interests. Additionally,
during 2005, 2004 and 2003, $4.5 billion, $3.0 billion
and $1.0 billion, respectively, of securities issued to
investors from the Lending Trust matured. The pretax
net gains on sale from securitizations, including the sale
of subordinated retained interests, net of the impact of
maturities, the effect of changes in interest-only strip
valuation factors and a reconciliation adjustment charge
were $21 million, $26 million and $124 million, respec-
tively, for 2005, 2004 and 2003.
Management utilizes certain estimates and assumptions
to determine the fair value of the subordinated retained
interests, including the interest-only strip. These esti-
mates and assumptions are generally based on projec-
tions of finance charges and fees paid related to the secu-
ritized assets, net credit losses, average loan life, the
contractual fee to service the transferred assets and a dis-
count rate commensurate with the retained interest.
Changes in the estimates and assumptions used may
have a significant impact in the Company’s fair valua-
tion. The key economic assumptions used in measuring
the subordinated retained interests at the time of issu-
ance and during 2005 and 2004 were as follows (rates
are per annum):
2005 2004
Weighted average loan
life (months) 4 4
Expected credit losses 3.30%–3.90% 3.98%–4.67%
Subordinated certificates
discounted at 2.6%–4.8% 1.2%–3.5%
Residual cash flows
discounted at 12.0% 8.3%–12.0%
Returns to investors
Variable
Fixed
Contractual
spread
over LIBOR
ranging from
.00% to .90%
1.7%–5.8%
Contractual
spread
over LIBOR
ranging from
.04% to .90%
1.7%–7.4%
The following table presents quantitative information
about delinquencies, net credit losses and components
of securitized cardmember loans on a trust basis at
December 31:
(Billions)
Total
Principal
Amount
of Loans
Principal
Amount of
Loans 30
Days or
More Past
Due
Net
Credit
Losses
During
the Year
2005
Cardmember loans managed $ 54.3 $ 1.3 $ 2.1
Less: Securitized
cardmember loans sold 21.2 0.6 1.0
Cardmember loans on
balance sheet $ 33.1 $ 0.7 $ 1.1
2004
Cardmember loans managed $ 47.2 $ 1.2 $ 2.0
Less: Securitized
cardmember loans sold 20.3 0.6 1.0
Cardmember loans on
balance sheet $ 26.9 $ 0.6 $ 1.0
The key economic assumptions and the sensitivity of the
current year’s fair value of the interest-only strip to
immediate 10 percent and 20 percent adverse changes
in assumed economics are as follows:
(Millions, except rates per annum)
Monthly
Payment
Rate
Expected
Credit
Losses
Cash Flows from
Interest-only
Strips
Discounted at
Assumption 26.2% 3.5% 12.0%
Impact on fair value of
10% adverse change $ 13 $ 17 $ 0.4
Impact on fair value of
20% adverse change $ 26 $ 34 $ 0.8
These sensitivities are hypothetical and will be different
from what actually occurs in the future. Any change in
fair value based on a 10 percent variation in assumptions
cannot be extrapolated in part because the relationship
of the change in an assumption on the fair value of the
retained interest is calculated independent from any
change in another assumption; in reality, changes in one
factor may result in changes in another, which magnify
or offset the sensitivities.
Notes to Consolidated
Financial Statements
AXP / AR.2005
[ 78 ]](https://image.slidesharecdn.com/1041986/85/american-express-Annual-Reports-2005-80-320.jpg)
![The table below summarizes cash flows received from
all securitization trusts for 2005 and 2004:
(Millions) 2005 2004
Proceeds from new securitizations
during the period $ 5,386 $ 3,888
Proceeds from collections
reinvested in revolving
cardmember securitizations $ 63,011 $ 54,933
Servicing fees received $ 412 $ 388
Other cash flows received
on retained interests from
interest-only strips $ 2,194 $ 1,845
During the fourth quarter of 2004, the Company sold
the equipment leasing product line in its small business
financing unit. Prior to the sale, the Company securi-
tized certain of the equipment lease receivables within
that product line.
NOTE 6 Variable Interest Entities
During the third quarter of 2005, the Company and
Ameriprise executed a reinsurance agreement for the
Company to retain the risks and rewards of the travel
and other card insurance businesses of AMEX Assurance
Company (AAC), a subsidiary of Ameriprise. The Com-
pany also entered into a share purchase agreement with
Ameriprise under which all of the ownership interests
in and the rights and obligations of AAC will transfer to
the Company within a period not to exceed two years
from the spin-off date in consideration of a fixed pur-
chase price equal to AAC’s net book value as of
September 30, 2005, which was $115 million. As a
result of these agreements and in accordance with FIN
46(R), the Company consolidates AAC as a variable
interest entity for which the Company is considered the
primary beneficiary. The Company recorded a $115 mil-
lion liability related to the purchase of AAC, which is
included in other liabilities on the Consolidated Balance
Sheet as of December 31, 2005.
The following table presents the consolidated assets,
which are restricted from use by the Company, and other
balances related to AAC at December 31:
(Millions) 2005
Assets:
Investments $ 83
Other assets 85
Total assets $ 168
Total liabilities $ 51
Net assets $ 117
The Company’s securitizations of cardmember receiv-
ables are accounted for as secured borrowings, rather
than as qualifying sales, in accordance with SFAS
No. 140, because the receivables are transferred to non-
qualifying special purpose entities. These entities are the
American Express Issuance Trust (the Charge Trust), for
periods beginning in 2005, and American Express Master
Trust (AEMT), for periods prior to July 2005, when the
AEMT was dissolved. The cardmember receivables secu-
ritized through these entities are not accounted for as sold
and the securities issued to third-party investors are
reported as long-term debt on the Company’s
Consolidated Balance Sheets. In September 2005, the
Company securitized $1.2 billion of floating-rate asset-
backed notes through the Charge Trust. During 2005 and
2004, $1.9 billion and $1.1 billion of interests issued by
AEMT matured. As of December 31, 2005 and 2004, the
Charge Trust and AEMT held total assets of $9.9 billion
and $7.4 billion, respectively, and total liabilities of $1.2
billion and $1.9 billion, respectively. The Charge Trust is
consolidated by American Express Receivables Financing
Corporation V LLC, a variable interest entity, which is in
turn consolidated by the Company.
The Company has other variable interests for which it
is not considered the primary beneficiary and, therefore,
does not consolidate. These interests are represented by
a carrying value of $134 million and $136 million of
affordable housing partnerships within continuing
operations at December 31, 2005 and 2004, respec-
tively. The Company is a limited partner in affordable
housing partnerships in which the Company has a less
than 50 percent interest and receives the benefits and
accepts the risks consistent with other limited partners.
In the limited cases in which the Company has a greater
than 50 percent interest in affordable housing partner-
ships, it was determined that the relationship with the
general partner is an agent relationship and the general
partner was most closely related to the partnership as it
is the key decision maker and controls the operations.
The Company’s maximum exposure to loss as a result of
its investment in these partnerships is represented by
the carrying value.
Notes to Consolidated
Financial Statements
AXP / AR.2005
[ 79 ]](https://image.slidesharecdn.com/1041986/85/american-express-Annual-Reports-2005-81-320.jpg)
![NOTE 7 Goodwill and Other Intangible Assets
The changes in the carrying amount of goodwill reported in the Company’s operating segments were as follows:
(Millions) U.S. Card Services
International Card &
Global Commercial
Services
Global Network &
Merchant Services Total
Balance at January 1, 2004 $ 205 $ 1,198 $ 104 $ 1,507
Acquisitions — 11 — 11
Dispositions(a)
(22) (4) — (26)
Other, including foreign currency translation — 17 — 17
Balance at December 31, 2004 183 1,222 104 1,509
Other, including foreign currency translation — (20) — (20)
Balance at December 31, 2005 $ 183 $ 1,202 $ 104 $ 1,489
(a)Primarily relates to the sale of the equipment leasing product line of American Express Business Finance Corporation.
Definite-lived intangible assets, which primarily consist
of customer relationships and contracts, had a gross car-
rying amount and accumulated amortization of $271
million and $159 million, respectively, as of
December 31, 2005 and $296 million and $169 million,
respectively, as of December 31, 2004.
The aggregate amortization expense for these intangible
assets during 2005, 2004 and 2003 was $49 million,
$46 million and $45 million, respectively. These assets
have a weighted average remaining useful life of four
years. Estimated amortization expense associated with
intangible assets for the five years ending December 31,
2010 is as follows (millions): 2006, $37; 2007, $15;
2008, $12; 2009, $7; and 2010, $5. During 2005, the
Company acquired $43 million of intangible assets,
which are being amortized, on average, over four years.
In addition, the Company recorded dispositions
and other foreign currency translation adjustments of
$9 million.
NOTE 8 Short- and Long-Term Debt and Borrowing Agreements
Short-Term Debt
The Company’s short-term debt outstanding, defined as debt with original maturities of less than one year, primarily
consists of commercial paper, borrowed funds and bank notes payable. Short-term debt at December 31 was as follows:
(Millions, except percentages) 2005 2004
Outstanding
Balance
Notional
Amount
of Swaps
Year-End
Stated
Rate on
Debt(a)
Year-End
Effective
Interest
Rate with
Swaps(a)
Maturity
of Swaps
Outstanding
Balance
Notional
Amount
of Swaps
Year-End
Stated
Rate on
Debt(a)
Year-End
Effective
Interest
Rate with
Swaps(a)
Maturity
of Swaps
Commercial paper $ 7,742 $ — 4.19% — — $ 7,604 $ 363 2.17% 2.16% 2005
Borrowed funds 3,257 133 4.72% 4.73% 2006–2010 3,043 — 2.39% — —
Bank notes payable 3,748 — 4.51% — — 3,059 2,800 2.59% 3.49% 2005
Other 886 — 2.86% — — 610 — 0.68% — —
Total $ 15,633 $ 133 4.30% $ 14,316 $ 3,163 2.24%
(a)For floating rate debt issuances, the stated and effective interest rates were based on the respective rates at December 31, 2005 and 2004. These rates
are not indicative of future interest rates.
As of December 31, 2005, there were no derivative
financial instruments outstanding designated as hedges
of the existing commercial paper and bank notes out-
standing. The Company has designated the interest rate
risk associated with cash flows of future commercial
paper as well as bank note issuances as part of its on
going hedging program. The notional amount as
of December 31, 2005, of such designated derivative
financial instruments was $4.5 billion, reflecting the
hedge of future cash flows of anticipated issuances in
2006 through 2008. See Note 10 for additional discus-
sion of the Company’s cash flow hedging strategies.
Unused lines of credit to support commercial paper
borrowings were approximately $9.3 billion and $9.1
billion at December 31, 2005 and 2004, respectively.
Notes to Consolidated
Financial Statements
AXP / AR.2005
[ 80 ]](https://image.slidesharecdn.com/1041986/85/american-express-Annual-Reports-2005-82-320.jpg)
![Long-Term Debt
The Company’s long-term debt outstanding, defined
as debt with original maturities of one year or greater,
primarily consists of senior notes and medium-term
notes. Debt issuance costs are deferred and amortized
over the term of the related instrument or, if the holder
has a put option, over the put term. Long-term debt at
December 31, was as follows:
(Millions, except percentages) 2005 2004
Outstanding
Balance
Notional
Amount
of Swaps
Year-End
Stated
Rate on
Debt(b)
Year-End
Effective
Interest
Rate with
Swaps(b)
Maturity
of Swaps
Outstanding
Balance
Notional
Amount
of Swaps
Year-End
Stated
Rate on
Debt(b)
Year-End
Effective
Interest
Rate with
Swaps(b)
Maturity
of Swaps
American Express Company
(Parent Company only)
Convertible Debentures
due September 1, 2033 $ 2,000 $ — 1.85% — — $ 2,000 $ — 1.85% — —
Fixed Rate Senior Notes
due 2005–2013 3,242 — 4.79% — — 3,740 — 5.07% — —
American Express Travel
Related Services
Company Inc(e)
Fixed Rate Senior Notes
due 2009 500 — 3.63% — — 500 — 3.63% — —
American Express Credit
Corporation
Fixed and Floating Rate Senior
and Medium-Term Notes due
2005–2015(a)
13,600 6,350 4.48% 2.99% 2006–2015 14,931 8,350 3.09% 2.85% 2005–2006
Borrowings under Bank Credit
Facilities due 2009 3,329 3,028 5.25% 5.12% 2006–2010 3,683 1,537 4.54% 4.62% 2005–2010
American Express
Centurion Bank
Fixed and Floating Rate Senior
and Medium-Term Notes due
2005–2009 4,342 1,000 4.44% 4.31% 2006–2009 4,058 1,200 2.14% 2.31% 2005–2009
American Express Bank, FSB
Floating Rate Medium-Term
Notes due 2005–2007 2,350 1,000 4.39% 4.18% 2006–2007 1,600 — 1.59% — —
American Express Receivables
Financing Corporation LLC
& American Express
Receivables Financing
Corporation V LLC
Floating Rate Senior Notes
due 2005–2012(d)
1,116 — 4.42% — — 1,750 — 1.60% — —
Floating Rate Subordinated
Notes due 2005–2012(d)
84 — 4.70% — — 142 — 1.98% — —
Other
Fixed Rate and Floating Rate
Notes due 2005–2014(c)
218 105 5.77% 6.38% 2006–2007 272 106 6.03% 5.97% 2006–2007
Total $ 30,781 $ 11,483 4.41% $ 32,676 $ 11,193 3.16%
(a)These balances include $2 billion and $1 billion notes which are subject to extension by the holders through March 5, 2008 and June 20, 2008, respectively.
(b)For floating rate debt issuances, the stated and effective interest rates were based on the respective rate at December 31, 2005 and 2004. These rates
are not indicative of future interest rates.
(c)These balances include $93 million related to two sale-leaseback transactions as described in Note 11.
(d)$1.2 billion of senior and subordinated notes were issued by American Express Receivables Financing Corporation V LLC during 2005. $1.9 billion of
senior and subordinated notes primarily issued by American Express Receivables Financing Corporation LLC (RFC) matured during 2005. Portions of
RFC floating rate senior and subordinated notes were included in the American Express Centurion Bank and the American Express Bank, FSB captions
in prior periods.
(e)American Express Travel Related Services Company Inc. fixed rate senior notes were issued by the Travel Related Services Parent Company. Notes to Consolidated
Financial Statements
AXP / AR.2005
[ 81 ]](https://image.slidesharecdn.com/1041986/85/american-express-Annual-Reports-2005-83-320.jpg)
![As of December 31, 2005, in addition to the hedges of
existing long-term debt, the Company has designated
the interest rate risk associated with cash flows related
to future long-term debt issuances as part of its hedging
program. The notional amount of such designated
derivative financial instruments was $10.7 billion,
reflecting the hedge of future cash flows of anticipated
issuances in 2006 through 2008. See Note 10 for
additional discussion of the Company’s cash flow hedg-
ing strategies.
As of December 31, 2005, the Company had $2 billion
principal outstanding of 1.85 percent Convertible
Senior Debentures due 2033 (the Debentures), which
are unsecured and unsubordinated obligations of the
Company. The Debentures may be put to the Company
at accreted principal amount on December 1, 2006,
2008, 2013, 2018, 2023 or 2028 if the Company’s com-
mon stock is trading (during a specified averaging
period) at or above the base conversion price but below
the contingent conversion threshold. See Note 18 for
additional information regarding conversion terms
of Debentures.
Aggregate annual maturities on long-term debt obligations (based on final maturity dates) at December 31, 2005,
are as follows:
(Millions) 2006 2007 2008 2009 2010 Thereafter Total
American Express Company (Parent Company only) $ 1,000 $ 748 $ — $ 499 $ — $ 2,995 $ 5,242
American Express Travel Related Services
Company, Inc. — — — 500 — — 500
American Express Credit Corporation 2,300 6,300 999 4,900 2,028 402 16,929
American Express Centurion Bank 492 2,500 — 1,350 — — 4,342
American Express Receivables Financing
Corporation V LLC — — — — 600 600 1,200
American Express Bank, FSB 1,550 800 — — — — 2,350
Other 42 83 — — — 93 218
Total $ 5,384 $ 10,431 $ 999 $ 7,249 $ 2,628 $ 4,090 $ 30,781
As of December 31, 2005 and 2004, the Company maintained total bank lines of credit of $13.4 billion and
$13.0 billion, respectively, of which $10.1 billion and $9.7 billion were unutilized as of December 31, 2005 and
2004, respectively.
The Company paid total interest (including amounts related to discontinued operations) primarily related to short-
and long-term debt, corresponding interest rate products and customer deposits (net of amounts capitalized or
refunded) of $2.4 billion, $1.6 billion and $1.7 billion in 2005, 2004 and 2003, respectively.
NOTE 9 Common and Preferred Shares
The Company has in place a share repurchase program
to return equity capital in excess of its business needs
to shareholders. These share repurchases both offset the
issuance of new shares as part of employee compensa-
tion plans and reduce the number of shares outstanding.
Since the inception of repurchase programs in
September 1994, the Company has repurchased
530 million shares pursuant to total authorizations to
repurchase up to 570 million shares, including pur-
chases under past agreements with third parties. At
December 31, 2005, the Company has 40 million shares
remaining under such authorization. Such authoriza-
tion does not have an expiration date, and at present,
there is no intention to modify or otherwise rescind
such authorization.
Of the common shares authorized but unissued at
December 31, 2005, approximately 260 million shares
were reserved for issuance for employee stock, employee
benefit and dividend reinvestment plans, as well as con-
vertible securities.
The following table provides a reconciliation of common
shares outstanding:
Notes to Consolidated
Financial Statements
AXP / AR.2005
[ 82 ]](https://image.slidesharecdn.com/1041986/85/american-express-Annual-Reports-2005-84-320.jpg)
![(Millions) 2005 2004 2003
Shares outstanding at
beginning of year 1,249 1,284 1,305
Repurchases of common
shares(a)
(34) (69) (36)
Other, primarily employee
benefit plans 26 34 15
Shares outstanding at end
of year 1,241 1,249 1,284
(a)Includes purchases under share repurchase agreements that were entered
into to partially offset the Company’s exposure to the effect on diluted
earnings per share of outstanding in-the-money stock options issued
under the Company’s stock option program.
The Board of Directors is authorized to permit the
Company to issue up to 20 million preferred shares
without further shareholder approval.
NOTE 10 Derivatives and Hedging Activities
Derivative financial instruments enable the Company to
manage exposure to credit and various market risks. The
value of such instruments is derived from an underlying
variable or multiple variables, including commodity,
equity, foreign exchange and interest rate indices or
prices. The Company enters into various derivative finan-
cial instruments as part of its ongoing risk management
activities as well as for customer and limited trading pur-
poses. Credit risk associated with the Company’s deriva-
tives is limited to the risk that a derivative counterparty
will not perform in accordance with the terms of the con-
tract. To mitigate such risk, counterparties are required
to be pre-approved. Additionally, the Company may,
from time to time, enter into master netting agreements
where practical. As of December 31, 2005 and 2004, the
total fair value, excluding accruals, of derivative product
assets was $530 million and $722 million, respectively,
and derivative product liabilities was $354 million and
$1.1 billion, respectively. The following summarizes the
Company’s use of derivative financial instruments.
Cash Flow Hedges
The Company uses interest rate products, primarily
interest rate swaps, to manage interest rate risk related
to the Company’s charge card business. The interest rate
swaps are used primarily to achieve a targeted mix of
fixed and floating rate funding as well as to protect the
Company from the interest rate risk through hedging of
its existing long-term debt, the rollover of short-term
debt and the anticipated forecasted issuance of addi-
tional funding. See Note 8 for additional discussion of
the cash flow hedging strategies related to short- and
long-term debt. During 2005, the Company discontin-
ued its only foreign currency risk cash flow hedge
program, which related to the forecasted purchase
of investment securities by foreign subsidiaries. The
anticipated transactions were no longer probable of
occurring in accordance with the original strategy.
During 2005, 2004 and 2003, the Company recognized
the following impacts in other comprehensive (loss)
income related to its cash flow hedging activity.
(Millions) 2005 2004 2003
Unrealized gains (losses)
net of tax of $161, $3
and $(174), respectively $ 300 $ 6 $(323)
Reclassification for realized
(gains) losses, net of
tax of $(23), $161 and
$224, respectively (44) 298 415
Net unrealized derivative gains $ 256 $ 304 $ 92
As of December 31, 2004, net unrealized derivatives
losses, net of tax, reflected in accumulated other com-
prehensive income were $142 million, including
$29 million of gains associated with discontinued
operations. For 2005 activity, excluded from the table
above is $19 million of net change in accumulated other
comprehensive income related to discontinued opera-
tions. As of December 31, 2005, net unrealized deriva-
tives gains, net of tax, reflected in accumulated other
comprehensive income were $143 million.
At December 31, 2005, the Company expects to
reclassify $184 million of net pretax gains on deri-
vative instruments from accumulated other comprehen-
sive (loss) income to earnings during the next twelve
months. In the event that cash flow hedge accounting
is no longer applied (i.e., the Company de-designates a
derivative as hedge, a hedge is no longer considered to
be highly effective, or the forecasted transaction being
hedged is no longer probable of occurring), the reclas-
sification from accumulated other comprehensive (loss)
income into earnings may be accelerated and all future
market value fluctuations of the derivative will be
reflected in earnings.
During 2005 and 2004, the Company recognized the
following impacts in other revenue related to these
activities. The Company recognized no impact in 2003.
(Millions) 2005 2004
Cash flow hedge ineffective
net gains $ 3 $ 1
Cash flow hedge (losses) gains
on forecasted transactions
no longer probable to occur $ (2) $ 16
Notes to Consolidated
Financial Statements
AXP / AR.2005
[ 83 ]](https://image.slidesharecdn.com/1041986/85/american-express-Annual-Reports-2005-85-320.jpg)
![Currently, the longest period of time over which
the Company is hedging exposure to the variability
in future cash flows is approximately 5 years, which
is related to long-term debt. For 2005, 2004 and 2003,
there were no gains or losses on derivative transactions
or portions thereof that were excluded from the
assessment of hedge effectiveness. The total fair value,
excluding accruals, of derivative product assets and
liabilities designated as cash flow hedges was $226 mil-
lion and $5 million, respectively, as of December 31,
2005 and $90 million and $266 million, respectively,
as of December 31, 2004.
Fair Value Hedges
The Company is exposed to interest rate risk associated
with its fixed rate long-term debt and the Company uses
interest rate swaps to convert certain fixed rate debt to
floating rate at the time of issuance. In conjunction with
its international banking activities, the Company hedges
the fair value changes related to a portion of its callable
term customer deposits. Such transactions are hedged
using callable interest rate swaps. The Company is also
subject to interest rate risk related to its fixed rate
corporate debt securities and, from time to time, the
Company enters into interest rate swaps to hedge this
exposure. For 2005, 2004 and 2003, there were no
gains or losses on derivative transactions or portions
thereof that were excluded from the assessment of hedge
effectiveness. Hedge ineffectiveness for 2005, 2004 and
2003 was immaterial. The total fair value, excluding
accruals, of derivative product assets and liabilities
designated as fair value hedges was $4 million and
$97 million, respectively, as of December 31, 2005 and
$12 million and $88 million, respectively, as of
December 31, 2004.
Hedges of Net Investment in Foreign Operations
The Company designates foreign currency derivatives,
primarily forward agreements, as hedges of net invest-
ments in certain foreign operations. For 2005, the net
amount of total losses related to the hedges included in
foreign currency translation adjustments was $8 mil-
lion, net of tax. The total fair value of these derivative
product assets and liabilities was $20 million and $13
million as of December 31, 2005 and $13 million and
$120 million as of December 31, 2004.
Derivatives Not Designated as Hedges
The Company has economic hedges that either
do not qualify or are not designated for hedge account-
ing treatment.
Foreign currency transactions and non-U.S. dollar
cash flow exposures are economically hedged, where
practical, through foreign currency contracts, primarily
forward contracts, foreign currency options and cross-
currency swaps. Foreign currency contracts involve
the purchase and sale of a designated currency at an
agreed upon rate for settlement on a specified date. Such
foreign currency forward contracts entered into by the
Company generally mature within one year. The total
fair value, excluding accruals, of these derivative prod-
uct assets and liabilities were both $13 million as of
December 31, 2005 and $44 million and $78 million,
respectively, as of December 31, 2004.
From time to time, the Company will also enter into
interest rate swaps to specifically manage funding costs
related to its credit card business. As of December 31,
2005, the fair value was not significant. As of
December 31, 2004, the total fair value of derivative
product assets and liabilities was $14 million and
$10 million, respectively.
Within its international banking operations, the Com-
pany enters into derivative contracts to meet the
needs of its clients and, to a limited extent, for trading
purposes, including taking proprietary positions.
The international banking derivative activities also
include economic hedging of various foreign currency
and interest rate exposures related to its other banking
activities. The total fair value, excluding accruals,
of these derivative product assets and liabilities was
$267 million and $226 million, respectively, as of
December 31, 2005 and $549 million and $498 million,
respectively, as of December 31, 2004. These amounts
include the identified embedded derivatives dis-
cussed below.
Embedded Derivatives
The Company has identified certain derivatives embed-
ded in other financial instruments that are required to
be accounted for separately from the host financial
instrument. Such items included certain structured cus-
tomer deposit products issued by the international
banking operations which have returns tied to the per-
formance of equity markets or other indexes and finan-
cial instruments. As of December 31, 2005 and 2004,
the total fair value of such derivative product liabilities
was $25 million and $1 million, respectively.
Notes to Consolidated
Financial Statements
AXP / AR.2005
[ 84 ]](https://image.slidesharecdn.com/1041986/85/american-express-Annual-Reports-2005-86-320.jpg)
![NOTE 11 Guarantees and Certain
Off-Balance Sheet Items
The Company provides cardmember protection plans
that cover losses associated with purchased products, as
well as certain other guarantees in the ordinary course
of business that are within the scope of FASB Interpre-
tation No. 45, “Guarantor’s Accounting and Disclosure
Requirement for Guarantees, Including Indirect Guaran-
tees of Indebtedness of Others” (FIN 45).
The following table provides information related to
guarantees that are within the scope of FIN 45 as of
December 31:
2005 2004
Type of Guarantee
Maximum amount
of undiscounted
future payments(a)
(Billions)
Amount of related
liability at
December 31, 2005
(Millions)
Maximum amount of
undiscounted future
payments(a)
(Billions)
Amount of related
liability at
December 31, 2004
(Millions)
Credit Card Registry(b)
$ 22 $ — $ 24 $ —
Merchandise and Account Protection(c)
53 48 51 45
Merchant Protection(d)
10 43 7 46
Baggage Protection 10 17 8 19
Other(e)
2 98 1 151
Total $ 97 $ 206 $ 91 $ 261
(a)Calculated based on the hypothetical scenario that all claims occur within the next 12 months.
(b)This benefit will cancel and request replacements of any lost or stolen cards, and provides for fraud liability coverage and passport replacement, among other benefits.
(c)These benefits (i) protect eligible purchases made with the card against accidental damage or theft for up to 90 days from the date of purchase; (ii) ensure
that a cardmember pays the lowest price available on covered items purchased entirely with an eligible American Express card; and (iii) provide account
protection in the event that a cardmember is unable to make payments on the account due to unforeseen hardship.
(d)Represents the Company’s contingent liability arising from billing disputes between the cardmembers and the merchant, primarily for non-delivery of
goods and services.
(e)Other primarily relates to contingent consideration obligations as well as guarantees the Company provides through its international banking business
that are within the scope of FIN 45, including financial letters of credit, performance guarantees and financial guarantees. Generally these guarantees
range in term from three months to one year. The Company receives a fee related to these guarantees, many of which help facilitate cross-border transactions.
The maximum potential exposure for the Company’s international banking guarantees at both December 31, 2005 and 2004 was approximately $1 billion.
The Company held collateral of $936 million and $788 million related to such guarantees at December 31, 2005 and 2004, respectively.
The above table reflects only those guarantees that are
within the scope of FIN 45. Expenses relating to actual
claims under these guarantees for 2005 and 2004 were
approximately $15 million and $20 million, respectively.
In addition, the Company had the following other
commitments as of December 31:
(Millions) 2005 2004
Loan commitments and other
lines of credit $ 493 $ 567
Bank letters of credit and other
bank guarantees outside the
scope of FIN 45 $ 529 $ 646
The Company issues commercial and other letters of
credit to facilitate the short-term trade-related needs of
its banking clients, which typically mature within six
months. At December 31, 2005 and 2004, the Company
held $337 million and $281 million, respectively, of col-
lateral supporting commercial and other letters and
lines of credit.
The Company also has commitments aggregating
$213 billion and $176 billion related to its card business
in 2005 and 2004, respectively, primarily related to
commitments to extend credit to certain cardmembers
as part of established lending product agreements. Many
of these are not expected to be drawn; therefore, total
unused credit available to cardmembers does not rep-
resent future cash requirements. The Company’s charge
card products have no preset spending limit and are not
reflected in unused credit available to cardmembers.
In addition, the Company has certain contingent
obligations for worldwide business arrangements that
relate to contractual agreements with partners, primarily
with co-brand partners. The contingent obligations
under such arrangements were $3.3 billion as of
December 31, 2005.
Notes to Consolidated
Financial Statements
AXP / AR.2005
[ 85 ]](https://image.slidesharecdn.com/1041986/85/american-express-Annual-Reports-2005-87-320.jpg)
![The Company leases certain office facilities and operat-
ing equipment under noncancelable and cancelable
agreements. Total rental expense amounted to $367 mil-
lion, $316 million and $304 million in 2005, 2004 and
2003, respectively. At December 31, 2005, the mini-
mum aggregate rental commitment under all
noncancelable operating leases (net of subleases of
$30 million) was:
(Millions)
2006 $ 229
2007 208
2008 177
2009 146
2010 126
Thereafter 1,286
Total $ 2,172
During 2005, the Company completed sale-leaseback
transactions on four of its owned properties which were
sold at fair value. These transactions have been
accounted for as sale-leasebacks and are included in
total operating lease obligations. Proceeds from these
four transactions totaled $172 million and the aggregate
net book value of these properties removed from the
Company’s Consolidated Balance Sheet was $124 mil-
lion. The pretax gain of approximately $46 million, net
of $2 million in closing costs, has been deferred and will
be amortized over the ten year term of the operating
leasebacks as a reduction to rental expense.
In December 2004, the Company completed sale-
leaseback transactions on five of its owned properties
which were sold at fair value. Four of these transactions
have been accounted for as sale-leasebacks and are
included in total operating lease obligations. Proceeds
from these transactions totaled $187 million and the
aggregate net book value of these four properties
removed from the Company’s Consolidated Balance
Sheet was $91 million. The pretax gain of approximately
$94 million, net of $2 million in closing costs, has been
deferred and will be amortized over the ten year term
of the operating leasebacks as a reduction to rental
expense.
One of the 2004 sale-leaseback transactions has been
accounted for as financing because of certain terms
contained in the lease agreement. The $95 million in
proceeds from this transaction has been classified as
long-term debt and the balance as of December 31, 2005
was $93 million. At December 31, 2005, the Company’s
minimum aggregate rental commitment under this
transaction is approximately $6 million per annum from
2006 through 2010 and $26 million thereafter.
NOTE 12 Contingencies
The Company and its subsidiaries are involved in a
number of legal and arbitration proceedings concerning
matters arising in connection with the conduct of their
respective business activities. These include several class
actions involving the Company’s card businesses among
other matters. The Company believes it has meritorious
defenses to each of these actions and intends to defend
them vigorously.
The Company believes that it is not a party to, nor are
any of its properties the subject of, any pending legal,
arbitration or regulatory proceedings which would have
a material adverse effect on the Company’s consolidated
financial condition, results of operations or liquidity.
However, it is possible that the outcome of any such pro-
ceedings could have a material impact on results of
operations in any particular reporting period as the pro-
ceedings are resolved.
Notes to Consolidated
Financial Statements
AXP / AR.2005
[ 86 ]](https://image.slidesharecdn.com/1041986/85/american-express-Annual-Reports-2005-88-320.jpg)
![NOTE 13 Fair Values of Financial
Instruments
The following table discloses fair value information for
financial instruments. The fair values of financial instru-
ments are estimates based upon market conditions and
perceived risks at December 31, 2005 and 2004 and
require management judgment. These figures may not
be indicative of their future fair values. The fair value of
the Company, therefore, cannot be estimated by aggre-
gating the amounts presented.
The following table discloses fair value information for
financial instruments:
December 31, (Billions) 2005 2004
Carrying
Value Fair Value
Carrying
Value Fair Value
Financial Assets
Assets for which carrying values equal or approximate
fair value $ 106 $ 106 $ 98 $ 98
Financial Liabilities
Liabilities for which carrying values equal or approximate
fair value $ 57 $ 57 $ 50 $ 50
Long-term debt $ 31 $ 31 $ 33 $ 33
See Note 3 for carrying and fair value information
regarding investments, Note 10 for fair value informa-
tion regarding derivative financial instruments and
Note 11 for carrying and fair value information regard-
ing guarantees and certain off-balance sheet items. The
following methods were used to estimate the fair values
of financial assets and financial liabilities.
Financial Assets
Assets for which carrying values equal or approximate
fair values include cash and cash equivalents, cardmem-
ber receivable and accrued interest, certain other assets
and derivative financial instruments. Generally these
assets are either short-term in duration, variable rate in
nature or are recorded at fair value on the Consolidated
Balance Sheets.
Generally, investments are carried at fair value on the
Consolidated Balance Sheets and gains and losses
are recognized in the Consolidated Statements of
Income upon disposition of the securities or when man-
agement determines that a decline in value is
other-than-temporary.
For variable-rate loans that reprice within one year and
for which there has been no significant change in coun-
terparties’ creditworthiness, fair values approximate car-
rying values.
The fair values of all other loans except those with
significant credit deterioration, are estimated using
discounted cash flow analysis, based on current interest
rates for loans with similar terms to borrowers of similar
credit quality. For loans with significant credit deterio-
ration, fair values are based on estimates of future cash
flows discounted at rates commensurate with the risk
inherent in the revised cash flow projections, or for
collateral dependent loans on collateral values.
Financial Liabilities
Liabilities for which carrying values equal or approximate
fair values include customers’ deposits, Travelers
Cheques outstanding, investment certificate reserves,
short-term debt, certain other liabilities and derivative
financial instruments. Generally these liabilities are either
short-term in duration, variable rate in nature or are
recorded at fair value on the Consolidated Balance Sheets.
For variable-rate long-term debt that reprices within one
year, fair value approximates carrying value. For other
long-term debt, fair value is estimated using either
quoted market prices or discounted cash flows based on
the Company’s current borrowing rates for similar types
of borrowing.
Notes to Consolidated
Financial Statements
AXP / AR.2005
[ 87 ]](https://image.slidesharecdn.com/1041986/85/american-express-Annual-Reports-2005-89-320.jpg)
![NOTE 14 Significant Credit Concentrations
A credit concentration may exist if customers are
involved in similar industries, economic sectors and
geographic regions. The Company’s customers operate
in diverse economic sectors and geographic regions.
Therefore, management does not expect any material
adverse consequences to the Company’s financial posi-
tion, results of operations or cash flows to result from
these types of credit concentrations.
Certain distinctions between categories require manage-
ment judgment. The following table represents the
Company’s maximum credit exposure by industry,
including the credit exposure associated with derivative
financial instruments, at December 31:
(Billions, except percentages) 2005 2004
Financial institutions(a)
$ 15.3 $ 16.2
Individuals, including
cardmember receivables
and loans(b)
287.4 238.9
U.S. Government and agencies(c)
12.9 12.3
All other 7.9 10.1
Total $ 323.5 $ 277.5
Composition:
On-balance sheet 34% 36%
Off-balance sheet 66% 64%
Total 100% 100%
(a)Financial institutions primarily include banks, broker-dealers, insurance
companies and savings and loan associations.
(b)Charge card products have no preset spending limit; therefore, the quan-
tified credit amount includes the total credit line available to cardmem-
bers. The unused lines aggregating $213 billion and $176 billion in 2005
and 2004, respectively, represent commitments of the Company. See Note
11 for further explanation.
(c)U.S. Government and agencies represent the U.S. Government and its
agencies, states and municipalities, and quasi-government agencies.
Exposure to Airline Industry
Historically, the Company has not experienced
significant revenue declines resulting from a particular
airline’s scaling-back or closure of operations due to
bankruptcy or other financial challenges because the
volumes generated from the airline are typically shifted
to other participants in the industry that accept the
Company’s card products. Nonetheless, the Company is
exposed to business and credit risk in the airline indus-
try primarily through business arrangements where the
Company has remitted payment to the airline for a card-
member purchase of tickets that have not yet been used
or “flown.” This creates a potential exposure for the
Company in the event that the cardmember is not able
to use the ticket and the Company, based on the facts
and circumstances, credits the cardmember for the
unused ticket. Historically, this type of exposure has not
generated any significant losses for the Company
because of the need for an airline that is operating under
bankruptcy protection to continue accepting credit and
charge cards and honoring requests for credits and
refunds in the ordinary course of business, and in fur-
therance of its reorganization and its formal assumption,
with bankruptcy court approval, of its card acceptance
agreement, including approval of the Company’s right to
hold cash to cover these potential exposures to provide
credits to cardmembers. Typically, as an airline’s finan-
cial situation deteriorates, the Company delays payment
to the airlines thereby increasing cash held to protect
itself in the event of an ultimate liquidation of the airline.
The Company’s goal in these distressed situations is to
hold sufficient cash over time to ensure that upon liq-
uidation the cash held is equivalent to the credit expo-
sure related to any unused tickets.
As part of Delta Airlines’ (Delta) decision to file for pro-
tection under Chapter 11 of the Bankruptcy Code, the
Company agreed with Delta to restructure certain of its
financial arrangements with the airline. In particular,
Delta agreed to repay to the Company an aggregate $557
million, primarily representing the Company’s prepay-
ment of Delta SkyMiles rewards points. Contemporane-
ously with the repayment, the Company lent to Delta
$350 million as part of Delta’s post-petition, debtor-in-
possession (DIP) financing under the Bankruptcy Code.
At December 31, 2005, the remaining principal balance
is $300 million. This post-petition facility continues to
be structured as an advance against the Company’s obli-
gations to purchase Delta SkyMiles rewards points
under the Company’s co-brand and Membership
Rewards agreements and will be amortized ratably each
month beginning in July 2006 through November
2007. The Company’s post-petition facility is secured by
(i) senior liens on Delta assets specifically related to its
American Express co-brand, Membership Rewards and
card acceptance relationships and (ii) liens subordinate
to senior liens on all other Delta assets including the
assets and shares of certain Delta subsidiaries.
NOTE 15 Stock Plans
Stock Option and Award Programs
Under the 1998 Incentive Compensation Plan, awards
may be granted to officers and other key individuals
who perform services for the Company and its partici-
pating subsidiaries. These awards may be in the form of
stock options, restricted stock, portfolio grants andNotes to Consolidated
Financial Statements
AXP / AR.2005
[ 88 ]](https://image.slidesharecdn.com/1041986/85/american-express-Annual-Reports-2005-90-320.jpg)
![similar awards designed to meet the requirements of
non-U.S. jurisdictions.
The Company also has options that remain outstanding
pursuant to a Directors’ Stock Option Plan that expired
in 2003. Under these plans, there were a total of 71 mil-
lion, 68 million and 78 million common shares available
for grant at December 31, 2005, 2004 and 2003, respec-
tively. Each option has an exercise price equal to the
market price of the Company’s common stock on the
date of grant and a term of no more than 10 years. Sum-
marized below are the vesting provisions relating to
stock options:
Grant Year Vesting Provisions
2005–2004–2003 Generally vest ratably at 25
percent per year beginning
with the first anniversary of
the grant date
Prior to 1999 and
in 2002
Generally vest ratably at 331⁄3
percent per year beginning
with the first anniversary of
the grant date
2001–2000–1999 Generally vest ratably at 331⁄3
percent per year beginning
with the second anniversary
of the grant date
In 1998, the Company adopted a restoration stock
option program. This program provided that employees
who exercised options that had been outstanding at least
five years by surrendering previously owned shares as
payment would automatically receive a new (restora-
tion) stock option with an exercise price equal to the
market price on the date of exercise. The size of the res-
toration option was equal to the number of shares sur-
rendered plus any shares surrendered or withheld to sat-
isfy the employees’ income tax requirements. The term
of the restoration option, which became exercisable six
months after grant, was equal to the remaining life of the
original option. In July 2003, the Company discontin-
ued granting restoration options upon the eligible exer-
cise of a stock option granted on or after January 1,
2004. In July 2004, the Company further discontinued
granting restoration options upon the exercise of any
stock options effective January 1, 2005.
A summary of stock option and nonvested restricted stock award (RSA) activity as of December 31, 2005, and changes
during the year are presented below:
(Shares in thousands) Stock Options RSAs
Shares
Weighted Average
Exercise Price Shares
Weighted Average
Grant Price
Outstanding at beginning of year 131,872 $ 39.97 11,799 $ 41.25
Granted 6,858 $ 52.31 3,896 $ 52.30
Exercised/vested (26,618) $ 37.03 (5,487) $ 36.47
Forfeited/expired (4,329) $ 45.39 (2,696) $ 46.33
Adjustment pursuant to Ameriprise spin-off(a)
15,992 — 1,466 —
Outstanding at end of year 123,775 $ 35.75 8,978 $ 40.77
Options exercisable at end of year 105,423 $ 34.89
(a)The adjustment is as a result of the Ameriprise spin-off described in Note 2, which increased the number of options and RSAs and decreased the exercise/
grant price for these stock awards. No additional compensation expense was created by the adjustment.
Notes to Consolidated
Financial Statements
AXP / AR.2005
[ 89 ]](https://image.slidesharecdn.com/1041986/85/american-express-Annual-Reports-2005-91-320.jpg)
![Stock Options
The weighted average remaining contractual life of the
stock options outstanding as of December 31, 2005 was
5.1 years. The aggregate intrinsic value of the stock
options outstanding and exercisable as of December 31,
2005 was $1.9 billion and $1.7 billion, respectively. The
total intrinsic value of options exercised during 2005,
2004 and 2003 was $455 million, $633 million and
$191 million, respectively.
The fair value of each option is estimated on the date of
grant using a Black-Scholes option-pricing model with
the following weighted average assumptions used for
grants in 2005, 2004 and 2003:
2005 2004 2003
Dividend yield 0.9% 0.8% 1.0%
Expected volatility 24% 30% 34%
Risk-free interest rate 3.6% 2.9% 2.9%
Expected life of stock
option (years) 4.5 4.2 4.5
Weighted average fair value
per option $ 12.59 $ 13.27 $ 10.08
The dividend yield reflects the assumption that the cur-
rent dividend payout will continue with no anticipated
increases. The expected life of the options is based on
historical data and is not necessarily indicative of
exercise patterns that may occur.
Restricted Stock Awards
Restricted Stock Awards (RSAs) granted in 2005, 2004
and 2003 generally vest ratably at 25 percent per
year beginning with the first anniversary of the grant
date. RSAs granted prior to 2003 generally vest four
years from date of grant. The compensation expense
associated with these awards is recognized straight-line
over the vesting period.
As of December 31, 2005, there was $216 million of
total unrecognized compensation cost related to RSAs.
That cost is expected to be recognized over a weighted-
average period of 2.4 years. The total fair value of shares
vested during 2005, 2004 and 2003 was $290 million,
$97 million and $34 million, respectively.
Portfolio Grants
In addition, the Company grants Portfolio Grants which
are awards that earn value based on the Company’s or
segment’s financial performance and the Company’s
total shareholder return versus that of the S&P Financial
Index over a 3-year performance period, subject to busi-
ness and individual adjustments. The fair value of the
award is estimated at the date of grant and updated quar-
terly and recognized over the performance period.
The components of the Company’s pretax stock-based
compensation expense (net of cancellations) and asso-
ciated income tax benefit, are as follows:
(Millions) 2005 2004 2003
Stock options $ 84 $ 69 $ 31
Restricted stock awards 144 112 72
Portfolio grants(a)
26 — —
Total $ 254 $ 181 $ 103
Income tax benefit $ 89 $ 63 $ 36
(a)The 2005 expense represents only the amount recognized since July 1,
2005, when as a result of the adoption of SFAS 123(R), these awards
were accounted for as stock-based compensation although paid in cash.
NOTE 16 Retirement Plans
Defined Benefit Pension Plans
The Company sponsors the American Express Retire-
ment Plan (the Plan), a noncontributory defined benefit
plan which is a qualified plan under the Employee Retire-
ment Income Security Act of 1974, as amended (ERISA),
under which the cost of retirement benefits for eligible
employees in the United States is measured by length of
service, compensation and other factors and is currently
being funded through a trust. Funding of retirement costs
for the Plan complies with the applicable minimum fund-
ing requirements specified by ERISA. The Plan is a cash
balance plan and employees’ accrued benefits are based
on notional account balances, which are maintained for
each individual. Each pay period these balances are cred-
ited with an amount equal to a percentage, determined
by an employee’s age plus service, of compensation as
defined by the Plan (which includes, but is not limited
to, base pay, certain incentive pay and commissions, shift
differential, and overtime). Employees’ balances are also
credited daily with a fixed rate of interest that is updated
each January 1 and is based on the average of the daily
five-year U.S. Treasury Note yields for the previous Octo-
ber 1 through November 30, with a minimum crediting
rate of 5 percent and a maximum crediting rate equal to
the lesser of (i) 10 percent or (ii) the annual maximum
interest rate set by the U.S. Government for determining
lump-sum values. Employees and their beneficiaries have
the option to receive annuity payments upon retirement
or select a lump-sum payout at vested termination, death,
disability or retirement.
In addition, the Company sponsors an unfunded non-
qualified Supplemental Retirement Plan (the SRP) for cer-
tain highly compensated employees to replace the benefit
that cannot be provided by the Plan due to Internal Rev-
enue Service limits. The SRP is an excess benefit plan and
its terms generally parallel those of the Plan but the SRP’s
definition of compensation and payment options differ.
Notes to Consolidated
Financial Statements
AXP / AR.2005
[ 90 ]](https://image.slidesharecdn.com/1041986/85/american-express-Annual-Reports-2005-92-320.jpg)
![Most employees outside the United States are covered
by local retirement plans, some of which are funded,
while other employees receive payments at the time
of retirement or termination under applicable labor laws
or agreements.
The Company measures the obligations and related
asset values for its pension and other postretirement
benefit plans as of September 30th
.
The components of the net periodic pension cost for all
defined benefit plans accounted for under SFAS No. 87,
“Employers’ Accounting for Pensions,” are as follows:
(Millions) 2005 2004 2003
Service cost $ 104 $ 99 $ 92
Interest cost 117 109 102
Expected return on plan assets (141) (142) (126)
Amortization of:
Prior service costs 1 (4) (6)
Transition obligation (asset) — 1 (2)
Recognized net actuarial loss 27 19 18
Settlements/curtailment loss 4 3 9
Net periodic pension
benefit cost $ 112 $ 85 $ 87
The prior service costs are amortized on a straight-line
basis over the average remaining service period of active
participants. Gains and losses in excess of 10 percent of
the greater of the projected benefit obligation and the
market-related value of assets are amortized over the
average remaining service period of active participants.
The following tables provide a reconciliation of the
changes in the plans’ projected benefit obligation and
fair value of assets for all plans accounted for under SFAS
No. 87:
Reconciliation of Change in Projected
Benefit Obligation
(Millions) 2005 2004
Projected benefit obligation,
October 1 prior year $ 2,168 $ 1,896
Service cost 104 99
Interest cost 117 109
Benefits paid (59) (51)
Actuarial loss 220 94
Plan amendments(a)
— (3)
Settlements/curtailments (51) (51)
Foreign currency exchange
rate changes (107) 75
Projected benefit obligation at
September 30, $ 2,392 $ 2,168
(a)The plan amendment in 2004 reduced the future benefit accruals
under the Plan for employees supporting U.S. Business Travel effective
January 1, 2005.
Reconciliation of Change in Fair Value of Plan Assets
(Millions) 2005 2004
Fair value of plan assets,
October 1 prior year $ 1,975 $ 1,744
Actual return on plan assets 326 207
Employer contributions 41 53
Benefits paid (59) (51)
Settlements (51) (51)
Foreign currency exchange
rate changes (97) 73
Fair value of plan assets at
September 30, $ 2,135 $ 1,975
The Company complies with the minimum funding
requirements in all countries. The following table rec-
onciles the plans’ funded status (benefit obligation less
fair value of plan assets) to the amounts recognized on
the Consolidated Balance Sheets:
Funded Status
(Millions) 2005 2004
Funded status at September 30, $ (257) $ (193)
Unrecognized net actuarial loss 508 534
Unrecognized prior service cost 14 15
Unrecognized net transition
obligation 1 1
Fourth quarter contributions 5 5
Net amount recognized
at December 31, $ 271 $ 362
Accumulated benefit obligation
at September 30, $ 2,163 $ 2,036
The following table provides the amounts recognized on
the Consolidated Balance Sheets as of December 31:
(Millions) 2005 2004
Accrued benefit liability $ (203) $ (204)
Prepaid benefit cost 445 543
Minimum pension liability
adjustment 29 23
Net amount recognized
at December 31, $ 271 $ 362
The projected benefit obligation for all pension plans as
of September 30, 2005 and 2004 was $2.4 billion and
$2.2 billion, respectively. The Company must also
disclose the projected benefit obligation and related fair
value of plan assets for specific pension plans where the
projected benefit obligation exceeds the fair value of
plan assets. The projected benefit obligation and related
fair value of plan assets for these specific pension plans
was $2.3 billion and $2.1 billion, respectively, as of
September 30, 2005, and $1.3 billion and $1.0 billion,
respectively, as of September 30, 2004.
Notes to Consolidated
Financial Statements
AXP / AR.2005
[ 91 ]](https://image.slidesharecdn.com/1041986/85/american-express-Annual-Reports-2005-93-320.jpg)
![The accumulated benefit obligation for pension plans,
primarily unfunded plans, where the accumulated
benefit obligation exceeds the fair value of plan assets was
$221 million and $214 million as of September 30, 2005
and 2004, respectively. The fair value of the related plan
assets was $17 million and $15 million at these dates.
The weighted average assumptions used to determine
benefit obligations were:
2005 2004
Discount rates 5.1% 5.5%
Rates of increase in compensation
levels 4.2% 4.0%
The weighted average assumptions used to determine
net periodic benefit cost were:
2005 2004 2003
Discount rates 5.5% 5.7% 6.2%
Rates of increase in
compensation levels 4.0% 3.9% 3.9%
Expected long-term rates
of return on assets 7.8% 7.8% 8.0%
For 2005, the Company assumed on a weighted average
basis a long-term rate of return on assets of 7.8 percent.
In developing the 7.8 percent expected long-term rate
assumption, management evaluated input from an
external consulting firm, including its projection of asset
class return expectations and long-term inflation
assumptions. The Company also considered the
historical returns on the plan assets. The discount rate
assumption for the Company’s material plans (U.S. and
U.K.) was determined by using a model consisting of
bond portfolios that match the cash flows of the plan’s
projected benefit payments. The use of the rate pro-
duced by this model will result in a projected obligation
that would equal the current market value of a portfolio
of high-quality zero coupon bonds whose maturity
dates and amounts would be the same as the timing and
amount of expected future benefit payments.
The asset allocation for the Company’s pension plans at
September 30, 2005 and 2004, and the target allocation
for 2006, by asset category, are below. Actual allocations
will generally be within 5 percent of these targets.
Target
Allocation
Percentage of
Plan assets at
2006 2005 2004
Equity securities 67% 68% 67%
Debt securities 27% 26% 28%
Other 6% 6% 5%
Total 100% 100% 100%
The Company invests in an aggregate diversified port-
folio to ensure that adverse or unexpected results
from a security class will not have a detrimental impact
on the entire portfolio. The portfolio is diversified by
asset type, performance and risk characteristics and
number of investments. Asset classes and ranges consid-
ered appropriate for investment of the plan’s assets are
determined by each plan’s investment committee. The
asset classes typically include domestic and foreign
equities, emerging market equities, domestic and
foreign investment grade and high-yield bonds and
domestic real estate.
The Company’s retirement plans expect to make benefit
payments to retirees as follows (millions): 2006, $142;
2007, $128; 2008, $137; 2009, $148; 2010, $151; and
2011−2015, $1,002. In addition, the Company expects
to contribute $44 million to its pension plans in 2006.
Defined Contribution Retirement Plans
The Company sponsors defined contribution retirement
plans, the principal plan being the Incentive Savings
Plan (“ISP”), a 401(k) savings plan with a profit sharing
and stock bonus plan feature which is a qualified plan
under ERISA and which covers most employees in the
United States. Under the terms of the ISP, employees
have the option of investing in the American Express
Company Stock Fund, which invests primarily in the
Company’s common stock, through accumulated
payroll deductions. In addition, at least quarterly the
Company makes automatic cash contributions equal to
1 percent per annum of a qualifying employee’s base
salary. Such contributions are invested automatically in
the American Express Company Stock Fund and,
effective August 2, 2004, can be directed at any time into
other ISP investment options. Compensation expense
related to the Company’s contribution was $15 million
in 2005, 2004 and 2003, which is included in defined
contribution plan expense discussed below. The ISP
held 17 million and 22 million shares of American
Express Common Stock at December 31, 2005 and
2004, respectively, beneficially for employees.
Notes to Consolidated
Financial Statements
AXP / AR.2005
[ 92 ]](https://image.slidesharecdn.com/1041986/85/american-express-Annual-Reports-2005-94-320.jpg)
![The total defined contribution plan expense was $116
million, $117 million and $106 million in 2005, 2004
and 2003, respectively.
Other Postretirement Benefits
The Company sponsors defined postretirement benefit
plans that provide health care and life insurance to cer-
tain retired U.S. employees. Net periodic postretirement
benefit expenses were $36 million, $35 million and $36
million in 2005, 2004 and 2003, respectively. Effective
January 1, 2004, the Company decided to only provide
a subsidy for these benefits for employees who were at
least age 40 with at least 5 years of service as of
December 31, 2003.
The recognized liabilities for the Company’s defined
postretirement benefit plans are as follows:
Reconciliation of Accrued Benefit Cost and Total
Amount Recognized
(Millions) 2005 2004
Funded status of the plan $ (388) $ (354)
Unrecognized prior service cost (8) (10)
Unrecognized actuarial loss 172 158
Fourth quarter payments 6 6
Net amount recognized $ (218) $ (200)
Accumulated benefit obligation at
September 30, $ (388) $ (354)
Weighted average assumptions to determine benefit
obligations:
2005 2004
Discount rates 5.4% 5.75%
Health care cost increase rate:
Following year 10.0% 10.5%
Decreasing to the year 2016 5% 5%
A one percentage-point change in assumed health care
cost trend rates would have the following effects:
One
percentage-
point increase
One
percentage-
point decrease
(Millions) 2005 2004 2005 2004
Increase (decrease) on
benefits earned and
interest cost for
U.S. plans $ 1 $ 1 $ (1) $ (1)
Increase (decrease)
on accumulated
postretirement benefit
obligation for U.S. plans $ 20 $ 20 $ (18) $ (17)
NOTE 17 Income Taxes
The components of income tax provision included in
the Consolidated Statements of Income on income from
continuing operations were as follows:
(Millions) 2005 2004 2003
Current income tax provision:
U.S. federal $ 864 $ 756 $ 343
U.S. state and local 97 12 96
Foreign 385 165 265
Total current provision $ 1,346 $ 933 $ 704
Deferred income tax provision
(benefit):
U.S. federal $ (236) $ 308 $ 402
U.S. state and local (46) 7 18
Foreign (37) (103) (44)
Total deferred provision
(benefit) $ (319) $ 212 $ 376
Total income tax
provision $ 1,027 $ 1,145 $ 1,080
A reconciliation of the U.S. federal statutory rate of 35
percent to the Company’s effective income tax rate for
2005, 2004 and 2003 on continuing operations was
as follows:
2005 2004 2003
Combined tax at U.S.
statutory rate 35.0% 35.0% 35.0%
Changes in taxes
resulting from:
Tax-preferred investments (3.7) (4.2) (4.7)
State and local income taxes 0.8 0.3 2.2
Foreign earnings (3.4) (2.4) (1.5)
IRS tax settlement (4.5) (0.5) —
All other — 1.6 0.6
Effective tax rates 24.2% 29.8% 31.6%
Accumulated earnings of certain foreign subsidiaries,
which totaled $3.2 billion at December 31, 2005, are
intended to be permanently reinvested outside the
United States. Accordingly, federal taxes, which would
have aggregated approximately $675 million, have not
been provided on those earnings.
Deferred income tax provision (benefit) results from dif-
ferences between assets and liabilities measured for
financial reporting and for income tax return purposes.
The significant components of deferred tax assets
and liabilities related to continuing operations at
December 31, 2005 and 2004 are reflected in the
following table:
Notes to Consolidated
Financial Statements
AXP / AR.2005
[ 93 ]](https://image.slidesharecdn.com/1041986/85/american-express-Annual-Reports-2005-95-320.jpg)
![(Millions) 2005 2004
Deferred tax assets:
Reserves not yet deducted for
tax purposes $ 2,583 $ 2,204
Deferred compensation 156 49
Deferred cardmember fees 38 30
Net unrealized derivatives
losses — 62
Other 105 148
Gross deferred tax assets $ 2,882 $ 2,493
Deferred tax liabilities:
Depreciation and amortization $ 533 $ 415
Deferred revenue 345 264
Asset securitizations 310 319
Net unrealized securities gains 88 191
Net unrealized derivatives gains 77 —
Deferred acquisition costs 43 41
Other 216 249
Gross deferred tax liabilities $ 1,612 $ 1,479
Net deferred tax assets $ 1,270 $ 1,014
The gross deferred tax assets are shown net of a valua-
tion allowance of $55 million and $28 million at
December 31, 2005 and 2004, respectively. The valua-
tion allowance relates to deferred tax assets associated
with non-U.S. operations.
Net income taxes paid by the Company (including
amounts related to discontinued operations) during
2005, 2004 and 2003 were $1.7 billion, $1.1 billion and
$1.2 billion, respectively, and include estimated tax pay-
ments and cash settlements relating to prior tax years.
The actual tax benefit realized for tax deductions from
stock option exercises which are recorded in additional
paid-in capital totaled $234 million, $158 million
and $60 million, respectively, for the years ended
December 31, 2005, 2004 and 2003.
Comprehensive income in the Consolidated Statements
of Shareholders’ Equity is presented net of the following
income tax provision (benefit) amounts:
Comprehensive Income Components
(Millions) 2005 2004 2003
Net unrealized securities losses $ (103) $ (92) $ (91)
Net unrealized derivative gains 139 152 60
Foreign currency translation
gains (losses) 29 11 (5)
Minimum pension liability (2) — 18
Net income tax (benefit)
provision $ 63 $ 71 $ (18)
The table above excludes 2005 activity associated with
discontinued operations. Income tax provision (benefit)
amounts in 2005 on net unrealized securities gains, net
unrealized derivative losses and foreign currency trans-
lation adjustments included in accumulated other
comprehensive income associated with discontinued
operations were ($218) million, $15 million and
($8) million, respectively.
NOTE 18 Earnings Per Common Share
Basic EPS is computed using the average actual shares
outstanding during the period. Diluted EPS is basic EPS
adjusted for the dilutive effect of stock options, RSAs
and other financial instruments that may be converted
into common shares. The basic and diluted EPS
computations for the years ended December 31, are
as follows:
(Millions, except per share amounts) 2005 2004 2003
Numerator:
Income from continuing
operations $ 3,221 $ 2,686 $ 2,335
Income from discontinued
operations 513 830 665
Cumulative effect of
accounting change,
net of tax — (71) (13)
Net income $ 3,734 $ 3,445 $ 2,987
Denominator:
Basic: Weighted-average
shares outstanding
during the period 1,233 1,259 1,284
Add: Dilutive effect of
stock options, restricted
stock awards and other
dilutive securities 25 26 14
Diluted 1,258 1,285 1,298
Basic EPS:
Income from continuing
operations $ 2.61 $ 2.13 $ 1.82
Income from discontinued
operations 0.42 0.66 0.52
Cumulative effect of
accounting change,
net of tax — (0.05) (0.01)
Net income $ 3.03 $ 2.74 $ 2.33
Diluted EPS:
Income from continuing
operations $ 2.56 $ 2.09 $ 1.80
Income from discontinued
operations 0.41 0.65 0.51
Cumulative effect of
accounting change, net
of tax — (0.06) (0.01)
Net income $ 2.97 $ 2.68 $ 2.30
Notes to Consolidated
Financial Statements
AXP / AR.2005
[ 94 ]](https://image.slidesharecdn.com/1041986/85/american-express-Annual-Reports-2005-96-320.jpg)
![For the years ended December 31, 2005, 2004 and
2003, the dilutive effect of stock options excludes 14
million, 13 million and 65 million, respectively, from the
computation of diluted EPS because inclusion of the
options would have been anti-dilutive. The convertible
debentures issued in November 2003 will not affect the
computation of EPS unless the Company’s common
share price exceeds the base conversion price (currently
$60.49 per share as adjusted to reflect the Company’s
distribution on September 30, 2005 of 100 percent of
the shares of its wholly-owned subsidiary, Ameriprise,
to the Company’s shareholders). In that scenario, the
Company would reflect the additional common shares
in the calculation of diluted earnings per share using the
treasury stock method.
The debentures are convertible into our common shares
only in limited circumstances, including when the trad-
ing price of our common stock for a specified minimum
period is more than 125 percent of the base conversion
price (currently at or above $75.61). If the entire out-
standing amount of debentures were to be converted
when our common shares were trading at $75.61, the
maximum number of shares the Company would issue,
if it chose to settle the entire amount of its conversion
obligation above the accreted principal amount of the
debentures in shares, would be approximately 26 mil-
lion shares. The Company is required to settle up to the
accreted principal amount of the debentures in cash.
The number of shares issuable upon conversion of the
debentures will increase as the price of our common
shares at the time of conversion increases. Using the cur-
rent maximum conversion rate, in no event would the
Company be required to issue more than 52 million
shares upon conversion of the debentures.
NOTE 19 Operating Segments and
Geographic Operations
Operating Segments
American Express Company is a leading global
payments, network and travel company which is
principally engaged in businesses comprising three
operating segments: U.S. Card Services, International
Card & Global Commercial Services and Global
Network & Merchant Services.
U.S. Card Services includes the U.S. proprietary con-
sumer card business, OPEN from American Express, the
global Travelers Cheques and Prepaid Services business
and the American Express U.S. Consumer Travel
Network.
International Card & Global Commercial Services pro-
vides proprietary consumer cards and small business
cards outside the United States. International Card
& Global Commercial Services also offers global corpo-
rate products and services, including Corporate Card,
issued to individuals through a corporate account estab-
lished by their employer; Business Travel, which helps
businesses manage their travel expenses through a
variety of travel-related products and services; and
Corporate Purchasing Solutions, addressing a business
need to pay for everyday expenses such as office and
computer supplies. International Card & Global Com-
mercial Services also includes international banking
operations which provide financial products and ser-
vices to retail customers and wealthy individuals out-
side the United States and financial institutions around
the world.
Global Network & Merchant Services consists of the Mer-
chant Services businesses and Global Network Services.
Global Network Services develops and manages relation-
ships with third parties that issue American Express
branded cards. The Global Merchant Services businesses
develop and manage relationships with merchants that
accept American Express branded cards; authorize and
record transactions; pay merchants; and provide a variety
of value-added point-of-sale and back office services. In
addition, in particular emerging markets, issuance of
certain proprietary cards is managed within the Global
Network Services business. Global Network & Merchant
Services works with merchant and bank partners to
develop and market product propositions, operate
systems that enable third parties to interface with the
American Express global network and provide network
functions that include operations, service delivery, autho-
rization, clearing, settlement and brand advertising, new
product development and marketing.
Corporate & Other consists of corporate functions
and auxiliary businesses including, for 2003 and 2004,
the leasing product line of the Company’s small business
financing unit, American Express Business Finance
Corporation, which was sold in 2004.
The following table presents certain information regard-
ing these operating segments, based on management’s
evaluation and internal reporting structure, at
December 31, 2005, 2004 and 2003 and for each of the
years then ended.
Notes to Consolidated
Financial Statements
AXP / AR.2005
[ 95 ]](https://image.slidesharecdn.com/1041986/85/american-express-Annual-Reports-2005-97-320.jpg)
![(Millions, except where indicated)
U.S. Card
Services(a)
International
Card & Global
Commercial
Services(b)
Global
Network &
Merchant
Services(c)
Corporate
& Other(d)
Consolidated
2005
Revenues $ 11,949 $ 9,038 $ 2,842 $ 438 $ 24,267
Cardmember lending net finance charge revenue 1,792 684 67 37 2,580
Interest expense 548 332 (150) 190 920
Pretax income (loss) from continuing operations 2,599 1,149 870 (370) 4,248
Income tax provision (benefit) 765 215 306 (259) 1,027
Income (loss) from continuing operations $ 1,834 $ 934 $ 564 $ (111) $ 3,221
Total assets (billions) $ 70.3 $ 51.7 $ 4.5 $ (12.5) $ 114.0
Total equity (billions) $ 5.1 $ 4.1 $ 1.3 $ — $ 10.5
2004
Revenues $ 10,395 $ 8,429 $ 2,639 $ 501 $ 21,964
Cardmember lending net finance charge revenue 1,370 640 29 185 2,224
Interest expense 453 280 (108) 189 814
Pretax income (loss) from continuing operations 2,140 1,116 904 (329) 3,831
Income tax provision (benefit) 622 335 330 (142) 1,145
Income (loss) from continuing operations $ 1,518 $ 781 $ 574 $ (187) $ 2,686
Total assets (billions)(e)
$ 58.3 $ 47.9 $ 3.9 $ 84.1 $ 194.2
Total equity (billions) $ 4.5 $ 3.8 $ 1.1 $ 6.6 $ 16.0
2003
Revenues $ 9,478 $ 7,405 $ 2,347 $ 319 $ 19,549
Cardmember lending net finance charge revenue 1,271 609 22 140 2,042
Interest expense 571 291 (103) 101 860
Pretax income (loss) from continuing operations 1,956 1,074 766 (381) 3,415
Income tax provision (benefit) 558 359 280 (117) 1,080
Income (loss) from continuing operations $ 1,398 $ 715 $ 486 $ (264) $ 2,335
Total assets (billions)(e)
$ 53.0 $ 42.3 $ 4.2 $ 76.4 $ 175.9
Total equity (billions) $ 3.7 $ 3.4 $ 1.0 $ 7.2 $ 15.3
(a)U.S. Card Services’ 2005 results reflect reengineering charges of $10 million ($7 million after-tax), tax benefits of $29 million, a $123 million ($80 million
after-tax) provision for losses recorded in the fourth quarter 2005 reflecting substantially higher losses related to increased bankruptcy filings resulting
from the October 17, 2005 change in bankruptcy legislation, and a provision to reflect estimated costs related to Hurricane Katrina of $38 million. 2004
results reflect a reconciliation of securitization-related cardmember loans, which resulted in a charge of $115 million (net of $32 million of reserves pre-
viously provided) for balances accumulated over the five-year period as a result of a computational error. The amount of the error was immaterial to
any of the periods to which it occurred.
(b)International Card & Global Commercial Services’ 2005 results reflect reengineering charges of $168 million ($109 million after-tax), tax benefits of
$33 million and a provision to reflect estimated costs related to Hurricane Katrina of $9 million. 2004 results reflect restructuring charges of $90 million
($59 million after-tax).
(c)Global Network & Merchant Services’ 2005 results reflect reengineering charges of $3 million ($2 million after-tax), tax benefits of $21 million and
a provision to reflect estimated costs related to Hurricane Katrina of $2 million. 2004 results reflect a reduction in merchant-related reserves of approxi-
mately $60 million that reflect changes made to mitigate loss exposure and ongoing favorable credit experience with merchants.
(d)Corporate & Other 2005 results reflect reengineering charges of $105 million ($68 million after-tax), tax benefits of $159 million and a $73 million
($47 million after-tax) benefit related to the settlement of an insurance claim associated with September 11, 2001. 2004 results reflect a gain of $117 million
($76 million after-tax) on the sale of the leasing product line of the Company’s small business financing unit, American Express Business Finance
Corporation, and restructuring charges of $9 million ($5 million after-tax).
(e)Corporate & Other total assets for 2004 and 2003 include $87.1 billion and $80.2 billion of assets of discontinued operations, respectively.
Notes to Consolidated
Financial Statements
AXP / AR.2005
[ 96 ]](https://image.slidesharecdn.com/1041986/85/american-express-Annual-Reports-2005-98-320.jpg)
![Revenues
The Company applies a transfer pricing methodology
for the allocation of discount revenue and certain other
revenues between segments. Discount revenue is earned
by segments based on the volume of merchant business
generated by cardmembers at predetermined rates.
Within the U.S. Card Services and International Card &
Global Commercial Services segments, discount rev-
enue reflects the issuer component of the overall dis-
count rate and within the Global Network & Merchant
Services segment, discount revenue reflects the network
component of the overall discount rate. Net finance
charge revenue and net card fees are directly attributable
to the segment in which they are reported.
Expenses
Marketing, promotion, rewards and cardmember ser-
vices expenses are reflected in each segment based on
actual expenses incurred within the segment, with the
exception of brand advertising, which is reflected in the
Global Network & Merchant Services segment.
The provision for losses reflects credit-related expenses
as incurred within each segment.
Human resources and other expenses reflect expenses
incurred directly within each segment as well as
expenses related to the Company’s support services,
which are allocated to each segment based on support
service activities directly attributable to the segment.
Other overhead expenses are allocated to segments
based on each segment’s level of pretax income. Financ-
ing requirements are managed on a consolidated basis.
Funding costs are allocated to segments based on
segment funding requirements.
Capital
Each business segment is allocated capital based on
business model operating requirements, risk measures
and regulatory capital requirements. Business model
requirements include capital needed to support opera-
tions and specific balance sheet items. The risk measures
include considerations for credit, market and opera-
tional risk. Regulatory capital requirements include
the capital amounts defined for well-capitalized finan-
cial institutions.
Income taxes
Income tax provision (benefit) is allocated to each busi-
ness segment based on the effective tax rates applicable
to various businesses that comprise the segment.
Assets are those that are used or generated exclusively
by each industry segment. The adjustments and elimi-
nations required to determine the consolidated amounts
shown above consist principally of the elimination of
inter-segment amounts.
For certain income statement items that are affected by
asset securitizations and to reflect certain tax-exempt
investment income as if it had been earned on a taxable
basis at U.S. Card Services, data are provided on both
a basis consistent with GAAP as presented above, as well
as on a managed basis below. In addition, International
Card & Global Commercial Services reflects a reclassi-
fication of certain foreign exchange services as revenues
on a managed basis. Income from continuing operations
is the same under both a GAAP and managed basis. See
U.S. Card Services and International Card & Global
Commercial Services Results of Operations sections of
MD&A for managed basis discussions.
Notes to Consolidated
Financial Statements
AXP / AR.2005
[ 97 ]](https://image.slidesharecdn.com/1041986/85/american-express-Annual-Reports-2005-99-320.jpg)
![(Millions)
U.S. Card
Services
International
Card & Global
Commercial
Services
Global
Network &
Merchant
Services
Corporate
& Other Consolidated
2005 Managed Basis
Revenues $13,078 $ 9,173 $ 2,842 $ 438 $25,531
Cardmember lending net finance charge revenue 3,745 684 67 37 4,533
Pretax income (loss) from continuing operations 2,825 1,149 870 (370) 4,474
Income tax provision (benefit) 991 215 306 (259) 1,253
2004 Managed Basis
Revenues $ 11,539 $ 8,601 $ 2,639 $ 501 $ 23,280
Cardmember lending net finance charge revenue 3,208 640 29 185 4,062
Pretax income (loss) from continuing operations 2,368 1,116 904 (329) 4,059
Income tax provision (benefit) 850 335 330 (142) 1,373
2003 Managed Basis
Revenues $ 10,649 $ 7,566 $ 2,347 $ 319 $ 20,881
Cardmember lending net finance charge revenue 3,126 609 22 140 3,897
Pretax income (loss) from continuing operations 2,184 1,074 766 (381) 3,643
Income tax provision (benefit) 786 359 280 (117) 1,308
Geographic Operations
The following table presents the Company’s revenues and pretax income in different geographic regions:
(Millions) United States Europe(a)
Asia/Pacific All Other Consolidated
2005
Revenues $ 16,024 $ 3,376 $ 2,306 $ 2,561 $ 24,267
Pretax income from continuing operations $ 3,337 $ 289 $ 310 $ 312 $ 4,248
2004
Revenues $ 14,551 $ 3,105 $ 2,140 $ 2,168 $ 21,964
Pretax income from continuing operations $ 2,784 $ 293 $ 286 $ 468 $ 3,831
2003
Revenues $ 13,266 $ 2,454 $ 1,855 $ 1,974 $ 19,549
Pretax income from continuing operations $ 2,418 $ 355 $ 218 $ 424 $ 3,415
(a)Results in Europe are impacted by reengineering initiatives in 2005 and 2004.
Most services of the Company are provided on an inte-
grated worldwide basis. Therefore, it is not practicable
to separate precisely the U.S. and international services.
Accordingly, the data in the above table are, in part,
based upon internal allocations, which necessarily
involve management’s judgment.
NOTE 20 Transfer of Net Assets
from Subsidiaries
Restrictions on the transfer of net assets exist under debt
agreements and regulatory requirements of certain of
the Company’s subsidiaries. These restrictions have not
had any effect on the Company’s shareholder dividend
policy and management does not anticipate any impact
in the future.
At December 31, 2005, the aggregate amount of net
assets of subsidiaries that may not be transferred to the
Parent Company was approximately $6 billion. When
needed, procedures exist to transfer net assets between
the Company and its subsidiaries, while complying with
the various contractual and regulatory constraints.
Notes to Consolidated
Financial Statements
AXP / AR.2005
[ 98 ]](https://image.slidesharecdn.com/1041986/85/american-express-Annual-Reports-2005-100-320.jpg)
![NOTE 21 Quarterly Financial Data (Unaudited)
(Millions, except per share amounts) 2005(a)
2004(a)
Quarters Ended 12/31(b)
9/30(c)
6/30(d)
3/31 12/31(e)
9/30(f)
6/30 3/31(g)
Revenues $ 6,437 $ 6,068 $ 6,090 $ 5,672 $ 5,903 $ 5,476 $ 5,467 $ 5,118
Pretax income from continuing operations 959 1,080 1,121 1,088 920 1,014 1,008 889
Income from continuing operations 751 865 860 745 669 702 706 609
(Loss)/income from discontinued operations,
net of tax (6) 165 153 201 227 177 170 256
Net income 745 1,030 1,013 946 896 879 876 794
Earnings Per Common Share — Basic:
Continuing operations 0.61 0.70 0.70 0.60 0.54 0.56 0.56 0.48
Discontinued operations (0.01) 0.14 0.12 0.16 0.18 0.14 0.13 0.20
Cumulative effect of accounting change — — — — — — — (0.06)
Net income 0.60 0.84 0.82 0.76 0.72 0.70 0.69 0.62
Earnings Per Common Share — Diluted:
Continuing operations 0.60 0.69 0.69 0.59 0.53 0.55 0.55 0.47
Discontinued operations (0.01) 0.13 0.12 0.16 0.18 0.14 0.13 0.19
Cumulative effect of accounting change — — — — — — — (0.05)
Net income 0.59 0.82 0.81 0.75 0.71 0.69 0.68 0.61
Cash dividends declared per common share 0.12 0.12 0.12 0.12 0.12 0.12 0.10 0.10
Common share price:
High 53.06(h)
59.50 55.30 58.03 57.05 51.77 52.82 54.50
Low 46.59(h)
52.30 49.51 50.01 50.86 47.70 47.32 47.43
(a)The spin-off of Ameriprise and certain dispositions (including the sale of TBS) were completed in 2005 and the results of these operations are presented
as discontinued operations.
(b)Fourth quarter 2005 results reflect $123 million ($80 million after-tax) increase in the provision for losses reflecting higher write-offs related to increased
bankruptcy filings, a state tax benefit of $60 million related to the finalization of state tax returns and reengineering charges of $65 million ($42 million
after-tax).
(c)Third quarter 2005 results reflect a tax benefit of $105 million from the resolution of a prior year tax item, reengineering charges of $86 million ($56
million after-tax) and a $49 million ($32 million after-tax) provision to reflect the estimated costs related to Hurricane Katrina.
(d)Second quarter 2005 results reflect $113 million ($73 million after-tax) benefit from the recovery of September 11th
related insurance claims, a $87
million tax benefit resulting from an IRS audit of previous years’ tax returns and reengineering charges of $114 million ($74 million after-tax).
(e)Fourth quarter 2004 results reflect aggregate restructuring charges of $99 million ($64 million after-tax) for initiatives executed during 2004. In addition,
the Company recognized a $117 million ($76 million after-tax) net gain on the sale of the leasing product line of the Company’s small business financing
unit, American Express Business Finance Corporation.
(f)Third quarter 2004 results reflect a reconciliation of securitization-related cardmember loans, which resulted in a charge of $115 million (net of $32
million of reserves previously provided) for balances accumulated over the prior five year period as a result of a computational error. The amount of
the error was immaterial to any of the periods in which it occurred. In addition, third quarter 2004 results reflect a reduction in merchant-related reserves
of approximately $60 million that reflect changes made to mitigate loss exposure and ongoing favorable credit experience with merchants.
(g)First quarter 2004 results reflect $109 million non-cash pretax charge ($71 million after-tax) related to the January 1, 2004 adoption of SOP 03-1.
(h)The market price per share for the fourth quarter 2005 reflects the spin-off of Ameriprise as of September 30, 2005. The opening share price on the
first trading day subsequent to the spin-off was $50.75. See Note 2 for additional information on results of discontinued operations.
Notes to Consolidated
Financial Statements
AXP / AR.2005
[ 99 ]](https://image.slidesharecdn.com/1041986/85/american-express-Annual-Reports-2005-101-320.jpg)
![NOTE 22 Restructuring Charges
During 2005 and 2004, the Company recorded restruc-
turing charges consisting of employee severance obliga-
tions and other exit costs (principally relating to the early
termination of certain real property leases). The charges
reflect expenses in connection with several initiatives
relating principally to the restructuring of the Company’s
business travel and international operations and the relo-
cation of certain functions in the Company’s finance and
technologies operations. The charges related to severance
obligations are included in human resources and the
other exit costs are included in occupancy and equip-
ment, professional services and other expenses in the
Company’s Consolidated Statements of Income for the
years ended December 31, 2005 and 2004. As of
December 31, 2005, other liabilities included $107 mil-
lion related to the aggregate restructuring charges
recorded for future cash outlays expected to be paid out
prior to the end of 2006. The following tables summarize
by category the Company’s restructuring activity for each
of the Company’s operating segments.
2004 Restructuring Charges Cash paid during 2004
Liability balance at
December 31, 2004
(Millions) Severance Other Total Severance Other Total Severance Other Total
U.S. Card Services $ — $ — $ — $ — $ — $ — $ — $ — $ —
International Card &
Global Commercial
Services 71 19 90 8 6 14 63 13 76
Global Network &
Merchant Services — — — — — — — — —
Corporate & Other 5 4 9 2 4 6 3 — 3
Total $ 76 $ 23 $ 99 $ 10 $ 10 $ 20 $ 66 $ 13 $ 79
Liability balance at
December 31, 2004 2005 Restructuring Charges Cash paid during 2005
Liability balance at
December 31, 2005
(Millions) Severance Other Total Severance Other Total Severance Other Total Severance Other Total
U.S. Card Services $ — $ — $ — $ 10 $ — $ 10 $ 6 $ — $ 6 $ 4 $ — $ 4
International Card &
Global Commercial
Services 63 13 76 88 12 100 103 21 124 48 4 52
Global Network &
Merchant Services — — — 3 — 3 1 — 1 2 — 2
Corporate & Other 3 — 3 63 17 80 22 12 34 44 5 49
Total $ 66 $ 13 $ 79 $ 164 $ 29 $ 193 $ 132 $ 33 $ 165 $ 98 $ 9 $ 107
Notes to Consolidated
Financial Statements
AXP / AR.2005
[ 100 ]](https://image.slidesharecdn.com/1041986/85/american-express-Annual-Reports-2005-102-320.jpg)
![CONSOLIDATED FIVE-YEAR SUMMARY OF SELECTED FINANCIAL DATA
(Millions, except per share amounts and where indicated) 2005(a)
2004(b)
2003 2002 2001(c)
Operating Results
Revenues $ 24,267 $ 21,964 $ 19,549 $ 18,079 $ 17,710
Expenses 20,019 18,133 16,134 15,058 15,973
Income from continuing operations 3,221 2,686 2,335 2,142 1,337
Income (loss) from discontinued operations 513 830 665 529 (26)
Income before cumulative effect of accounting change 3,734 3,516 3,000 2,671 1,311
Net income 3,734 3,445 2,987 2,671 1,311
Return on average shareholders’ equity(d)
25.4% 22.0% 20.6% 20.2% 10.8%
Balance Sheet
Cash and cash equivalents $ 7,126 $ 7,808 $ 3,967 $ 3,939 $ 4,542
Accounts receivable and accrued interest, net 35,497 32,398 29,394 27,677 27,997
Investments 21,334 21,675 19,305 20,272 17,354
Loans, net 40,801 34,256 31,706 27,212 25,799
Assets of discontinued operations — 87,141 80,207 69,242 66,921
Total assets 113,960 194,216 175,861 158,299 151,617
Customers’ deposits 24,579 20,107 20,252 17,252 13,471
Travelers Cheques outstanding 7,175 7,287 6,819 6,623 6,190
Short-term debt 15,633 14,316 18,983 21,272 31,554
Long-term debt 30,781 32,676 20,209 16,188 7,668
Liabilities of discontinued operations — 80,675 73,193 63,112 61,575
Shareholders’ equity 10,549 16,020 15,323 13,861 12,037
Common Share Statistics
Earnings per share:
Income from continuing operations:
Basic $ 2.61 $ 2.13 $ 1.82 $ 1.62 $ 1.01
Diluted $ 2.56 $ 2.09 $ 1.80 $ 1.61 $ 1.00
Income from discontinued operations:
Basic $ 0.42 $ 0.66 $ 0.52 $ 0.40 $ (0.02)
Diluted $ 0.41 $ 0.65 $ 0.51 $ 0.40 $ (0.02)
Cumulative effect of accounting change, net of tax
Basic — $ (0.05) $ (0.01) — —
Diluted — $ (0.06) $ (0.01) — —
Net income:
Basic $ 3.03 $ 2.74 $ 2.33 $ 2.02 $ 0.99
Diluted $ 2.97 $ 2.68 $ 2.30 $ 2.01 $ 0.98
Cash dividends declared per share $ 0.48 $ 0.44 $ 0.38 $ 0.32 $ 0.32
Book value per share:
Actual $ 8.50 $ 12.83 $ 11.93 $ 10.63 $ 9.05
Market price per share(e)
:
High $ 59.50 $ 57.05 $ 49.11 $ 44.91 $ 57.06
Low $ 47.01 $ 47.32 $ 30.90 $ 26.55 $ 24.20
Close $ 51.46 $ 56.37 $ 48.23 $ 35.35 $ 35.69
Average common shares outstanding for earnings per share:
Basic 1,233 1,259 1,284 1,320 1,324
Diluted 1,258 1,285 1,298 1,330 1,336
Shares outstanding at period end 1,241 1,249 1,284 1,305 1,331
Other Statistics
Number of employees at period end (thousands):
United States 29 41 42 41 49
Outside United States 37 37 36 35 35
Total(f)
66 78 78 76 84
Number of shareholders of record 55,409 50,394 47,967 51,061 52,041
(a)In 2005, the spin-off of Ameriprise and certain dispositions (including the sale of TBS) were completed and the results of these operations are presented
as discontinued operations. Results for 2005 reflect reengineering charges of $286 million ($186 million after-tax) for initiatives executed during 2005,
$242 million of tax benefits, a $123 million ($80 million after-tax) increase in the provision for losses recorded in the fourth quarter 2005, reflecting
substantially higher losses related to increased bankruptcy filings resulting from the October 17, 2005 change in bankruptcy legislation, a $113 million
($73 million after-tax) benefit from the recovery of September 11th related insurance claims and a $49 million ($32 million after-tax) provision to reflect
the estimated costs related to Hurricane Katrina.
(b)Results for 2004 reflect restructuring charges of $99 million ($64 million after-tax) for initiatives executed during 2004. In addition, the Company rec-
ognized a $117 million ($76 million after-tax) net gain on the sale of the leasing product line of the Company’s small business financing unit, American
Express Business Finance Corporation, a charge of $115 million (net of $32 million of reserves previously provided) related to a reconciliation of
securitization-related cardmember loans and a reduction in merchant-related reserves of approximately $60 million that reflect changes made to mitigate
loss exposure and ongoing favorable credit experience with merchants.
(c)Results for 2001 include restructuring charges of $524 million pretax ($341 million after-tax) and the one-time adverse impact from the September 11th
terrorist attacks of $98 million pretax ($65 million after-tax).
(d)Computed on a trailing 12-month basis using total shareholders’ equity as included in the Consolidated Financial Statements prepared in accordance with GAAP.
(e)The market price per share for the fourth quarter 2005 reflects the spin-off of Ameriprise as of September 30, 2005. The opening share price on the
first trading day subsequent to the spin-off was $50.75. See Note 2 for additional information on results of discontinued operations.
(f)Years prior to 2005 include employees from discontinued operations.
Consolidated
Five-Year Summary
of Selected
Financial Data
AXP / AR.2005
[ 101 ]](https://image.slidesharecdn.com/1041986/85/american-express-Annual-Reports-2005-103-320.jpg)
![EXECUTIVE OFFICERS
Global Leadership Team
Kenneth I. Chenault
Chairman and Chief Executive Officer
Gary L. Crittenden
Executive Vice President and Chief Financial Officer
Head, Global Network Services
Edward P. Gilligan
Group President
American Express International and
Global Corporate Services
Alfred F. Kelly, Jr.
Group President
Consumer, Small Business and Merchant Services
Corporate Executives
L. Kevin Cox
Executive Vice President
Human Resources
John D. Hayes
Executive Vice President
Global Advertising and Brand Management
and Chief Marketing Officer
Louise M. Parent
Executive Vice President and General Counsel
Thomas Schick
Executive Vice President
Corporate Affairs and Communications
Stephen J. Squeri
Executive Vice President and Chief Information Officer
BOARD OF DIRECTORS
Daniel F. Akerson
Managing Director
The Carlyle Group
Charlene Barshefsky
Senior International Partner
Wilmer Cutler Pickering Hale and Dorr LLP
William G. Bowen*
President
The Andrew W. Mellon Foundation
Ursula M. Burns
Senior Vice President and President,
Business Group Operations
Xerox Corporation
Kenneth I. Chenault
Chairman and Chief Executive Officer
American Express Company
Peter Chernin
President and Chief Operating Officer
News Corporation
Peter R. Dolan
Chief Executive Officer
Bristol-Myers Squibb Company
Vernon E. Jordan, Jr.
Senior Managing Director
Lazard Freres & Co. LLC
Jan Leschly
Chairman and Chief Executive Officer
Care Capital LLC
Richard A. McGinn
Partner
RRE Ventures
Edward D. Miller
Former President and Chief Executive Officer
AXA Financial, Inc.
Frank P. Popoff
Chairman
Chemical Financial Corporation
Robert D. Walter
Chairman and Chief Executive Officer
Cardinal Health, Inc.
Advisors to the Board of Directors
Robert L. Genillard
International Investor
Henry A. Kissinger
Chairman, Kissinger Associates, Inc.
Former Secretary of State of the United States of America
* Having reached retirement age, Mr. Bowen is not standing for reelection.
AXP / AR.2005
[ 102 ]](https://image.slidesharecdn.com/1041986/85/american-express-Annual-Reports-2005-104-320.jpg)