SlideShare a Scribd company logo
1 of 15
Download to read offline
ANDREA CASATI STEVENS FIRST PRINCIPLES INVESTMENT ADVISORS
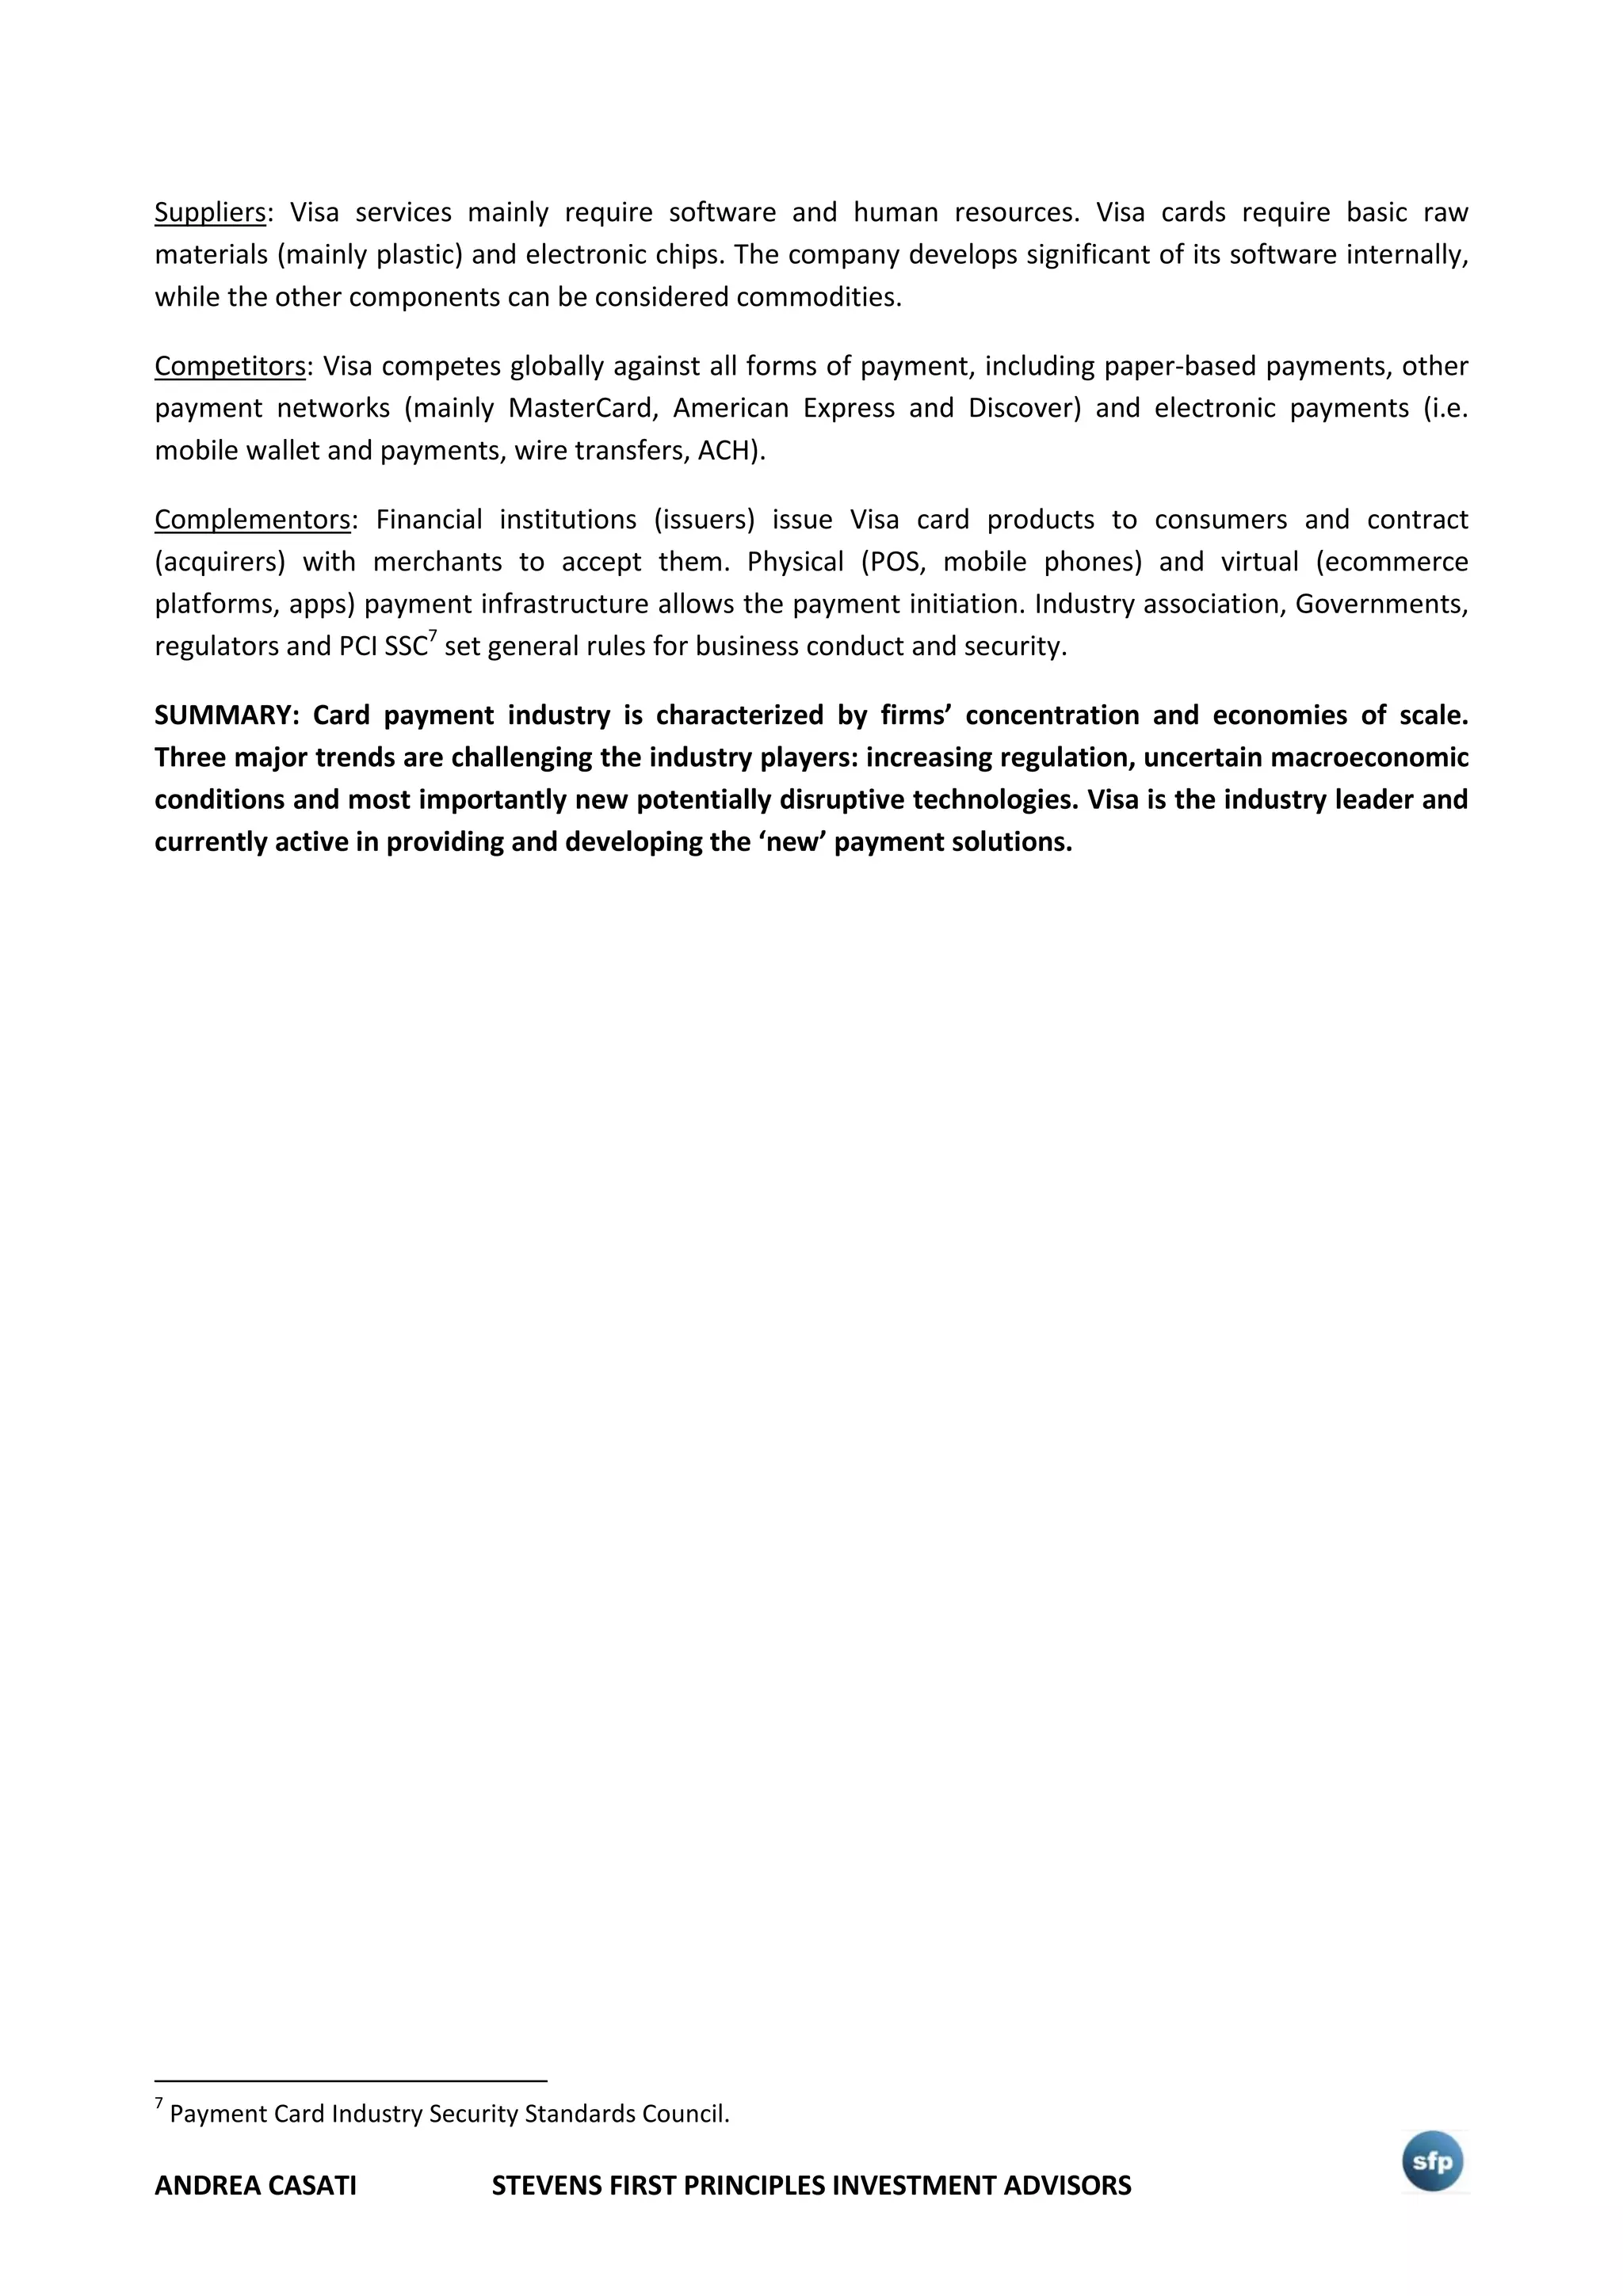
VISA, INC (V) , NYSE
Sector: FINANCIAL SERVICES Industry: Consumer finance
RECENT STATISTICS (02/03/16)
Recent price 74.38
52-week range 60.00 - 81.01
Market cap 178.72B
Total Debt 16B
Beta 0.95
EPS 2.62
EPS (est) 3.00
P/E 28.39
E/P 3.52%
P/B 6.12
Dividend 0.5
Div yield 0.67%
ɪ. RECCOMMENDATION: BULL CALL SPREAD
Visa is living a strong momentum. The company is leader in its industry and has great fundamentals. The
industry is facing major technological changes, increasing regulation and uncertain macroeconomic
conditions that could impact negatively Visa performance. European and Asian market are expected to be
the main growth drivers. At the current price of $74.38, the company stock appears to be slightly
underpriced with respect an estimated fair value of $83.16. The margin of safety is too low (11.8%). We
recommend the implementation of a bull call spread strategy with a potential return of 23.7% over a one-
year period.
Visa Inc. is a leading global payments technology company
operating in more than 200 countries. The company
operates the world’s largest payment processing network,
VisaNet, with a total transaction volume of $7.4T in 2014. .
It has approximately 11,300 employees and it’s based in the
US. CEO: Charles W. Scharf.
Financial analyst: Andrea Casati
Mail: andrea@sfpria.com
ANDREA CASATI STEVENS FIRST PRINCIPLES INVESTMENT ADVISORS
ɪɪ. INDUSTRY ANALYSIS
A- OVERVIEW
Companies in the payment card industry operate and manage the networks to handle electronic
transactions and payment processing and offer debit and credit card services. Major US-based players
include in order of total volume processed worldwide1
: Visa ($7.4T), MasterCard ($4.5), American Express
($1.1T) and Discover ($0.3T).
Industry revenues are primarily generated from the volume and the number of transactions processed on
the companies’ networks. According to Bloomberg, in 2014 the total transaction volume processed by the
major 4 payment networks2
amounted to $13.4T, up 8% over 2013 and 75% over 2009; 162.4 billion
transactions, up 11% over the previous year and 67% over 2009; 4,052 million cards active on the
networks, up 9% year-over-year and 41% over 2009.
Visa is the industry leader and the largest retail electronic payments network, according to all the three
measures mentioned above:
●Visa ●MasterCard ●American Express ●Discover
Even if cash still represents a significant component of consumer payment methods (26% of the US total
transactions in 20133
), the gradual migration to electronic payments is persistent. The trend is amplified
but the increasing importance of Ecommerce and consumer spending of millennials and post-millennials.
B-ECONOMIC ENVIRONMENT
The industry is facing three major challenges that could increase costs and reduce revenue opportunities:
increasing regulation, change in technology and uncertain macroeconomic conditions.
REGULATORY ENVIRONMENT
Visa and its competitors are facing increasing regulation all over the world. Moreover, there is a concrete
risk that any new law or regulation in a certain region may be replicated in another one. Failing to comply
with local and international requirements increase litigation risk and costs and may cause serious damages
to companies businesses.
1
Source: Bloomberg, 2014 data.
2
Visa, MasterCard, American Express, Discover. Chinese network UnionPay has not been included since it operates
under government-protected monopoly in China and it is not publicly listed.
3
Source: The 2013 Survey of Consumer Payment Choice, Federal Reserve Bank of Boston
0
2
4
6
8
2014 Total volume ($T)
0
25
50
75
100
2014 Total transactions(B)
0
500
1000
1500
2000
2500
2014 cards(M)
ANDREA CASATI STEVENS FIRST PRINCIPLES INVESTMENT ADVISORS
In the U.S. market the Fed, according to the Dodd-Frank Act (2011) has set a cap on the maximum debit
interchange reimbursement fee assessed for debit products issued by large financial institutions and limits
to issuers and network providers to impose rules for network exclusivity and preferred routing in the debit
and prepaid network market segments4
.
Certain jurisdictions outside the U.S. regulate the debit and credit interchange rates in their regions; i.e.
Australia, India, European Union.
Certain governments provide resources to or protection for their domestic payment card networks,
brands and processors4
; i.e. UnionPay in China, NSPK in Russia.
Other regulations include: data protection and privacy, internet, mobile payments, anti-money laundering,
anti-terrorism, government-imposed market restrictions.
TECHNOLOGY ENVIRONMENT
In the plastic card segment, Increasing demand for security following several data-breach scandals, has
driven in 2015 the shift from the ‘swipe and sign’ to ‘chip and pin’ (EMV) cards. The migration is still in
process. Another innovation is the development of NFC (near field communication) technology, related to
contactless card and mobile wallets (through host emulation card technology). Both the new technologies
require a payment infrastructure modernization.
Increasing importance of mobile wallets and payments. Global mobile payment transaction volume
amounted to $163.1B in 2012 and is expected have grown by 165% in 2015 and to grow by 343% by 20175
.
The proliferation of non-bank digital players like Google pay, Apple pay, Samsung pay and the market share
gain by Paypal are symptoms of the strong trend.
Increasing importance of P2P (person to person) payments. The U.S. value of mobile P2P payments in 2014
was $9B and is expected to have grown by 78% in 2015 and to grow by 856% by 20185
. Chase, the largest
card issuer in the US, launched clearXchange, a P2P network that is expanding to B2P payments (business
to person).
Mobile and P2P payments are potentially disruptive technologies and represent the hardest challenge
faced by the industry players. On the one hand it may represent a serious threat of disintermediation from
the payment value chain; on the other an opportunity to increase processed volume due to the further
migration away from paper-based payment instruments. The way payment companies will deal with the
new trend might drive their future success or failure.
MACROECONOMIC TRENDS
A strong U.S. dollar relative to the other major currencies has hurt the industry in terms of cross-board
revenues in 2015. A further appreciation of the dollar in 2016 would hinder the oversea revenues of the
U.S. based companies.
After a 25 bps increase in the federal fund rate in December 2015 meeting, the Fed is open to the
possibility of pursuing four further increases in the target rate. Even if improbable, a 100 bps increase in
4
Source: Visa Inc., 2015 10k
5
Source: Statista.com database.
ANDREA CASATI STEVENS FIRST PRINCIPLES INVESTMENT ADVISORS
the fed rate during 2016 would make card payment instruments less attractive and would reduce new
account originations. At the same time, it would make card products more remunerative for the financial
institutions clients.
A negative signal comes from the consumer spending growth rate. While U.S. consumer spending in 2015
still grew by 2.6%, it represents a slowdown with respect the 3.2% increase in 2014. Similar signals come
from Canada, Brazil, China and Middle East economies.
PORTER FIVE FORCES ANALYSIS
Threat of new entrants: HIGH. Even if the industry is characterized by strong economies of scale and the
current number of payment networks is limited , capital requirements and barriers to entry are low. New
payment solutions (i.e. Apple Pay) and competitors (i.e PayPal) currently use the ‘old’ payment
infrastructure, but technology like mobile and P2P payment,s are potentially disruptive, representing a
serious threat of disintermediation from the payment value chain for the industry established players. The
volume processed by these technologies is still low (but expected to increase exponentially). Visa is
currently active in all the new payment solutions and has strong brand recognition.
Threat of substitutes: HIGH. There are no switching costs for the different methods of payment. Moreover,
consumers tend to be price sensitive and try avoids any avoidable costs. Visa requires its financial
institutions clients to comply to a set a general rules aimed at not losing consumers’ acceptance.
Bargaining power of buyers: HIGH. Financial institutions are interested in maximizing their profit. Therefore
they will look for the lower service fee. Since processing marginal costs for the industry players are low,
they will try to win the customers’ preference by lowering the fees and/or offering incentives .Regulation
has further increased competition.
Bargaining power of suppliers: LOW. Visa suppliers are comprised by software, human resources, basic raw
materials and electronic chips. While the company develops a significant part of its software internally, the
other components can be considered commodities.
HIGH
ANDREA CASATI STEVENS FIRST PRINCIPLES INVESTMENT ADVISORS
Industry rivalry: LOW. At the current status, the number of companies operating in the industry is limited.
New disruptive technologies represent the hardest challenge faced by the industry players.
PORTER GENERIC ANALYSIS
Card payment industry competes on prices. Regulation and technology have further increased competition.
The service is facing a commoditization process. Revenues mostly depend on processed volume and
transactions. Processing marginal costs are low. Visa strong brand recognition (Visa is the 5th
most valuable
brand worldwide6
) allows the company to offer lower service fees and/or higher incentives, exploiting
economies of scale.
VALUE NET ANALYSIS
Customers: Visa customers are comprised by the financial institutions (directly), which issue the payment
products and with which the company negotiates service fees and incentives, and consumers, businesses
and governments (indirectly), that use the products and are charged by issuers, in compliance with Visa set
of general rules.
6
Source: Brandz-Top 100 most valuable global brands 2015, Millward Brown
ANDREA CASATI STEVENS FIRST PRINCIPLES INVESTMENT ADVISORS
Suppliers: Visa services mainly require software and human resources. Visa cards require basic raw
materials (mainly plastic) and electronic chips. The company develops significant of its software internally,
while the other components can be considered commodities.
Competitors: Visa competes globally against all forms of payment, including paper-based payments, other
payment networks (mainly MasterCard, American Express and Discover) and electronic payments (i.e.
mobile wallet and payments, wire transfers, ACH).
Complementors: Financial institutions (issuers) issue Visa card products to consumers and contract
(acquirers) with merchants to accept them. Physical (POS, mobile phones) and virtual (ecommerce
platforms, apps) payment infrastructure allows the payment initiation. Industry association, Governments,
regulators and PCI SSC7
set general rules for business conduct and security.
SUMMARY: Card payment industry is characterized by firms’ concentration and economies of scale.
Three major trends are challenging the industry players: increasing regulation, uncertain macroeconomic
conditions and most importantly new potentially disruptive technologies. Visa is the industry leader and
currently active in providing and developing the ‘new’ payment solutions.
7
Payment Card Industry Security Standards Council.
ANDREA CASATI STEVENS FIRST PRINCIPLES INVESTMENT ADVISORS
ɪɪɪ. COMPANY ANALYSIS
A- BUSINESS OVERVIEW
Visa Inc. is a U.S. based financial services corporation with headquarters in Foster City, California. The
company was founded in 1958 (as BankAmericard). The actual entity is the result of the merger of Visa
USA, Visa International, Visa Canada and Inovant. The European segment of the business, Visa Europe
Limited, constituted a separate company. Visa Inc went public in 2008.
Visa operates VisaNet, one of the world’s most advanced processing networks. The company is not a bank
and does not issue cards, extend credit or set rates and fees on for account holders on Visa-branded
products. Visa operates in more than 200 countries worldwide and earns revenues:
• facilitating authorization, clearing and settlement of payments worldwide;
• providing financial institutions with own-branded payment solutions (mostly credit, debit and
prepaid cards and Visa ATM network);
• offering fraud protection for account holders, risk management and rapid payment for merchant;
• offering ecommerce (Visa Checkout), P2P (Visa Direct), mobile (Visa payWave, mVisa) products and
services.
Visa strategy for the future comprises of:
• Increasing transactions volume through partnership with new clients, Visa has signed an exclusive
partnership with Costco and CitiGroup starting from April 2016, and reinforcing the relationship
with old ones.
• Increasing the mobile and internet payment solutions and volume. In addition to products and
services presented above, Visa recently launched Visa Commerce Network, a cross marketing
network for coupon-free digital rewards, aimed at increasing merchants’ sales volume and
customers’ loyalty.
• Increasing business volume through Visa Europe Limited acquisition. The deal, announced in
November 2015, is expected to be closed in the second half of 2016 fiscal year for a total purchase
price of €21.2B (€11.5B cash, €5B preferred stocks, €4.7B earn out).
B- DISCUSSION OF OPERATIONS
On January 28th
the company reported the 2016 fiscal year Q1 results8
: net revenues were $1,686M, up 7%
year-over-year and 11.5% over the previous quarter; diluted EPS was $0.69, up 10% year-over-year and
11.3% over the previous quarter.
In 2015 fiscal year the company reported $6,328M in net revenues, up 16.4% compared to $5,438M in
2014. Diluted EPS in 2015 was $2.62, up 15.4% compared to $2.27 in 2014.
2016 net revenues and EPS9
are expected to be $7,250M (up 14.6%) and $3.00 (up 14.5%) respectively.
8
Both net revenues and diluted EPS have been adjusted for non-recurring items.
9
Source: Valueline database.
ANDREA CASATI STEVENS FIRST PRINCIPLES INVESTMENT ADVISORS
According to the company annual report, Visa’s revenues are classified as:
• Service revenues: earned for providing financial institution clients with support services for the
delivery of Visa-branded payment products and solutions.
• Data processing revenues: earned for authorization, clearing, settlement, network access and other
support services that facilitates transaction and information processing globally.
• International transaction revenues: earned for cross-border transaction processing and currency
conversion activities.
• Other revenues: licenses fees for use of the Visa brand, revenues earned from Visa Europe, fees
from account holder services, certification and licensing, other activities related to acquired
entities.
• Moreover, the company reports client incentives, long-term contracts designed to build payments
volume, as a deduction to operating revenues, rather than as part of operating expenses.
Operating revenues were up 9.3% in 2015 f.y. and 5% in 2016 f.y. Q1 year-over-year.
% of operating revenues10
by segment (and client incentives incidence) and % year-over-year change are
reported in the figures below:
Visa revenues are divided in 3 main geographic areas: United States, International and Visa Europe11
.
% of operating revenues by geographic area and % year-over-year change are reported in the figures
below:
10
Nominal amounts.
11
Revenues resulting from contractual arrangement with Visa Europe Limited, as governed by the Framework
Agreement.
38%
34%
23%
5%
-17%
38%
33%
24%
5%
-17%
-20%
-10%
0%
10%
20%
30%
40%
50%
2014 2015
+9%
+7%
+14%
+7%
+10%
Service Data
proc.
Intl. Other
Client
incentives
38%
34%
24%
5%
-17%
38%
34%
24%
5%
-18%
-20%
-10%
0%
10%
20%
30%
40%
50%
2015 FY Q1 2016 FY Q1
+7%
+11%
-3%
+6%
+7%
Data
proc.
Service Intl. Other
Client
incentives
54%
44%
2%
53%
45%
2%
0%
10%
20%
30%
40%
50%
60%
USA International Visa Europe
2014 2015
+8%
+10%
+13%
53%
46%
2%
54%
44%
2%
0%
10%
20%
30%
40%
50%
60%
USA International Visa Europe
2015 FY Q1 2016 FY Q1
+9%
+1%
+20%
ANDREA CASATI STEVENS FIRST PRINCIPLES INVESTMENT ADVISORS
Operating expenses increased by 6% in 2015 year-over-year (compared to a +9% in revenues). The increase
was mainly driven by higher personnel and depreciation expenses aimed at internal technology growth.
The 2% operating expenses increase in 2016 Q1 (compared to a +5% in revenues) was mainly driven due
fees related to domestic transactions in Russia area and currency losses.
% of tot revenues
Year-over-year %
increase
$ Millions
2014 2015 16Q1 2014 2015 16Q1 2014 2015 16Q1
Revenues 100% 100% 100% 8% 9% 5% 12,702 13,880 3,565
Operating expenses 36% 35% 33% 0% 6% 2% 4,555 4,816 1,169
Personnel 15% 15% 14% -3% 11% -2% 1,875 2,079 499
Marketing 7% 6% 5% 3% -3% -5% 900 872 194
Network and processing 4% 3% 4% 8% -7% 12% 507 474 128
Professional fees 3% 2% 2% -20% 2% 3% 328 336 72
Depreciation and amortization 3% 4% 3% 10% 14% 0% 435 494 120
General and administrative 4% 4% 4% 12% 8% 24% 507 547 156
Litigation provision 0% 0% 0% 0% 367% - 312
14 0
In 201513
Visa processed $7.4B nominal payments volume, experiencing a constant-dollar basis growth of
10%: 12% payment volume growth (consumer debit and credit up both 12%), 8% cash volume growth.
According to the company most recent 10Q, the positive trend was persistent in the 2015 Q4. Nominal
payments volume constant-dollar basis growth rate was 10%: 12% payment volume growth (consumer
debit up 10%, credit 14%), 5% cash volume growth.
CAPITAL STRUCTURE
Visa has been historically 100% equity financed. The company had 3 class of common shares outstanding:
Class A14
, Class B (each convertible in 1.6 Class A, conversion limited until the complete U.S. covered
litigation resolution and Class C common shares.
In Q1 of 2016 fiscal year, Visa issued $16B in LTD authorized the creation of three types of preferred stocks
in relation to the acquisition of Visa Europe, expected to be finalized in the second half of the year.
12
It does not include $450M non-recurring item.
13
12-month period ending
14
In January 2015, Visa’s board of directors declared a four-one-four split of its class A common stock.
ANDREA CASATI STEVENS FIRST PRINCIPLES INVESTMENT ADVISORS
RATIO ANALYSIS15
American
Express (AXP)
Discover
(DFS)
MasterCard
(MA)
Peer group
avr.
Visa (V)
LIQUIDITY
Current ratio - - 1.77 1.77 2.03
Quick ratio - - 1.36 1.36 1.37
CFO/curr. liabilities - - 0.55 0.55 1.23
SOLVENCY
Tot liabilities/Tot assets 0.87 0.87 0.56 0.77 0.4616
LTD to Equity 2.80 2.03 0.22 1.68 0.54
Interest coverage 20.9 6.7 106.8 44.8 91
EFFICIENCY
Op income/volume proc. - - 1.21 1.21 1.29
Asset turnover 0.22 0.1 0.64 0.32 0.35
PROFITABILITY
Operating margin 26.2% 43.6% 57.3% 34.9% 68.9%
Net profit margin 17.2% 26.8% 38.2% 22.0% 39.8%
ROE 29.3% 21.8% 53.3% 29.3% 21.2%
RoTC - - 44.0% 44.0% 21.2%
LIQUIDITY
($MILL.)
2014 2015 % Δ
5-year
average
2015 Q1 2016 Q1 % Δ
Cash And Cash Equivalents 1,971 3,518 78.5% 3,518 12,837 264.9%
Receivables 822 847 3.0% 847 992 17.1%
Other Current Assets 6,769 6,527 -3.6% 5,656 11,644 105.9%
Total Current Assets 9,562 10,892 13.9% 10,021 25,473 154.2%
Accounts payable 147 127 -13.6% 127 118 -7.1%
Other Current Liabilities 5,859 5,247 -10.4% 5,228 5,239 0.2%
Total current liabilities 6,006 5,374 -10.5% 5,355 5,357 0.0%
CF from operations 7,205 6,584 -8.6% 1,761 1,979 12.4%
Current ratio 1.59 2.03 27.3% 1.91 1.87 4.76 154.1%
Quick ratio 1.10 1.37 24.5% 1.17 1.37 4.24 209.5%
CFO/current liabilities 1.20 1.23 2.1% 0.97 0.33 0.37 12.3%
Visa presents a strong liquidity position. In 2015 Visa current and quick ratio were equal to 2.03 and 1.37
(up 27.3% and 24.5% year-over-year) respectively, higher than both the 5-year average (1.91 and 1.17) and
its main competitor (MasterCard 1.77 and 1.36).
In 2015 current assets and current liabilities represented 27.1% and 13.4% of total assets respectively
(24.8% and 15.6% in 2014).
15
In addition to operating their payment networks, American Express and Discover act also like banks, issuing cards
and setting service fees directly with consumers. Therefore, the results might be not fully comparable.
16
2016 f. y. Q1 data.
ANDREA CASATI STEVENS FIRST PRINCIPLES INVESTMENT ADVISORS
Cash flow from operations over current liabilities was 1.23 in 2015 (up from 1.20 in 2014), higher than the
5-year average (0.97) and strongly higher than its main competitor (0.55).
The higher ratios reported in the first quarter of 2016 f. y. reflect the issue of $16B senior notes aimed at
the acquisition of Visa Europe Limited. The proceeds of the issue are temporarily held in cash and short-
term investments.
Accordingly to Visa 2015 annual report, a substantial portion of the company’s cash, cash equivalents and
investment securities ($7B) is held by international subsidiaries outside of the U.S. and the company would
be required to pay taxes of the undistributed profits in the case of repatriation. Moreover, Visa maintains a
litigation escrow account ($1.1B) to cover possible future U.S. litigation.
Further source of liquidity for Visa are represented by a commercial paper program (up to $3B) and the
renewal in 2016 Q1 of its credit facility (up to $4B).
SOLVENCY
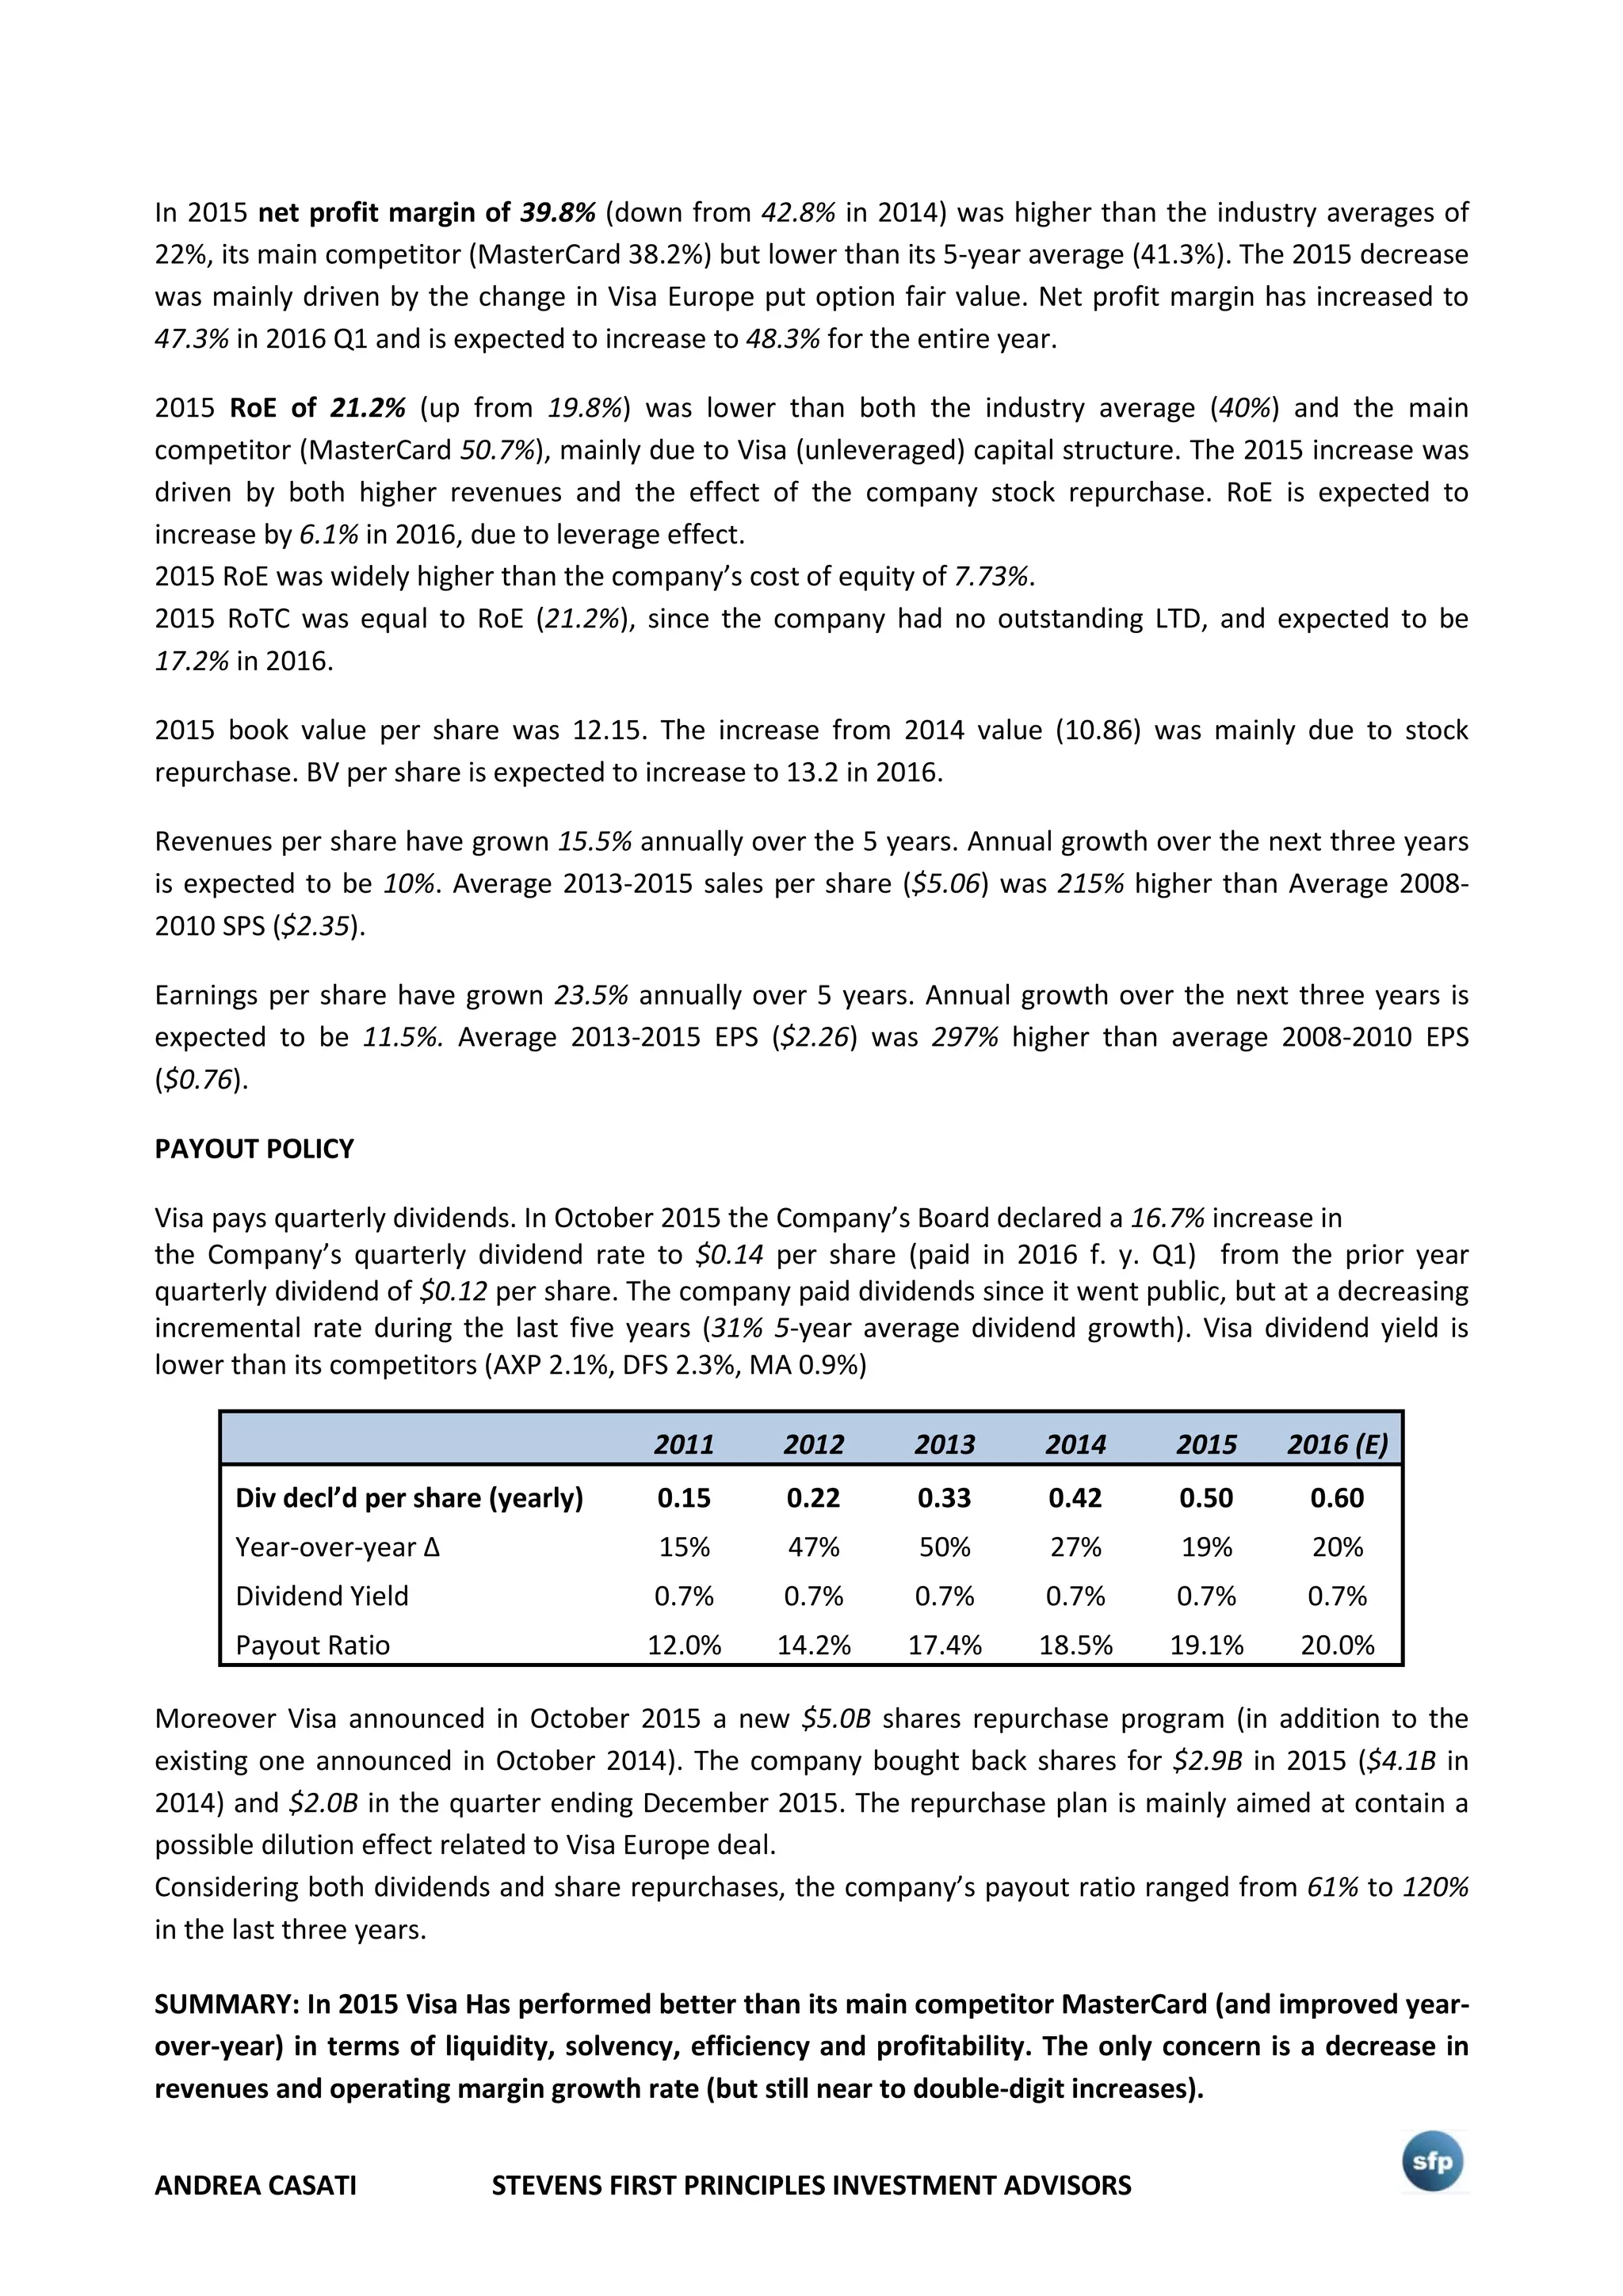
($MILL.) 2015 2016 Q1 % Δ Est 2016 % Δ
Total liabilities 10,394 25,501 145.3%
Total assets 40,236 54,977 36.6%
Long term debt - 15,877 100.0% 10,000 100%
Shareholders’ equity 29,842 29,476 -1.2% 32,000 6.7%
LTD due in 5 years 4,731
Tot Op. lease commitments 392
EBIT 8,995 2,639 18.0%17
9300 3.4%
Interest exp - 29 484.5
Tot liabilities/Tot Assets 0.26 0.46 79.6%
LTD to Equity NA 0.54 100.0% 0.31 100.0%
Interest coverage NA 91.0 100.0% 19.2 100.0%
Visa has been historically unleveraged. In the first quarter of 2016 f. y. the company issued $16B in long-
term debt (with maturities ranging from to 2 to 30 years) to finance the acquisition of Visa Europe,
expected to be finalized in the second half of the year.
In 2016 f. y. Q1 total liabilities represented 46% of total assets, up from 26% in 2015; the ratio is lower
than both the peer group average (77%) and its main competitor (56%).
In 2016 f. y. Q1 LTD to Equity ratio was equal to 0.54 (no LTD in 2015) and expected to be 0.31 for the
entire year; the ratio is lower than the peer group average (1.68) but higher than its main competitor
(0.22). $4.7B18
of LTD is due in 5 years.
In 2016 f. y. Q1 interest coverage was 91 and expected to be 19.2 for the entire year (not taking into
account the possible effects of Visa Europe acquisition on EBIT). The ratio is higher than the peer group
average (44.8) and but lower than its main competitor (106.8).
17
Year-over-year change
18
Amount subject to the closing of Visa Europe deal.
ANDREA CASATI STEVENS FIRST PRINCIPLES INVESTMENT ADVISORS
According to 2015 10K, Visa presents total operating lease commitments of $392M ($95M due in 2016).
Moreover the company is committed to $1.1B in purchase order ($855M due in 2016), $654M marketing
and sponsorship agreements ($112M due in 2016) and $17.4B in client incentives agreements19
($3.9B due
in 2016).
EFFICIENCY
($BILL.) 2014 2015 % Δ
Processed volume 7,158.0 7,392.0 3.3%
Avg Tot Assets 37,262.5 39,402.5 5.7%
Revenues 12,702.0 13,880.0 9.3%
Operating income 7,697.0 9,064.0 17.8%
Op income/Volume proc. 1.08 1.29 19.7%
Asset turnover 0.34 0.35 3.3%
Visa experienced a strong improvement in its efficiency position in 2015 over the previous year in terms of
operating income on processed volume measure. The ratio of 1.29 increased by 20% year-over-year, and
higher than its main competitor (1.21). Asset turnover was 0.35, up 3.3% but lower than MasterCard (0.64).
PROFITABILITY
2014 2015
14-15
%Δ
2016 Q1 %Δ20 Est
2016
% Δ
Revenues ($Mill.) 12,702 13,880 9.3% 1,686 7.0% 15,000 8.1%
EPS 2.27 2.62 15.4% 0.69 10.0% 3.00 14.5%
Operating margin 64% 68.9% 7.7% 67.2% 1.6% 65% -5.7%
Profit margin 42.8% 39.8% -7.0% 47.3% 1.9% 48.3% 21.4%
ROE 19.8% 21.2% 7.1% 5.7% 1.2% 22.5% 6.1%
Return on total capital 19.8% 21.2% 7.1% 3.7% -34.6% 17.5% -17.5%
Book value per share 10.86 12.15 11.9% 12.23 12.6% 13.2 8.6%
Cost of equity 7.73%
Annual rates of Δ per
share
Past 10
years
Past 5
years
Est'd '12-
'14 to
'18-'20
Revenues - 15.5% 10.0%
Earnings - 23.5% 11.5%
Visa presents a good profitability position. In 2015 operating margin of 68.9% (64% in 2014) was higher
than the industry average (34.9%), its main competitor (MasterCard 57.3%) and its 5-year average (64.7%).
The 2015 increase was driven by a revenue growth rate higher than the operating expenses one. Operating
margin has decreased to 67.2% in 2016 Q1 and is expected to decrease to 65% for the entire year, driven
by the tightening of the growth rate differential between revenues and op. expenses.
19
Payments under these agreements are generally offset by revenues earned from higher business volume.
20
Year-over-year change.
ANDREA CASATI STEVENS FIRST PRINCIPLES INVESTMENT ADVISORS
In 2015 net profit margin of 39.8% (down from 42.8% in 2014) was higher than the industry averages of
22%, its main competitor (MasterCard 38.2%) but lower than its 5-year average (41.3%). The 2015 decrease
was mainly driven by the change in Visa Europe put option fair value. Net profit margin has increased to
47.3% in 2016 Q1 and is expected to increase to 48.3% for the entire year.
2015 RoE of 21.2% (up from 19.8%) was lower than both the industry average (40%) and the main
competitor (MasterCard 50.7%), mainly due to Visa (unleveraged) capital structure. The 2015 increase was
driven by both higher revenues and the effect of the company stock repurchase. RoE is expected to
increase by 6.1% in 2016, due to leverage effect.
2015 RoE was widely higher than the company’s cost of equity of 7.73%.
2015 RoTC was equal to RoE (21.2%), since the company had no outstanding LTD, and expected to be
17.2% in 2016.
2015 book value per share was 12.15. The increase from 2014 value (10.86) was mainly due to stock
repurchase. BV per share is expected to increase to 13.2 in 2016.
Revenues per share have grown 15.5% annually over the 5 years. Annual growth over the next three years
is expected to be 10%. Average 2013-2015 sales per share ($5.06) was 215% higher than Average 2008-
2010 SPS ($2.35).
Earnings per share have grown 23.5% annually over 5 years. Annual growth over the next three years is
expected to be 11.5%. Average 2013-2015 EPS ($2.26) was 297% higher than average 2008-2010 EPS
($0.76).
PAYOUT POLICY
Visa pays quarterly dividends. In October 2015 the Company’s Board declared a 16.7% increase in
the Company’s quarterly dividend rate to $0.14 per share (paid in 2016 f. y. Q1) from the prior year
quarterly dividend of $0.12 per share. The company paid dividends since it went public, but at a decreasing
incremental rate during the last five years (31% 5-year average dividend growth). Visa dividend yield is
lower than its competitors (AXP 2.1%, DFS 2.3%, MA 0.9%)
2011 2012 2013 2014 2015 2016 (E)
Div decl’d per share (yearly) 0.15 0.22 0.33 0.42 0.50 0.60
Year-over-year Δ 15% 47% 50% 27% 19% 20%
Dividend Yield 0.7% 0.7% 0.7% 0.7% 0.7% 0.7%
Payout Ratio 12.0% 14.2% 17.4% 18.5% 19.1% 20.0%
Moreover Visa announced in October 2015 a new $5.0B shares repurchase program (in addition to the
existing one announced in October 2014). The company bought back shares for $2.9B in 2015 ($4.1B in
2014) and $2.0B in the quarter ending December 2015. The repurchase plan is mainly aimed at contain a
possible dilution effect related to Visa Europe deal.
Considering both dividends and share repurchases, the company’s payout ratio ranged from 61% to 120%
in the last three years.
SUMMARY: In 2015 Visa Has performed better than its main competitor MasterCard (and improved year-
over-year) in terms of liquidity, solvency, efficiency and profitability. The only concern is a decrease in
revenues and operating margin growth rate (but still near to double-digit increases).
ANDREA CASATI STEVENS FIRST PRINCIPLES INVESTMENT ADVISORS
ɪv. COMPANY ANALYSIS
GRAHAM FORMULA
Intrinsic value = EPS * (8.5 * 2g)* (4.4 / y)21
Estimated 2016 EPS = $3.00
AAA bond rate = 5%
Est g 120% 100% 80%
5.5% 61.78 51.48 41.18
7.5% 74.45 62.04 49.63
9.5% 87.12 72.60 58.08
11.5% 99.79 83.16 66.53
13.5% 112.46 93.72 74.98
15.5% 125.14 104.28 83.42
17.5% 137.81 114.84 91.87
According to Graham formula, Visa intrinsic value is equal to $83.16.
BULL CALL SPREAD STRATEGY:
Long position: call, strike price= $80, expiration date: Jan 20 2017 Ask price=$5.15
Short position: call, strike price= $82.5, expiration date: Jan 20 2017 Last price= $3.80
Cost of the strategy = 5.15-3.80= $1.35
Profit potential = 12.62 -10.95= $1.67
In percentage terms= (1.67-1.35)/1.35= 23.7%
21
Where g = est. earnings growth rate and y = AAA bond rate
ANDREA CASATI STEVENS FIRST PRINCIPLES INVESTMENT ADVISORS
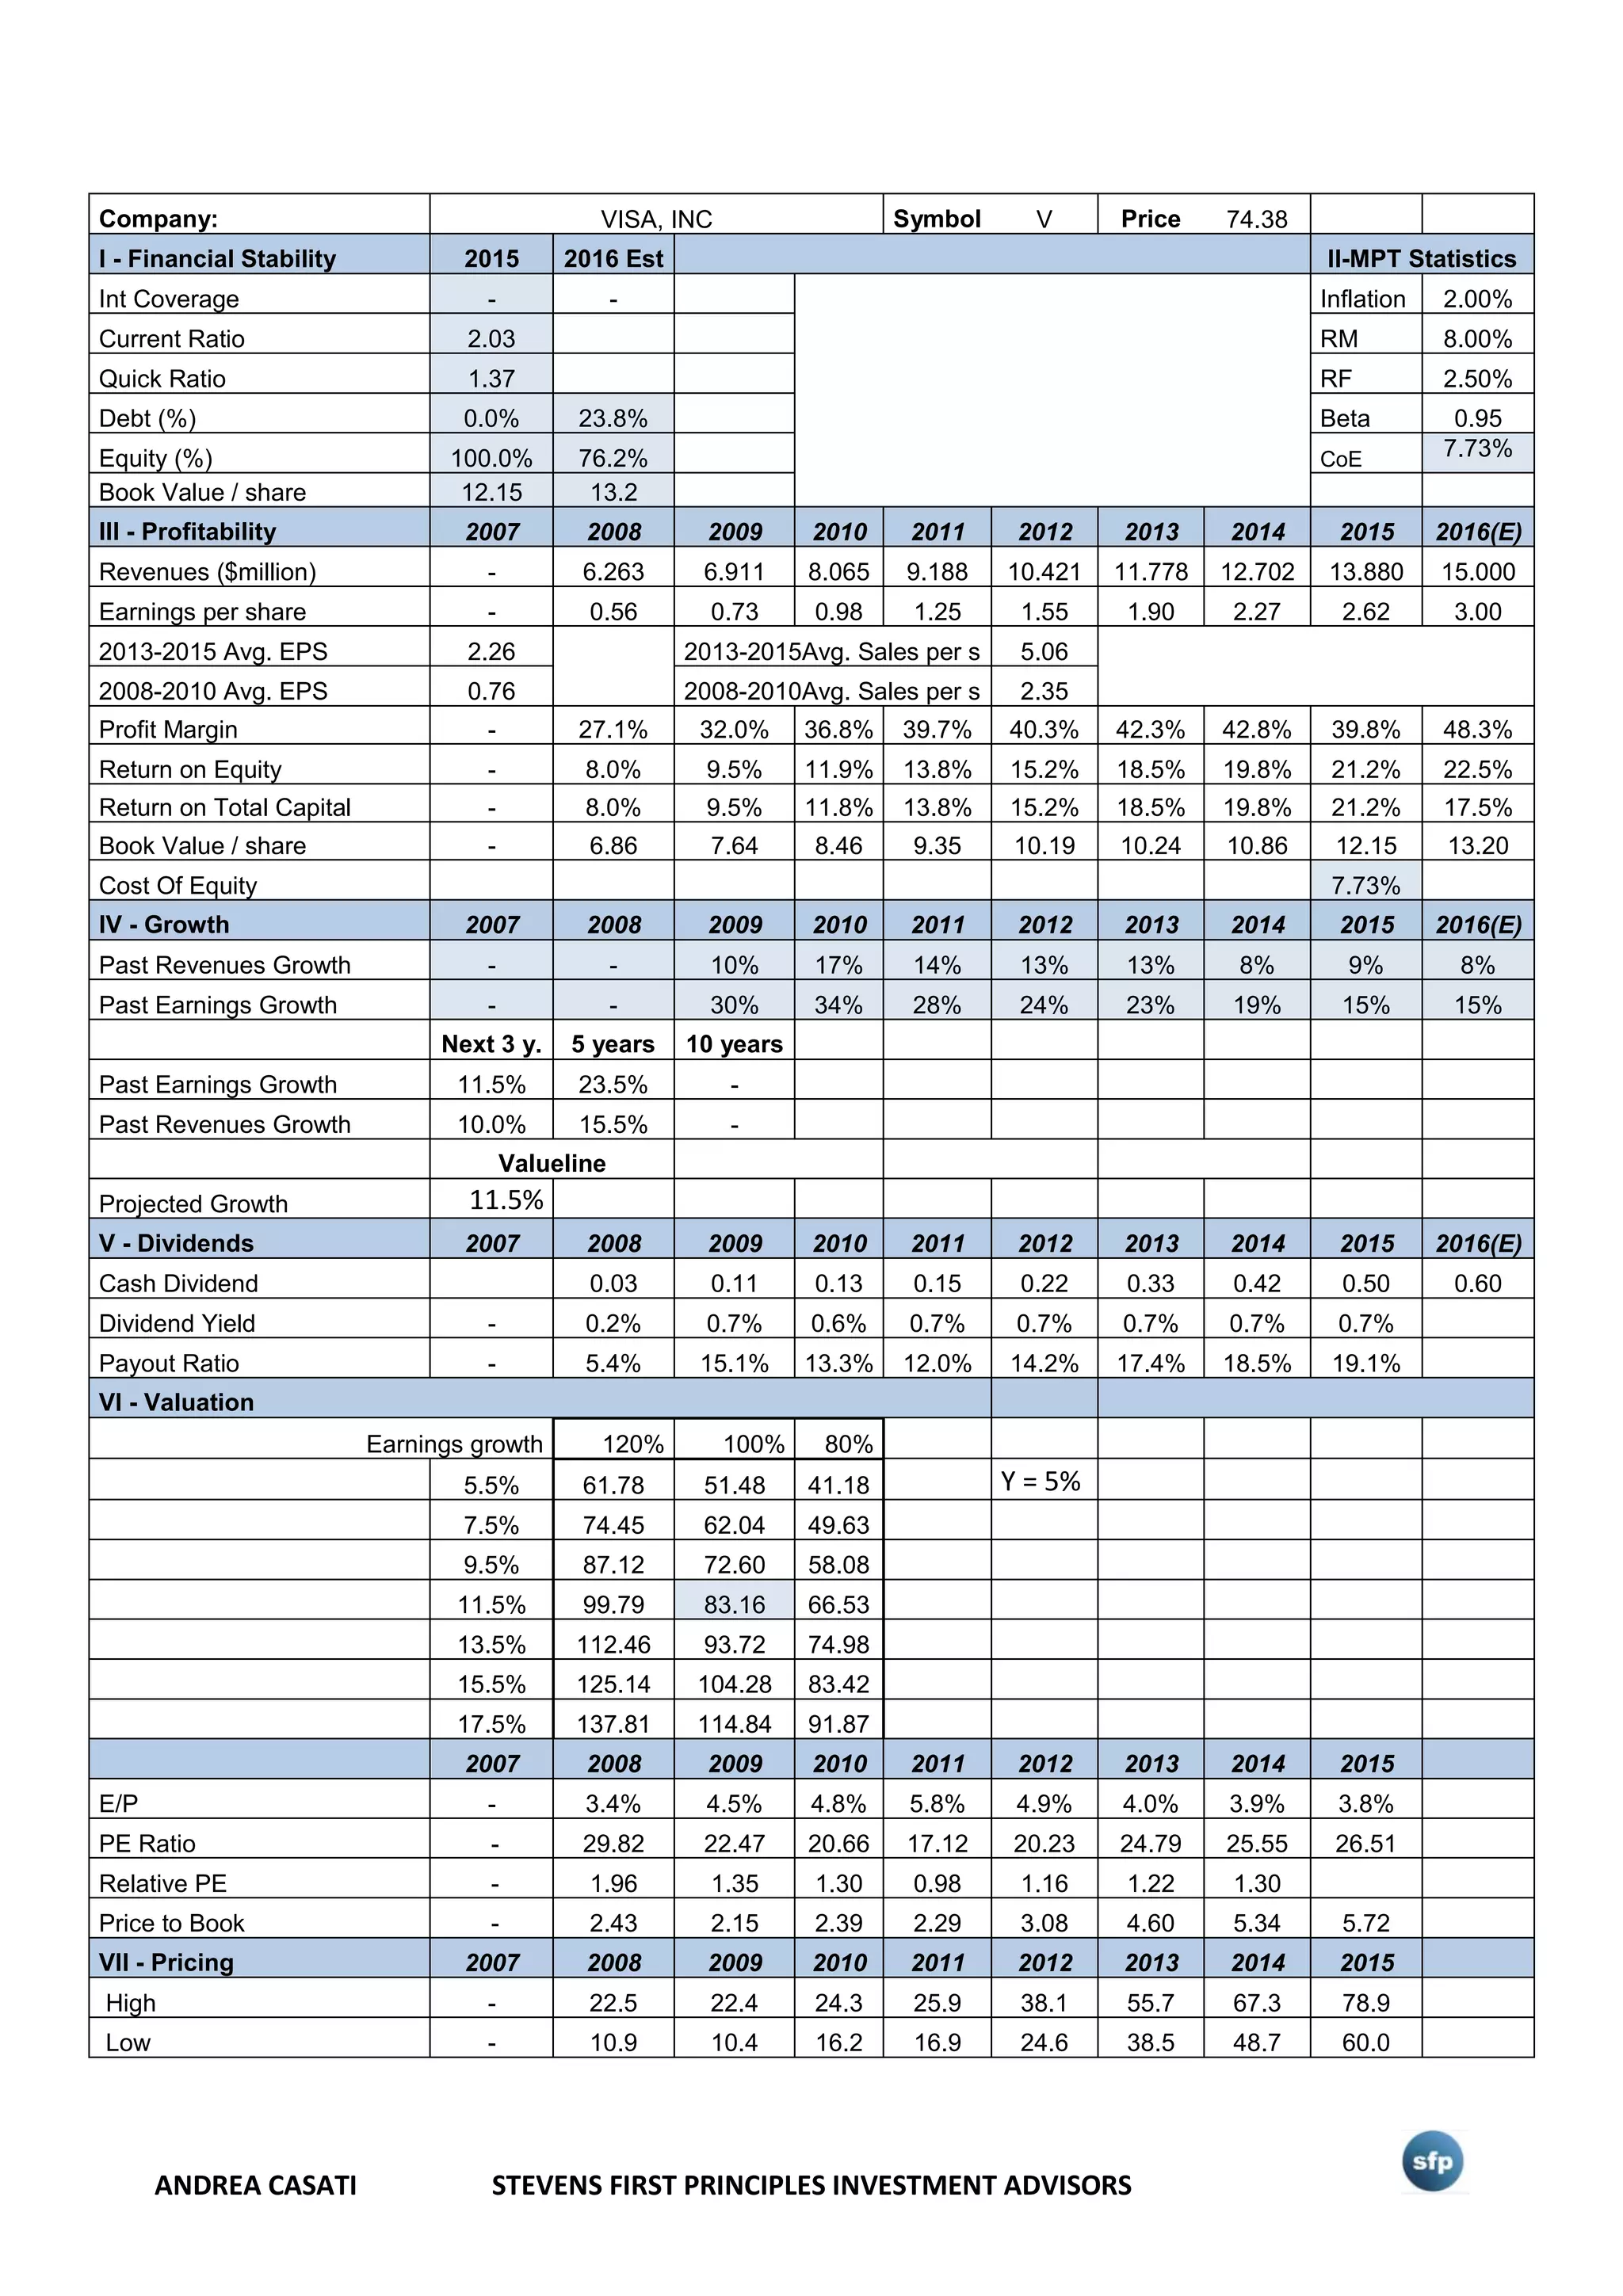
Company: VISA, INC Symbol V Price 74.38
I - Financial Stability 2015 2016 Est II-MPT Statistics
Int Coverage - - Inflation 2.00%
Current Ratio 2.03 RM 8.00%
Quick Ratio 1.37 RF 2.50%
Debt (%) 0.0% 23.8% Beta 0.95
Equity (%) 100.0% 76.2% CoE 7.73%
Book Value / share 12.15 13.2
III - Profitability 2007 2008 2009 2010 2011 2012 2013 2014 2015 2016(E)
Revenues ($million) - 6.263 6.911 8.065 9.188 10.421 11.778 12.702 13.880 15.000
Earnings per share - 0.56 0.73 0.98 1.25 1.55 1.90 2.27 2.62 3.00
2013-2015 Avg. EPS 2.26 2013-2015Avg. Sales per s 5.06
2008-2010 Avg. EPS 0.76 2008-2010Avg. Sales per s 2.35
Profit Margin - 27.1% 32.0% 36.8% 39.7% 40.3% 42.3% 42.8% 39.8% 48.3%
Return on Equity - 8.0% 9.5% 11.9% 13.8% 15.2% 18.5% 19.8% 21.2% 22.5%
Return on Total Capital - 8.0% 9.5% 11.8% 13.8% 15.2% 18.5% 19.8% 21.2% 17.5%
Book Value / share - 6.86 7.64 8.46 9.35 10.19 10.24 10.86 12.15 13.20
Cost Of Equity 7.73%
IV - Growth 2007 2008 2009 2010 2011 2012 2013 2014 2015 2016(E)
Past Revenues Growth - - 10% 17% 14% 13% 13% 8% 9% 8%
Past Earnings Growth - - 30% 34% 28% 24% 23% 19% 15% 15%
Next 3 y. 5 years 10 years
Past Earnings Growth 11.5% 23.5% -
Past Revenues Growth 10.0% 15.5% -
Valueline
Projected Growth 11.5%
V - Dividends 2007 2008 2009 2010 2011 2012 2013 2014 2015 2016(E)
Cash Dividend 0.03 0.11 0.13 0.15 0.22 0.33 0.42 0.50 0.60
Dividend Yield - 0.2% 0.7% 0.6% 0.7% 0.7% 0.7% 0.7% 0.7%
Payout Ratio - 5.4% 15.1% 13.3% 12.0% 14.2% 17.4% 18.5% 19.1%
VI - Valuation
Earnings growth 120% 100% 80%
5.5% 61.78 51.48 41.18 Y = 5%
7.5% 74.45 62.04 49.63
9.5% 87.12 72.60 58.08
11.5% 99.79 83.16 66.53
13.5% 112.46 93.72 74.98
15.5% 125.14 104.28 83.42
17.5% 137.81 114.84 91.87
2007 2008 2009 2010 2011 2012 2013 2014 2015
E/P - 3.4% 4.5% 4.8% 5.8% 4.9% 4.0% 3.9% 3.8%
PE Ratio - 29.82 22.47 20.66 17.12 20.23 24.79 25.55 26.51
Relative PE - 1.96 1.35 1.30 0.98 1.16 1.22 1.30
Price to Book - 2.43 2.15 2.39 2.29 3.08 4.60 5.34 5.72
VII - Pricing 2007 2008 2009 2010 2011 2012 2013 2014 2015
High - 22.5 22.4 24.3 25.9 38.1 55.7 67.3 78.9
Low - 10.9 10.4 16.2 16.9 24.6 38.5 48.7 60.0

More Related Content

What's hot

Nestlé the infant formular controversy
Nestlé the infant formular controversyNestlé the infant formular controversy
Nestlé the infant formular controversyEric Nhan Le
 
Case Study Presentation on Alibaba
Case Study Presentation on AlibabaCase Study Presentation on Alibaba
Case Study Presentation on AlibabaAashish Bende
 
International entrepreneurship - 2 - Born Global
International entrepreneurship - 2 - Born GlobalInternational entrepreneurship - 2 - Born Global
International entrepreneurship - 2 - Born GlobalJoseph Ho
 
IKEA: Furniture Retailer To The World
IKEA: Furniture Retailer To The WorldIKEA: Furniture Retailer To The World
IKEA: Furniture Retailer To The Worldkuszczakowski
 
Uber technologies, Inc. Business analysis
Uber technologies, Inc. Business analysisUber technologies, Inc. Business analysis
Uber technologies, Inc. Business analysisOmar Khafagy
 
Chapter 21 - Tapping into Global Markets
Chapter 21 - Tapping into Global MarketsChapter 21 - Tapping into Global Markets
Chapter 21 - Tapping into Global MarketsJoy Agra-Villacorta
 
Dove Whitenening Deodrant- Brand Extension
Dove Whitenening Deodrant- Brand ExtensionDove Whitenening Deodrant- Brand Extension
Dove Whitenening Deodrant- Brand ExtensionSameer Mathur
 
Surf excel & ariel IMC matrix
Surf excel & ariel IMC matrixSurf excel & ariel IMC matrix
Surf excel & ariel IMC matrixJunaid Ali Kazmi
 
Uber presentation final
Uber presentation finalUber presentation final
Uber presentation finalSkylar Dann
 
Success of wal mart
Success of wal martSuccess of wal mart
Success of wal martTalha Ali
 
Taobao vs. eBay - The battle within the Chinese eCommerce market
Taobao vs. eBay - The battle within the Chinese eCommerce marketTaobao vs. eBay - The battle within the Chinese eCommerce market
Taobao vs. eBay - The battle within the Chinese eCommerce marketYannick Pinkinelli
 
Quikrr swot analysis
Quikrr swot analysisQuikrr swot analysis
Quikrr swot analysisAftab Khatri
 

What's hot (20)

Nestlé the infant formular controversy
Nestlé the infant formular controversyNestlé the infant formular controversy
Nestlé the infant formular controversy
 
Case Study Presentation on Alibaba
Case Study Presentation on AlibabaCase Study Presentation on Alibaba
Case Study Presentation on Alibaba
 
Apple
AppleApple
Apple
 
International entrepreneurship - 2 - Born Global
International entrepreneurship - 2 - Born GlobalInternational entrepreneurship - 2 - Born Global
International entrepreneurship - 2 - Born Global
 
IKEA: Furniture Retailer To The World
IKEA: Furniture Retailer To The WorldIKEA: Furniture Retailer To The World
IKEA: Furniture Retailer To The World
 
Uber technologies, Inc. Business analysis
Uber technologies, Inc. Business analysisUber technologies, Inc. Business analysis
Uber technologies, Inc. Business analysis
 
Chapter 21 - Tapping into Global Markets
Chapter 21 - Tapping into Global MarketsChapter 21 - Tapping into Global Markets
Chapter 21 - Tapping into Global Markets
 
Ecommerce daraz
Ecommerce darazEcommerce daraz
Ecommerce daraz
 
Dove Whitenening Deodrant- Brand Extension
Dove Whitenening Deodrant- Brand ExtensionDove Whitenening Deodrant- Brand Extension
Dove Whitenening Deodrant- Brand Extension
 
Ebay presentation
Ebay presentationEbay presentation
Ebay presentation
 
Surf excel & ariel IMC matrix
Surf excel & ariel IMC matrixSurf excel & ariel IMC matrix
Surf excel & ariel IMC matrix
 
Uber presentation final
Uber presentation finalUber presentation final
Uber presentation final
 
Success of wal mart
Success of wal martSuccess of wal mart
Success of wal mart
 
Unilever Personal Marketing(Axe & Dove)
Unilever Personal Marketing(Axe & Dove)Unilever Personal Marketing(Axe & Dove)
Unilever Personal Marketing(Axe & Dove)
 
Airbnb Strategic Analysis
Airbnb Strategic Analysis Airbnb Strategic Analysis
Airbnb Strategic Analysis
 
eBay
eBay eBay
eBay
 
Dell and apple
Dell and appleDell and apple
Dell and apple
 
Unilever Case Study
Unilever Case StudyUnilever Case Study
Unilever Case Study
 
Taobao vs. eBay - The battle within the Chinese eCommerce market
Taobao vs. eBay - The battle within the Chinese eCommerce marketTaobao vs. eBay - The battle within the Chinese eCommerce market
Taobao vs. eBay - The battle within the Chinese eCommerce market
 
Quikrr swot analysis
Quikrr swot analysisQuikrr swot analysis
Quikrr swot analysis
 

Similar to Visa report 02.04.16

Brief for Transaction Processing Industry
Brief for Transaction Processing IndustryBrief for Transaction Processing Industry
Brief for Transaction Processing IndustryBerkeley Teate
 
TMT SA Presentation
TMT SA PresentationTMT SA Presentation
TMT SA PresentationCole Secor
 
Data Fraud Analytics Industry
Data Fraud Analytics Industry Data Fraud Analytics Industry
Data Fraud Analytics Industry Cole Secor
 
Visa Stock Analysis Report
Visa Stock Analysis ReportVisa Stock Analysis Report
Visa Stock Analysis ReportTrè Cotton
 
September-2012-Navigator
September-2012-NavigatorSeptember-2012-Navigator
September-2012-NavigatorNirnay K. Sinha
 
The Future of Payments: Next-Gen Payment Processing Technologies
The Future of Payments: Next-Gen Payment Processing TechnologiesThe Future of Payments: Next-Gen Payment Processing Technologies
The Future of Payments: Next-Gen Payment Processing TechnologiesDustin Lichey, PRM
 
Banking Disruption in Financial Services: Threats and Opportunities
Banking Disruption in Financial Services: Threats and OpportunitiesBanking Disruption in Financial Services: Threats and Opportunities
Banking Disruption in Financial Services: Threats and OpportunitiesDogTelligent
 
Industry Final
Industry FinalIndustry Final
Industry FinalSam Atari
 
Remittance business analysis from US to China
Remittance business analysis from US to ChinaRemittance business analysis from US to China
Remittance business analysis from US to ChinaKunal Maniyar
 
Secure Payments: How Card Issuers and Merchants Can Stay Ahead of Fraudsters
Secure Payments: How Card Issuers and Merchants Can Stay Ahead of FraudstersSecure Payments: How Card Issuers and Merchants Can Stay Ahead of Fraudsters
Secure Payments: How Card Issuers and Merchants Can Stay Ahead of FraudstersCognizant
 
Future of South East Asia Digital Financial Service
Future of South East Asia Digital Financial ServiceFuture of South East Asia Digital Financial Service
Future of South East Asia Digital Financial ServiceTrnHoQuang1
 
Most promising current and future payment technologies | SG Analytics
Most promising current and future payment technologies | SG AnalyticsMost promising current and future payment technologies | SG Analytics
Most promising current and future payment technologies | SG AnalyticsSG Analytics
 
Leveraging Analytics to Combat Digital Fraud in Financial Organizations
Leveraging Analytics to Combat Digital Fraud in Financial OrganizationsLeveraging Analytics to Combat Digital Fraud in Financial Organizations
Leveraging Analytics to Combat Digital Fraud in Financial OrganizationsRicardo Ponce
 
UK Business Payments Barometer
UK Business Payments BarometerUK Business Payments Barometer
UK Business Payments BarometerJacqui Powell
 

Similar to Visa report 02.04.16 (20)

Credit Card Business Plan
Credit Card Business PlanCredit Card Business Plan
Credit Card Business Plan
 
Brief for Transaction Processing Industry
Brief for Transaction Processing IndustryBrief for Transaction Processing Industry
Brief for Transaction Processing Industry
 
TMT SA Presentation
TMT SA PresentationTMT SA Presentation
TMT SA Presentation
 
Data Fraud Analytics Industry
Data Fraud Analytics Industry Data Fraud Analytics Industry
Data Fraud Analytics Industry
 
Visa Stock Analysis Report
Visa Stock Analysis ReportVisa Stock Analysis Report
Visa Stock Analysis Report
 
Global Payments Research Report
Global Payments Research Report Global Payments Research Report
Global Payments Research Report
 
September-2012-Navigator
September-2012-NavigatorSeptember-2012-Navigator
September-2012-Navigator
 
The Future of Payments: Next-Gen Payment Processing Technologies
The Future of Payments: Next-Gen Payment Processing TechnologiesThe Future of Payments: Next-Gen Payment Processing Technologies
The Future of Payments: Next-Gen Payment Processing Technologies
 
Banking Disruption in Financial Services: Threats and Opportunities
Banking Disruption in Financial Services: Threats and OpportunitiesBanking Disruption in Financial Services: Threats and Opportunities
Banking Disruption in Financial Services: Threats and Opportunities
 
Upload.pptx
Upload.pptxUpload.pptx
Upload.pptx
 
Retail Banking: In tech we trust
Retail Banking: In tech we trustRetail Banking: In tech we trust
Retail Banking: In tech we trust
 
Industry Final
Industry FinalIndustry Final
Industry Final
 
Remittance business analysis from US to China
Remittance business analysis from US to ChinaRemittance business analysis from US to China
Remittance business analysis from US to China
 
Why the Banking Industry Needs $600 Billion Worth of M&A
Why the Banking Industry Needs $600 Billion Worth of M&AWhy the Banking Industry Needs $600 Billion Worth of M&A
Why the Banking Industry Needs $600 Billion Worth of M&A
 
Secure Payments: How Card Issuers and Merchants Can Stay Ahead of Fraudsters
Secure Payments: How Card Issuers and Merchants Can Stay Ahead of FraudstersSecure Payments: How Card Issuers and Merchants Can Stay Ahead of Fraudsters
Secure Payments: How Card Issuers and Merchants Can Stay Ahead of Fraudsters
 
Future of South East Asia Digital Financial Service
Future of South East Asia Digital Financial ServiceFuture of South East Asia Digital Financial Service
Future of South East Asia Digital Financial Service
 
Most promising current and future payment technologies | SG Analytics
Most promising current and future payment technologies | SG AnalyticsMost promising current and future payment technologies | SG Analytics
Most promising current and future payment technologies | SG Analytics
 
Dorado TrendWatch Q1 2018
Dorado TrendWatch Q1 2018Dorado TrendWatch Q1 2018
Dorado TrendWatch Q1 2018
 
Leveraging Analytics to Combat Digital Fraud in Financial Organizations
Leveraging Analytics to Combat Digital Fraud in Financial OrganizationsLeveraging Analytics to Combat Digital Fraud in Financial Organizations
Leveraging Analytics to Combat Digital Fraud in Financial Organizations
 
UK Business Payments Barometer
UK Business Payments BarometerUK Business Payments Barometer
UK Business Payments Barometer
 

Recently uploaded

Streamlining Python Development: A Guide to a Modern Project Setup
Streamlining Python Development: A Guide to a Modern Project SetupStreamlining Python Development: A Guide to a Modern Project Setup
Streamlining Python Development: A Guide to a Modern Project SetupFlorian Wilhelm
 
"Subclassing and Composition – A Pythonic Tour of Trade-Offs", Hynek Schlawack
"Subclassing and Composition – A Pythonic Tour of Trade-Offs", Hynek Schlawack"Subclassing and Composition – A Pythonic Tour of Trade-Offs", Hynek Schlawack
"Subclassing and Composition – A Pythonic Tour of Trade-Offs", Hynek SchlawackFwdays
 
SIP trunking in Janus @ Kamailio World 2024
SIP trunking in Janus @ Kamailio World 2024SIP trunking in Janus @ Kamailio World 2024
SIP trunking in Janus @ Kamailio World 2024Lorenzo Miniero
 
My Hashitalk Indonesia April 2024 Presentation
My Hashitalk Indonesia April 2024 PresentationMy Hashitalk Indonesia April 2024 Presentation
My Hashitalk Indonesia April 2024 PresentationRidwan Fadjar
 
"Federated learning: out of reach no matter how close",Oleksandr Lapshyn
"Federated learning: out of reach no matter how close",Oleksandr Lapshyn"Federated learning: out of reach no matter how close",Oleksandr Lapshyn
"Federated learning: out of reach no matter how close",Oleksandr LapshynFwdays
 
My INSURER PTE LTD - Insurtech Innovation Award 2024
My INSURER PTE LTD - Insurtech Innovation Award 2024My INSURER PTE LTD - Insurtech Innovation Award 2024
My INSURER PTE LTD - Insurtech Innovation Award 2024The Digital Insurer
 
Commit 2024 - Secret Management made easy
Commit 2024 - Secret Management made easyCommit 2024 - Secret Management made easy
Commit 2024 - Secret Management made easyAlfredo García Lavilla
 
Story boards and shot lists for my a level piece
Story boards and shot lists for my a level pieceStory boards and shot lists for my a level piece
Story boards and shot lists for my a level piececharlottematthew16
 
Tech-Forward - Achieving Business Readiness For Copilot in Microsoft 365
Tech-Forward - Achieving Business Readiness For Copilot in Microsoft 365Tech-Forward - Achieving Business Readiness For Copilot in Microsoft 365
Tech-Forward - Achieving Business Readiness For Copilot in Microsoft 3652toLead Limited
 
CloudStudio User manual (basic edition):
CloudStudio User manual (basic edition):CloudStudio User manual (basic edition):
CloudStudio User manual (basic edition):comworks
 
Human Factors of XR: Using Human Factors to Design XR Systems
Human Factors of XR: Using Human Factors to Design XR SystemsHuman Factors of XR: Using Human Factors to Design XR Systems
Human Factors of XR: Using Human Factors to Design XR SystemsMark Billinghurst
 
"ML in Production",Oleksandr Bagan
"ML in Production",Oleksandr Bagan"ML in Production",Oleksandr Bagan
"ML in Production",Oleksandr BaganFwdays
 
Transcript: New from BookNet Canada for 2024: BNC CataList - Tech Forum 2024
Transcript: New from BookNet Canada for 2024: BNC CataList - Tech Forum 2024Transcript: New from BookNet Canada for 2024: BNC CataList - Tech Forum 2024
Transcript: New from BookNet Canada for 2024: BNC CataList - Tech Forum 2024BookNet Canada
 
SQL Database Design For Developers at php[tek] 2024
SQL Database Design For Developers at php[tek] 2024SQL Database Design For Developers at php[tek] 2024
SQL Database Design For Developers at php[tek] 2024Scott Keck-Warren
 
Designing IA for AI - Information Architecture Conference 2024
Designing IA for AI - Information Architecture Conference 2024Designing IA for AI - Information Architecture Conference 2024
Designing IA for AI - Information Architecture Conference 2024Enterprise Knowledge
 
Ensuring Technical Readiness For Copilot in Microsoft 365
Ensuring Technical Readiness For Copilot in Microsoft 365Ensuring Technical Readiness For Copilot in Microsoft 365
Ensuring Technical Readiness For Copilot in Microsoft 3652toLead Limited
 
costume and set research powerpoint presentation
costume and set research powerpoint presentationcostume and set research powerpoint presentation
costume and set research powerpoint presentationphoebematthew05
 
Connect Wave/ connectwave Pitch Deck Presentation
Connect Wave/ connectwave Pitch Deck PresentationConnect Wave/ connectwave Pitch Deck Presentation
Connect Wave/ connectwave Pitch Deck PresentationSlibray Presentation
 

Recently uploaded (20)

Streamlining Python Development: A Guide to a Modern Project Setup
Streamlining Python Development: A Guide to a Modern Project SetupStreamlining Python Development: A Guide to a Modern Project Setup
Streamlining Python Development: A Guide to a Modern Project Setup
 
DMCC Future of Trade Web3 - Special Edition
DMCC Future of Trade Web3 - Special EditionDMCC Future of Trade Web3 - Special Edition
DMCC Future of Trade Web3 - Special Edition
 
"Subclassing and Composition – A Pythonic Tour of Trade-Offs", Hynek Schlawack
"Subclassing and Composition – A Pythonic Tour of Trade-Offs", Hynek Schlawack"Subclassing and Composition – A Pythonic Tour of Trade-Offs", Hynek Schlawack
"Subclassing and Composition – A Pythonic Tour of Trade-Offs", Hynek Schlawack
 
SIP trunking in Janus @ Kamailio World 2024
SIP trunking in Janus @ Kamailio World 2024SIP trunking in Janus @ Kamailio World 2024
SIP trunking in Janus @ Kamailio World 2024
 
My Hashitalk Indonesia April 2024 Presentation
My Hashitalk Indonesia April 2024 PresentationMy Hashitalk Indonesia April 2024 Presentation
My Hashitalk Indonesia April 2024 Presentation
 
"Federated learning: out of reach no matter how close",Oleksandr Lapshyn
"Federated learning: out of reach no matter how close",Oleksandr Lapshyn"Federated learning: out of reach no matter how close",Oleksandr Lapshyn
"Federated learning: out of reach no matter how close",Oleksandr Lapshyn
 
My INSURER PTE LTD - Insurtech Innovation Award 2024
My INSURER PTE LTD - Insurtech Innovation Award 2024My INSURER PTE LTD - Insurtech Innovation Award 2024
My INSURER PTE LTD - Insurtech Innovation Award 2024
 
Commit 2024 - Secret Management made easy
Commit 2024 - Secret Management made easyCommit 2024 - Secret Management made easy
Commit 2024 - Secret Management made easy
 
Story boards and shot lists for my a level piece
Story boards and shot lists for my a level pieceStory boards and shot lists for my a level piece
Story boards and shot lists for my a level piece
 
Tech-Forward - Achieving Business Readiness For Copilot in Microsoft 365
Tech-Forward - Achieving Business Readiness For Copilot in Microsoft 365Tech-Forward - Achieving Business Readiness For Copilot in Microsoft 365
Tech-Forward - Achieving Business Readiness For Copilot in Microsoft 365
 
CloudStudio User manual (basic edition):
CloudStudio User manual (basic edition):CloudStudio User manual (basic edition):
CloudStudio User manual (basic edition):
 
E-Vehicle_Hacking_by_Parul Sharma_null_owasp.pptx
E-Vehicle_Hacking_by_Parul Sharma_null_owasp.pptxE-Vehicle_Hacking_by_Parul Sharma_null_owasp.pptx
E-Vehicle_Hacking_by_Parul Sharma_null_owasp.pptx
 
Human Factors of XR: Using Human Factors to Design XR Systems
Human Factors of XR: Using Human Factors to Design XR SystemsHuman Factors of XR: Using Human Factors to Design XR Systems
Human Factors of XR: Using Human Factors to Design XR Systems
 
"ML in Production",Oleksandr Bagan
"ML in Production",Oleksandr Bagan"ML in Production",Oleksandr Bagan
"ML in Production",Oleksandr Bagan
 
Transcript: New from BookNet Canada for 2024: BNC CataList - Tech Forum 2024
Transcript: New from BookNet Canada for 2024: BNC CataList - Tech Forum 2024Transcript: New from BookNet Canada for 2024: BNC CataList - Tech Forum 2024
Transcript: New from BookNet Canada for 2024: BNC CataList - Tech Forum 2024
 
SQL Database Design For Developers at php[tek] 2024
SQL Database Design For Developers at php[tek] 2024SQL Database Design For Developers at php[tek] 2024
SQL Database Design For Developers at php[tek] 2024
 
Designing IA for AI - Information Architecture Conference 2024
Designing IA for AI - Information Architecture Conference 2024Designing IA for AI - Information Architecture Conference 2024
Designing IA for AI - Information Architecture Conference 2024
 
Ensuring Technical Readiness For Copilot in Microsoft 365
Ensuring Technical Readiness For Copilot in Microsoft 365Ensuring Technical Readiness For Copilot in Microsoft 365
Ensuring Technical Readiness For Copilot in Microsoft 365
 
costume and set research powerpoint presentation
costume and set research powerpoint presentationcostume and set research powerpoint presentation
costume and set research powerpoint presentation
 
Connect Wave/ connectwave Pitch Deck Presentation
Connect Wave/ connectwave Pitch Deck PresentationConnect Wave/ connectwave Pitch Deck Presentation
Connect Wave/ connectwave Pitch Deck Presentation
 

Visa report 02.04.16

  • 1. ANDREA CASATI STEVENS FIRST PRINCIPLES INVESTMENT ADVISORS VISA, INC (V) , NYSE Sector: FINANCIAL SERVICES Industry: Consumer finance RECENT STATISTICS (02/03/16) Recent price 74.38 52-week range 60.00 - 81.01 Market cap 178.72B Total Debt 16B Beta 0.95 EPS 2.62 EPS (est) 3.00 P/E 28.39 E/P 3.52% P/B 6.12 Dividend 0.5 Div yield 0.67% ɪ. RECCOMMENDATION: BULL CALL SPREAD Visa is living a strong momentum. The company is leader in its industry and has great fundamentals. The industry is facing major technological changes, increasing regulation and uncertain macroeconomic conditions that could impact negatively Visa performance. European and Asian market are expected to be the main growth drivers. At the current price of $74.38, the company stock appears to be slightly underpriced with respect an estimated fair value of $83.16. The margin of safety is too low (11.8%). We recommend the implementation of a bull call spread strategy with a potential return of 23.7% over a one- year period. Visa Inc. is a leading global payments technology company operating in more than 200 countries. The company operates the world’s largest payment processing network, VisaNet, with a total transaction volume of $7.4T in 2014. . It has approximately 11,300 employees and it’s based in the US. CEO: Charles W. Scharf. Financial analyst: Andrea Casati Mail: andrea@sfpria.com
  • 2. ANDREA CASATI STEVENS FIRST PRINCIPLES INVESTMENT ADVISORS ɪɪ. INDUSTRY ANALYSIS A- OVERVIEW Companies in the payment card industry operate and manage the networks to handle electronic transactions and payment processing and offer debit and credit card services. Major US-based players include in order of total volume processed worldwide1 : Visa ($7.4T), MasterCard ($4.5), American Express ($1.1T) and Discover ($0.3T). Industry revenues are primarily generated from the volume and the number of transactions processed on the companies’ networks. According to Bloomberg, in 2014 the total transaction volume processed by the major 4 payment networks2 amounted to $13.4T, up 8% over 2013 and 75% over 2009; 162.4 billion transactions, up 11% over the previous year and 67% over 2009; 4,052 million cards active on the networks, up 9% year-over-year and 41% over 2009. Visa is the industry leader and the largest retail electronic payments network, according to all the three measures mentioned above: ●Visa ●MasterCard ●American Express ●Discover Even if cash still represents a significant component of consumer payment methods (26% of the US total transactions in 20133 ), the gradual migration to electronic payments is persistent. The trend is amplified but the increasing importance of Ecommerce and consumer spending of millennials and post-millennials. B-ECONOMIC ENVIRONMENT The industry is facing three major challenges that could increase costs and reduce revenue opportunities: increasing regulation, change in technology and uncertain macroeconomic conditions. REGULATORY ENVIRONMENT Visa and its competitors are facing increasing regulation all over the world. Moreover, there is a concrete risk that any new law or regulation in a certain region may be replicated in another one. Failing to comply with local and international requirements increase litigation risk and costs and may cause serious damages to companies businesses. 1 Source: Bloomberg, 2014 data. 2 Visa, MasterCard, American Express, Discover. Chinese network UnionPay has not been included since it operates under government-protected monopoly in China and it is not publicly listed. 3 Source: The 2013 Survey of Consumer Payment Choice, Federal Reserve Bank of Boston 0 2 4 6 8 2014 Total volume ($T) 0 25 50 75 100 2014 Total transactions(B) 0 500 1000 1500 2000 2500 2014 cards(M)
  • 3. ANDREA CASATI STEVENS FIRST PRINCIPLES INVESTMENT ADVISORS In the U.S. market the Fed, according to the Dodd-Frank Act (2011) has set a cap on the maximum debit interchange reimbursement fee assessed for debit products issued by large financial institutions and limits to issuers and network providers to impose rules for network exclusivity and preferred routing in the debit and prepaid network market segments4 . Certain jurisdictions outside the U.S. regulate the debit and credit interchange rates in their regions; i.e. Australia, India, European Union. Certain governments provide resources to or protection for their domestic payment card networks, brands and processors4 ; i.e. UnionPay in China, NSPK in Russia. Other regulations include: data protection and privacy, internet, mobile payments, anti-money laundering, anti-terrorism, government-imposed market restrictions. TECHNOLOGY ENVIRONMENT In the plastic card segment, Increasing demand for security following several data-breach scandals, has driven in 2015 the shift from the ‘swipe and sign’ to ‘chip and pin’ (EMV) cards. The migration is still in process. Another innovation is the development of NFC (near field communication) technology, related to contactless card and mobile wallets (through host emulation card technology). Both the new technologies require a payment infrastructure modernization. Increasing importance of mobile wallets and payments. Global mobile payment transaction volume amounted to $163.1B in 2012 and is expected have grown by 165% in 2015 and to grow by 343% by 20175 . The proliferation of non-bank digital players like Google pay, Apple pay, Samsung pay and the market share gain by Paypal are symptoms of the strong trend. Increasing importance of P2P (person to person) payments. The U.S. value of mobile P2P payments in 2014 was $9B and is expected to have grown by 78% in 2015 and to grow by 856% by 20185 . Chase, the largest card issuer in the US, launched clearXchange, a P2P network that is expanding to B2P payments (business to person). Mobile and P2P payments are potentially disruptive technologies and represent the hardest challenge faced by the industry players. On the one hand it may represent a serious threat of disintermediation from the payment value chain; on the other an opportunity to increase processed volume due to the further migration away from paper-based payment instruments. The way payment companies will deal with the new trend might drive their future success or failure. MACROECONOMIC TRENDS A strong U.S. dollar relative to the other major currencies has hurt the industry in terms of cross-board revenues in 2015. A further appreciation of the dollar in 2016 would hinder the oversea revenues of the U.S. based companies. After a 25 bps increase in the federal fund rate in December 2015 meeting, the Fed is open to the possibility of pursuing four further increases in the target rate. Even if improbable, a 100 bps increase in 4 Source: Visa Inc., 2015 10k 5 Source: Statista.com database.
  • 4. ANDREA CASATI STEVENS FIRST PRINCIPLES INVESTMENT ADVISORS the fed rate during 2016 would make card payment instruments less attractive and would reduce new account originations. At the same time, it would make card products more remunerative for the financial institutions clients. A negative signal comes from the consumer spending growth rate. While U.S. consumer spending in 2015 still grew by 2.6%, it represents a slowdown with respect the 3.2% increase in 2014. Similar signals come from Canada, Brazil, China and Middle East economies. PORTER FIVE FORCES ANALYSIS Threat of new entrants: HIGH. Even if the industry is characterized by strong economies of scale and the current number of payment networks is limited , capital requirements and barriers to entry are low. New payment solutions (i.e. Apple Pay) and competitors (i.e PayPal) currently use the ‘old’ payment infrastructure, but technology like mobile and P2P payment,s are potentially disruptive, representing a serious threat of disintermediation from the payment value chain for the industry established players. The volume processed by these technologies is still low (but expected to increase exponentially). Visa is currently active in all the new payment solutions and has strong brand recognition. Threat of substitutes: HIGH. There are no switching costs for the different methods of payment. Moreover, consumers tend to be price sensitive and try avoids any avoidable costs. Visa requires its financial institutions clients to comply to a set a general rules aimed at not losing consumers’ acceptance. Bargaining power of buyers: HIGH. Financial institutions are interested in maximizing their profit. Therefore they will look for the lower service fee. Since processing marginal costs for the industry players are low, they will try to win the customers’ preference by lowering the fees and/or offering incentives .Regulation has further increased competition. Bargaining power of suppliers: LOW. Visa suppliers are comprised by software, human resources, basic raw materials and electronic chips. While the company develops a significant part of its software internally, the other components can be considered commodities. HIGH
  • 5. ANDREA CASATI STEVENS FIRST PRINCIPLES INVESTMENT ADVISORS Industry rivalry: LOW. At the current status, the number of companies operating in the industry is limited. New disruptive technologies represent the hardest challenge faced by the industry players. PORTER GENERIC ANALYSIS Card payment industry competes on prices. Regulation and technology have further increased competition. The service is facing a commoditization process. Revenues mostly depend on processed volume and transactions. Processing marginal costs are low. Visa strong brand recognition (Visa is the 5th most valuable brand worldwide6 ) allows the company to offer lower service fees and/or higher incentives, exploiting economies of scale. VALUE NET ANALYSIS Customers: Visa customers are comprised by the financial institutions (directly), which issue the payment products and with which the company negotiates service fees and incentives, and consumers, businesses and governments (indirectly), that use the products and are charged by issuers, in compliance with Visa set of general rules. 6 Source: Brandz-Top 100 most valuable global brands 2015, Millward Brown
  • 6. ANDREA CASATI STEVENS FIRST PRINCIPLES INVESTMENT ADVISORS Suppliers: Visa services mainly require software and human resources. Visa cards require basic raw materials (mainly plastic) and electronic chips. The company develops significant of its software internally, while the other components can be considered commodities. Competitors: Visa competes globally against all forms of payment, including paper-based payments, other payment networks (mainly MasterCard, American Express and Discover) and electronic payments (i.e. mobile wallet and payments, wire transfers, ACH). Complementors: Financial institutions (issuers) issue Visa card products to consumers and contract (acquirers) with merchants to accept them. Physical (POS, mobile phones) and virtual (ecommerce platforms, apps) payment infrastructure allows the payment initiation. Industry association, Governments, regulators and PCI SSC7 set general rules for business conduct and security. SUMMARY: Card payment industry is characterized by firms’ concentration and economies of scale. Three major trends are challenging the industry players: increasing regulation, uncertain macroeconomic conditions and most importantly new potentially disruptive technologies. Visa is the industry leader and currently active in providing and developing the ‘new’ payment solutions. 7 Payment Card Industry Security Standards Council.
  • 7. ANDREA CASATI STEVENS FIRST PRINCIPLES INVESTMENT ADVISORS ɪɪɪ. COMPANY ANALYSIS A- BUSINESS OVERVIEW Visa Inc. is a U.S. based financial services corporation with headquarters in Foster City, California. The company was founded in 1958 (as BankAmericard). The actual entity is the result of the merger of Visa USA, Visa International, Visa Canada and Inovant. The European segment of the business, Visa Europe Limited, constituted a separate company. Visa Inc went public in 2008. Visa operates VisaNet, one of the world’s most advanced processing networks. The company is not a bank and does not issue cards, extend credit or set rates and fees on for account holders on Visa-branded products. Visa operates in more than 200 countries worldwide and earns revenues: • facilitating authorization, clearing and settlement of payments worldwide; • providing financial institutions with own-branded payment solutions (mostly credit, debit and prepaid cards and Visa ATM network); • offering fraud protection for account holders, risk management and rapid payment for merchant; • offering ecommerce (Visa Checkout), P2P (Visa Direct), mobile (Visa payWave, mVisa) products and services. Visa strategy for the future comprises of: • Increasing transactions volume through partnership with new clients, Visa has signed an exclusive partnership with Costco and CitiGroup starting from April 2016, and reinforcing the relationship with old ones. • Increasing the mobile and internet payment solutions and volume. In addition to products and services presented above, Visa recently launched Visa Commerce Network, a cross marketing network for coupon-free digital rewards, aimed at increasing merchants’ sales volume and customers’ loyalty. • Increasing business volume through Visa Europe Limited acquisition. The deal, announced in November 2015, is expected to be closed in the second half of 2016 fiscal year for a total purchase price of €21.2B (€11.5B cash, €5B preferred stocks, €4.7B earn out). B- DISCUSSION OF OPERATIONS On January 28th the company reported the 2016 fiscal year Q1 results8 : net revenues were $1,686M, up 7% year-over-year and 11.5% over the previous quarter; diluted EPS was $0.69, up 10% year-over-year and 11.3% over the previous quarter. In 2015 fiscal year the company reported $6,328M in net revenues, up 16.4% compared to $5,438M in 2014. Diluted EPS in 2015 was $2.62, up 15.4% compared to $2.27 in 2014. 2016 net revenues and EPS9 are expected to be $7,250M (up 14.6%) and $3.00 (up 14.5%) respectively. 8 Both net revenues and diluted EPS have been adjusted for non-recurring items. 9 Source: Valueline database.
  • 8. ANDREA CASATI STEVENS FIRST PRINCIPLES INVESTMENT ADVISORS According to the company annual report, Visa’s revenues are classified as: • Service revenues: earned for providing financial institution clients with support services for the delivery of Visa-branded payment products and solutions. • Data processing revenues: earned for authorization, clearing, settlement, network access and other support services that facilitates transaction and information processing globally. • International transaction revenues: earned for cross-border transaction processing and currency conversion activities. • Other revenues: licenses fees for use of the Visa brand, revenues earned from Visa Europe, fees from account holder services, certification and licensing, other activities related to acquired entities. • Moreover, the company reports client incentives, long-term contracts designed to build payments volume, as a deduction to operating revenues, rather than as part of operating expenses. Operating revenues were up 9.3% in 2015 f.y. and 5% in 2016 f.y. Q1 year-over-year. % of operating revenues10 by segment (and client incentives incidence) and % year-over-year change are reported in the figures below: Visa revenues are divided in 3 main geographic areas: United States, International and Visa Europe11 . % of operating revenues by geographic area and % year-over-year change are reported in the figures below: 10 Nominal amounts. 11 Revenues resulting from contractual arrangement with Visa Europe Limited, as governed by the Framework Agreement. 38% 34% 23% 5% -17% 38% 33% 24% 5% -17% -20% -10% 0% 10% 20% 30% 40% 50% 2014 2015 +9% +7% +14% +7% +10% Service Data proc. Intl. Other Client incentives 38% 34% 24% 5% -17% 38% 34% 24% 5% -18% -20% -10% 0% 10% 20% 30% 40% 50% 2015 FY Q1 2016 FY Q1 +7% +11% -3% +6% +7% Data proc. Service Intl. Other Client incentives 54% 44% 2% 53% 45% 2% 0% 10% 20% 30% 40% 50% 60% USA International Visa Europe 2014 2015 +8% +10% +13% 53% 46% 2% 54% 44% 2% 0% 10% 20% 30% 40% 50% 60% USA International Visa Europe 2015 FY Q1 2016 FY Q1 +9% +1% +20%
  • 9. ANDREA CASATI STEVENS FIRST PRINCIPLES INVESTMENT ADVISORS Operating expenses increased by 6% in 2015 year-over-year (compared to a +9% in revenues). The increase was mainly driven by higher personnel and depreciation expenses aimed at internal technology growth. The 2% operating expenses increase in 2016 Q1 (compared to a +5% in revenues) was mainly driven due fees related to domestic transactions in Russia area and currency losses. % of tot revenues Year-over-year % increase $ Millions 2014 2015 16Q1 2014 2015 16Q1 2014 2015 16Q1 Revenues 100% 100% 100% 8% 9% 5% 12,702 13,880 3,565 Operating expenses 36% 35% 33% 0% 6% 2% 4,555 4,816 1,169 Personnel 15% 15% 14% -3% 11% -2% 1,875 2,079 499 Marketing 7% 6% 5% 3% -3% -5% 900 872 194 Network and processing 4% 3% 4% 8% -7% 12% 507 474 128 Professional fees 3% 2% 2% -20% 2% 3% 328 336 72 Depreciation and amortization 3% 4% 3% 10% 14% 0% 435 494 120 General and administrative 4% 4% 4% 12% 8% 24% 507 547 156 Litigation provision 0% 0% 0% 0% 367% - 312 14 0 In 201513 Visa processed $7.4B nominal payments volume, experiencing a constant-dollar basis growth of 10%: 12% payment volume growth (consumer debit and credit up both 12%), 8% cash volume growth. According to the company most recent 10Q, the positive trend was persistent in the 2015 Q4. Nominal payments volume constant-dollar basis growth rate was 10%: 12% payment volume growth (consumer debit up 10%, credit 14%), 5% cash volume growth. CAPITAL STRUCTURE Visa has been historically 100% equity financed. The company had 3 class of common shares outstanding: Class A14 , Class B (each convertible in 1.6 Class A, conversion limited until the complete U.S. covered litigation resolution and Class C common shares. In Q1 of 2016 fiscal year, Visa issued $16B in LTD authorized the creation of three types of preferred stocks in relation to the acquisition of Visa Europe, expected to be finalized in the second half of the year. 12 It does not include $450M non-recurring item. 13 12-month period ending 14 In January 2015, Visa’s board of directors declared a four-one-four split of its class A common stock.
  • 10. ANDREA CASATI STEVENS FIRST PRINCIPLES INVESTMENT ADVISORS RATIO ANALYSIS15 American Express (AXP) Discover (DFS) MasterCard (MA) Peer group avr. Visa (V) LIQUIDITY Current ratio - - 1.77 1.77 2.03 Quick ratio - - 1.36 1.36 1.37 CFO/curr. liabilities - - 0.55 0.55 1.23 SOLVENCY Tot liabilities/Tot assets 0.87 0.87 0.56 0.77 0.4616 LTD to Equity 2.80 2.03 0.22 1.68 0.54 Interest coverage 20.9 6.7 106.8 44.8 91 EFFICIENCY Op income/volume proc. - - 1.21 1.21 1.29 Asset turnover 0.22 0.1 0.64 0.32 0.35 PROFITABILITY Operating margin 26.2% 43.6% 57.3% 34.9% 68.9% Net profit margin 17.2% 26.8% 38.2% 22.0% 39.8% ROE 29.3% 21.8% 53.3% 29.3% 21.2% RoTC - - 44.0% 44.0% 21.2% LIQUIDITY ($MILL.) 2014 2015 % Δ 5-year average 2015 Q1 2016 Q1 % Δ Cash And Cash Equivalents 1,971 3,518 78.5% 3,518 12,837 264.9% Receivables 822 847 3.0% 847 992 17.1% Other Current Assets 6,769 6,527 -3.6% 5,656 11,644 105.9% Total Current Assets 9,562 10,892 13.9% 10,021 25,473 154.2% Accounts payable 147 127 -13.6% 127 118 -7.1% Other Current Liabilities 5,859 5,247 -10.4% 5,228 5,239 0.2% Total current liabilities 6,006 5,374 -10.5% 5,355 5,357 0.0% CF from operations 7,205 6,584 -8.6% 1,761 1,979 12.4% Current ratio 1.59 2.03 27.3% 1.91 1.87 4.76 154.1% Quick ratio 1.10 1.37 24.5% 1.17 1.37 4.24 209.5% CFO/current liabilities 1.20 1.23 2.1% 0.97 0.33 0.37 12.3% Visa presents a strong liquidity position. In 2015 Visa current and quick ratio were equal to 2.03 and 1.37 (up 27.3% and 24.5% year-over-year) respectively, higher than both the 5-year average (1.91 and 1.17) and its main competitor (MasterCard 1.77 and 1.36). In 2015 current assets and current liabilities represented 27.1% and 13.4% of total assets respectively (24.8% and 15.6% in 2014). 15 In addition to operating their payment networks, American Express and Discover act also like banks, issuing cards and setting service fees directly with consumers. Therefore, the results might be not fully comparable. 16 2016 f. y. Q1 data.
  • 11. ANDREA CASATI STEVENS FIRST PRINCIPLES INVESTMENT ADVISORS Cash flow from operations over current liabilities was 1.23 in 2015 (up from 1.20 in 2014), higher than the 5-year average (0.97) and strongly higher than its main competitor (0.55). The higher ratios reported in the first quarter of 2016 f. y. reflect the issue of $16B senior notes aimed at the acquisition of Visa Europe Limited. The proceeds of the issue are temporarily held in cash and short- term investments. Accordingly to Visa 2015 annual report, a substantial portion of the company’s cash, cash equivalents and investment securities ($7B) is held by international subsidiaries outside of the U.S. and the company would be required to pay taxes of the undistributed profits in the case of repatriation. Moreover, Visa maintains a litigation escrow account ($1.1B) to cover possible future U.S. litigation. Further source of liquidity for Visa are represented by a commercial paper program (up to $3B) and the renewal in 2016 Q1 of its credit facility (up to $4B). SOLVENCY ($MILL.) 2015 2016 Q1 % Δ Est 2016 % Δ Total liabilities 10,394 25,501 145.3% Total assets 40,236 54,977 36.6% Long term debt - 15,877 100.0% 10,000 100% Shareholders’ equity 29,842 29,476 -1.2% 32,000 6.7% LTD due in 5 years 4,731 Tot Op. lease commitments 392 EBIT 8,995 2,639 18.0%17 9300 3.4% Interest exp - 29 484.5 Tot liabilities/Tot Assets 0.26 0.46 79.6% LTD to Equity NA 0.54 100.0% 0.31 100.0% Interest coverage NA 91.0 100.0% 19.2 100.0% Visa has been historically unleveraged. In the first quarter of 2016 f. y. the company issued $16B in long- term debt (with maturities ranging from to 2 to 30 years) to finance the acquisition of Visa Europe, expected to be finalized in the second half of the year. In 2016 f. y. Q1 total liabilities represented 46% of total assets, up from 26% in 2015; the ratio is lower than both the peer group average (77%) and its main competitor (56%). In 2016 f. y. Q1 LTD to Equity ratio was equal to 0.54 (no LTD in 2015) and expected to be 0.31 for the entire year; the ratio is lower than the peer group average (1.68) but higher than its main competitor (0.22). $4.7B18 of LTD is due in 5 years. In 2016 f. y. Q1 interest coverage was 91 and expected to be 19.2 for the entire year (not taking into account the possible effects of Visa Europe acquisition on EBIT). The ratio is higher than the peer group average (44.8) and but lower than its main competitor (106.8). 17 Year-over-year change 18 Amount subject to the closing of Visa Europe deal.
  • 12. ANDREA CASATI STEVENS FIRST PRINCIPLES INVESTMENT ADVISORS According to 2015 10K, Visa presents total operating lease commitments of $392M ($95M due in 2016). Moreover the company is committed to $1.1B in purchase order ($855M due in 2016), $654M marketing and sponsorship agreements ($112M due in 2016) and $17.4B in client incentives agreements19 ($3.9B due in 2016). EFFICIENCY ($BILL.) 2014 2015 % Δ Processed volume 7,158.0 7,392.0 3.3% Avg Tot Assets 37,262.5 39,402.5 5.7% Revenues 12,702.0 13,880.0 9.3% Operating income 7,697.0 9,064.0 17.8% Op income/Volume proc. 1.08 1.29 19.7% Asset turnover 0.34 0.35 3.3% Visa experienced a strong improvement in its efficiency position in 2015 over the previous year in terms of operating income on processed volume measure. The ratio of 1.29 increased by 20% year-over-year, and higher than its main competitor (1.21). Asset turnover was 0.35, up 3.3% but lower than MasterCard (0.64). PROFITABILITY 2014 2015 14-15 %Δ 2016 Q1 %Δ20 Est 2016 % Δ Revenues ($Mill.) 12,702 13,880 9.3% 1,686 7.0% 15,000 8.1% EPS 2.27 2.62 15.4% 0.69 10.0% 3.00 14.5% Operating margin 64% 68.9% 7.7% 67.2% 1.6% 65% -5.7% Profit margin 42.8% 39.8% -7.0% 47.3% 1.9% 48.3% 21.4% ROE 19.8% 21.2% 7.1% 5.7% 1.2% 22.5% 6.1% Return on total capital 19.8% 21.2% 7.1% 3.7% -34.6% 17.5% -17.5% Book value per share 10.86 12.15 11.9% 12.23 12.6% 13.2 8.6% Cost of equity 7.73% Annual rates of Δ per share Past 10 years Past 5 years Est'd '12- '14 to '18-'20 Revenues - 15.5% 10.0% Earnings - 23.5% 11.5% Visa presents a good profitability position. In 2015 operating margin of 68.9% (64% in 2014) was higher than the industry average (34.9%), its main competitor (MasterCard 57.3%) and its 5-year average (64.7%). The 2015 increase was driven by a revenue growth rate higher than the operating expenses one. Operating margin has decreased to 67.2% in 2016 Q1 and is expected to decrease to 65% for the entire year, driven by the tightening of the growth rate differential between revenues and op. expenses. 19 Payments under these agreements are generally offset by revenues earned from higher business volume. 20 Year-over-year change.
  • 13. ANDREA CASATI STEVENS FIRST PRINCIPLES INVESTMENT ADVISORS In 2015 net profit margin of 39.8% (down from 42.8% in 2014) was higher than the industry averages of 22%, its main competitor (MasterCard 38.2%) but lower than its 5-year average (41.3%). The 2015 decrease was mainly driven by the change in Visa Europe put option fair value. Net profit margin has increased to 47.3% in 2016 Q1 and is expected to increase to 48.3% for the entire year. 2015 RoE of 21.2% (up from 19.8%) was lower than both the industry average (40%) and the main competitor (MasterCard 50.7%), mainly due to Visa (unleveraged) capital structure. The 2015 increase was driven by both higher revenues and the effect of the company stock repurchase. RoE is expected to increase by 6.1% in 2016, due to leverage effect. 2015 RoE was widely higher than the company’s cost of equity of 7.73%. 2015 RoTC was equal to RoE (21.2%), since the company had no outstanding LTD, and expected to be 17.2% in 2016. 2015 book value per share was 12.15. The increase from 2014 value (10.86) was mainly due to stock repurchase. BV per share is expected to increase to 13.2 in 2016. Revenues per share have grown 15.5% annually over the 5 years. Annual growth over the next three years is expected to be 10%. Average 2013-2015 sales per share ($5.06) was 215% higher than Average 2008- 2010 SPS ($2.35). Earnings per share have grown 23.5% annually over 5 years. Annual growth over the next three years is expected to be 11.5%. Average 2013-2015 EPS ($2.26) was 297% higher than average 2008-2010 EPS ($0.76). PAYOUT POLICY Visa pays quarterly dividends. In October 2015 the Company’s Board declared a 16.7% increase in the Company’s quarterly dividend rate to $0.14 per share (paid in 2016 f. y. Q1) from the prior year quarterly dividend of $0.12 per share. The company paid dividends since it went public, but at a decreasing incremental rate during the last five years (31% 5-year average dividend growth). Visa dividend yield is lower than its competitors (AXP 2.1%, DFS 2.3%, MA 0.9%) 2011 2012 2013 2014 2015 2016 (E) Div decl’d per share (yearly) 0.15 0.22 0.33 0.42 0.50 0.60 Year-over-year Δ 15% 47% 50% 27% 19% 20% Dividend Yield 0.7% 0.7% 0.7% 0.7% 0.7% 0.7% Payout Ratio 12.0% 14.2% 17.4% 18.5% 19.1% 20.0% Moreover Visa announced in October 2015 a new $5.0B shares repurchase program (in addition to the existing one announced in October 2014). The company bought back shares for $2.9B in 2015 ($4.1B in 2014) and $2.0B in the quarter ending December 2015. The repurchase plan is mainly aimed at contain a possible dilution effect related to Visa Europe deal. Considering both dividends and share repurchases, the company’s payout ratio ranged from 61% to 120% in the last three years. SUMMARY: In 2015 Visa Has performed better than its main competitor MasterCard (and improved year- over-year) in terms of liquidity, solvency, efficiency and profitability. The only concern is a decrease in revenues and operating margin growth rate (but still near to double-digit increases).
  • 14. ANDREA CASATI STEVENS FIRST PRINCIPLES INVESTMENT ADVISORS ɪv. COMPANY ANALYSIS GRAHAM FORMULA Intrinsic value = EPS * (8.5 * 2g)* (4.4 / y)21 Estimated 2016 EPS = $3.00 AAA bond rate = 5% Est g 120% 100% 80% 5.5% 61.78 51.48 41.18 7.5% 74.45 62.04 49.63 9.5% 87.12 72.60 58.08 11.5% 99.79 83.16 66.53 13.5% 112.46 93.72 74.98 15.5% 125.14 104.28 83.42 17.5% 137.81 114.84 91.87 According to Graham formula, Visa intrinsic value is equal to $83.16. BULL CALL SPREAD STRATEGY: Long position: call, strike price= $80, expiration date: Jan 20 2017 Ask price=$5.15 Short position: call, strike price= $82.5, expiration date: Jan 20 2017 Last price= $3.80 Cost of the strategy = 5.15-3.80= $1.35 Profit potential = 12.62 -10.95= $1.67 In percentage terms= (1.67-1.35)/1.35= 23.7% 21 Where g = est. earnings growth rate and y = AAA bond rate
  • 15. ANDREA CASATI STEVENS FIRST PRINCIPLES INVESTMENT ADVISORS Company: VISA, INC Symbol V Price 74.38 I - Financial Stability 2015 2016 Est II-MPT Statistics Int Coverage - - Inflation 2.00% Current Ratio 2.03 RM 8.00% Quick Ratio 1.37 RF 2.50% Debt (%) 0.0% 23.8% Beta 0.95 Equity (%) 100.0% 76.2% CoE 7.73% Book Value / share 12.15 13.2 III - Profitability 2007 2008 2009 2010 2011 2012 2013 2014 2015 2016(E) Revenues ($million) - 6.263 6.911 8.065 9.188 10.421 11.778 12.702 13.880 15.000 Earnings per share - 0.56 0.73 0.98 1.25 1.55 1.90 2.27 2.62 3.00 2013-2015 Avg. EPS 2.26 2013-2015Avg. Sales per s 5.06 2008-2010 Avg. EPS 0.76 2008-2010Avg. Sales per s 2.35 Profit Margin - 27.1% 32.0% 36.8% 39.7% 40.3% 42.3% 42.8% 39.8% 48.3% Return on Equity - 8.0% 9.5% 11.9% 13.8% 15.2% 18.5% 19.8% 21.2% 22.5% Return on Total Capital - 8.0% 9.5% 11.8% 13.8% 15.2% 18.5% 19.8% 21.2% 17.5% Book Value / share - 6.86 7.64 8.46 9.35 10.19 10.24 10.86 12.15 13.20 Cost Of Equity 7.73% IV - Growth 2007 2008 2009 2010 2011 2012 2013 2014 2015 2016(E) Past Revenues Growth - - 10% 17% 14% 13% 13% 8% 9% 8% Past Earnings Growth - - 30% 34% 28% 24% 23% 19% 15% 15% Next 3 y. 5 years 10 years Past Earnings Growth 11.5% 23.5% - Past Revenues Growth 10.0% 15.5% - Valueline Projected Growth 11.5% V - Dividends 2007 2008 2009 2010 2011 2012 2013 2014 2015 2016(E) Cash Dividend 0.03 0.11 0.13 0.15 0.22 0.33 0.42 0.50 0.60 Dividend Yield - 0.2% 0.7% 0.6% 0.7% 0.7% 0.7% 0.7% 0.7% Payout Ratio - 5.4% 15.1% 13.3% 12.0% 14.2% 17.4% 18.5% 19.1% VI - Valuation Earnings growth 120% 100% 80% 5.5% 61.78 51.48 41.18 Y = 5% 7.5% 74.45 62.04 49.63 9.5% 87.12 72.60 58.08 11.5% 99.79 83.16 66.53 13.5% 112.46 93.72 74.98 15.5% 125.14 104.28 83.42 17.5% 137.81 114.84 91.87 2007 2008 2009 2010 2011 2012 2013 2014 2015 E/P - 3.4% 4.5% 4.8% 5.8% 4.9% 4.0% 3.9% 3.8% PE Ratio - 29.82 22.47 20.66 17.12 20.23 24.79 25.55 26.51 Relative PE - 1.96 1.35 1.30 0.98 1.16 1.22 1.30 Price to Book - 2.43 2.15 2.39 2.29 3.08 4.60 5.34 5.72 VII - Pricing 2007 2008 2009 2010 2011 2012 2013 2014 2015 High - 22.5 22.4 24.3 25.9 38.1 55.7 67.3 78.9 Low - 10.9 10.4 16.2 16.9 24.6 38.5 48.7 60.0