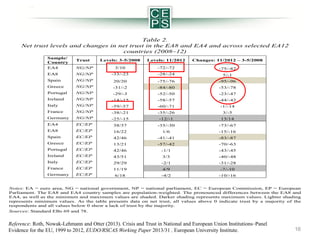
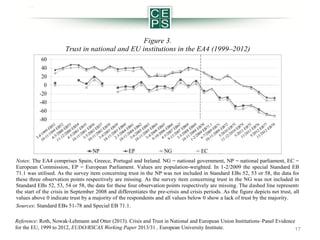
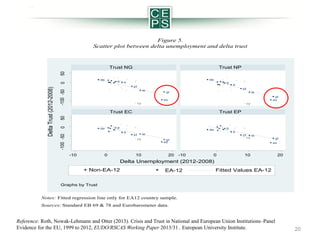
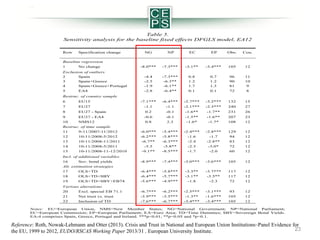
Presentation by Felix Roth at the OECD Workshop on “Joint Learning for an OECD Trust Strategy” on 14 October 2013. Dr. Roth discusses the consequences of citizens declining trust and the driving factors of declining trust in Europe. He also provides an econometric analysis of trust and unemployment.
Presentation by Dóra Györffy at the OECD Workshop on “Joint Learning for an OECD Trust Strategy” on 14 October 2013. Ms. Györffy discusses trust in-depth including its relationship with decision-making, economic policy, popularity of government and its influence on the crisis.
Highlights from the 2014 edition of the OECD's Sovereign Borrowing Outlook. This includes gross borrowing requirements, net borrowing requirements, central government marketable debt, funding strategies and instruments and distribution channels.
Find out more information at http://www.oecd.org/daf/fin/public-debt/oecdsovereignborrowingoutlook.htm
Across the OECD, GDP per capita is converging. In contrast, regional disparities – or differences in GDP per capita across jurisdictions – are rising, mainly as a result of widening productivity differences. Fiscal decentralisation could help reduce them again.
Jonathan Rodden - Representation and Redistribution in Federations: Lessons f...ADEMU_Project
Professor Jonathan Rodden, Stanford University, describes how he has applied his on work on numerous federations in the United States and extracted lessons and principles that could be theoretically applied to the European Monetary Union.
This presentation by OECD's financial markets expert Adrian Blundell-Wignall shows the highlights from the 2016 edition of the OECD Business and Finance Outlook. http://www.oecd.org/daf/oecd-business-and-finance-outlook-2016-9789264257573-en.htm
Will risks-derail-the-modest-recovery-oecd-interim-economic-outlook-march-2017OECD, Economics Department
Global GDP growth is projected to pick up modestly to around 3½ per cent in 2018, from just under 3% in 2016, boosted by fiscal initiatives in the major economies. The forecast is broadly unchanged since November 2016. Confidence has improved, but consumption, investment, trade and productivity are far from strong, with growth slow by past norms and higher inequality.
Policy Highlights from the publication Regional Outlook 2016, Productive Regions for Inclusive Societies. For more information see http://www.oecd.org/gov/oecd-regional-outlook-2016-9789264260245-en.htm
While growth has picked up, more needs to be done for Japan to overcome two key challenges – a record high government debt ratio and an accelerating decline in its working-age
population.
Trust in Government: What is it? How to measure? What can be done? Wikiprogress_slides
Presentation by Bo Rothstein at the OECD Workshop on “Joint Learning for an OECD Trust Strategy” on 14 October 2013. Mr. Rothstein discusses how to capture the quality of government and its impact on social trust. He also provides suggestions for what can be done to strengthen quality of government?
Presentation by Mario Solis-Garcia at the OECD Workshop on “Joint Learning for an OECD Trust Strategy” on 14 October 2013. Mr. Solis-Garcia discusses why trust matters and uses a simple economic model to see how government trust influences environment, government, households and timing.
Presentation by Frédérique Six at the OECD Workshop on “Joint Learning for an OECD Trust Strategy” on 14 October 2013. Mr. Six discusses effective regulation, the trust triangle, compliance and a trust regime.
Presentation by Pall Thorhallsson at the OECD Workshop on “Joint Learning for an OECD Trust Strategy” on 14 October 2013. Mr. Thorhallsson discusses the pre-crash situation, the nature of the 2008 crash, and the crash's impact on trust. He also mentions reasons for the lacking trust.
Presentation by Marco Mira d’Ercole at the OECD Workshop on “Joint Learning for an OECD Trust Strategy” on 14 October 2013. Mr. Mira d'Ercole discusses the interest and importance of trust, how trust should be measured and trust's broader relationship with the quality of democratic institutions.
Presentation by Tracy Burns at the OECD Workshop on “Joint Learning for an OECD Trust Strategy” on 14 October 2013. Ms. Burns discusses trends in governance and education, satisfaction with the education system, accountability, and positive outcomes possible with educated adults.
Presentation by Yann Algan at the OECD Workshop on “Joint Learning for an OECD Trust Strategy” on 14 October 2013. Mr. Algan discusses the relationships between institutions, inequality/segmentation and trust. He also examines how to identify impact of policy on trust.
.Introduction The European sovereign debt crisis was to a gr.docxmercysuttle
.
HST 337 Review essay questions
1. Comment fully on the origins and consequences of the Atlantic slave trade. Include a detailed comment on what you consider to have been the likely short and long term impact of the trade on African societies.
2. Migration is a major theme in the understanding of the African experience. Select and discuss at least four examples of migration in the African continent before 1870. Include comment on the objectives, accomplishments and failures of the migrants
3. Assume you visited and spent two months in either the Asanteland or Yorubaland or Hausaland or Igboland in 1825. Write a report of your observations there. Focus your attention on political, economic, social and cultural life. Conclude your essay by commenting on what you consider to be the African perception of what the advancement in civilization should entail
. 4. A knowledge of the shaping of the South African society to 1850 is critical to the understanding of that region's history in later years. Assume you were invited to give a lecture on "The Shaping of South African Society to 1850." Discuss at least four themes you will emphasize in your lecture. State why selected these themes and support your argument with historical data.
5. Select an African king/leader before 1870 and craft a biographical essay on him. Focus your attention on his rise to power, administrative style, economic policy, achievements, failures, weaknesses, and legacy. Include comment on what you consider to a unique characteristic of African leaders before 1870.
6. Select and discuss at least four examples of the role of long distance trade in the shaping of African society before 1870. Include on what you consider to be the most enduring impact of long distance trade in the continent.
...
Impact of the Euro debt crisis on the investment behavior of 50+ European Inv...Open Knowledge
Allianz International Pensions conducted a survey in seven European countries among wealthier people aged between 50 and 70. Countries included were Austria, France,
Germany, Italy, Netherlands, Switzerland and the United Kingdom (UK). The main objective of the survey was to analyze the ideas of the 50+ generation about retirement income, planning for retirement and financial topics most relevant to this clientele in a financial environment characterized by uncertainty and volatility. In this report we focus on those results which address the recent financial developments, namely the euro debt crisis.
HLEG thematic workshop on Measuring Trust and Social Capital, Evgenia PassariStatsCommunications
HLEG thematic workshop on Measuring Trust and Social Capital, 10 June 2016, Paris, France. More information at: www.oecd.org/statistics/measuring-economic-social-progress/hleg-workshop-on-measuring-trust-and-social-capital-2016.htm
Long-Term Sustainability of a Monetary and Fiscal UnionADEMU_Project
As part of the ADEMU kick-off conference, this presentation looks at:
1. Political Credit Cycles: The Case of the Euro Zone
2. An Institution Too Far: The Political Economy of the Euro
As the global financial crisis entered its most dramatic phase, in the second half of 2008, the International Monetary Fund (IMF), many governments and several distinguished scholars advocated expansionary fiscal olicy as the second most effective tool (after monetary stimulus) to fight deep recession and deflation. Now, more than a year later, the previous excitement surrounding the supposed power of fiscal stimulus largely disappeared and instead has been replaced by ising concerns over the sustainability of public finances in many countries. Unfortunately, the previous enthusiasts of the active counter‐cyclical fiscal policy have not always realized the causality between the two.
Authored by: Marek Dąbrowski
Published in 2009
Money Deficits and Inflation Evidence and Policy Issues of Euro Zone during D...paperpublications3
Abstract: An important lesson from the euro area sovereign debt crisis is that the need for sound economic policies does not end once a country has adopted the euro. There are no automatic mechanisms to ensure that the process of nominal convergence which occurs before adoption of the euro produces sustainable real convergence there after. The global financial crisis that started in 2008 has showed that some countries participating in Economic and Monetary Union (EMU) had severe weaknesses in their structural and institutional set-up. This has resulted in a large and protracted fall in real per capita income levels in these countries since 2008. While there has been real convergence in the European Union (EU) as a whole since 1999 owing to the catching up of central and eastern European (CEE) economies, there has been no process of real convergence among the 12 countries that adopted the euro in 1999 and 2001. This lack of convergence is related to several factors, notably weak institutions, structural rigidities, weak productivity growth and in sufficient policies to address asset price booms. Against this background, several factors appear crucial for ensuring real convergence in EMU: macroeconomic stability, and sound fiscal policy in particular; a high degree of flexibility in product and labor markets; favorable conditions for an efficient use of capital and labor in the economy, supporting total factor productivity (TFP) growth; economic integration within the euro area; and a more active use of national policy tools to prevent asset price and credit boom-bust cycles.
Keywords: Money Deficits, Inflation, Policy, Euro Zone,Sustainability, Monetary Policy, Investments.
Jel codes: H62, H68, H6, E41, E42
Title: Money Deficits and Inflation Evidence and Policy Issues of Euro Zone during Debt Crisis
Author: Dr. Stamatis Kontsas
ISSN 2349-7807
International Journal of Recent Research in Commerce Economics and Management (IJRRCEM)
Paper Publications
Aranca views: Europe Debt - That Sinking Feeling AgainVikas Sharan
European debt has increased either absolutely or as a percentage of GDP over the years. Aranca’s article provides overview of european debt data, net debt, eurozone inflation data, gdp growth, unemployment rate and more.
Check out the published version here: http://www.aranca.com/knowledge-center/articles-and-publications/300-european-debt-that-sinking-feeling-again
European Debt: That sinking feeling…again? | Articles and PublicationsAranca
European debt has increased either absolutely or as a percentage of GDP over the years. Aranca’s article provides overview of European debt data, net debt, Eurozone inflation data, GDP growth, unemployment rate, etc.
The R&D projects funded by the European Union. The recent experience of Web-...Wikiprogress_slides
Presentation given by Donatella Fazio of Istat to student of Università di Bologna Corso di laurea in Sviluppo e Cooperazione Internazionale on 27 November 2014
Citizenship to monitor quality of life and evaluate progress in citiesWikiprogress_slides
Presentation by Kate Scrivens, Policy Analyst, OECD Statistics to Gran Sasso Science Institute (GSSI) students on their study visit to OECD, Paris on 12 December 2014.
Transferring knowledge into policy and the role of WikiprogressWikiprogress_slides
This is a presentation made for the QoLexity Masters course, given at the Universita degli Studi, Florence by Kate Scrivens, manager of the knowledge-sharing site Wikiprogress on November 6 2014.
This presentation is composed of graphs from a German Health Behaviour in School-Aged Children (HBSC) study "Explaining educational inequalities in adolescent life satisfaction: do health behaviour and gender matter?". Using data from over 5,000 school children, members of the German HBSC national team investigated the role of health behaviour in explaining educational inequalities in adolescent life satisfaction nationally.
The data needs to support the effectiveness of social entrepreneurship initia...Wikiprogress_slides
The data needs to support the effectiveness of social entrepreneurship initiative by T.Hutchinson, i-genius for Web-Cost kick-off meeting 9 January 2014
हम आग्रह करते हैं कि जो भी सत्ता में आए, वह संविधान का पालन करे, उसकी रक्षा करे और उसे बनाए रखे।" प्रस्ताव में कुल तीन प्रमुख हस्तक्षेप और उनके तंत्र भी प्रस्तुत किए गए। पहला हस्तक्षेप स्वतंत्र मीडिया को प्रोत्साहित करके, वास्तविकता पर आधारित काउंटर नैरेटिव का निर्माण करके और सत्तारूढ़ सरकार द्वारा नियोजित मनोवैज्ञानिक हेरफेर की रणनीति का मुकाबला करके लोगों द्वारा निर्धारित कथा को बनाए रखना और उस पर कार्यकरना था।
role of women and girls in various terror groupssadiakorobi2
Women have three distinct types of involvement: direct involvement in terrorist acts; enabling of others to commit such acts; and facilitating the disengagement of others from violent or extremist groups.
In a May 9, 2024 paper, Juri Opitz from the University of Zurich, along with Shira Wein and Nathan Schneider form Georgetown University, discussed the importance of linguistic expertise in natural language processing (NLP) in an era dominated by large language models (LLMs).
The authors explained that while machine translation (MT) previously relied heavily on linguists, the landscape has shifted. “Linguistics is no longer front and center in the way we build NLP systems,” they said. With the emergence of LLMs, which can generate fluent text without the need for specialized modules to handle grammar or semantic coherence, the need for linguistic expertise in NLP is being questioned.
01062024_First India Newspaper Jaipur.pdfFIRST INDIA
Find Latest India News and Breaking News these days from India on Politics, Business, Entertainment, Technology, Sports, Lifestyle and Coronavirus News in India and the world over that you can't miss. For real time update Visit our social media handle. Read First India NewsPaper in your morning replace. Visit First India.
CLICK:- https://firstindia.co.in/
#First_India_NewsPaper
03062024_First India Newspaper Jaipur.pdfFIRST INDIA
Find Latest India News and Breaking News these days from India on Politics, Business, Entertainment, Technology, Sports, Lifestyle and Coronavirus News in India and the world over that you can't miss. For real time update Visit our social media handle. Read First India NewsPaper in your morning replace. Visit First India.
CLICK:- https://firstindia.co.in/
#First_India_NewsPaper
27052024_First India Newspaper Jaipur.pdfFIRST INDIA
Find Latest India News and Breaking News these days from India on Politics, Business, Entertainment, Technology, Sports, Lifestyle and Coronavirus News in India and the world over that you can't miss. For real time update Visit our social media handle. Read First India NewsPaper in your morning replace. Visit First India.
CLICK:- https://firstindia.co.in/
#First_India_NewsPaper
ys jagan mohan reddy political career, Biography.pdfVoterMood
Yeduguri Sandinti Jagan Mohan Reddy, often referred to as Y.S. Jagan Mohan Reddy, is an Indian politician who currently serves as the Chief Minister of the state of Andhra Pradesh. He was born on December 21, 1972, in Pulivendula, Andhra Pradesh, to Yeduguri Sandinti Rajasekhara Reddy (popularly known as YSR), a former Chief Minister of Andhra Pradesh, and Y.S. Vijayamma.
Welcome to the new Mizzima Weekly !
Mizzima Media Group is pleased to announce the relaunch of Mizzima Weekly. Mizzima is dedicated to helping our readers and viewers keep up to date on the latest developments in Myanmar and related to Myanmar by offering analysis and insight into the subjects that matter. Our websites and our social media channels provide readers and viewers with up-to-the-minute and up-to-date news, which we don’t necessarily need to replicate in our Mizzima Weekly magazine. But where we see a gap is in providing more analysis, insight and in-depth coverage of Myanmar, that is of particular interest to a range of readers.
‘वोटर्स विल मस्ट प्रीवेल’ (मतदाताओं को जीतना होगा) अभियान द्वारा जारी हेल्पलाइन नंबर, 4 जून को सुबह 7 बजे से दोपहर 12 बजे तक मतगणना प्रक्रिया में कहीं भी किसी भी तरह के उल्लंघन की रिपोर्ट करने के लिए खुला रहेगा।
31052024_First India Newspaper Jaipur.pdfFIRST INDIA
Find Latest India News and Breaking News these days from India on Politics, Business, Entertainment, Technology, Sports, Lifestyle and Coronavirus News in India and the world over that you can't miss. For real time update Visit our social media handle. Read First India NewsPaper in your morning replace. Visit First India.
CLICK:- https://firstindia.co.in/
#First_India_NewsPaper
Future Of Fintech In India | Evolution Of Fintech In IndiaTheUnitedIndian
Navigating the Future of Fintech in India: Insights into how AI, blockchain, and digital payments are driving unprecedented growth in India's fintech industry, redefining financial services and accessibility.
3. I.
Introduction
•
Bankruptcy of Lehman Brothers in September 2008 acted as the starting point of the
most severe financial- and economic crisis, since the Great depression in the 1930’s, for
most advanced economies worldwide (EEAG 2010).
•
Within the EA the financial crisis has culminated into a sovereign debt crisis from 2010
onwards (De Grauwe 2010).
•
To overcome this sovereign debt crisis, fiscal austerity measures in many EA countries
have been implemented throughout the crisis (Corsetti 2012).
•
The severity of implementation of austerity measures has been particularly pronounced
in the periphery countries of the EA, particularly in Greece, Ireland and Portugal
(Theodoropoulou and Watt 2011) as well as Spain (Navarro 2012).
•
Amongst others, these measures have led to a significant increase of unemployment
levels in those four countries.
•
Given the exceptional magnitude of the crisis, this paper analyses the impact of the
crisis on citizens’ trust in their i) national government (NG), ii) national parliament
(NP), iii) European Commission (EC) and iv) European Parliament (EP).
3
5. 2.1
The consequences of citizens declining trust in the national
Government and Parliament – General Arguments
•
Sufficient trust is crucial for the legitimacy of a (policy-making) institution. In the
absence of trust this legitimacy is endangered (Kosfeld et al. 2005: 673; Kaltenthaler et
al. 2010: 1262).
Without sufficient trust citizens might commence to undermine the authority of the
(policy-making) institution (Kaltenthaler et al. 2010: 1261). This might ultimately lead
to an abolition of the (policy-making) institution (Giddens 1996: 166).
It would be worrisome for a (policy-making) institution once large numbers of citizens
start to distrust it (Kaltenthaler et al. 2010: 1262).
Concerning citizens trust in the national parliament an abrupt or steady decline of trust
from the long-term trends should be regarded as worrying (Newton 2001: 205).
Without sufficient trust i) citizens will try to hold back tax money, ii) young talented
graduates will not be willing to work for governmental institutions and iii) the overall
compliance with law will decrease (Nye 1997).
Trust in the national government is important for long-term fiscal consolidation of an
economy (Gyorffy 2007, Jonung 2013).
•
•
•
•
•
5
6. Excourse 1: Application to the current ongoing Euro Area Crisis
•
•
•
•
•
Without sufficient levels of citizens trust in the NG and NP the envisaged and often necessary
structural reforms (a.o. proposed by the Troika) such as labour market, welfare state and higher
education reforms, completion of the single market for services, reforms that aim at stimulating
investments in public and business intangible capital in Greece, Portugal and Spain will not be
successful. However, without reforms no fast fiscal consolidation possible.
The structural reforms should have been implemented in mutual consent (such as in Sweden in the
1990’s) and not in opposition with citizens in the EA’s periphery countries. Citizens will just
boycott implemented measures (hold back their tax money, stop complying with the law, vote
radical parties, participate in social unrest, etc …).
Rapid increase in unemployment rates, amongst others triggered by the implemented austerity
measures, is associated with a significant decline strong negative effect on citizens trust in national
governments and parliaments in EA’s periphery, endangering their political stability and fiscal
consolidation. But also Italy: low levels of trust endanger i) political stability and ii) prospects for
fiscal consolidation.
Vicious Circle: Without political stability private investors will not invest in EA’s periphery,
unemployment will further increase, trust will further decline or remain stagnant, further capital
flight in safe havens (e.g. large German cities).
One key to solving the Euro area crisis and the reestablishment of fiscal consolidation is the
reestablishment of citizens trust in the EA‘s periphery Spain, Greece, Portugal, Ireland, Cyprus but
also Italy.
6
7. 2.2
Driving factors of declining trust in national and
European governmental institutions?
• Stevenson and Wolfers (2011) show that unemployment is a key determinant of systemic
trust.
• Literature among popularity functions stress the importance of economic growth,
unemployment and inflation (Nannestad and Paldam 1994: 215-16, Bellucci and LewisBeck 2011: 192-94).
• Roth (2011) shows that a fast increase of Debt per GDP, when banks were aided/bailed
out, lead to a deterioration of citizens trust (e.g. case of Ireland in 2010).
7
9. 1. Model specification
The Baseline equation takes the following form:
Trust it = αi + β Unemployment it + Inflation it + Growth it + Debt it + Z it + wit
where i represents each country and t represents each time period. Trust it is the net trust
amount in national and EU institutions for country i during period t. Unemployment it,
Inflation it, Growth it, Debt it and Z it are respectively unemployment, inflation, growth of GDP
per capita and debt per GDP and important control variables, such as electorate dummy
variables for the national institutions and the European Parliament for country i during period
t or indicators of financial stress such as sovereign bond yields. The variable αi represents a
country-specific constant term and wit is the error term. Since we utilise an FGLS estimation
approach, our baseline estimation does not include time dummies as they are incompatible
with FGLS.
Reference: Roth, Nowak-Lehmann and Otter (2013). Crisis and Trust in National and European Union Institutions–Panel
Evidence for the EU, 1999 to 2012, EUDO/RSCAS Working Paper 2013/31 , European University Institute
9
10. 2. Research Design and Data
i)
Dependent Variable: Semester data on net trust in the NG, NP, EC and EP between 19992012. Concept of net trust introduced by Gärtner (1997: 488-89).
ii)
Country Sample: 27 European countries (12 EA-countries) from 1999-2012.
iii)
Analysis with estimation via Fixed-Effects DFGLS estimation.
iv)
Structural break in fall 2008 (full sample: 1999-2012; pre-crisis: spring 1999-spring
2008; crisis: autumn 2008-spring 2012)
v)
Data on unemployment, inflation (HICP) and sovereign debt yields from Eurostat
monthly statistics. Data for GDP, population, and debt over GDP from Eurostat quarterly
statistics (interpolated). Data on trust in NG, NP, EC and EP from the bi-annual
Eurobarometer (issued on behalf of EC). Data for election dummy from CEPPS 2011.
vi)
Matching strategy as proposed by Wälti (2012: 597). Correlates as high as 0.99 for
inflation and uneemployment and 0.95 for growth of GDP per capita with semesterly
data.
10
12. Figure 1.
Trust in the national government and European Commission in the EU15/27 (1999–2012)
Notes: NG = national government, EC = European Commission. Values are population weighted for the respective country
samples. In 1-2/2009, the special Standard EB 71.1 was used. As the survey item concerning trust in the NG was not included
in Standard EBs 52, 53, 54 or 58, the data for these four observation points respectively are missing. The dashed line
represents the start of the crisis in September 2008 and differentiates the pre-crisis from the crisis period. From 10-11/2004 to
9-10/2006, the EU-27 country sample consists of EU-25 countries excluding Romania and Bulgaria. From 4-5/2007 onwards,
Romania and Bulgaria are included. As the figure depicts net trust, all values above 0 indicate trust by a majority of the
respondents and all values below 0 show a lack of trust by the majority.
Sources: Standard EBs 51-78 and Special EB 71.1.
Reference: Roth, Nowak-Lehmann and Otter (2013). Crisis and Trust in National and European Union Institutions–Panel
Evidence for the EU, 1999 to 2012, EUDO/RSCAS Working Paper 2013/31 , European University Institute.
12
13. Figure 2.
Trust in national parliaments and the European Parliament in the EU15/27 (1999–2012)
Notes: NP = national parliament, EP = European Parliament. Values are population weighted for the respective country
samples. In 1-2/2009 the special Standard EB 71.1 was used. As the survey item concerning trust in the NP was not included
in Standard EBs 52, 53 or 58, the data for these three observation points respectively are missing. The dashed line represents
the start of the crisis in September 2008 and differentiates the pre-crisis from the crisis period. From 10-11/2004 to 910/2006, the EU-27 country sample consists of EU-25 countries excluding Romania and Bulgaria. From 4-5/2007 onwards,
Romania and Bulgaria are included. As the figure depicts net trust, all values above 0 indicate trust by a majority of the
respondents and all values below 0 show a lack of trust by the majority.
Sources: Standard EBs 51-78 and Special EB 71.1.
Reference: Roth, Nowak-Lehmann and Otter (2013). Crisis and Trust in National and European Union Institutions–Panel Evidence
for the EU, 1999 to 2012, EUDO/RSCAS Working Paper 2013/31 , European University Institute.
13
14. Table 1.
Net trust levels and changes in net trust in the EA12, EU15, NMS12 and EU27 (2008–12)
Trust
Level: 3-5/ 2008
Level: 11/ 2012
Changes: 11/ 2012 – 3-5/ 2008
EA12
NG/NP
-25/-16
-38/-34
-13/-18
EU15
NG/NP
-28/-17
-38/-33
-10/-16
NMS12
NG/NP
-44/-55
-51/-58
-7/-3
EU27
NG/NP
-31/-25
-40/-38
-9/-13
EA12
EC/EP
21/27
-7/-3
-28/-30
EU15
EC/EP
14/19
-10/-8
-24/-27
NMS12
EC/EP
34/38
22/24
-12/-14
EU27
EC/EP
19/23
-4/-1
-23/-24
Sample
Notes: EA = Euro Area, EU = European Union, NMS = New Member States, NG = National Government, NP = National
Parliament, EC = European Commission, EP = European Parliament. Values are population-weighted for the respective
country samples. As the table presents data on net trust, all values above 0 indicate trust by a majority of the respondents and
all values below 0 show a lack of trust by the majority. The periods still reflecting trust by a majority of citizens are shaded in
light grey. Values reflecting the strongest decline are shaded in dark grey.
Sources: Standard EBs 69 and 78.
Reference: Roth, Nowak-Lehmann and Otter (2013). Crisis and Trust in National and European Union Institutions–Panel
Evidence for the EU, 1999 to 2012, EUDO/RSCAS Working Paper 2013/31 , European University Institute.
14
15. Excourse 2: Low Levels of Systemic Trust and the Europe 2020 Strategy
i) In the EU citizens levels of systemic trust are too low in most transition countries and
in the Mediterannean countries for a modern economy to function efficiently and
remain competitive.
ii) These low levels of systemic trust, being associated with an overall poor governance
structure, represent a major problem for the competiveness and the long-term growth
prospectives within those countries.
iii) Key priorities of the European 2020 strategy such as higher employabiliy, higher
tertiary graduaton rates, higher business investments in R&D and overall intangible
capital can only be achieved if governance structures are modernized and ameloriated
and sufficient levels of systemic trust are established in transition and Mediterranean
countries.
iv) One key priority for the European 2020 startegy is to ameliorate the governance
structure (higher government efficiency, lower levels of corruption) in the transition
and Mediterranen countries (see here also Gros and Roth 2012).
15
16. Table 2.
Net trust levels and changes in net trust in the EA8 and EA4 and across selected EA12
countries (2008–12)
Sample/
Country
EA4
Levels: 3-5/2008
Levels: 11/2012
Changes: 11/2012 – 3-5/2008
NG/NP
3/10
-72/-72
-75/-82
EA8
NG/NP
-33/-23
-28/-24
5/-1
Spain
NG/NP
20/20
-75/-76
-95/-96
Greece
NG/NP
-31/-2
-84/-80
-53/-78
Portugal
NG/NP
-29/-3
-52/-50
-23/-47
Ireland
NG/NP
-14/-15
-58/-57
-44/-42
Italy
NG/NP
-59/-57
-60/-71
-1/-14
France
NG/NP
-38/-21
-35/-26
3/-5
Germany
NG/NP
-25/-15
-12/-1
13/14
EA4
EC/EP
38/37
-35/-30
-73/-67
EA8
EC/EP
16/22
1/6
-15/-16
Spain
EC/EP
42/46
-41/-41
-83/-87
Greece
EC/EP
13/21
-57/-42
-70/-63
Portugal
EC/EP
42/46
-1/1
-43/-45
Ireland
EC/EP
43/51
3/3
-40/-48
Italy
EC/EP
29/29
-2/1
-31/-28
France
EC/EP
11/19
4/9
-7/-10
Germany
EC/EP
6/18
-4/2
-10/-16
Trust
Notes: EA = euro area, NG = national government, NP = national parliament, EC = European Commission, EP = European
Parliament. The EA8 and EA4 country samples are population-weighted. The pronounced differences between the EA8 and
EA4, as well as the minimum and maximum values are shaded. Darker shading represents maximum values. Lighter shading
represents minimum values. As the table presents data on net trust, all values above 0 indicate trust by a majority of the
respondents and all values below 0 show a lack of trust by the majority.
Sources: Standard EBs 69 and 78.
Reference: Roth, Nowak-Lehmann and Otter (2013). Crisis and Trust in National and European Union Institutions–Panel
Evidence for the EU, 1999 to 2012, EUDO/RSCAS Working Paper 2013/31 , European University Institute.
16
17. Figure 3.
Trust in national and EU institutions in the EA4 (1999–2012)
Notes: The EA4 comprises Spain, Greece, Portugal and Ireland. NG = national government, NP = national parliament, EC =
European Commission, EP = European Parliament. Values are population-weighted. In 1-2/2009 the special Standard EB
71.1 was utilised. As the survey item concerning trust in the NP was not included in Standard EBs 52, 53 or 58, the data for
these three observation points respectively are missing. As the survey item concerning trust in the NG was not included in
Standard EBs 52, 53, 54 or 58, the data for these four observation points respectively are missing. The dashed line represents
the start of the crisis in September 2008 and differentiates the pre-crisis and crisis periods. As the figure depicts net trust, all
values above 0 indicate trust by a majority of the respondents and all values below 0 show a lack of trust by the majority.
Sources: Standard EBs 51-78 and Special EB 71.1.
Reference: Roth, Nowak-Lehmann and Otter (2013). Crisis and Trust in National and European Union Institutions–Panel Evidence
for the EU, 1999 to 2012, EUDO/RSCAS Working Paper 2013/31 , European University Institute.
17
18. Excourse 3: Comparing Net Trust vs. Net Support for the Euro in the EA-4
Notes: The data and time series depicted in above figure are based upon the data and time series utilized in the following three
working papers: Roth, F., Gros, D., Nowak-Lehmann D., F., 2012. Has the Financial Crisis eroded Citizens’ Trust in the
European Central Bank? – Panel Data Evidence for the Euro Area, 1999-2011, CEGE Discussion Papers 124, University of
Göttingen and Roth, F., Jonung,,L. and F. Nowak-Lehmann D. (2012). Public Support for the Single European Currency, the
Euro, 1990 to 2011. Does the financial crisis matter?, Working Paper 2012: 20, Department of Economics, University of Lund
and Roth, F., Nowak-Lehmann D., F., Otter, T., 2013. Crisis and Trust in National and European Governmental Institutions –
Panel Evidence for the EU from 1999 to 2012, RSCAS/EUDO Working Paper, European University Institute, forthcoming. The
EA-4 comprises Spain, Greece, Portugal and Ireland. NP = national parliament, EP = European Parliament, NG = National
Government, EC = European Commission, ECB = European Central Bank, Support Euro = Support for the European Monetary
Union and the euro. Values are population weighted. As the survey item concerning trust in the NP was no t included in Standard
EBs 52, 53 or 58, the data for these three observation points respectively are missing. As the survey item concerning trust i n the
NG was not included in Standard EBs 52, 53, 54 or 58, the data for these four observation points respe ctively are missing. The
dashed line represents the start of the crisis in September 2008 and differentiates the pre-crisis and crisis periods. As the figure
depicts net trust and net support, all values above 0 indicate trust and support by a majority of the respondents and all values
below 0 a lack of trust and support by the majority.
Sources: Standard EBs 51-78.
19. Figure 4.
Trust in national and EU institutions in the EA-8 (1999–2012)
Notes: The EA8 comprises Germany, France, Italy, Austria, Finland, Belgium, the Netherlands and Luxembourg. NG =
national government, NP = national parliament, EC = European Commission, EP = European Parliament. Values are
population weighted. In 1-2/2009 the special Standard EB 71.1 was used. As the survey item concerning trust in the NP was
not included in Standard EBs 52, 53 or 58, the data for these three observation points respectively are missing. As the survey
item concerning trust in the NG was not included in Standard EBs 52, 53, 54 or 58, the data for these four observation points
respectively are missing. The dashed line represents the start of the crisis in September 2008 and differentiates the pre-crisis
and crisis periods. As the figure depicts net trust, all values above 0 indicate trust by a majority of the respondents and all
values below 0 show a lack of trust by the majority.
Sources: Standard EBs 51-78 and Special EB 71.1.
Reference: Roth, Nowak-Lehmann and Otter (2013). Crisis and Trust in National and European Union Institutions–Panel
Evidence for the EU, 1999 to 2012, EUDO/RSCAS Working Paper 2013/31 , European University Institute.
19
20. Figure 5.
Scatter plot between delta unemployment and delta trust
Trust NP
50
Trust NG
de
fr
it
fr
pt
-100 -50
ie
it
pt
gr
ie
gr
es
es
cy
cy
Trust EP
0
50
Trust EC
de
fr
0
it
ie
pt
cy
-10
fr
de
it
-100 -50
Delta Trust (2012-2008)
0
de
10
pt
gr
es
20
-10
0
cy
ie
gr
es
10
20
Delta Unemployment (2012-2008)
+ Non-EA-12
EA-12
Fitted Values EA-12
Graphs by Trust
Notes: Fitted regression line only for EA12 country sample.
Sources: Standard EB 69 & 78 and Eurobarometer data.
Reference: Roth, Nowak-Lehmann and Otter (2013). Crisis and Trust in National and European Union Institutions–Panel
Evidence for the EU, 1999 to 2012, EUDO/RSCAS Working Paper 2013/31 , European University Institute.
20
22. Table 3.
Unemployment and trust in the NG and NP, fixed-effects DFGLS estimations, EA12
1
2
3
4
5
6
NG
FS
NG
BC
NG
C
NP
FS
NP
BC
NP
C
-3.9***
-3.5*
-8.0***
-3.2***
-2.5*
-7.3***
(0.93)
(1.78)
(1.82)
(0.75)
(1.40)
(1.28)
Inflation
Yes
Yes
Yes
Yes
Yes
Yes
Growth
Yes
Yes
Yes
Yes
Yes
Yes
Government debt
Yes
Yes
Yes
Yes
Yes
Yes
Election dummy
Yes
Yes
Yes
Yes
Yes
Yes
Durbin-Watson statistic
2.11
1.82
2.03
2.10
1.84
2.08
Adjusted R-squared
0.82
0.81
0.86
0.81
0.77
0.88
Country fixed effects
Yes
Yes
Yes
Yes
Yes
Yes
Control for endogeneity
Yes
Yes
Yes
Yes
Yes
Yes
Elimination of first order autocorrelation
Yes
Yes
Yes
Yes
Yes
Yes
Observations
Number of countries
248
12
143
12
105
12
248
12
143
12
105
12
Dependent variable
Period
Unemployment
Notes: FS=Full Sample; BC=Before Crisis; C=Crisis; NG=National Government; NP= National Parliament. ***p<0.01,
**p<0.05 and *p<0.1. Data on growth of GDP per capita are missing for Greece from the 2nd semester of 2011 onwards.
Thus, instead of 108, only 105 observations can be depicted. Data on the lagged first differences for debt over GDP are
missing for the four time periods 1999-2000 and for Greece and Malta for the first semester of 2001.
Reference: Roth, Nowak-Lehmann and Otter (2013). Crisis and Trust in National and European Union Institutions–Panel
Evidence for the EU, 1999 to 2012, EUDO/RSCAS Working Paper 2013/31 , European University Institute.
22
23. Table 5.
Sensitivity analysis for the baseline fixed effects DFGLS model, EA12
Row
Specification change
NG
NP
EC
EP
Obs.
Cou.
Baseline regression
1
-8.0***
-7.3***
-3.1**
-3.4***
105
12
Exclusion of outliers
2
Spain
3
Spain+Greece
4
Spain+Greece+Portugal
No change
-4.4
-2.5
-1.9
-7.3***
-6.3**
-6.1**
0.8
1.2
1.7
0.7
1.2
1.3
96
90
81
11
10
9
5
-2.8
-6.4**
0.1
0.1
72
8
EA4
Restruc. of country sample
6
EU15
-7.1***
-6.4***
-2.7***
-3.2***
132
15
7
EU27
-1.1
-1.1
-2.1***
-2.3***
240
27
8
EU27 - Spain
0.2
-0.1
-1.6**
-1.7**
231
26
9
10
EU27 - EA4
NMS12
-0.6
0.8
-0.1
2.3
-1.5**
-1.6*
-1.6**
-1.7*
207
108
23
12
Restruc. of time sample
11
9-11/2007-11/2012
-6.0***
-5.4***
-2.4***
-2.8***
129
12
12
13
10-11/2008-5/2012
10-11/2008-11/2011
-6.2***
-6.7**
-5.8***
-6.3***
-1.6
-2.4
-1.7
-2.8**
94
83
12
12
14
15
10-11/2008-5/2011
10-11/2008-11-12/2010
-5.5
-9.1**
-5.8**
-8.5***
-2.3
-1.7
-3.0*
-2.0
72
60
12
12
16
Sov. bond yields
Alt. estimation strategies
-8.9***
-7.4***
-3.0***
-3.6***
105
12
17
18
OLS+TD
OLS+TD+SBY
-6.4***
-6.4***
-5.8***
-5.7***
-3.3**
-3.1**
-3.7***
-3.5**
117
117
12
12
19
OLS+TD+SBY+EB74
72
12
Incl. of additional variables
-5.6***
-4.9***
-1.8
-2.3
Various alterations
20
Excl. special EB 71.1
-6.7***
-6.2***
-2.5***
-3.1***
93
12
21
22
-3.9***
-7.6***
-3.5***
-6.7***
-1.3**
-3.4***
-1.6***
-3.4***
105
105
12
12
Net trust vs. trust
Inclusion of TD
Notes: EU=European Union, NMS=New Member States; NG=National Government; NP=National Parliament;
EC=European Commission; EP=European Parliament; EA=Euro Area; TD=Time Dummies; SBY=Sovereign Bond Yields.
EA-4 comprises Spain, Greece, Portugal and Ireland. ***p<0.01, **p<0.05 and *p<0.1.
Reference: Roth, Nowak-Lehmann and Otter (2013). Crisis and Trust in National and European Union Institutions–Panel Evidence for
23
the EU, 1999 to 2012, EUDO/RSCAS Working Paper 2013/31 , European University Institute.
24. Coherence with previous empirical results
Our econometric results are in line with the empirical findings of Stevenson and
Wolfers (2011) who find that unemployment has a strong and negative effect on trust
in public institutions. In almost all regression results unemployment is a powerful
predictor of trust. When analysing the impact of an increase of unemployment on trust
in the U.S. congress from 1972 to 2010 the authors find a significant and negative
effect of unemployment on trust with the size of the coefficient ranging from -0.89 to 1.36. The range of size of the reported coefficient is only slightly smaller than our
estimated coefficient for trust in the national parliament of -1.4 This coefficient range
is however significantly smaller compared to our coefficient of -3.5 throughout the
crisis period.
24
25. VI. Conclusions
Concerning trust in the NG and NP, the crisis has not led to a universal
decline of trust. The core countries from the EA12 such as Germany, Austria
and Finland have actually higher trust levels in 11/2012 than before the crisis
in 3-5/2008. The opposite is true for the periphery countries for the EA12
(Spain, Greece, Portugal and Ireland) in which trust in the NG and NP
declined significantly. These countries have left their long-term trust trends.
Thus the alleged trust crisis in the NG and NP is not an EU-scale crisis, but
primarily manifests in the periphery countries of the EA12.
25
26. i)
When analysing an EU15/27 country sample, one detects moderate declines in
trust in the national government and parliament. This overall decline in populationweighted trust in trust trends in the national government and parliament has strongly been
driven by the countries of the EA12.
ii)
Whereas in the core of the EA12 trust in the national government and
parliament has actually increased or remained unchanged, in its periphery trust in the
national government and parliament has fallen significantly and steadily since the start of
the crisis. This sharp and steady fall in the periphery explains the overall moderate
decrease of population weighted trust in the national government and parliament in the
EA12, EU15 and EU27.
iii)
Whereas the population-weighted trust trends in the core countries of the EA12
have followed their pre-crisis paths throughout the crisis, the population-weighted trends
in the periphery countries have departed from their pre-crisis paths since the start of the
crisis. This phenomenon applies in particular to the case of Spain.
iv)
When analysing the drivers of trust with the help of a FE-DFGLS estimation
within an EA12 country sample and timeframe from 1999-2012, an increase of
unemployment turns out to be significantly and negatively associated with trust in the
national government and parliament.
26
27. v)
The highly significant and negative relationship between unemployment and
trust is strongly driven by the crisis period (2008-2012). The coefficients for trust in the
NG and NP are twice as high in the crisis period as in the pre-crisis period.
vi)
Within the EA12, whereas this highly significant and negative relationship
between unemployment and trust the NG throughout the crisis is strongly driven by the
country case of Spain, in which a significant increase in the unemployment rate is strongly
associated with a decrease of trust, the relationship between unemployment and trust in the
NP remains highly robust even after the exclusion of Spain from the EA12 country sample.
vii)
Highly significant and negative relationship between unemployment and trust in
the NG and NP remains robust throughout the whole crisis period.
viii)
The relationship between unemployment and trust in the NP holds strongly for
an EA12 country sample. Within the EA12, in times of crisis, a 1 percent increase in
unemployment rates is associated with a decrease of net trust of -7.3 percentage points (a
decrease of trust of -3.5 percentage points).
27
28. VII. Policy Conclusions
i)
Unemployment rates of 25% in Spain and Greece in the aftermath of the financial crisis are
politically and socially unsustainable. Reducing these high unemployment rates should be given
top priority in order to regain citizens trust in the national government and parliament.
Regaining citizens trust in the EA periphery is necessary to secure political stability and
successfully implement the structural reform agenda to regain fiscal consolidation.
ii) Necessary structural reforms such as the amelioration of the quality of governance, labour
markets, welfare state and higher educational reforms, the completion of the single market in
services have to be accompanied with growth enhancing investments. These investments
would ideally focus on intangible capital: modernization of (higher) education, public-private
partnership schemes to enhance business intangibles and modernization of governance
structures. The reforms should by no means abolish fundamental and economically important
labour rights, should not result in „wage and social security dumping“, thus they should not
endanger the fundamental agreements of the European Social Model and should be socially and
politically sustainable.
iii) As governments of periphery countries cannot stem these investments themselves and as in
times of liquidity crisis private investor‘s confidence is shattered two potential investment plans
are possible: 1) either a large scale investment (Marshall) plan for the EA periphery countries
(EIB 2012; DGB 2012) financed e.g. by FT-Tax, EU-Tax (Fiscal capacity mechanism), Euro
Solidarity Tax. Investment would be based on public and public-private partnership investment
schemes, or 2) a European Investment Guarantee Scheme (EIGS) which would guarantee
private sector investments in the EA periphery potentially backed by the EIB (Zuleeg 2013).
iv) Public investments in Germany into public infrastructure, higher education institutions, publicprivate partnerships schemes for business intangibles (Bosch 2013, Fratzscher 2013). Germany
and other EA creditor countries should reduce austerity measures and should increase its budget
deficit to 3% to take pressure from the periphery countries (De Grauwe 2012).
28
30. Figure A1.
Net trust in the national government, by EU27 country (1999–2012)
Belgium
Bulgaria
Cyprus
Czech Rep
Denmark
Estonia
Finland
France
Germany
Great Britain
Greece
Hungary
Ireland
Italy
Latvia
Lithuania
Luxembourg
Malta
Netherlands
Poland
Portugal
Romania
Slovakia
Slovenia
Spain
Sweden
-100
-50
0
50
-100
-50
0
50
-100
-50
0
50
Austria
2005
2010
-100
-50
0
50
2000
2000
2005
2010
2000
2005
2010
2000
2005
2010
2000
2005
2010
2000
2005
2010
2000
2005
2010
Year
Notes: Y-axis displays a range from -100 to +50. For the EU-15 countries, the data commence in spring 1999
(EB 51). For the 12 new member states, the data commence in 10-11/2004 (EB 62), even for Romania and
Bulgaria. Data for EBs 52-54 and EB 58 are missing and have been automatically been interpolated by Stata. As
the figure depicts net trust, all values below 0 indicate a lack of trust by the majority of respondents. In the case
of Great Britain, data from EBs 51-69 are for Great Britain, whereas data from EB 70 onwards are for the UK.
Sources: Standard EBs 51-78 and Special EB 71.1.
Reference: Roth, Nowak-Lehmann and Otter (2013). Crisis and Trust in National and European Union Institutions–Panel
Evidence for the EU, 1999 to 2012, EUDO/RSCAS Working Paper 2013/31 , European University Institute.
30
31. Figure A2.
Net trust in the national parliament, by EU27 country (1999–2012)
Belgium
Bulgaria
Cyprus
Czech Rep
Denmark
Estonia
Finland
France
Germany
Great Britain
Greece
Hungary
Ireland
Italy
Latvia
Lithuania
Luxembourg
Malta
Netherlands
Poland
Portugal
Romania
Slovakia
Slovenia
Spain
Sweden
-100
-50
0
50
-100
-50
0
50
-100
-50
0
50
Austria
2005
2010
-100
-50
0
50
2000
2000
2005
2010
2000
2005
2010
2000
2005
2010
2000
2005
2010
2000
2005
2010
2000
2005
2010
Year
Notes: Y-axis displays a range from -100 to +50. For the EU-15 countries, the data commence in spring 1999
(EB 51). For the 12 new member states, the data commence in 10-11/2004 (EB 62), even for Romania and
Bulgaria. Data for EBs 52-53 and EB 58 are missing and have been automatically been interpolated by Stata. As
the figure depicts net trust, all values below 0 indicate a lack of trust by the majority of respondents. In the case
of Great Britain, data from EBs 51-69 are for Great Britain, whereas data from EB 70 onwards are for the UK.
Sources: Standard EBs 51-78 and Special EB 71.1.
Reference: Roth, Nowak-Lehmann and Otter (2013). Crisis and Trust in National and European Union Institutions–Panel
Evidence for the EU, 1999 to 2012, EUDO/RSCAS Working Paper 2013/31 , European University Institute.
31