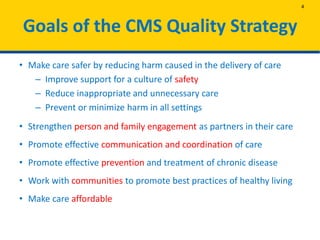
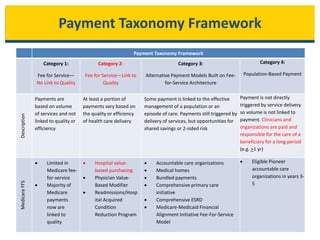
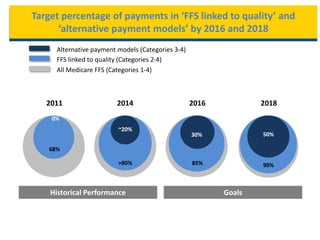
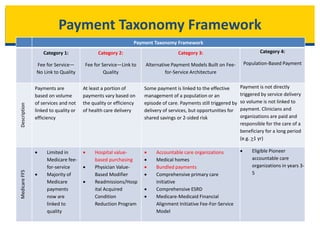
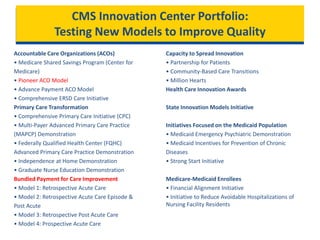
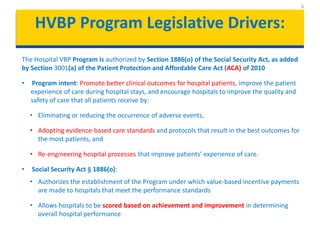
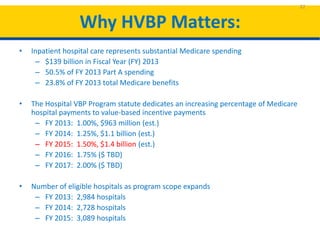
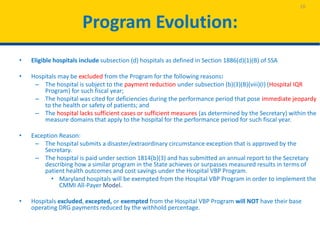
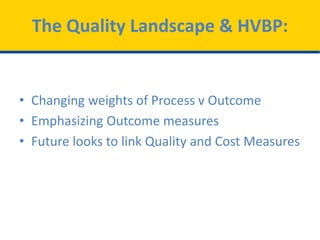
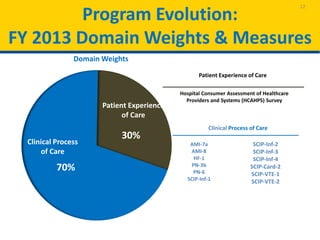
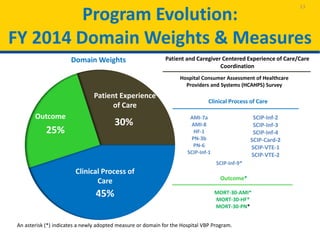
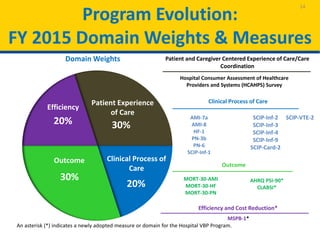
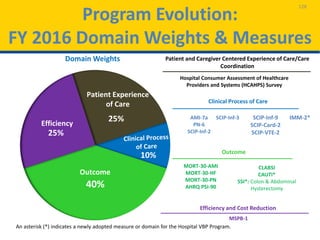
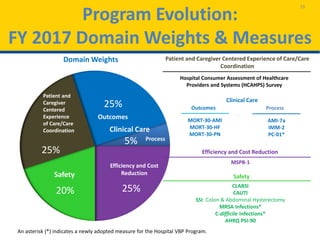
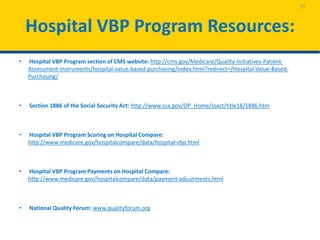
Delivery System Reform and the
Hospital Value-Based Purchasing
(HVBP) Program
Lemeneh Tefera MD MSc
Medical Officer
Value-Based Purchasing
Division of Value Incentives
& Quality Reporting (VIQR)
Centers for Clinical Standards
and Quality (CCSQ)
May 15th, 2015
SAGES Quality Summit
The Changing Quality Landscape
and Hospital Value Based Purchasing-
Linking Quality and Cost
in Delivery System Reform
Objective:
• Provide an overview of the Hospital Value-Based Purchasing (HVBP)
program
• Give CMS Delivery System Reform Overview:
– Highlight the CMS Quality Strategy
– Show linkages across CMS programs
– Give an Overview of Delivery System Reform (DSR)
– Strengthen audience understanding of HVBP
– Introduce a working definition of Value-Based Purchasing
3
HVBP is the first federally implemented pay-for-
performance program impacting the acute
inpatient care setting.
Goals of the CMS Quality Strategy
• Make care safer by reducing harm caused in the delivery of care
– Improve support for a culture of safety
– Reduce inappropriate and unnecessary care
– Prevent or minimize harm in all settings
• Strengthen person and family engagement as partners in their care
• Promote effective communication and coordination of care
• Promote effective prevention and treatment of chronic disease
• Work with communities to promote best practices of healthy living
• Make care affordable
4
Step One-
Let us recognize
that we have a problem
Patient
Cardiologist
PCP
Surgeon GI
Lab
Neuro
Social
workPathologist
Oncologist
IR
Urologist
Phone call
Email
Procedure
Appointment
“Tumor is out!”
Press MJ. Instant Replay.
NEJM 2014
Patient
Cardiologist
PCP
Surgeon GI
Lab
Neuro
Social
workPathologist
Oncologist
IR
Urologist
Phone call
Email
Procedure
Appointment
1 patient, 11 clinicians, 80 days
PCP calls to patient: 12
PCP calls to clinicians: 8
PCP emails to clinicians: 32
Procedures: 5
Appointments: 11
Appointments with PCP: 0
Historical Observations:
That any sane nation, having observed that you could provide for
the supply of bread by giving bakers a pecuniary interest in baking
for you,
should go on to give a surgeon a pecuniary interest in cutting off
your leg,
is enough to make one despair of political humanity.
But that is precisely what we have done.
And the more appalling the mutilation, the more the mutilator is
paid.
(Shaw, The Doctor’s Dilemma 1909)
In three words, our vision for improving health delivery is about better, smarter, healthier.
If we find better ways to pay providers, deliver care, and distribute information:
 Encourage the integration and coordination of clinical care services
 Improve population health
 Promote patient engagement through shared decision making
Incentives
 Create transparency on cost and quality information
 Bring electronic health information to the point of care for meaningful use
Focus Areas Description
Care Delivery
Information
 Promote value-based payment systems
– Test new alternative payment models
– Increase linkage of Medicaid, Medicare FFS, and other payments to value
 Bring proven payment models to scale
Better Care. Smarter Spending.
Healthier People
 We can receive better care.
 We can spend our health dollars more wisely.
 We can have healthier communities, a healthier economy, and a healthier country.
CMS Authorized Programs & Activities
CMS
HHS
Survey &
Cert.
Payment
Value-
based
Purchasing
Quality
Improvement
Clinical
Standards
Quality &
Public
Reporting
Coverage
Program
Integrity
CMMI &
Medicaid
Reducing & Preventing Health Care Associated Infections
Reducing & Preventing Adverse Drug Events
Community Living Council
Multiple Chronic Conditions
National Alzheimer’s Project Act
Partnership for Patients
Million Hearts
National Quality Strategy
Data.gov
Coverage of services
Physician Feedback report
Quality Resource Utilization
Report
Hospital Readmissions
Reduction Program
Health Care Associated
Conditions Program
ESRD QIP
Hospital VBP
Physician value modifier
Plans for Skilled Nursing
Facility and Home Health
Agencies,
Ambulatory Surgical
Centers
QIOs
ESRD Networks
Hospital Inpatient Quality Hospital Outpatient
In-patient psychiatric hospitals
Cancer hospitals
Nursing homes
Home Health Agencies
Long-term Care Acute Hospitals
In-patient rehabilitation facilities
Hospices
Accountable Care Organizations
Community Based Transitions Care
Program
Dual eligible coordination
Care model demonstrations & projects
1115 Waivers
Hospitals, Home Health
Agencies, Hospices, ESRD
facilities
National & Local decisions
Mechanisms to support
innovation (CED, parallel
review, other)
Target surveys
Quality Assurance Performance
Improvement
Fraud & Abuse Enforcement
Hospital Quality
Reporting
• Medicare and
Medicaid EHR
Incentive Program
• PPS-Exempt Cancer
Hospitals
• Inpatient
Psychiatric Facilities
• Inpatient Quality
Reporting
• Outpatient Quality
Reporting
• Ambulatory
Surgical Centers
Physician Quality
Reporting
• Medicare and
Medicaid EHR
Incentive Program
• PQRS
• eRx quality
reporting
PAC and Other
Setting Quality
Reporting
• Inpatient
Rehabilitation
Facility
• Nursing Home
Compare Measures
• LTCH Quality
Reporting
• ESRD QIP
• Hospice Quality
Reporting
• Home Health
Quality Reporting
Payment Model
Reporting
• Medicare Shared
Savings Program
• Hospital Value-
based Purchasing
• Physician
Feedback/Value-
based Modifier*
“Population” Quality
Reporting
• Medicaid Adult
Quality Reporting*
• CHIPRA Quality
Reporting*
• Health Insurance
Exchange Quality
Reporting*
• Medicare Part C*
• Medicare Part D*
11
CMS Quality Programs
* Denotes that the program did not meet the statutory inclusion criteria for pre-rulemaking, but was included to foster alignment of
program measures.
Historical Observations:
That any sane nation, having observed that you could provide for the
supply of bread by giving bakers a pecuniary interest in baking for you,
should go on to give a surgeon a pecuniary interest in cutting off your leg,
is enough to make one despair of political humanity.
But that is precisely what we have done.
And the more appalling the mutilation, the more the mutilator is paid
(Shaw, The Doctor’s Dilemma 1909)
Patient
Cardiologist
PCP
Surgeon GI
Lab
Neuro
Social
workPathologist
Oncologist
IR
Urologist
Phone call
Email
Procedure
Appointment
“Tumor is out!”
Press MJ. Instant Replay.
NEJM 2014
Payment Taxonomy Framework
Category 1:
Fee for Service—
No Link to Quality
Category 2:
Fee for Service—Link to
Quality
Category 3:
Alternative Payment Models Built on Fee-
for-Service Architecture
Category 4:
Population-Based Payment
Description
Payments are
based on volume
of services and not
linked to quality or
efficiency
At least a portion of
payments vary based on
the quality or efficiency
of health care delivery
Some payment is linked to the effective
management of a population or an
episode of care. Payments still triggered by
delivery of services, but opportunities for
shared savings or 2-sided risk
Payment is not directly
triggered by service delivery
so volume is not linked to
payment. Clinicians and
organizations are paid and
responsible for the care of a
beneficiary for a long period
(e.g. >1 yr)
MedicareFFS
 Limited in
Medicare fee-
for-service
 Majority of
Medicare
payments
now are
linked to
quality
 Hospital value-
based purchasing
 Physician Value-
Based Modifier
 Readmissions/Hosp
ital Acquired
Condition
Reduction Program
 Accountable care organizations
 Medical homes
 Bundled payments
 Comprehensive primary care
initiative
 Comprehensive ESRD
 Medicare-Medicaid Financial
Alignment Initiative Fee-For-Service
Model
 Eligible Pioneer
accountable care
organizations in years 3-
5
New Goals and Timeline for Moving
Medicare from Rewarding Volume to Value
January 2015 Announcement
• HHS Secretary Sylvia M. Burwell announced measurable goals and a timeline to move the
Medicare program, and the health care system at large, toward paying providers based on
the quality, rather than the quantity of care they give patients
• First time in the history of the program that explicit goals for alternative payment models and
value-based payments set for Medicare
• Creation of national Health Care Payment Learning & Action Network to accelerate the
transition and foster collaboration between private payers, employers, providers, consumers,
and state/federal partners
Goals
1. Alternative Payment Models:
1. 30% of Medicare payments are tied to quality or value through alternative payment
models by the end of 2016
2. 50% by the end of 2018
2. Linking FFS Payments to Quality/Value:
1. 85% of all Medicare fee-for-service payments are tied to quality or value by 2016
2. 90% by the end of 2018
Next Steps for HHS to Encourage Value-Based Payments
within the Medicare FFS system
16
 Goal 1: 30% of Medicare payments are tied to quality or value through
alternative payment models (categories 3-4) by the end of 2016,
 and 50% by the end of 2018
 Goal 2: 85% of all Medicare FFS tied to quality or value (categories 2-4) by
the end of 2016,
 and 90% by the end of 2018
Goals
Purpose  Set internal goals for HHS
 Invite private sector payers to match or exceed HHS goals
Stakeholders
 Consumers
 Businesses
 Payers
 Providers
 State and federal partners
Next steps
 Testing of new models and expansion of existing models will be critical
to reaching incentive goals
 Creation of a Health Care Payment Learning and Action Network to align
incentives
Target percentage of Medicare FFS payments
linked to quality and alternative payment
models in 2016 and 2018
2016
All Medicare FFS (Categories 1-4)
FFS linked to quality (Categories 2-4)
Alternative payment models (Categories 3-4)
2018
50%
85%
30%
90%
2016
30%
85%
2018
50%
90%
Target percentage of payments in ‘FFS linked to quality’ and
‘alternative payment models’ by 2016 and 2018
2014
~20%
>80%
2011
0%
68%
GoalsHistorical Performance
All Medicare FFS (Categories 1-4)
FFS linked to quality (Categories 2-4)
Alternative payment models (Categories 3-4)
Payment Taxonomy Framework
Category 1:
Fee for Service—
No Link to Quality
Category 2:
Fee for Service—Link to
Quality
Category 3:
Alternative Payment Models Built on Fee-
for-Service Architecture
Category 4:
Population-Based Payment
Description
Payments are
based on volume
of services and not
linked to quality or
efficiency
At least a portion of
payments vary based on
the quality or efficiency
of health care delivery
Some payment is linked to the effective
management of a population or an
episode of care. Payments still triggered by
delivery of services, but opportunities for
shared savings or 2-sided risk
Payment is not directly
triggered by service delivery
so volume is not linked to
payment. Clinicians and
organizations are paid and
responsible for the care of a
beneficiary for a long period
(e.g. >1 yr)
MedicareFFS
 Limited in
Medicare fee-
for-service
 Majority of
Medicare
payments
now are
linked to
quality
 Hospital value-
based purchasing
 Physician Value-
Based Modifier
 Readmissions/Hosp
ital Acquired
Condition
Reduction Program
 Accountable care organizations
 Medical homes
 Bundled payments
 Comprehensive primary care
initiative
 Comprehensive ESRD
 Medicare-Medicaid Financial
Alignment Initiative Fee-For-Service
Model
 Eligible Pioneer
accountable care
organizations in years 3-
5
CMS Innovation Center Portfolio:
Testing New Models to Improve Quality
Accountable Care Organizations (ACOs)
• Medicare Shared Savings Program (Center for
Medicare)
• Pioneer ACO Model
• Advance Payment ACO Model
• Comprehensive ERSD Care Initiative
Primary Care Transformation
• Comprehensive Primary Care Initiative (CPC)
• Multi-Payer Advanced Primary Care Practice
(MAPCP) Demonstration
• Federally Qualified Health Center (FQHC)
Advanced Primary Care Practice Demonstration
• Independence at Home Demonstration
• Graduate Nurse Education Demonstration
Bundled Payment for Care Improvement
• Model 1: Retrospective Acute Care
• Model 2: Retrospective Acute Care Episode &
Post Acute
• Model 3: Retrospective Post Acute Care
• Model 4: Prospective Acute Care
Capacity to Spread Innovation
• Partnership for Patients
• Community-Based Care Transitions
• Million Hearts
Health Care Innovation Awards
State Innovation Models Initiative
Initiatives Focused on the Medicaid Population
• Medicaid Emergency Psychiatric Demonstration
• Medicaid Incentives for Prevention of Chronic
Diseases
• Strong Start Initiative
Medicare-Medicaid Enrollees
• Financial Alignment Initiative
• Initiative to Reduce Avoidable Hospitalizations of
Nursing Facility Residents
HVBP Program Legislative Drivers:
The Hospital VBP Program is authorized by Section 1886(o) of the Social Security Act, as added
by Section 3001(a) of the Patient Protection and Affordable Care Act (ACA) of 2010
• Program intent: Promote better clinical outcomes for hospital patients, improve the patient
experience of care during hospital stays, and encourage hospitals to improve the quality and
safety of care that all patients receive by:
• Eliminating or reducing the occurrence of adverse events,
• Adopting evidence-based care standards and protocols that result in the best outcomes for
the most patients, and
• Re-engineering hospital processes that improve patients’ experience of care.
• Social Security Act § 1886(o):
• Authorizes the establishment of the Program under which value-based incentive payments
are made to hospitals that meet the performance standards
• Allows hospitals to be scored based on achievement and improvement in determining
overall hospital performance
6
Why HVBP Matters:
• Inpatient hospital care represents substantial Medicare spending
– $139 billion in Fiscal Year (FY) 2013
– 50.5% of FY 2013 Part A spending
– 23.8% of FY 2013 total Medicare benefits
• The Hospital VBP Program statute dedicates an increasing percentage of Medicare
hospital payments to value-based incentive payments
– FY 2013: 1.00%, $963 million (est.)
– FY 2014: 1.25%, $1.1 billion (est.)
– FY 2015: 1.50%, $1.4 billion (est.)
– FY 2016: 1.75% ($ TBD)
– FY 2017: 2.00% ($ TBD)
• Number of eligible hospitals as program scope expands
– FY 2013: 2,984 hospitals
– FY 2014: 2,728 hospitals
– FY 2015: 3,089 hospitals
22
Program Evolution:
• Eligible hospitals include subsection (d) hospitals as defined in Section 1886(d)(1)(B) of SSA
• Hospitals may be excluded from the Program for the following reasons:
– The hospital is subject to the payment reduction under subsection (b)(3)(B)(viii)(I) (Hospital IQR
Program) for such fiscal year;
– The hospital was cited for deficiencies during the performance period that pose immediate jeopardy
to the health or safety of patients; and
– The hospital lacks sufficient cases or sufficient measures (as determined by the Secretary) within the
measure domains that apply to the hospital for the performance period for such fiscal year.
• Exception Reason:
– The hospital submits a disaster/extraordinary circumstance exception that is approved by the
Secretary.
– The hospital is paid under section 1814(b)(3) and has submitted an annual report to the Secretary
describing how a similar program in the State achieves or surpasses measured results in terms of
patient health outcomes and cost savings under the Hospital VBP Program.
• Maryland hospitals will be exempted from the Hospital VBP Program in order to implement the
CMMI All-Payer Model.
• Hospitals excluded, excepted, or exempted from the Hospital VBP Program will NOT have their base
operating DRG payments reduced by the withhold percentage.
10
The Quality Landscape & HVBP:
• Changing weights of Process v Outcome
• Emphasizing Outcome measures
• Future looks to link Quality and Cost Measures
Program Evolution:
FY 2013 Domain Weights & Measures
12
Outcome
70%
30%
Patient Experience of Care
Hospital Consumer Assessment of Healthcare
Providers and Systems (HCAHPS) Survey
Clinical Process of Care
AMI-7a
AMI-8
HF-1
PN-3b
PN-6
SCIP-Inf-1
Domain Weights
SCIP-Inf-2
SCIP-Inf-3
SCIP-Inf-4
SCIP-Card-2
SCIP-VTE-1
SCIP-VTE-2
Clinical Process
of Care
Patient Experience
of Care
Program Evolution:
FY 2014 Domain Weights & Measures
13
Outcome
30%
45%
25%
Patient and Caregiver Centered Experience of Care/Care
Coordination
Hospital Consumer Assessment of Healthcare
Providers and Systems (HCAHPS) Survey
Outcome*
MORT-30-AMI*
MORT-30-HF*
MORT-30-PN*
Domain Weights
An asterisk (*) indicates a newly adopted measure or domain for the Hospital VBP Program.
Clinical Process of Care
AMI-7a
AMI-8
HF-1
PN-3b
PN-6
SCIP-Inf-1
SCIP-Inf-2
SCIP-Inf-3
SCIP-Inf-4
SCIP-Card-2
SCIP-VTE-1
SCIP-VTE-2
SCIP-Inf-9*
Outcome
Patient Experience
of Care
Clinical Process of
Care
Program Evolution:
FY 2015 Domain Weights & Measures
14
Outcome
30%
20%
30%
20%
Patient Experience
of Care
Clinical Process of
Care
Outcome
Efficiency
Patient and Caregiver Centered Experience of Care/Care
Coordination
Hospital Consumer Assessment of Healthcare
Providers and Systems (HCAHPS) Survey
Outcome
MORT-30-AMI
MORT-30-HF
MORT-30-PN
Domain Weights
An asterisk (*) indicates a newly adopted measure or domain for the Hospital VBP Program.
Clinical Process of Care
AMI-7a
AMI-8
HF-1
PN-3b
PN-6
SCIP-Inf-1
SCIP-Inf-2
SCIP-Inf-3
SCIP-Inf-4
SCIP-Inf-9
SCIP-Card-2
SCIP-VTE-2
Efficiency and Cost Reduction*
MSPB-1*
AHRQ PSI-90*
CLABSI*
Program Evolution:
FY 2016 Domain Weights & Measures
128
Outcome
25%
10%
40%
25%
Patient Experience
of Care
Outcome
Efficiency
Patient and Caregiver Centered Experience of Care/Care
Coordination
Hospital Consumer Assessment of Healthcare
Providers and Systems (HCAHPS) Survey
Outcome
MORT-30-AMI
MORT-30-HF
MORT-30-PN
AHRQ PSI-90
Domain Weights
An asterisk (*) indicates a newly adopted measure or domain for the Hospital VBP Program.
Clinical Process of Care
AMI-7a
PN-6
SCIP-Inf-2
SCIP-Inf-3 SCIP-Inf-9
SCIP-Card-2
SCIP-VTE-2
IMM-2*
Efficiency and Cost Reduction
MSPB-1
CLABSI
CAUTI*
SSI*: Colon & Abdominal
Hysterectomy
Program Evolution:
FY 2017 Domain Weights & Measures
16
Outcome
5%
25%20%
25%
25%
Outcomes
Process
Efficiency and Cost
ReductionSafety
Patient and
Caregiver
Centered
Experience
of Care/Care
Coordination
Patient and Caregiver Centered Experience of Care/Care
Coordination
Hospital Consumer Assessment of Healthcare
Providers and Systems (HCAHPS) Survey
Clinical Care
Outcomes Process
MORT-30-AMI
MORT-30-HF
MORT-30-PN
AMI-7a
IMM-2
PC-01*
Safety
CLABSI
CAUTI
SSI: Colon & Abdominal Hysterectomy
MRSA Infections*
C-difficile Infections*
AHRQ PSI-90
Efficiency and Cost Reduction
MSPB-1
Domain Weights
Clinical Care
An asterisk (*) indicates a newly adopted measure for the Hospital VBP Program.
Key Monitoring & Evaluation Findings:
• Hospitals showing modest improvement
– Teaching hospitals showed modest improvement
and performed slightly above national average in
FY 2014 but not in FY 2013
– In FY 2014, hospitals showing improvement and
performing above the national average TPS were
federal government and non-profit hospitals
– Safety Net Hospitals not disproportionately
affected
30
Statewide Variation in TPS: FY 2013
• On average, hospitals located in 24 states
scored above the national average TPS in FY13
31
Statewide Variation in TPS: FY 2014
• On average, hospitals located in 26 states
scored above the national average TPS in FY14
32
Where to next?
• Patient Reported Outcome Measures
– Oregon Health Insurance Experiment
• Population Based Measures
– Smoking
– Obesity
• Electronic Measures
– e-Measure of All Cause Harm
– Hospitals commit to voluntarily provide
e-measures over time in exchange for waiver of portion
of current HAC penalty
– Goal is nationwide implementation
– Early stages of development
Potential e-Measures:
• Electronic Measures (During Inpatient Stay)
– Fall -- >Grade 2 Pressure Ulcer
– Use of Naloxone -- INR>6
– Glucose <40 -- Vitamin K while on warfarin
– Unscheduled return to surgery
– Post-Op troponin ordered
– Transfer to higher level of care
– Drop Hgb/Hct >25% within 5 days procedure
– Study for PE/DVT within 30days after surgery
– Re-intubation within 48 hrs
– IV contrast use & decline in renal function
Hospital VBP Program Resources:
• Hospital VBP Program section of CMS website: http://cms.gov/Medicare/Quality-Initiatives-Patient-
Assessment-Instruments/hospital-value-based-purchasing/index.html?redirect=/Hospital-Value-Based-
Purchasing/
• Section 1886 of the Social Security Act: http://www.ssa.gov/OP_Home/ssact/title18/1886.htm
• Hospital VBP Program Scoring on Hospital Compare:
http://www.medicare.gov/hospitalcompare/data/hospital-vbp.html
• Hospital VBP Program Payments on Hospital Compare:
http://www.medicare.gov/hospitalcompare/data/payment-adjustments.html
• National Quality Forum: www.qualityforum.org
35
Other Relevant Links:
Medicare Payment Goals Announcement
• To read the press release from the
announcement of Medicare payment reform
goals:
http://www.hhs.gov/news/press/2015pres/01/
20150126a.html
• To read a new Perspectives piece in the New
England Journal of Medicine from Secretary
Burwell on the goals announcement:
http://www.nejm.org/doi/full/10.1056/NEJMp
1500445
• To read more about “why this matters”
http://www.cms.gov/Newsroom/MediaRelease
Database/Fact-sheets/2015-Fact-sheets-
items/2015-01-26-2.html
• To read a fact sheet about the Medicare
payment reform goals and Learning and Action
Network:
http://www.cms.gov/Newsroom/MediaRelease
Database/Fact-sheets/2015-Fact-sheets-
items/2015-01-26-3.html
• To contact the Learning and Action Network,
please email: PaymentNetwork@cms.hhs.gov
Interoperability Roadmap
• To learn more about the Interoperability
Roadmap:
• http://www.healthit.gov/policy-researchers-
implementers/interoperability
Transforming Clinical Practice Initiative
• To learn more about the Transforming Clinical
Practice Initiative:
http://innovation.cms.gov/initiatives/Transform
ing-Clinical-Practices/
• To read the press release:
http://www.hhs.gov/news/press/2014pres/10/
20141023a.html
• To read the blog:
http://www.hhs.gov/healthcare/facts/blog/201
4/10/transforming-clinical-practice-
initiative.html
Other Delivery System Reform Facts
• To learn more about facts and key
accomplishments to date on better care,
smarter spending, and healthier people:
http://www.cms.gov/Newsroom/MediaRelease
Database/Fact-sheets/2015-Fact-sheets-
items/2015-01-26.html
36
DSR Results:
What do we have to show for our work in
Value Based Purchasing programs and
implementing the Affordable Care Act?
Medicare FFS 30-Day All-Cause Readmission Rate,
2010 - July 2014, All Short-Term Acute Care
Hospitals Nationally
145 Harms/1,000 Discharges*2010
142 Harms/1,000 Discharges2011
132 Harms/1,000 Discharges2012
121 Harms/1,000 Discharges2013
TBD2014
Major Reductions in Harm
AHRQ 2010 Baseline & Results to Date
*In 2010, the Agency for Healthcare Research on Quality (AHRQ) established a national baseline of 145 harms per 1000
discharges in their National Scorecard.
Source: Secretary Burwell announces results of patient safety improvement efforts, HHS News Release, December 2, 2014
Preliminary 2013 AHQR National
Scorecard on HACs - Compared to 2010
Baseline
• 17% Reduction in HACs, 2010-2013
– from 4,757,000 to 3,960,000
– from 145 per 1,000 discharges to 121 per 1,000 discharges
$12B in Estimated Associated Cost Savings, 2010-2013
– $4B for 2011 and 2012 combined
– $8B for 2013
• 50,000 Lives Saved, 2010-2013
– ~15,000 lives saved for 2011 and 2012
combined
– ~35,000 lives saved for 2013
* Final MPSMS-based 2013 HACs, Preliminary 2013 NHSN-based HACs, and extrapolation of 2012 Data
for 2013 PSI-based HACs; Partnership for Patients 12/1/14 press release
http://www.washingtonpost.com/blogs/fact-checker/wp/2015/04/01/obamas-claim-the-affordable-care-act-was-a-major-
reason-in-preventing-50000-patient-deaths/ Glenn Kessler- Washington Post -Fact Checker
ACA Enrollment- Tell Your Patients!
• Expanded Practice Access2015 Open Enrollment
• Nov 1st, 2015
• thru Jan 31st, 2016
Special Enrollment
Period
• Marriage
• Having a baby
• Adoption
Special Enrollment
Period
• Moving to new
residence
• Gaining citizenship or
lawful residence
• Native
American/Alaskan
Tribe member
• Leaving Incarceration
• Change in Income
that affects Premium
Tax Credits or Cost
Sharing
https://www.healthcare.gov/coverage-outside-open-enrollment/special-enrollment-period/
Google “special enrollment”

Dr. Lemeneh Tefera

  • 1.
    Delivery System Reformand the Hospital Value-Based Purchasing (HVBP) Program Lemeneh Tefera MD MSc Medical Officer Value-Based Purchasing Division of Value Incentives & Quality Reporting (VIQR) Centers for Clinical Standards and Quality (CCSQ) May 15th, 2015 SAGES Quality Summit
  • 2.
    The Changing QualityLandscape and Hospital Value Based Purchasing- Linking Quality and Cost in Delivery System Reform
  • 3.
    Objective: • Provide anoverview of the Hospital Value-Based Purchasing (HVBP) program • Give CMS Delivery System Reform Overview: – Highlight the CMS Quality Strategy – Show linkages across CMS programs – Give an Overview of Delivery System Reform (DSR) – Strengthen audience understanding of HVBP – Introduce a working definition of Value-Based Purchasing 3 HVBP is the first federally implemented pay-for- performance program impacting the acute inpatient care setting.
  • 4.
    Goals of theCMS Quality Strategy • Make care safer by reducing harm caused in the delivery of care – Improve support for a culture of safety – Reduce inappropriate and unnecessary care – Prevent or minimize harm in all settings • Strengthen person and family engagement as partners in their care • Promote effective communication and coordination of care • Promote effective prevention and treatment of chronic disease • Work with communities to promote best practices of healthy living • Make care affordable 4
  • 5.
    Step One- Let usrecognize that we have a problem
  • 6.
  • 7.
    Patient Cardiologist PCP Surgeon GI Lab Neuro Social workPathologist Oncologist IR Urologist Phone call Email Procedure Appointment 1patient, 11 clinicians, 80 days PCP calls to patient: 12 PCP calls to clinicians: 8 PCP emails to clinicians: 32 Procedures: 5 Appointments: 11 Appointments with PCP: 0
  • 8.
    Historical Observations: That anysane nation, having observed that you could provide for the supply of bread by giving bakers a pecuniary interest in baking for you, should go on to give a surgeon a pecuniary interest in cutting off your leg, is enough to make one despair of political humanity. But that is precisely what we have done. And the more appalling the mutilation, the more the mutilator is paid. (Shaw, The Doctor’s Dilemma 1909)
  • 9.
    In three words,our vision for improving health delivery is about better, smarter, healthier. If we find better ways to pay providers, deliver care, and distribute information:  Encourage the integration and coordination of clinical care services  Improve population health  Promote patient engagement through shared decision making Incentives  Create transparency on cost and quality information  Bring electronic health information to the point of care for meaningful use Focus Areas Description Care Delivery Information  Promote value-based payment systems – Test new alternative payment models – Increase linkage of Medicaid, Medicare FFS, and other payments to value  Bring proven payment models to scale Better Care. Smarter Spending. Healthier People  We can receive better care.  We can spend our health dollars more wisely.  We can have healthier communities, a healthier economy, and a healthier country.
  • 10.
    CMS Authorized Programs& Activities CMS HHS Survey & Cert. Payment Value- based Purchasing Quality Improvement Clinical Standards Quality & Public Reporting Coverage Program Integrity CMMI & Medicaid Reducing & Preventing Health Care Associated Infections Reducing & Preventing Adverse Drug Events Community Living Council Multiple Chronic Conditions National Alzheimer’s Project Act Partnership for Patients Million Hearts National Quality Strategy Data.gov Coverage of services Physician Feedback report Quality Resource Utilization Report Hospital Readmissions Reduction Program Health Care Associated Conditions Program ESRD QIP Hospital VBP Physician value modifier Plans for Skilled Nursing Facility and Home Health Agencies, Ambulatory Surgical Centers QIOs ESRD Networks Hospital Inpatient Quality Hospital Outpatient In-patient psychiatric hospitals Cancer hospitals Nursing homes Home Health Agencies Long-term Care Acute Hospitals In-patient rehabilitation facilities Hospices Accountable Care Organizations Community Based Transitions Care Program Dual eligible coordination Care model demonstrations & projects 1115 Waivers Hospitals, Home Health Agencies, Hospices, ESRD facilities National & Local decisions Mechanisms to support innovation (CED, parallel review, other) Target surveys Quality Assurance Performance Improvement Fraud & Abuse Enforcement
  • 11.
    Hospital Quality Reporting • Medicareand Medicaid EHR Incentive Program • PPS-Exempt Cancer Hospitals • Inpatient Psychiatric Facilities • Inpatient Quality Reporting • Outpatient Quality Reporting • Ambulatory Surgical Centers Physician Quality Reporting • Medicare and Medicaid EHR Incentive Program • PQRS • eRx quality reporting PAC and Other Setting Quality Reporting • Inpatient Rehabilitation Facility • Nursing Home Compare Measures • LTCH Quality Reporting • ESRD QIP • Hospice Quality Reporting • Home Health Quality Reporting Payment Model Reporting • Medicare Shared Savings Program • Hospital Value- based Purchasing • Physician Feedback/Value- based Modifier* “Population” Quality Reporting • Medicaid Adult Quality Reporting* • CHIPRA Quality Reporting* • Health Insurance Exchange Quality Reporting* • Medicare Part C* • Medicare Part D* 11 CMS Quality Programs * Denotes that the program did not meet the statutory inclusion criteria for pre-rulemaking, but was included to foster alignment of program measures.
  • 12.
    Historical Observations: That anysane nation, having observed that you could provide for the supply of bread by giving bakers a pecuniary interest in baking for you, should go on to give a surgeon a pecuniary interest in cutting off your leg, is enough to make one despair of political humanity. But that is precisely what we have done. And the more appalling the mutilation, the more the mutilator is paid (Shaw, The Doctor’s Dilemma 1909)
  • 13.
  • 14.
    Payment Taxonomy Framework PaymentTaxonomy Framework Category 1: Fee for Service— No Link to Quality Category 2: Fee for Service—Link to Quality Category 3: Alternative Payment Models Built on Fee- for-Service Architecture Category 4: Population-Based Payment Description Payments are based on volume of services and not linked to quality or efficiency At least a portion of payments vary based on the quality or efficiency of health care delivery Some payment is linked to the effective management of a population or an episode of care. Payments still triggered by delivery of services, but opportunities for shared savings or 2-sided risk Payment is not directly triggered by service delivery so volume is not linked to payment. Clinicians and organizations are paid and responsible for the care of a beneficiary for a long period (e.g. >1 yr) MedicareFFS  Limited in Medicare fee- for-service  Majority of Medicare payments now are linked to quality  Hospital value- based purchasing  Physician Value- Based Modifier  Readmissions/Hosp ital Acquired Condition Reduction Program  Accountable care organizations  Medical homes  Bundled payments  Comprehensive primary care initiative  Comprehensive ESRD  Medicare-Medicaid Financial Alignment Initiative Fee-For-Service Model  Eligible Pioneer accountable care organizations in years 3- 5
  • 15.
    New Goals andTimeline for Moving Medicare from Rewarding Volume to Value January 2015 Announcement • HHS Secretary Sylvia M. Burwell announced measurable goals and a timeline to move the Medicare program, and the health care system at large, toward paying providers based on the quality, rather than the quantity of care they give patients • First time in the history of the program that explicit goals for alternative payment models and value-based payments set for Medicare • Creation of national Health Care Payment Learning & Action Network to accelerate the transition and foster collaboration between private payers, employers, providers, consumers, and state/federal partners Goals 1. Alternative Payment Models: 1. 30% of Medicare payments are tied to quality or value through alternative payment models by the end of 2016 2. 50% by the end of 2018 2. Linking FFS Payments to Quality/Value: 1. 85% of all Medicare fee-for-service payments are tied to quality or value by 2016 2. 90% by the end of 2018
  • 16.
    Next Steps forHHS to Encourage Value-Based Payments within the Medicare FFS system 16  Goal 1: 30% of Medicare payments are tied to quality or value through alternative payment models (categories 3-4) by the end of 2016,  and 50% by the end of 2018  Goal 2: 85% of all Medicare FFS tied to quality or value (categories 2-4) by the end of 2016,  and 90% by the end of 2018 Goals Purpose  Set internal goals for HHS  Invite private sector payers to match or exceed HHS goals Stakeholders  Consumers  Businesses  Payers  Providers  State and federal partners Next steps  Testing of new models and expansion of existing models will be critical to reaching incentive goals  Creation of a Health Care Payment Learning and Action Network to align incentives
  • 17.
    Target percentage ofMedicare FFS payments linked to quality and alternative payment models in 2016 and 2018 2016 All Medicare FFS (Categories 1-4) FFS linked to quality (Categories 2-4) Alternative payment models (Categories 3-4) 2018 50% 85% 30% 90%
  • 18.
    2016 30% 85% 2018 50% 90% Target percentage ofpayments in ‘FFS linked to quality’ and ‘alternative payment models’ by 2016 and 2018 2014 ~20% >80% 2011 0% 68% GoalsHistorical Performance All Medicare FFS (Categories 1-4) FFS linked to quality (Categories 2-4) Alternative payment models (Categories 3-4)
  • 19.
    Payment Taxonomy Framework PaymentTaxonomy Framework Category 1: Fee for Service— No Link to Quality Category 2: Fee for Service—Link to Quality Category 3: Alternative Payment Models Built on Fee- for-Service Architecture Category 4: Population-Based Payment Description Payments are based on volume of services and not linked to quality or efficiency At least a portion of payments vary based on the quality or efficiency of health care delivery Some payment is linked to the effective management of a population or an episode of care. Payments still triggered by delivery of services, but opportunities for shared savings or 2-sided risk Payment is not directly triggered by service delivery so volume is not linked to payment. Clinicians and organizations are paid and responsible for the care of a beneficiary for a long period (e.g. >1 yr) MedicareFFS  Limited in Medicare fee- for-service  Majority of Medicare payments now are linked to quality  Hospital value- based purchasing  Physician Value- Based Modifier  Readmissions/Hosp ital Acquired Condition Reduction Program  Accountable care organizations  Medical homes  Bundled payments  Comprehensive primary care initiative  Comprehensive ESRD  Medicare-Medicaid Financial Alignment Initiative Fee-For-Service Model  Eligible Pioneer accountable care organizations in years 3- 5
  • 20.
    CMS Innovation CenterPortfolio: Testing New Models to Improve Quality Accountable Care Organizations (ACOs) • Medicare Shared Savings Program (Center for Medicare) • Pioneer ACO Model • Advance Payment ACO Model • Comprehensive ERSD Care Initiative Primary Care Transformation • Comprehensive Primary Care Initiative (CPC) • Multi-Payer Advanced Primary Care Practice (MAPCP) Demonstration • Federally Qualified Health Center (FQHC) Advanced Primary Care Practice Demonstration • Independence at Home Demonstration • Graduate Nurse Education Demonstration Bundled Payment for Care Improvement • Model 1: Retrospective Acute Care • Model 2: Retrospective Acute Care Episode & Post Acute • Model 3: Retrospective Post Acute Care • Model 4: Prospective Acute Care Capacity to Spread Innovation • Partnership for Patients • Community-Based Care Transitions • Million Hearts Health Care Innovation Awards State Innovation Models Initiative Initiatives Focused on the Medicaid Population • Medicaid Emergency Psychiatric Demonstration • Medicaid Incentives for Prevention of Chronic Diseases • Strong Start Initiative Medicare-Medicaid Enrollees • Financial Alignment Initiative • Initiative to Reduce Avoidable Hospitalizations of Nursing Facility Residents
  • 21.
    HVBP Program LegislativeDrivers: The Hospital VBP Program is authorized by Section 1886(o) of the Social Security Act, as added by Section 3001(a) of the Patient Protection and Affordable Care Act (ACA) of 2010 • Program intent: Promote better clinical outcomes for hospital patients, improve the patient experience of care during hospital stays, and encourage hospitals to improve the quality and safety of care that all patients receive by: • Eliminating or reducing the occurrence of adverse events, • Adopting evidence-based care standards and protocols that result in the best outcomes for the most patients, and • Re-engineering hospital processes that improve patients’ experience of care. • Social Security Act § 1886(o): • Authorizes the establishment of the Program under which value-based incentive payments are made to hospitals that meet the performance standards • Allows hospitals to be scored based on achievement and improvement in determining overall hospital performance 6
  • 22.
    Why HVBP Matters: •Inpatient hospital care represents substantial Medicare spending – $139 billion in Fiscal Year (FY) 2013 – 50.5% of FY 2013 Part A spending – 23.8% of FY 2013 total Medicare benefits • The Hospital VBP Program statute dedicates an increasing percentage of Medicare hospital payments to value-based incentive payments – FY 2013: 1.00%, $963 million (est.) – FY 2014: 1.25%, $1.1 billion (est.) – FY 2015: 1.50%, $1.4 billion (est.) – FY 2016: 1.75% ($ TBD) – FY 2017: 2.00% ($ TBD) • Number of eligible hospitals as program scope expands – FY 2013: 2,984 hospitals – FY 2014: 2,728 hospitals – FY 2015: 3,089 hospitals 22
  • 23.
    Program Evolution: • Eligiblehospitals include subsection (d) hospitals as defined in Section 1886(d)(1)(B) of SSA • Hospitals may be excluded from the Program for the following reasons: – The hospital is subject to the payment reduction under subsection (b)(3)(B)(viii)(I) (Hospital IQR Program) for such fiscal year; – The hospital was cited for deficiencies during the performance period that pose immediate jeopardy to the health or safety of patients; and – The hospital lacks sufficient cases or sufficient measures (as determined by the Secretary) within the measure domains that apply to the hospital for the performance period for such fiscal year. • Exception Reason: – The hospital submits a disaster/extraordinary circumstance exception that is approved by the Secretary. – The hospital is paid under section 1814(b)(3) and has submitted an annual report to the Secretary describing how a similar program in the State achieves or surpasses measured results in terms of patient health outcomes and cost savings under the Hospital VBP Program. • Maryland hospitals will be exempted from the Hospital VBP Program in order to implement the CMMI All-Payer Model. • Hospitals excluded, excepted, or exempted from the Hospital VBP Program will NOT have their base operating DRG payments reduced by the withhold percentage. 10
  • 24.
    The Quality Landscape& HVBP: • Changing weights of Process v Outcome • Emphasizing Outcome measures • Future looks to link Quality and Cost Measures
  • 25.
    Program Evolution: FY 2013Domain Weights & Measures 12 Outcome 70% 30% Patient Experience of Care Hospital Consumer Assessment of Healthcare Providers and Systems (HCAHPS) Survey Clinical Process of Care AMI-7a AMI-8 HF-1 PN-3b PN-6 SCIP-Inf-1 Domain Weights SCIP-Inf-2 SCIP-Inf-3 SCIP-Inf-4 SCIP-Card-2 SCIP-VTE-1 SCIP-VTE-2 Clinical Process of Care Patient Experience of Care
  • 26.
    Program Evolution: FY 2014Domain Weights & Measures 13 Outcome 30% 45% 25% Patient and Caregiver Centered Experience of Care/Care Coordination Hospital Consumer Assessment of Healthcare Providers and Systems (HCAHPS) Survey Outcome* MORT-30-AMI* MORT-30-HF* MORT-30-PN* Domain Weights An asterisk (*) indicates a newly adopted measure or domain for the Hospital VBP Program. Clinical Process of Care AMI-7a AMI-8 HF-1 PN-3b PN-6 SCIP-Inf-1 SCIP-Inf-2 SCIP-Inf-3 SCIP-Inf-4 SCIP-Card-2 SCIP-VTE-1 SCIP-VTE-2 SCIP-Inf-9* Outcome Patient Experience of Care Clinical Process of Care
  • 27.
    Program Evolution: FY 2015Domain Weights & Measures 14 Outcome 30% 20% 30% 20% Patient Experience of Care Clinical Process of Care Outcome Efficiency Patient and Caregiver Centered Experience of Care/Care Coordination Hospital Consumer Assessment of Healthcare Providers and Systems (HCAHPS) Survey Outcome MORT-30-AMI MORT-30-HF MORT-30-PN Domain Weights An asterisk (*) indicates a newly adopted measure or domain for the Hospital VBP Program. Clinical Process of Care AMI-7a AMI-8 HF-1 PN-3b PN-6 SCIP-Inf-1 SCIP-Inf-2 SCIP-Inf-3 SCIP-Inf-4 SCIP-Inf-9 SCIP-Card-2 SCIP-VTE-2 Efficiency and Cost Reduction* MSPB-1* AHRQ PSI-90* CLABSI*
  • 28.
    Program Evolution: FY 2016Domain Weights & Measures 128 Outcome 25% 10% 40% 25% Patient Experience of Care Outcome Efficiency Patient and Caregiver Centered Experience of Care/Care Coordination Hospital Consumer Assessment of Healthcare Providers and Systems (HCAHPS) Survey Outcome MORT-30-AMI MORT-30-HF MORT-30-PN AHRQ PSI-90 Domain Weights An asterisk (*) indicates a newly adopted measure or domain for the Hospital VBP Program. Clinical Process of Care AMI-7a PN-6 SCIP-Inf-2 SCIP-Inf-3 SCIP-Inf-9 SCIP-Card-2 SCIP-VTE-2 IMM-2* Efficiency and Cost Reduction MSPB-1 CLABSI CAUTI* SSI*: Colon & Abdominal Hysterectomy
  • 29.
    Program Evolution: FY 2017Domain Weights & Measures 16 Outcome 5% 25%20% 25% 25% Outcomes Process Efficiency and Cost ReductionSafety Patient and Caregiver Centered Experience of Care/Care Coordination Patient and Caregiver Centered Experience of Care/Care Coordination Hospital Consumer Assessment of Healthcare Providers and Systems (HCAHPS) Survey Clinical Care Outcomes Process MORT-30-AMI MORT-30-HF MORT-30-PN AMI-7a IMM-2 PC-01* Safety CLABSI CAUTI SSI: Colon & Abdominal Hysterectomy MRSA Infections* C-difficile Infections* AHRQ PSI-90 Efficiency and Cost Reduction MSPB-1 Domain Weights Clinical Care An asterisk (*) indicates a newly adopted measure for the Hospital VBP Program.
  • 30.
    Key Monitoring &Evaluation Findings: • Hospitals showing modest improvement – Teaching hospitals showed modest improvement and performed slightly above national average in FY 2014 but not in FY 2013 – In FY 2014, hospitals showing improvement and performing above the national average TPS were federal government and non-profit hospitals – Safety Net Hospitals not disproportionately affected 30
  • 31.
    Statewide Variation inTPS: FY 2013 • On average, hospitals located in 24 states scored above the national average TPS in FY13 31
  • 32.
    Statewide Variation inTPS: FY 2014 • On average, hospitals located in 26 states scored above the national average TPS in FY14 32
  • 33.
    Where to next? •Patient Reported Outcome Measures – Oregon Health Insurance Experiment • Population Based Measures – Smoking – Obesity • Electronic Measures – e-Measure of All Cause Harm – Hospitals commit to voluntarily provide e-measures over time in exchange for waiver of portion of current HAC penalty – Goal is nationwide implementation – Early stages of development
  • 34.
    Potential e-Measures: • ElectronicMeasures (During Inpatient Stay) – Fall -- >Grade 2 Pressure Ulcer – Use of Naloxone -- INR>6 – Glucose <40 -- Vitamin K while on warfarin – Unscheduled return to surgery – Post-Op troponin ordered – Transfer to higher level of care – Drop Hgb/Hct >25% within 5 days procedure – Study for PE/DVT within 30days after surgery – Re-intubation within 48 hrs – IV contrast use & decline in renal function
  • 35.
    Hospital VBP ProgramResources: • Hospital VBP Program section of CMS website: http://cms.gov/Medicare/Quality-Initiatives-Patient- Assessment-Instruments/hospital-value-based-purchasing/index.html?redirect=/Hospital-Value-Based- Purchasing/ • Section 1886 of the Social Security Act: http://www.ssa.gov/OP_Home/ssact/title18/1886.htm • Hospital VBP Program Scoring on Hospital Compare: http://www.medicare.gov/hospitalcompare/data/hospital-vbp.html • Hospital VBP Program Payments on Hospital Compare: http://www.medicare.gov/hospitalcompare/data/payment-adjustments.html • National Quality Forum: www.qualityforum.org 35
  • 36.
    Other Relevant Links: MedicarePayment Goals Announcement • To read the press release from the announcement of Medicare payment reform goals: http://www.hhs.gov/news/press/2015pres/01/ 20150126a.html • To read a new Perspectives piece in the New England Journal of Medicine from Secretary Burwell on the goals announcement: http://www.nejm.org/doi/full/10.1056/NEJMp 1500445 • To read more about “why this matters” http://www.cms.gov/Newsroom/MediaRelease Database/Fact-sheets/2015-Fact-sheets- items/2015-01-26-2.html • To read a fact sheet about the Medicare payment reform goals and Learning and Action Network: http://www.cms.gov/Newsroom/MediaRelease Database/Fact-sheets/2015-Fact-sheets- items/2015-01-26-3.html • To contact the Learning and Action Network, please email: PaymentNetwork@cms.hhs.gov Interoperability Roadmap • To learn more about the Interoperability Roadmap: • http://www.healthit.gov/policy-researchers- implementers/interoperability Transforming Clinical Practice Initiative • To learn more about the Transforming Clinical Practice Initiative: http://innovation.cms.gov/initiatives/Transform ing-Clinical-Practices/ • To read the press release: http://www.hhs.gov/news/press/2014pres/10/ 20141023a.html • To read the blog: http://www.hhs.gov/healthcare/facts/blog/201 4/10/transforming-clinical-practice- initiative.html Other Delivery System Reform Facts • To learn more about facts and key accomplishments to date on better care, smarter spending, and healthier people: http://www.cms.gov/Newsroom/MediaRelease Database/Fact-sheets/2015-Fact-sheets- items/2015-01-26.html 36
  • 37.
    DSR Results: What dowe have to show for our work in Value Based Purchasing programs and implementing the Affordable Care Act?
  • 38.
    Medicare FFS 30-DayAll-Cause Readmission Rate, 2010 - July 2014, All Short-Term Acute Care Hospitals Nationally
  • 39.
    145 Harms/1,000 Discharges*2010 142Harms/1,000 Discharges2011 132 Harms/1,000 Discharges2012 121 Harms/1,000 Discharges2013 TBD2014 Major Reductions in Harm AHRQ 2010 Baseline & Results to Date *In 2010, the Agency for Healthcare Research on Quality (AHRQ) established a national baseline of 145 harms per 1000 discharges in their National Scorecard. Source: Secretary Burwell announces results of patient safety improvement efforts, HHS News Release, December 2, 2014
  • 40.
    Preliminary 2013 AHQRNational Scorecard on HACs - Compared to 2010 Baseline • 17% Reduction in HACs, 2010-2013 – from 4,757,000 to 3,960,000 – from 145 per 1,000 discharges to 121 per 1,000 discharges $12B in Estimated Associated Cost Savings, 2010-2013 – $4B for 2011 and 2012 combined – $8B for 2013 • 50,000 Lives Saved, 2010-2013 – ~15,000 lives saved for 2011 and 2012 combined – ~35,000 lives saved for 2013 * Final MPSMS-based 2013 HACs, Preliminary 2013 NHSN-based HACs, and extrapolation of 2012 Data for 2013 PSI-based HACs; Partnership for Patients 12/1/14 press release
  • 41.
  • 42.
    ACA Enrollment- TellYour Patients! • Expanded Practice Access2015 Open Enrollment • Nov 1st, 2015 • thru Jan 31st, 2016 Special Enrollment Period • Marriage • Having a baby • Adoption Special Enrollment Period • Moving to new residence • Gaining citizenship or lawful residence • Native American/Alaskan Tribe member • Leaving Incarceration • Change in Income that affects Premium Tax Credits or Cost Sharing https://www.healthcare.gov/coverage-outside-open-enrollment/special-enrollment-period/ Google “special enrollment”

Editor's Notes

  • #5 The CMS Quality Strategy is made up of these six goals.
  • #7 Work together Safety Communicate Coordination Patients need to engage their providers Patient experience Providers need to engage patients Professional satisfaction PCPs can’t do it alone Robust primary and preventative care Specialists need to communicate Coordinated care transitions
  • #8 Work together Safety Communicate Coordination Patients need to engage their providers Patient experience Providers need to engage patients Professional satisfaction PCPs can’t do it alone Robust primary and preventative care Specialists need to communicate Coordinated care transitions
  • #9 The concerns about FFS care and a volume driven payment system are long standing. George Bernard Shaw was the one of the founders of the London School of Economics Playwright & comedian & social justice activist Fabian Society- incrementalism preferred over sudden revolutionary reform; socialist politics, anti-colonialism- pro women’s & labor rights,
  • #10 In three words, our vision for improving health delivery is about better, smarter, healthier. VBP-link quality-cost Coordination Cost & Quality transparency (Compare Inc) Patient info transparency in a secure and inter-connected framework
  • #11 How does CMS work to achieve this desired future state? Highlight slide Rely on reliable measures to assess provider and hospital performance
  • #12 Measures Measures
  • #13 The concerns about FFS care and a volume driven payment system are long standing. George Bernard Shaw was the one of the founders of the London School of Economics Playwright & comedian & social justice activist Fabian Society- incrementalism preferred over sudden revolutionary reform; socialist politics, anti-colonialism- pro women’s & labor rights,
  • #14 Shaw’s comments describe the historical state that we are moving away from Historical State Future State Producer-centered Patient-centered Fragmented Care Coordinated care Incentives for volume Incentives for outcomes Unsustainable Sustainable Fee-For-Service Payment Systems Value-based purchasing, ACOs, Episode Based Payments, Medical Homes Quality / Cost Transparency
  • #15 The DSR Continuum … Moving away from Cat 1 (George Bernard Shaw) to Cat 4 (Population Health)
  • #16 Goal is linking 85% to payments to quality by 2016 90% by 2018 2016- 30% payments tied to APMs 2018- 50% payments tied to APMs
  • #17 Engaging Stakeholders is key to achieving these goals
  • #18 2014 Categories 2-4 are 20 % Categories 3-4 are 80 % 2016 goals within reach 2018 goals a challenge but, considering the amount of recent progress, within the rang
  • #19 Version 2/15/2015
  • #20 Most of the CMS program work is in Category 2 and 3; The future state is Cat 4- MACRA 2015 (SGR) fix has extensive language encouraging population health measurement and inclusion into MIPS & APMs
  • #22 ACA 2010 authorized establishment of the Hospital VBP Program Built on infrastructure of the Hospital Inpatient Quality Reporting (Hospital IQR) Program “The Secretary shall establish a hospital value-based purchasing program under which value-based incentive payments are made in a fiscal year to hospitals that meet the performance standards . . . For the performance period for such fiscal year.” SSA § 1886(o) Withhold percentage base operating DRG payments from participating hospitals and then “pay back” on achievement and improvement
  • #24 This slide goes over which hospitals are included in the Hospital VBP Program and which hospitals are not. Hospitals can be excluded, excepted, or exempted Excluded—for example, for lacking sufficient cases on a particular measure Excepted—for example, during a natural disaster, hospitals can ask to be excepted from the program and the Secretary must approve it Exempted—for example, Maryland hospitals
  • #25 Use HVBP to capture the DSR concepts in a current program MACRA 2015- Secretary shall emphasize outcome measures including PROMs
  • #26 In the first year of the Hospital VBP Program, 13 measures were introduced spanning two domains. Most of the measures were included in the clinical process of care domain. Each year, we also tested the clinical process measure set for measures that are “topped out,” or measures where most hospitals have all achieved high levels of performance, and removed them from the program.
  • #27 In the next year of the program, FY 2014, we had 17 measures in the program. Between FY 2013 and FY 2014, the Hospital VBP Program added four new measures—one new measure and three new mortality measures. The three new mortality measures make up a new domain—the outcome domain. In FY 2014, we adopted an additional clinical process of care measure (SCIP-Inf-9) and three measures in the new outcome domain (MORT-30-AMI, MORT-30-HF, and MORT-30-PN). We also adopted a revised domain weighting.
  • #28 In FY 2015, we adopted additional measures in the outcome domain (PSI-90 and NHSN-CLABSI), as well as the new Medicare Spending per Beneficiary measure in the new Efficiency and Cost Reduction domain and revised domain weighting. In FY 2015, we adopted a total of 19 measures spanning four domains.
  • #29 In FY 2016, we adopted additional outcome measures (NHSN-CAUTI and NHSN-SSI), a new clinical process measure (IMM-2), and revised the domain weighting. In FY 2016, we have adopted 17 measures.
  • #30 Beginning with FY 2017, we reallocated the HVBP Program’s quality domains to more closely match the National Quality Strategy’s priorities. We also adopted new measures in the Clinical Care – Process domain (PC-01) and the Safety domain (NHSN-MRSA and NHSA-CDI). Currently, we have adopted 14 measures for the FY 2017 program.
  • #32  This map, and the map on the next slide, shows hospital TPS values by state in FY 2013 and FY 2014. States that contained at least one hospital that scored above the national average are indicated by a darker color (24 states in FY2013 and 26 states in FY2014). The national average score was 55.46 in FY 2013 and 46.53 in FY 2014.
  • #33 These maps show hospital TPS values by state in FY 2013 and FY 2014. States that contained at least one hospital that scored above the national average are indicated by a darker color (24 states in FY2013 and 26 states in FY2014). The national average score was 55.46 in FY 2013 and 46.53 in FY 2014. The change in scores between FY2013 and FY2014 may have been affected by both the addition of the Outcome Domain and the re-weighting of the Clinical and Patient Experience of Care do-mains.
  • #34 If a hospital is found to have average performance BUT its catchment area reports better health, sense of well-being, optimism for the future, or less depression, is this hospital just average? If a hospital is deemed a high performer but has poor PROMs, is it really a doing so well ?