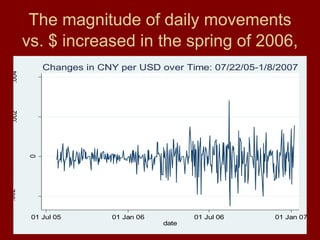
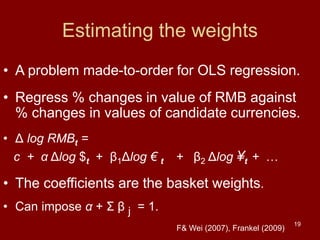
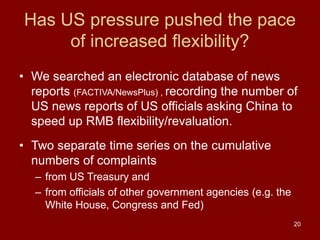
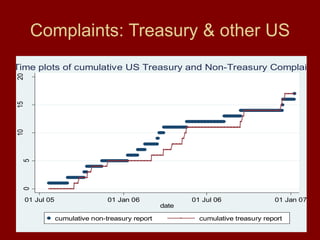
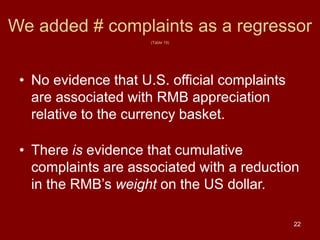
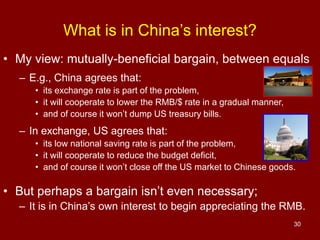
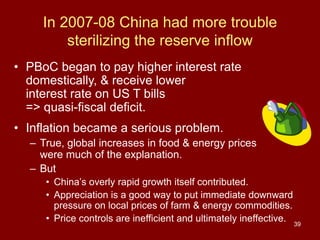
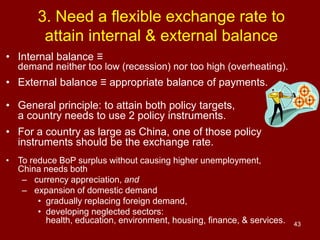
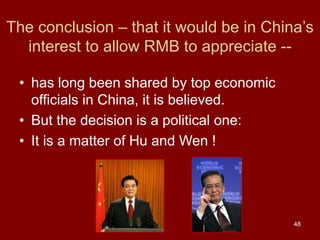
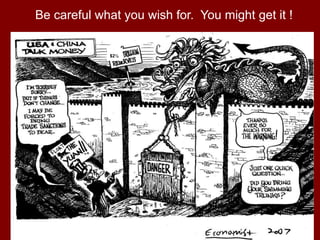
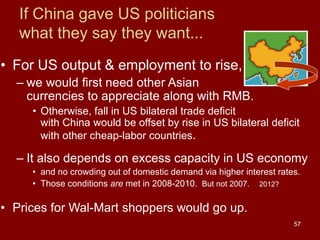
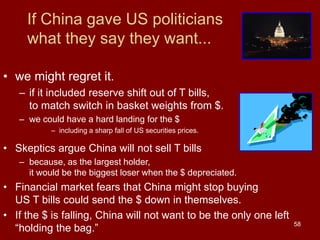
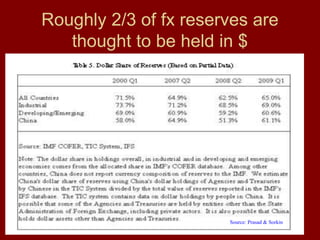
This document discusses the history of currency diplomacy between China and the US regarding the Renminbi-Dollar exchange rate. It provides a timeline of key events from 1973 to 2010, including China's currency policies and US pressure to appreciate the Renminbi. The author argues that China should allow its currency to gradually appreciate, as this would be in China's own long-term economic interests, such as reducing overheating and managing its excessive foreign reserves. However, a mutually beneficial agreement between the US and China may also be possible, where both countries agree to policies that address trade imbalances.

![4
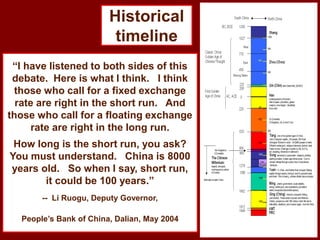
Historical timeline of currency diplomacy
• 1973: End of Bretton Woods era.
– Major currencies switch from fixed to floating. The rest keep their pegs.
• 1977: IMF members agree that each shall “avoid manipulating
exchange rates … in order to prevent effective balance of payments
adjustment or to gain an unfair competitive advantage over other members.”
[Principle (A) of the “1977 Decision on Surveillance over Exchange Rate Policies,” and Sect.1, Clause 3, of Article IV amended in 1978.]
– In practice, the IMF almost never pressures countries to revalue their currencies upward;
• It just pressures deficit countries to devalue.
• 1983-84: ¥/$ Agreement. 1985: Plaza Accord.
– Japan, US & others cooperate to bring down overvalued $, esp. vs. ¥
• 1987-89:
– Louvre Agreement: $ depreciation halted.
– Big bubbles in Japan’s equity & real estate markets,
– followed by crash, & severe Japanese stagnation in 1990s.](https://image.slidesharecdn.com/dokumen-230730065804-b435af06/85/dokumen-tips_the-renminbi-dollar-issue-jeffrey-frankel-harpel-professor-spring-exercise-ppt-4-320.jpg)


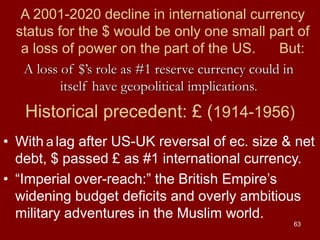
![64
64
• Precedent: The Suez crisis of 1956 [i]
– is often recalled as the occasion
on which Britain was forced
under US pressure to abandon
its remaining imperial designs.
– But recall also the important role
played by a simultaneous run on
the £, and America’s decision not
to help the beleaguered currency.
[i] Frankel, “Could the Twin Deficits Jeopardize US Hegemony,”
Journal of Policy Modeling, 28, no. 6, Sept. 2006.
At http://ksghome.harvard.edu/~jfrankel/SalvatoreDeficitsHegemonJan26Jul+.pdf .](https://image.slidesharecdn.com/dokumen-230730065804-b435af06/85/dokumen-tips_the-renminbi-dollar-issue-jeffrey-frankel-harpel-professor-spring-exercise-ppt-64-320.jpg)