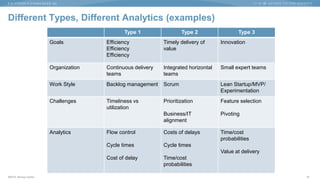
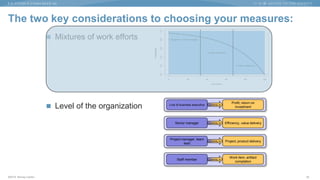
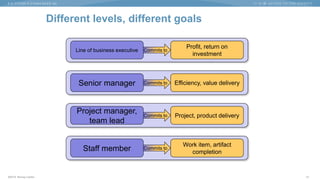
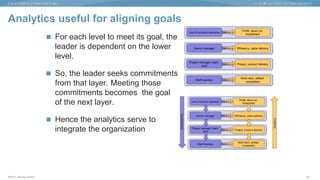
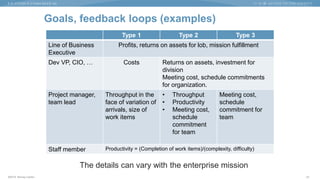
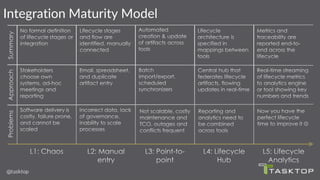
Doing Analytics Right
Part 1 – Selecting Analytics
Look Whose Talking
@tasktop
• Dave West – Chief Product Officer,
Tasktop
– Leads product development for Tasktop
– Former RUP product mgr and Forrester
Analyst
– Dave.west@tasktop.com | @davidjwest
• Dr Murray Cantor – Senior Consultant,
Cutter Consortium
– Trying to improve our industry with
metrics
– Former IBM Distinguished Engineer
– mcantor@cutter.com | @murraycantor
This is the first of a series:
1. Selecting Analytics. Murray Cantor, Dave West.
– Aligning the choice of measures with your organization’s efforts and goals
2. Designing and automating analytics. Murray Cantor, Nicole Bryan.
– A straightforward method for finding your analytics solution
• The dashboards,
• the required data, and
• an appropriate choice of analytical techniques and statistics to apply to the data.
3. Building the Analytics Environment. Murray Cantor, Nicole Bryan.
– The data solution architecture and stack
– How Tasktop can help.
3
http://tasktop.com/webinars
Software is eating the world….
22
7
4
3
35
200
500K
#1
196,000 2,000,000
Vancouver HQ
Offices in Austin,
Boston, UK
22
Providing some context
Created first
software
lifecycle bus
2011
Global 500
customers
3 OEMs
Created Task
Management
Category
2009
1000+ customers,
3 OEMs
De facto ALM
integration for
developers
2007
1.5M OSS
DLs/month,
Majority ISVs
Defined Software
Lifecycle
Integration
2013
Emerging ALM
discipline, new
product category
Created first lifecycle
data aggregator
2014
Infrastructure for
software lifecycle
analytics
So…. You have Data, then what…
©2015 Murray Cantor
Metrics are essential for sense and respond loops to
achieve goals
When choosing measures
consider whether
• The measures let you know how
whether you are achieving the
goals?
• You have a way to respond to the
measures?
8
Avoid building dashboards just to use the data
©2015 Murray Cantor
The two key considerations to picking your measures:
9
 Mixtures of work efforts
 Level of the organization
Work item, artifact
completion
Staff member Commits to
Project, product delivery
Project manager, team
lead
Commits to
Efficiency, value deliverySenior manager Commits to
Profit, return on
investment
Line of business executive Commits to
©2015 Murray Cantor
The two key considerations to picking your measures:
10
 Mixtures of work efforts
 Level of the organization
Work item, artifact
completion
Staff member Commits to
Project, product delivery
Project manager, team
lead
Commits to
Efficiency, value deliverySenior manager Commits to
Profit, return on
investment
Line of business executive Commits to
©2015 Murray Cantor
Kinds of Development Efforts: What is your mix?
11
1. Low innovation/high
certainty
• Detailed understanding
of the requirements
• Well understood code
2. Some innovation/
some uncertainty
• Architecture/Design in
place
• Some discovery required
to have confidence in
requirements
• Some
refactoring/evolution of
design might be required
3. High innovation/High
Uncertainty
• Requirements not fully
understood, some
experimentation might be
required
• May be alternatives in choice
of technology
• No initial design/architecture
©2015 Murray Cantor
The methods landscape
12
Kanban
Lean startup: MVP
Agile, Scrum
Product Development Flow
Systems/Software Engineering
Lean Software
Podular Org.
Liminal Thinking.
Technical Debt Management
Iterative learning: Updating estimates and
plans in the face of evidence
DevOps/Continuous Delivery
©2015 Murray Cantor
Different disciplines apply to different parts of the landscape
13
Lean Manufacturing
Innovation Management
Queuing Theory
Systems Theory
Toyota Management System
Agile Management
Bayesian Nets
Analytics
Quality Control
©2015 Murray Cantor
The different types of efforts requires different sorts of analytics
Descriptive
Bayesian
Descriptive
• Counts, percentages
• Averages (means, medians)
• Percentiles
Bayesian
• Probabilities
• Risks
• Uncertainties
©2015 Murray Cantor
Descriptive Example: A Value Stream model for routine efforts
15
Control challenges
• Random arrival intervals
• Variation of effort to address work items (unlike standardized
manufacturing)
©2015 Murray Cantor
Descriptive example: Cycle times
16
These will be described in
more detail in next webinar
©2015 Murray Cantor
Bayes is the way for development teams and
management to deal with uncertainties
 In types II and III development, quantities such as time, cost
to complete, and velocity are not known for certain.
• There is not enough known to make exact predictions
• You need to utilize the actual data you produce sprint by sprint
 Bayesian analysis is the centuries old method for rigorously
dealing with with uncertain quantities.
 Bayesian analytics allows everyone on the team to learn
together.
17
 Attributes of Bayes:
 Uncertain quantities are specified probabilities
 The probabilities capture both the best/worst estimates and the level of uncertainty
 The probabilities/beliefs are updated as information, evidence comes in.
 The probability distributions can be “added,” “multiplied,” etc.
©2015 Murray Cantor
Bayesian Example
18
This will be described in more
detail in next webinar
©2015 Murray Cantor
Different Types, Different Analytics (examples)
Type 1 Type 2 Type 3
Goals Efficiency
Efficiency
Efficiency
Timely delivery of
value
Innovation
Organization Continuous delivery
teams
Integrated horizontal
teams
Small expert teams
Work Style Backlog management Scrum Lean Startup/MVP/
Experimentation
Challenges Timeliness vs
utilization
Prioritization
Business/IT
alignment
Feature selection
Pivoting
Analytics Flow control
Cycle times
Cost of delay
Costs of delays
Cycle times
Time/cost
probabilities
Time/cost
probabilities
Value at delivery
19
©2015 Murray Cantor
The two key considerations to choosing your measures:
20
 Mixtures of work efforts
 Level of the organization
Work item, artifact
completion
Staff member Commits to
Project, product delivery
Project manager, team
lead
Commits to
Efficiency, value deliverySenior manager Commits to
Profit, return on
investment
Line of business executive Commits to
©2015 Murray Cantor
Different levels, different goals
21
Work item, artifact
completionStaff member Commits to
Project, product delivery
Project manager,
team lead
Commits to
Efficiency, value deliverySenior manager Commits to
Profit, return on
investment
Line of business executive Commits to
©2015 Murray Cantor
Analytics useful for aligning goals
 For each level to meet its goal, the
leader is dependent on the lower
level.
 So, the leader seeks commitments
from that layer. Meeting those
commitments becomes the goal
of the next layer.
 Hence the analytics serve to
integrate the organization
22
©2015 Murray Cantor
Goals, feedback loops (examples)
Type 1 Type 2 Type 3
Line of Business
Executive
Profits, returns on assets for lob, mission fulfillment
Dev VP, CIO, … Costs Returns on assets, investment for
division
Meeting cost, schedule commitments
for organization.
Project manager,
team lead
Throughput in the
face of variation of
arrivals, size of
work items
• Throughput
• Productivity
• Meeting cost,
schedule
commitment
for team
Meeting cost,
schedule
commitment for
team
Staff member Productivity = (Completion of work items)/(complexity, difficulty)
23
The details can vary with the enterprise mission
©2015 Murray Cantor
To summarize
 There is no one-size fits all choice of
measures
 Measures must be part of some
feedback, sense and respond loop
 Choice of measures Depends chiefly
on
• Mixture of work
• Level of organization
 Much more detail to follow in next
webinars .
24
©2015 Murray Cantor
Two key principles
• Kelvin’s Principle: “To measure
is to know. If you can not
measure it, you can not improve
it”
– Measures are part of control
loops
• The converse principle: “Don’t
bother to measure what you do
not intend to improve”
– Find a small set of measures, not
a long laundry list 25
©2015 Murray Cantor
Choosing metrics big picture
Agree on goals
- Depends on the levels and mixture of work
Agree on the how they fit into the loop
1. “How would we know we are achieving the goal”
2.” What response we take?”
Determine the measures needed to answer the questions
- Apply the Einstein test (as simple as possible, but no
simpler)
Specify the data needed to answer the
questions
Automate collection and staging of
the data
26
Today
Later
Integration Maturity Model
This is the first of a series:
1. Selecting Analytics. Murray Cantor, Dave West.
– Aligning the choice of measures with your organization’s efforts and goals
2. Designing and automating analytics. Murray Cantor, Nicole Bryan.
– A straightforward method for finding your analytics solution
• The dashboards,
• the required data, and
• an appropriate choice of analytical techniques and statistics to apply to the data.
3. Building the Analytics Environment. Murray Cantor, Nicole Bryan.
– The data solution architecture and stack
– How Tasktop can help.
29
http://tasktop.com/webinars
Stay in touch
@tasktop
Dave.west@tasktop.com
@davidjwest
mcantor@cutter.com.com
@murraycantor
@tasktop
@cuttertweets

Doing Analytics Right - Selecting Analytics

  • 1.
    Doing Analytics Right Part1 – Selecting Analytics
  • 2.
    Look Whose Talking @tasktop •Dave West – Chief Product Officer, Tasktop – Leads product development for Tasktop – Former RUP product mgr and Forrester Analyst – Dave.west@tasktop.com | @davidjwest • Dr Murray Cantor – Senior Consultant, Cutter Consortium – Trying to improve our industry with metrics – Former IBM Distinguished Engineer – mcantor@cutter.com | @murraycantor
  • 3.
    This is thefirst of a series: 1. Selecting Analytics. Murray Cantor, Dave West. – Aligning the choice of measures with your organization’s efforts and goals 2. Designing and automating analytics. Murray Cantor, Nicole Bryan. – A straightforward method for finding your analytics solution • The dashboards, • the required data, and • an appropriate choice of analytical techniques and statistics to apply to the data. 3. Building the Analytics Environment. Murray Cantor, Nicole Bryan. – The data solution architecture and stack – How Tasktop can help. 3 http://tasktop.com/webinars
  • 4.
    Software is eatingthe world….
  • 5.
  • 6.
    Providing some context Createdfirst software lifecycle bus 2011 Global 500 customers 3 OEMs Created Task Management Category 2009 1000+ customers, 3 OEMs De facto ALM integration for developers 2007 1.5M OSS DLs/month, Majority ISVs Defined Software Lifecycle Integration 2013 Emerging ALM discipline, new product category Created first lifecycle data aggregator 2014 Infrastructure for software lifecycle analytics
  • 7.
    So…. You haveData, then what…
  • 8.
    ©2015 Murray Cantor Metricsare essential for sense and respond loops to achieve goals When choosing measures consider whether • The measures let you know how whether you are achieving the goals? • You have a way to respond to the measures? 8 Avoid building dashboards just to use the data
  • 9.
    ©2015 Murray Cantor Thetwo key considerations to picking your measures: 9  Mixtures of work efforts  Level of the organization Work item, artifact completion Staff member Commits to Project, product delivery Project manager, team lead Commits to Efficiency, value deliverySenior manager Commits to Profit, return on investment Line of business executive Commits to
  • 10.
    ©2015 Murray Cantor Thetwo key considerations to picking your measures: 10  Mixtures of work efforts  Level of the organization Work item, artifact completion Staff member Commits to Project, product delivery Project manager, team lead Commits to Efficiency, value deliverySenior manager Commits to Profit, return on investment Line of business executive Commits to
  • 11.
    ©2015 Murray Cantor Kindsof Development Efforts: What is your mix? 11 1. Low innovation/high certainty • Detailed understanding of the requirements • Well understood code 2. Some innovation/ some uncertainty • Architecture/Design in place • Some discovery required to have confidence in requirements • Some refactoring/evolution of design might be required 3. High innovation/High Uncertainty • Requirements not fully understood, some experimentation might be required • May be alternatives in choice of technology • No initial design/architecture
  • 12.
    ©2015 Murray Cantor Themethods landscape 12 Kanban Lean startup: MVP Agile, Scrum Product Development Flow Systems/Software Engineering Lean Software Podular Org. Liminal Thinking. Technical Debt Management Iterative learning: Updating estimates and plans in the face of evidence DevOps/Continuous Delivery
  • 13.
    ©2015 Murray Cantor Differentdisciplines apply to different parts of the landscape 13 Lean Manufacturing Innovation Management Queuing Theory Systems Theory Toyota Management System Agile Management Bayesian Nets Analytics Quality Control
  • 14.
    ©2015 Murray Cantor Thedifferent types of efforts requires different sorts of analytics Descriptive Bayesian Descriptive • Counts, percentages • Averages (means, medians) • Percentiles Bayesian • Probabilities • Risks • Uncertainties
  • 15.
    ©2015 Murray Cantor DescriptiveExample: A Value Stream model for routine efforts 15 Control challenges • Random arrival intervals • Variation of effort to address work items (unlike standardized manufacturing)
  • 16.
    ©2015 Murray Cantor Descriptiveexample: Cycle times 16 These will be described in more detail in next webinar
  • 17.
    ©2015 Murray Cantor Bayesis the way for development teams and management to deal with uncertainties  In types II and III development, quantities such as time, cost to complete, and velocity are not known for certain. • There is not enough known to make exact predictions • You need to utilize the actual data you produce sprint by sprint  Bayesian analysis is the centuries old method for rigorously dealing with with uncertain quantities.  Bayesian analytics allows everyone on the team to learn together. 17  Attributes of Bayes:  Uncertain quantities are specified probabilities  The probabilities capture both the best/worst estimates and the level of uncertainty  The probabilities/beliefs are updated as information, evidence comes in.  The probability distributions can be “added,” “multiplied,” etc.
  • 18.
    ©2015 Murray Cantor BayesianExample 18 This will be described in more detail in next webinar
  • 19.
    ©2015 Murray Cantor DifferentTypes, Different Analytics (examples) Type 1 Type 2 Type 3 Goals Efficiency Efficiency Efficiency Timely delivery of value Innovation Organization Continuous delivery teams Integrated horizontal teams Small expert teams Work Style Backlog management Scrum Lean Startup/MVP/ Experimentation Challenges Timeliness vs utilization Prioritization Business/IT alignment Feature selection Pivoting Analytics Flow control Cycle times Cost of delay Costs of delays Cycle times Time/cost probabilities Time/cost probabilities Value at delivery 19
  • 20.
    ©2015 Murray Cantor Thetwo key considerations to choosing your measures: 20  Mixtures of work efforts  Level of the organization Work item, artifact completion Staff member Commits to Project, product delivery Project manager, team lead Commits to Efficiency, value deliverySenior manager Commits to Profit, return on investment Line of business executive Commits to
  • 21.
    ©2015 Murray Cantor Differentlevels, different goals 21 Work item, artifact completionStaff member Commits to Project, product delivery Project manager, team lead Commits to Efficiency, value deliverySenior manager Commits to Profit, return on investment Line of business executive Commits to
  • 22.
    ©2015 Murray Cantor Analyticsuseful for aligning goals  For each level to meet its goal, the leader is dependent on the lower level.  So, the leader seeks commitments from that layer. Meeting those commitments becomes the goal of the next layer.  Hence the analytics serve to integrate the organization 22
  • 23.
    ©2015 Murray Cantor Goals,feedback loops (examples) Type 1 Type 2 Type 3 Line of Business Executive Profits, returns on assets for lob, mission fulfillment Dev VP, CIO, … Costs Returns on assets, investment for division Meeting cost, schedule commitments for organization. Project manager, team lead Throughput in the face of variation of arrivals, size of work items • Throughput • Productivity • Meeting cost, schedule commitment for team Meeting cost, schedule commitment for team Staff member Productivity = (Completion of work items)/(complexity, difficulty) 23 The details can vary with the enterprise mission
  • 24.
    ©2015 Murray Cantor Tosummarize  There is no one-size fits all choice of measures  Measures must be part of some feedback, sense and respond loop  Choice of measures Depends chiefly on • Mixture of work • Level of organization  Much more detail to follow in next webinars . 24
  • 25.
    ©2015 Murray Cantor Twokey principles • Kelvin’s Principle: “To measure is to know. If you can not measure it, you can not improve it” – Measures are part of control loops • The converse principle: “Don’t bother to measure what you do not intend to improve” – Find a small set of measures, not a long laundry list 25
  • 26.
    ©2015 Murray Cantor Choosingmetrics big picture Agree on goals - Depends on the levels and mixture of work Agree on the how they fit into the loop 1. “How would we know we are achieving the goal” 2.” What response we take?” Determine the measures needed to answer the questions - Apply the Einstein test (as simple as possible, but no simpler) Specify the data needed to answer the questions Automate collection and staging of the data 26 Today Later
  • 27.
  • 29.
    This is thefirst of a series: 1. Selecting Analytics. Murray Cantor, Dave West. – Aligning the choice of measures with your organization’s efforts and goals 2. Designing and automating analytics. Murray Cantor, Nicole Bryan. – A straightforward method for finding your analytics solution • The dashboards, • the required data, and • an appropriate choice of analytical techniques and statistics to apply to the data. 3. Building the Analytics Environment. Murray Cantor, Nicole Bryan. – The data solution architecture and stack – How Tasktop can help. 29 http://tasktop.com/webinars
  • 30.
  • 31.