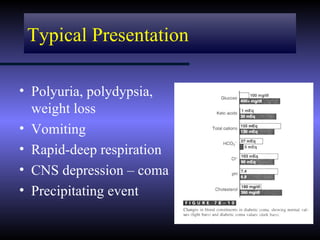
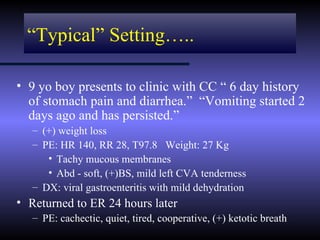
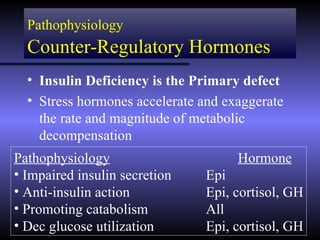
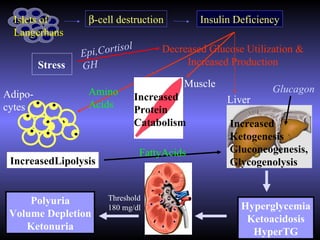
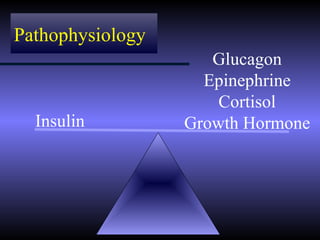
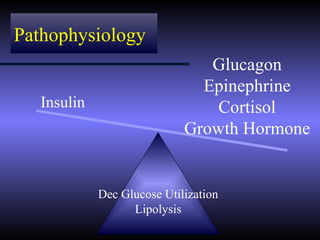
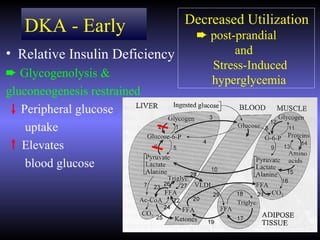
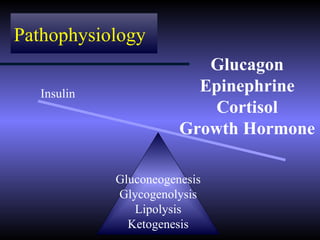
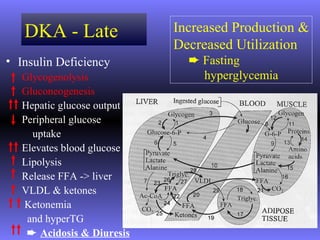
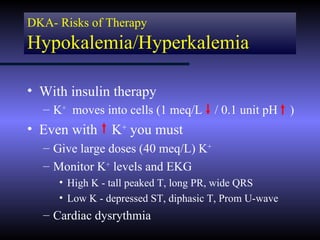
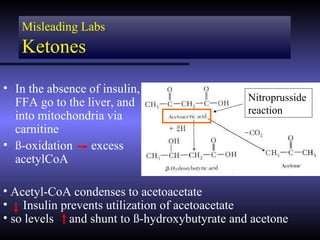
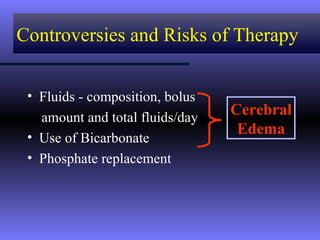
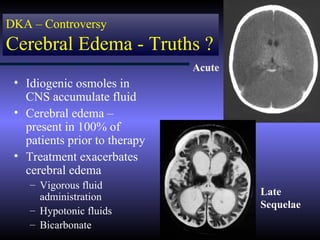
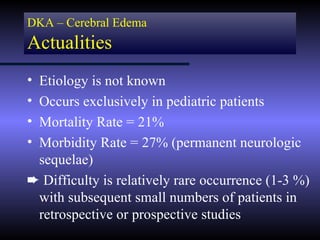
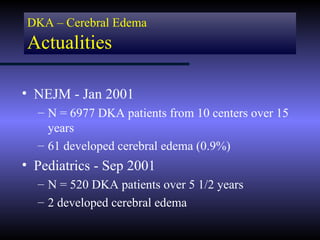
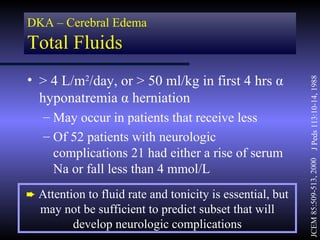
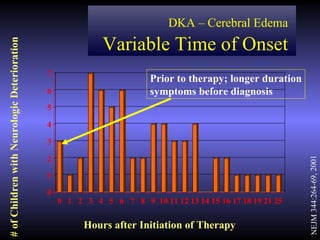
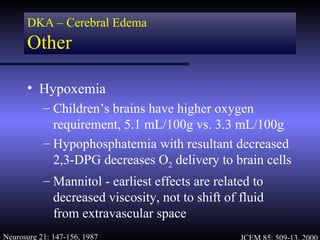
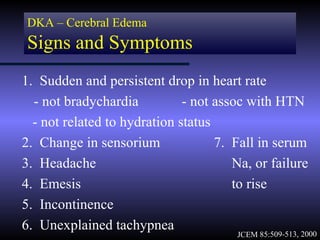
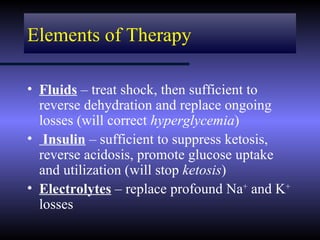
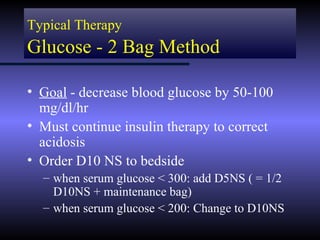
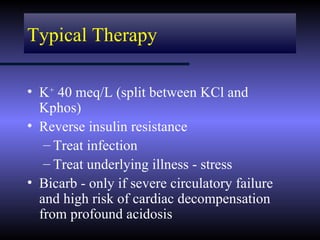
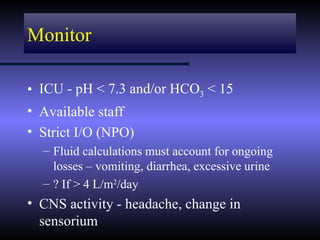
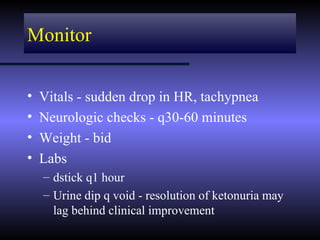
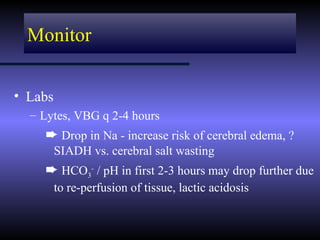
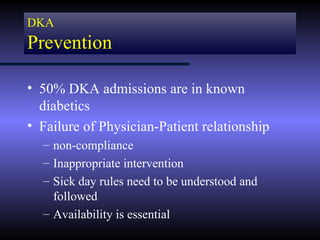
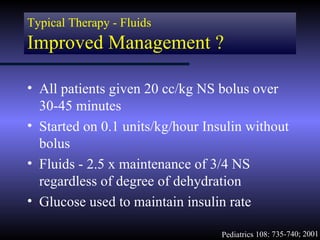
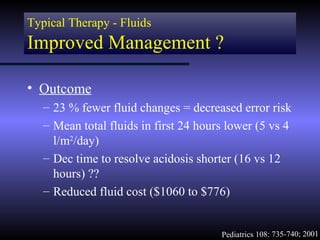
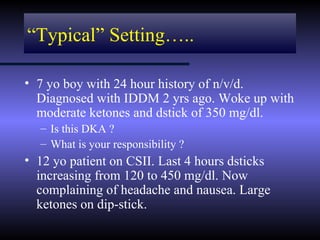
DIABETIC KETOACIDOSIS


         Andrew J. Bauer
      Pediatric Endocrinology
             WRAMC
GOALS

• REVIEW TYPE 1
  DIABETES AND
  METABOLISM AS
  THEY RELATES TO
  DKA
• CLINICAL DIAGNOSIS and MISLEADING
  LABS
• TREATMENT and CONTROVERSIES
• TREATMENT GUIDELINES
Type 1 DM

• Autoimmune destruction
  of the pancreatic islet
  cell
• Hallmark = lymphocytic
  infiltration of islets
• Progresses over years
• Leads to insulin
  deficiency
• Later may be associated
  with glucagon
  deficiency as well
Progression to Type 1 DM


                     Autoimmune destruction

                               Honeymoon


                               100% Islet loss
      “Diabetes threshold”
Typical Presentation

• Polyuria, polydypsia,
  weight loss
• Vomiting
• Rapid-deep respiration
• CNS depression – coma
• Precipitating event
“Typical” Setting…..

• 9 yo boy presents to clinic with CC “ 6 day history
  of stomach pain and diarrhea.” “Vomiting started 2
  days ago and has persisted.”
   – (+) weight loss
   – PE: HR 140, RR 28, T97.8 Weight: 27 Kg
      • Tachy mucous membranes
      • Abd - soft, (+)BS, mild left CVA tenderness
   – DX: viral gastroenteritis with mild dehydration
• Returned to ER 24 hours later
   – PE: cachectic, quiet, tired, cooperative, (+) ketotic breath
Background

• 15-30% of new diabetics present in DKA
  – < 4 yrs of age = 40% with DKA @ diagnosis
• Most common cause of death in diabetics
  less than 20 years of age
  – 70% of related deaths in diabetics less than 10
    yrs of age
• Mortality: 5-15% (1-2% at MEDCEN)
• Preventable
Diagnostic Criteria


• Blood glucose > 250 mg/dl
• pH < 7.35
• HCO3 < 20 mEq/L
• Anion Gap > 12
• ketonemia
Etiology


• Results from inadequate insulin
  – Accidental or intentional omission
  – Inappropriate intervention when stressed
Etiology


² DKA violates rules of common sense
  • Increased insulin requirement despite decreased
    food intake
  • Marked urine output in setting of dehydration
  • Catabolic state in setting of hyperglycemia and
    hyperlipidemia
Pathophysiology
  Counter-Regulatory Hormones
  • Insulin Deficiency is the Primary defect
  • Stress hormones accelerate and exaggerate
    the rate and magnitude of metabolic
    decompensation
Pathophysiology                      Hormone
• Impaired insulin secretion    Epi
• Anti-insulin action           Epi, cortisol, GH
• Promoting catabolism          All
• Dec glucose utilization       Epi, cortisol, GH
Islets of         β-cell destruction           Insulin Deficiency
  Langerhans
                               l
                  Ep i,Cortiso          Decreased Glucose Utilization &
         Stress   GH                         Increased Production

                                             Muscle
Adipo-              Amino                                        Glucagon
                                   Increased           Liver
cytes               Acids          Protein
                                   Catabolism          Increased
                                                       Ketogenesis
                                    FattyAcids         Gluconeogenesis,
 IncreasedLipolysis                                    Glycogenolysis


     Polyuria            Threshold
                         180 mg/dl                        Hyperglycemia
 Volume Depletion
                                                           Ketoacidosis
    Ketonuria
                                                            HyperTG
Pathophysiology
                     Glucagon
                    Epinephrine
                      Cortisol
  Insulin         Growth Hormone
Pathophysiology
                                Glucagon
                               Epinephrine
   Insulin                       Cortisol
                             Growth Hormone


             Dec Glucose Utilization
                   Lipolysis
Decreased Utilization
   DKA - Early                    ² post-prandial
• Relative Insulin Deficiency            and
                                    Stress-Induced
² Glycogenolysis &
                                    hyperglycemia
gluconeogenesis restrained
   Peripheral glucose
    uptake
   Elevates
    blood glucose
Pathophysiology
                           Glucagon
   Insulin                Epinephrine
                            Cortisol
                        Growth Hormone

             Gluconeogenesis
             Glycogenolysis
                Lipolysis
               Ketogenesis
DKA - Late               Increased Production &
                            Decreased Utilization
• Insulin Deficiency          ² Fasting
   Glycogenolysis               hyperglycemia
   Gluconeogenesis
   Hepatic glucose output
   Peripheral glucose
     uptake
   Elevates blood glucose
   Lipolysis
   Release FFA -> liver
   VLDL & ketones
   Ketonemia
    and hyperTG
    ² Acidosis & Diuresis
DKA
Initial Evaluation
• Hx and PE -
  – Duration of onset
  – Level of dehydration      Osmolality
                            = 2 x (Na + K)
  – Evidence of infection
                            + Glucose/18
• Labs - STAT                  + BUN/3
  –   Electrolytes
  –   Venous blood gas
  –   Serum Osmolality
  –   U/a
9 yo lab Evaluation

• 148| 109| 32              16.8 518
                 700   24.4
  5.6 | <5 | 1.4            47.5

• Blood Gas - pH 7.0   5/1.020
                       Glu >1000, (+) Ketones
9 yo lab Evaluation

• 148| 109| 32              16.8 518
                 700   24.4
  5.6 | <5 | 1.4            47.5

• Blood Gas - pH 7.0   5/1.020
                       Glu >1000, (+) Ketones
Misleading Labs

•   Sodium
•   Potassium
•   Ketones
•   WBC
Misleading Labs
 Sodium

• Na+ depressed 1.6 mEq/L per 100 mg% glucose
• Corrected Na+ = measured Na +
                1.6 meq/L x (glucose-100)/100))
• Example:
  – Na+ = 123 meq/L and Glucose = 1,250 mg/dl
  – 1,250 – 100 = 1,150 / 100 = 11.5 x 1.6 = 18 meq/L
  – Corrected Na+ = 123 + 18 = 141 meq/L
Misleading Labs
 Sodium

• Triglycerides also artificially lower Na


        Lipid                     Lipid
        Na Na Na
         Na Na Na
                    Serum         Na Na
        Na Na Na                   Gluc Na
                                  Na Gluc
Misleading Labs
Potassium

• Acidosis leads to flux of K+ out of cells as H+
  enters cells to buffer
• Dehydration and volume depletion
   – Aldosterone ² Na reabsorption and K+
    wasting
² Serum K+ usually normal or high, but total
  body K+ is low
DKA- Risks of Therapy
Hypokalemia/Hyperkalemia

• With insulin therapy
  – K+ moves into cells (1 meq/L / 0.1 unit pH )
• Even with     K+ you must
  – Give large doses (40 meq/L) K+
  – Monitor K+ levels and EKG
     • High K - tall peaked T, long PR, wide QRS
     • Low K - depressed ST, diphasic T, Prom U-wave
  – Cardiac dysrythmia
Misleading Labs
   Ketones

• In the absence of insulin,
  FFA go to the liver, and                    Nitroprusside
                                              reaction
  into mitochondria via
  carnitine
• ß-oxidation excess
  acetylCoA

• Acetyl-CoA condenses to acetoacetate
• Insulin prevents utilization of acetoacetate
• so levels and shunt to ß-hydroxybutyrate and acetone
Misleading Labs
Screening for Ketonemia

• Urine Dip stick vs. anion gap/serum bicarb
           Sensitivity      Specificity
DKA          99 %             69 %
² Diabetic with minor signs and symptoms
  and negative urine ketone dip stick is
  unlikely to have acidosis
  = high negative predictive value for
                     excluding DKA
                                   Am J Emer Med 34: 1999
Misleading Labs
WBC count

• N = 247 DKA admissions over 6 years
  –   Mean WBC = 17,519/mm3 (+/- 9,582)
  –   69% without infection
  –   17.8% presumed viral infection
  –   12.9% bacterial infection - more common in
      children < 3 years of age

  ² All need to be evaluated and re-evaluated if
                  persistent acidosis
                                        Am J Emer Med 19: 270-3, 2001
Let’s start treatment…..
Controversies and Risks of Therapy


 • Fluids - composition, bolus
   amount and total fluids/day
                                 Cerebral
 • Use of Bicarbonate
                                  Edema
 • Phosphate replacement
DKA – Controversy
Cerebral Edema - Truths ?
                               Acute
 • Idiogenic osmoles in
   CNS accumulate fluid
 • Cerebral edema –
   present in 100% of
   patients prior to therapy
 • Treatment exacerbates
   cerebral edema
    – Vigorous fluid
      administration                   Late
                                       Sequelae
    – Hypotonic fluids
    – Bicarbonate
DKA – Cerebral Edema
Actualities
•Etiology is not known
•Occurs exclusively in pediatric patients
•Mortality Rate = 21%
•Morbidity Rate = 27% (permanent neurologic
 sequelae)
² Difficulty is relatively rare occurrence (1-3 %)
 with subsequent small numbers of patients in
 retrospective or prospective studies
DKA – Cerebral Edema
Actualities

• NEJM - Jan 2001
  – N = 6977 DKA patients from 10 centers over 15
    years
  – 61 developed cerebral edema (0.9%)
• Pediatrics - Sep 2001
  – N = 520 DKA patients over 5 1/2 years
  – 2 developed cerebral edema
DKA – Cerebral Edema
Total Fluids
• > 4 L/m2/day, or > 50 ml/kg in first 4 hrs α


                                                           JCEM 85:509-513, 2000 J Peds 113:10-14, 1988
  hyponatremia α herniation
   – May occur in patients that receive less
   – Of 52 patients with neurologic
     complications 21 had either a rise of serum
     Na or fall less than 4 mmol/L
² Attention to fluid rate and tonicity is essential, but
  may not be sufficient to predict subset that will
       develop neurologic complications
DKA – Cerebral Edema
                                                             Variable Time of Onset
# of Children with Neurologic Deterioration


                                              7
                                                                        Prior to therapy; longer duration
                                              6                         symptoms before diagnosis
                                              5

                                              4

                                              3

                                              2


                                                                                                            NEJM 344:264-69, 2001
                                              1

                                              0
                                                  0 1 2 3 4 5 6 7 8 9 10 11 12 13 14 15 16 17 18 19 21 25

                                                        Hours after Initiation of Therapy
DKA – Cerebral Edema
      Other

      • Hypoxemia
           – Children’s brains have higher oxygen
             requirement, 5.1 mL/100g vs. 3.3 mL/100g
           – Hypophosphatemia with resultant decreased
             2,3-DPG decreases O2 delivery to brain cells
           – Mannitol - earliest effects are related to
             decreased viscosity, not to shift of fluid
             from extravascular space
Neurosurg 21: 147-156, 1987
DKA – Cerebral Edema
Signs and Symptoms
1. Sudden and persistent drop in heart rate
  - not bradychardia          - not assoc with HTN
  - not related to hydration status
2. Change in sensorium              7. Fall in serum
3. Headache                            Na, or failure
4. Emesis                              to rise
5. Incontinence
6. Unexplained tachypnea
                                       JCEM 85:509-513, 2000
DKA – Cerebral Edema
Evaluation
• CT may be non-diagnostic at time of
  symptoms
  – 9 of 30 - no edema, 6 read as normal
  – 5 of 9 - 2.5 to 8 hours after onset of coma, read as
    normal

  ² Cerebral  Edema is a clinical diagnosis.
       Need to treat BEFORE imaging.

                                          JCEM 85:509-513, 2000
DKA – Risks of Therapy
Bicarbonate Administration

• Administration to acidotic patient generates
  rapid rise in CO2
• CO2 enters CNS rapidly
• HCO3- is delayed by blood-brain barrier
• Increased CNS CO2 exacerbates cerebral
  acidosis
    CO2 + H2O     H2CO3     H+ + HCO3-
• May also reduce partial pressure of O2 in CSF
DKA – Risks of Therapy
    Bicarbonate Administration

• Multi-center study from 10 pediatric centers, USA
  and Melbourne, Australia over 15 yr period
  – 6977 DKA hospitalizations: 61 cases cerebral edema
    (0.9%)
• Presentation: PaCO2 BUN Glucose                 Bicarb
 Cerebral Edema   11.3       27       758      23/61 (32%)
 Controls         15.1       21       700      43/174 (23%)
∀ ≠ fluid, insulin, or sodium administration, nor rate
  of fall in glucose was associated
                                            NEJM 344:264-269, 2001
**** ****
                                                     ****
DKA – Risks of Therapy                                   ****
                                                     **** ****
                                                      ********
Bicarbonate Administration

• Variations in treatment exacerbate an on-going
  pathologic process
• Brain ischemia is major underline etiology
  – Hyperglycemia increases extent of neurologic damage
  – Extreme dehydration, hypocapnia
  – Concept of idiogenic osmotically active substances not
    supported (no relationship to change in glucose, rate of
    fluid or Na administration)
  ² Risk related to duration and severity of DKA
                                             NEJM 344:264-269, 2001
DKA- Controversy
  Phosphate
Theoretical
 • Essential phosphate deficit
 • W/treatment serum phosphate and 2,3-DPG fall
 • Shift oxyhemoglobin curve reducing O2 deliver
Practical
 • No evidence of direct benefit, but less Cl-
 • Give ½ K+ replacement as K-phos x 8 hours
 • Limit to 2 mEq/kg/day to avoid hypocalcemia
                                   Endo Met Clin 29:Dec 2000
Elements of Therapy
Elements of Therapy

• Fluids – treat shock, then sufficient to
  reverse dehydration and replace ongoing
  losses (will correct hyperglycemia)
• Insulin – sufficient to suppress ketosis,
  reverse acidosis, promote glucose uptake
  and utilization (will stop ketosis)
• Electrolytes – replace profound Na+ and K+
  losses
Typical Therapy - Fluids

• 10% dehydration is standard estimate (use
  vweight if known)
   – Bolus: treat shock, usual 20-30cc/kg
     given 10cc/kg at a time
   – Replace deficit over 48-72 hours
   – ie. 10 % in 20 Kg pt = 2000ml over 48hrs
     = maintenance + 42cc/hr x 48 hours
Typical Therapy - Fluids

• Use ½ NS to NS
• Average = 2 x maintenance
  – 4:2:1 cc/kg/hr or 100:50:20 cc/kg/day
  – ie. 25 kg patient
     • (4 x 10) + (2 x 10) + (1 x 5) = 65 cc/hr
     • (100 x 10) + (50 x 10) + (20 x 5)/24 hours
        = 66.7 cc/hr
DKA – Risks of Therapy
  Insulin
                    100%

                 Biological
                                          0.1 units/kg/hr
                 effect


Current therapy uses
continuous insulin drip                 100 uU/ml
² Drop glucose                Insulin Level
50-100 mg/dl/hr
Typical Therapy - Insulin

• 0.1 unit/kg/hr continuous drip (regular)
   – Flush tubing with 50 ml
   – 250 units regular in 250 cc NS (1.0 units/
     ml)
   = 0.1 u/kg/hr = 0.1 ml/kg/hr
Typical Therapy
Glucose - 2 Bag Method

• Goal - decrease blood glucose by 50-100
  mg/dl/hr
• Must continue insulin therapy to correct
  acidosis
• Order D10 NS to bedside
  – when serum glucose < 300: add D5NS ( = 1/2
    D10NS + maintenance bag)
  – when serum glucose < 200: Change to D10NS
Typical Therapy

• K+ 40 meq/L (split between KCl and
  Kphos)
• Reverse insulin resistance
   – Treat infection
   – Treat underlying illness - stress
• Bicarb - only if severe circulatory failure
  and high risk of cardiac decompensation
  from profound acidosis
Monitor

• ICU - pH < 7.3 and/or HCO3 < 15
• Available staff
• Strict I/O (NPO)
  – Fluid calculations must account for ongoing
    losses – vomiting, diarrhea, excessive urine
  – ? If > 4 L/m2/day
• CNS activity - headache, change in
  sensorium
Monitor


•   Vitals - sudden drop in HR, tachypnea
•   Neurologic checks - q30-60 minutes
•   Weight - bid
•   Labs
    – dstick q1 hour
    – Urine dip q void - resolution of ketonuria may
      lag behind clinical improvement
Monitor


• Labs
  – Lytes, VBG q 2-4 hours
    ² Drop in Na - increase risk of cerebral edema, ?
         SIADH vs. cerebral salt wasting
    ² HCO3- / pH in first 2-3 hours may drop further due
         to re-perfusion of tissue, lactic acidosis
DKA
Guidelines

• Common ground to start from
• Does not eliminate need to individualize
  therapy
• Large deviations should be an opportunity
  to critically review clinical and therapeutic
  course
DKA
Flowsheet

• CIS is not a flow sheet, but rather a
  database
• Inability to review all data at one time
  decreases ability to make sound decisions
• Maintenance of flowsheet is the first step
  in critical analysis of response to therapy
9 yo lab Evaluation

• 27 Kg - assume 10% dehydrated
• 148| 109| 32            16.8 518
                 700 24.4
  5.6 | <5 | 1.4          47.5

• Anion Gap =          • Fluid Def =
• Osm =                • Maintenance =
• Corrected Na =       • IV rate (24hrs) =
Transport of Patient with DKA

• 2 large bore PIV
• Must have documentation of previous
  treatments
  –   PE with vitals and notes on mental status
  –   Fluids - bolus and current
  –   ? SQ Insulin given - time and amount
  –   Contact phone number for labs/cultures
• Must have glucagon, mannitol and IV
  glucose with patient at ALL times
DKA
Prevention

• 50% DKA admissions are in known
  diabetics
• Failure of Physician-Patient relationship
  – non-compliance
  – Inappropriate intervention
  – Sick day rules need to be understood and
    followed
  – Availability is essential
Typical Therapy - Fluids
Improved Management ?

• All patients given 20 cc/kg NS bolus over
  30-45 minutes
• Started on 0.1 units/kg/hour Insulin without
  bolus
• Fluids - 2.5 x maintenance of 3/4 NS
  regardless of degree of dehydration
• Glucose used to maintain insulin rate

                                  Pediatrics 108: 735-740; 2001
Typical Therapy - Fluids
Improved Management ?

• Outcome
   – 23 % fewer fluid changes = decreased error risk
   – Mean total fluids in first 24 hours lower (5 vs 4
     l/m2/day)
   – Dec time to resolve acidosis shorter (16 vs 12
     hours) ??
   – Reduced fluid cost ($1060 to $776)


                                       Pediatrics 108: 735-740; 2001
“Typical” Setting…..

• 7 yo boy with 24 hour history of n/v/d.
  Diagnosed with IDDM 2 yrs ago. Woke up with
  moderate ketones and dstick of 350 mg/dl.
  – Is this DKA ?
  – What is your responsibility ?
• 12 yo patient on CSII. Last 4 hours dsticks
  increasing from 120 to 450 mg/dl. Now
  complaining of headache and nausea. Large
  ketones on dip-stick.
DKA

• Acidosis
  – Primary buffer is intracellular protein
  – K+ moves out of cells and H+ moves in
  – In association with aldosterone (induced from
    hypovolemia)
     • Potentiates K+ wasting
         ²² Hypokalemia
EKG Changes During DKA


       Normal


Hi K                            Lo K
DKA – Cerebral Edema
Other

• Insulin associated activation of Na+/H+
  pump
  – Not commonly found during initial treatment
  – As acidosis resolves, H+ diffuses out of brain
    cells and Na+ enters (along with H20)
  – Rabbit model - drop in glucose secondary to
    insulin administration vs. peritoneal dialysis
    results in cerebral edema
1400
1200
1000
 800
                                                                            Glucose
 600
 400
 200
  0
           12   1   2       3       4       5       6       7       8

       7
  6.5
       6
  5.5
       5
                                                                                 K
  4.5
       4
  3.5
       3
           12   1       2       3       4       5       6       7       8

       8


  7.5


       7
                                                                                pH

  6.5


       6
           12   1   2           3       4       5       6       7       8

Dka by dr.irappa madabhavi

  • 1.
    DIABETIC KETOACIDOSIS Andrew J. Bauer Pediatric Endocrinology WRAMC
  • 2.
    GOALS • REVIEW TYPE1 DIABETES AND METABOLISM AS THEY RELATES TO DKA • CLINICAL DIAGNOSIS and MISLEADING LABS • TREATMENT and CONTROVERSIES • TREATMENT GUIDELINES
  • 3.
    Type 1 DM •Autoimmune destruction of the pancreatic islet cell • Hallmark = lymphocytic infiltration of islets • Progresses over years • Leads to insulin deficiency • Later may be associated with glucagon deficiency as well
  • 4.
    Progression to Type1 DM Autoimmune destruction Honeymoon 100% Islet loss “Diabetes threshold”
  • 5.
    Typical Presentation • Polyuria,polydypsia, weight loss • Vomiting • Rapid-deep respiration • CNS depression – coma • Precipitating event
  • 6.
    “Typical” Setting….. • 9yo boy presents to clinic with CC “ 6 day history of stomach pain and diarrhea.” “Vomiting started 2 days ago and has persisted.” – (+) weight loss – PE: HR 140, RR 28, T97.8 Weight: 27 Kg • Tachy mucous membranes • Abd - soft, (+)BS, mild left CVA tenderness – DX: viral gastroenteritis with mild dehydration • Returned to ER 24 hours later – PE: cachectic, quiet, tired, cooperative, (+) ketotic breath
  • 7.
    Background • 15-30% ofnew diabetics present in DKA – < 4 yrs of age = 40% with DKA @ diagnosis • Most common cause of death in diabetics less than 20 years of age – 70% of related deaths in diabetics less than 10 yrs of age • Mortality: 5-15% (1-2% at MEDCEN) • Preventable
  • 8.
    Diagnostic Criteria • Bloodglucose > 250 mg/dl • pH < 7.35 • HCO3 < 20 mEq/L • Anion Gap > 12 • ketonemia
  • 9.
    Etiology • Results frominadequate insulin – Accidental or intentional omission – Inappropriate intervention when stressed
  • 10.
    Etiology ² DKA violatesrules of common sense • Increased insulin requirement despite decreased food intake • Marked urine output in setting of dehydration • Catabolic state in setting of hyperglycemia and hyperlipidemia
  • 11.
    Pathophysiology Counter-RegulatoryHormones • Insulin Deficiency is the Primary defect • Stress hormones accelerate and exaggerate the rate and magnitude of metabolic decompensation Pathophysiology Hormone • Impaired insulin secretion Epi • Anti-insulin action Epi, cortisol, GH • Promoting catabolism All • Dec glucose utilization Epi, cortisol, GH
  • 12.
    Islets of β-cell destruction Insulin Deficiency Langerhans l Ep i,Cortiso Decreased Glucose Utilization & Stress GH Increased Production Muscle Adipo- Amino Glucagon Increased Liver cytes Acids Protein Catabolism Increased Ketogenesis FattyAcids Gluconeogenesis, IncreasedLipolysis Glycogenolysis Polyuria Threshold 180 mg/dl Hyperglycemia Volume Depletion Ketoacidosis Ketonuria HyperTG
  • 13.
    Pathophysiology Glucagon Epinephrine Cortisol Insulin Growth Hormone
  • 14.
    Pathophysiology Glucagon Epinephrine Insulin Cortisol Growth Hormone Dec Glucose Utilization Lipolysis
  • 15.
    Decreased Utilization DKA - Early ² post-prandial • Relative Insulin Deficiency and Stress-Induced ² Glycogenolysis & hyperglycemia gluconeogenesis restrained Peripheral glucose uptake Elevates blood glucose
  • 16.
    Pathophysiology Glucagon Insulin Epinephrine Cortisol Growth Hormone Gluconeogenesis Glycogenolysis Lipolysis Ketogenesis
  • 17.
    DKA - Late Increased Production & Decreased Utilization • Insulin Deficiency ² Fasting Glycogenolysis hyperglycemia Gluconeogenesis Hepatic glucose output Peripheral glucose uptake Elevates blood glucose Lipolysis Release FFA -> liver VLDL & ketones Ketonemia and hyperTG ² Acidosis & Diuresis
  • 18.
    DKA Initial Evaluation • Hxand PE - – Duration of onset – Level of dehydration Osmolality = 2 x (Na + K) – Evidence of infection + Glucose/18 • Labs - STAT + BUN/3 – Electrolytes – Venous blood gas – Serum Osmolality – U/a
  • 19.
    9 yo labEvaluation • 148| 109| 32 16.8 518 700 24.4 5.6 | <5 | 1.4 47.5 • Blood Gas - pH 7.0 5/1.020 Glu >1000, (+) Ketones
  • 20.
    9 yo labEvaluation • 148| 109| 32 16.8 518 700 24.4 5.6 | <5 | 1.4 47.5 • Blood Gas - pH 7.0 5/1.020 Glu >1000, (+) Ketones
  • 21.
    Misleading Labs • Sodium • Potassium • Ketones • WBC
  • 22.
    Misleading Labs Sodium •Na+ depressed 1.6 mEq/L per 100 mg% glucose • Corrected Na+ = measured Na + 1.6 meq/L x (glucose-100)/100)) • Example: – Na+ = 123 meq/L and Glucose = 1,250 mg/dl – 1,250 – 100 = 1,150 / 100 = 11.5 x 1.6 = 18 meq/L – Corrected Na+ = 123 + 18 = 141 meq/L
  • 23.
    Misleading Labs Sodium •Triglycerides also artificially lower Na Lipid Lipid Na Na Na Na Na Na Serum Na Na Na Na Na Gluc Na Na Gluc
  • 24.
    Misleading Labs Potassium • Acidosisleads to flux of K+ out of cells as H+ enters cells to buffer • Dehydration and volume depletion – Aldosterone ² Na reabsorption and K+ wasting ² Serum K+ usually normal or high, but total body K+ is low
  • 25.
    DKA- Risks ofTherapy Hypokalemia/Hyperkalemia • With insulin therapy – K+ moves into cells (1 meq/L / 0.1 unit pH ) • Even with K+ you must – Give large doses (40 meq/L) K+ – Monitor K+ levels and EKG • High K - tall peaked T, long PR, wide QRS • Low K - depressed ST, diphasic T, Prom U-wave – Cardiac dysrythmia
  • 26.
    Misleading Labs Ketones • In the absence of insulin, FFA go to the liver, and Nitroprusside reaction into mitochondria via carnitine • ß-oxidation excess acetylCoA • Acetyl-CoA condenses to acetoacetate • Insulin prevents utilization of acetoacetate • so levels and shunt to ß-hydroxybutyrate and acetone
  • 27.
    Misleading Labs Screening forKetonemia • Urine Dip stick vs. anion gap/serum bicarb Sensitivity Specificity DKA 99 % 69 % ² Diabetic with minor signs and symptoms and negative urine ketone dip stick is unlikely to have acidosis = high negative predictive value for excluding DKA Am J Emer Med 34: 1999
  • 28.
    Misleading Labs WBC count •N = 247 DKA admissions over 6 years – Mean WBC = 17,519/mm3 (+/- 9,582) – 69% without infection – 17.8% presumed viral infection – 12.9% bacterial infection - more common in children < 3 years of age ² All need to be evaluated and re-evaluated if persistent acidosis Am J Emer Med 19: 270-3, 2001
  • 29.
  • 30.
    Controversies and Risksof Therapy • Fluids - composition, bolus amount and total fluids/day Cerebral • Use of Bicarbonate Edema • Phosphate replacement
  • 31.
    DKA – Controversy CerebralEdema - Truths ? Acute • Idiogenic osmoles in CNS accumulate fluid • Cerebral edema – present in 100% of patients prior to therapy • Treatment exacerbates cerebral edema – Vigorous fluid administration Late Sequelae – Hypotonic fluids – Bicarbonate
  • 32.
    DKA – CerebralEdema Actualities •Etiology is not known •Occurs exclusively in pediatric patients •Mortality Rate = 21% •Morbidity Rate = 27% (permanent neurologic sequelae) ² Difficulty is relatively rare occurrence (1-3 %) with subsequent small numbers of patients in retrospective or prospective studies
  • 33.
    DKA – CerebralEdema Actualities • NEJM - Jan 2001 – N = 6977 DKA patients from 10 centers over 15 years – 61 developed cerebral edema (0.9%) • Pediatrics - Sep 2001 – N = 520 DKA patients over 5 1/2 years – 2 developed cerebral edema
  • 34.
    DKA – CerebralEdema Total Fluids • > 4 L/m2/day, or > 50 ml/kg in first 4 hrs α JCEM 85:509-513, 2000 J Peds 113:10-14, 1988 hyponatremia α herniation – May occur in patients that receive less – Of 52 patients with neurologic complications 21 had either a rise of serum Na or fall less than 4 mmol/L ² Attention to fluid rate and tonicity is essential, but may not be sufficient to predict subset that will develop neurologic complications
  • 35.
    DKA – CerebralEdema Total Fluids • > 4 L/m2/day, or > 50 ml/kg in first 4 hrs α JCEM 85:509-513, 2000 J Peds 113:10-14, 1988 hyponatremia α herniation – May occur in patients that receive less – Of 52 patients with neurologic complications 21 had either a rise of serum Na or fall less than 4 mmol/L ² Attention to fluid rate and tonicity is essential, but may not be sufficient to predict subset that will develop neurologic complications
  • 36.
    DKA – CerebralEdema Variable Time of Onset # of Children with Neurologic Deterioration 7 Prior to therapy; longer duration 6 symptoms before diagnosis 5 4 3 2 NEJM 344:264-69, 2001 1 0 0 1 2 3 4 5 6 7 8 9 10 11 12 13 14 15 16 17 18 19 21 25 Hours after Initiation of Therapy
  • 37.
    DKA – CerebralEdema Other • Hypoxemia – Children’s brains have higher oxygen requirement, 5.1 mL/100g vs. 3.3 mL/100g – Hypophosphatemia with resultant decreased 2,3-DPG decreases O2 delivery to brain cells – Mannitol - earliest effects are related to decreased viscosity, not to shift of fluid from extravascular space Neurosurg 21: 147-156, 1987
  • 38.
    DKA – CerebralEdema Signs and Symptoms 1. Sudden and persistent drop in heart rate - not bradychardia - not assoc with HTN - not related to hydration status 2. Change in sensorium 7. Fall in serum 3. Headache Na, or failure 4. Emesis to rise 5. Incontinence 6. Unexplained tachypnea JCEM 85:509-513, 2000
  • 39.
    DKA – CerebralEdema Evaluation • CT may be non-diagnostic at time of symptoms – 9 of 30 - no edema, 6 read as normal – 5 of 9 - 2.5 to 8 hours after onset of coma, read as normal ² Cerebral Edema is a clinical diagnosis. Need to treat BEFORE imaging. JCEM 85:509-513, 2000
  • 40.
    DKA – Risksof Therapy Bicarbonate Administration • Administration to acidotic patient generates rapid rise in CO2 • CO2 enters CNS rapidly • HCO3- is delayed by blood-brain barrier • Increased CNS CO2 exacerbates cerebral acidosis CO2 + H2O H2CO3 H+ + HCO3- • May also reduce partial pressure of O2 in CSF
  • 41.
    DKA – Risksof Therapy Bicarbonate Administration • Multi-center study from 10 pediatric centers, USA and Melbourne, Australia over 15 yr period – 6977 DKA hospitalizations: 61 cases cerebral edema (0.9%) • Presentation: PaCO2 BUN Glucose Bicarb Cerebral Edema 11.3 27 758 23/61 (32%) Controls 15.1 21 700 43/174 (23%) ∀ ≠ fluid, insulin, or sodium administration, nor rate of fall in glucose was associated NEJM 344:264-269, 2001
  • 42.
    **** **** **** DKA – Risks of Therapy **** **** **** ******** Bicarbonate Administration • Variations in treatment exacerbate an on-going pathologic process • Brain ischemia is major underline etiology – Hyperglycemia increases extent of neurologic damage – Extreme dehydration, hypocapnia – Concept of idiogenic osmotically active substances not supported (no relationship to change in glucose, rate of fluid or Na administration) ² Risk related to duration and severity of DKA NEJM 344:264-269, 2001
  • 43.
    DKA- Controversy Phosphate Theoretical • Essential phosphate deficit • W/treatment serum phosphate and 2,3-DPG fall • Shift oxyhemoglobin curve reducing O2 deliver Practical • No evidence of direct benefit, but less Cl- • Give ½ K+ replacement as K-phos x 8 hours • Limit to 2 mEq/kg/day to avoid hypocalcemia Endo Met Clin 29:Dec 2000
  • 44.
  • 45.
    Elements of Therapy •Fluids – treat shock, then sufficient to reverse dehydration and replace ongoing losses (will correct hyperglycemia) • Insulin – sufficient to suppress ketosis, reverse acidosis, promote glucose uptake and utilization (will stop ketosis) • Electrolytes – replace profound Na+ and K+ losses
  • 46.
    Typical Therapy -Fluids • 10% dehydration is standard estimate (use vweight if known) – Bolus: treat shock, usual 20-30cc/kg given 10cc/kg at a time – Replace deficit over 48-72 hours – ie. 10 % in 20 Kg pt = 2000ml over 48hrs = maintenance + 42cc/hr x 48 hours
  • 47.
    Typical Therapy -Fluids • Use ½ NS to NS • Average = 2 x maintenance – 4:2:1 cc/kg/hr or 100:50:20 cc/kg/day – ie. 25 kg patient • (4 x 10) + (2 x 10) + (1 x 5) = 65 cc/hr • (100 x 10) + (50 x 10) + (20 x 5)/24 hours = 66.7 cc/hr
  • 48.
    DKA – Risksof Therapy Insulin 100% Biological 0.1 units/kg/hr effect Current therapy uses continuous insulin drip 100 uU/ml ² Drop glucose Insulin Level 50-100 mg/dl/hr
  • 49.
    Typical Therapy -Insulin • 0.1 unit/kg/hr continuous drip (regular) – Flush tubing with 50 ml – 250 units regular in 250 cc NS (1.0 units/ ml) = 0.1 u/kg/hr = 0.1 ml/kg/hr
  • 50.
    Typical Therapy Glucose -2 Bag Method • Goal - decrease blood glucose by 50-100 mg/dl/hr • Must continue insulin therapy to correct acidosis • Order D10 NS to bedside – when serum glucose < 300: add D5NS ( = 1/2 D10NS + maintenance bag) – when serum glucose < 200: Change to D10NS
  • 51.
    Typical Therapy • K+40 meq/L (split between KCl and Kphos) • Reverse insulin resistance – Treat infection – Treat underlying illness - stress • Bicarb - only if severe circulatory failure and high risk of cardiac decompensation from profound acidosis
  • 52.
    Monitor • ICU -pH < 7.3 and/or HCO3 < 15 • Available staff • Strict I/O (NPO) – Fluid calculations must account for ongoing losses – vomiting, diarrhea, excessive urine – ? If > 4 L/m2/day • CNS activity - headache, change in sensorium
  • 53.
    Monitor • Vitals - sudden drop in HR, tachypnea • Neurologic checks - q30-60 minutes • Weight - bid • Labs – dstick q1 hour – Urine dip q void - resolution of ketonuria may lag behind clinical improvement
  • 54.
    Monitor • Labs – Lytes, VBG q 2-4 hours ² Drop in Na - increase risk of cerebral edema, ? SIADH vs. cerebral salt wasting ² HCO3- / pH in first 2-3 hours may drop further due to re-perfusion of tissue, lactic acidosis
  • 55.
    DKA Guidelines • Common groundto start from • Does not eliminate need to individualize therapy • Large deviations should be an opportunity to critically review clinical and therapeutic course
  • 56.
    DKA Flowsheet • CIS isnot a flow sheet, but rather a database • Inability to review all data at one time decreases ability to make sound decisions • Maintenance of flowsheet is the first step in critical analysis of response to therapy
  • 57.
    9 yo labEvaluation • 27 Kg - assume 10% dehydrated • 148| 109| 32 16.8 518 700 24.4 5.6 | <5 | 1.4 47.5 • Anion Gap = • Fluid Def = • Osm = • Maintenance = • Corrected Na = • IV rate (24hrs) =
  • 58.
    Transport of Patientwith DKA • 2 large bore PIV • Must have documentation of previous treatments – PE with vitals and notes on mental status – Fluids - bolus and current – ? SQ Insulin given - time and amount – Contact phone number for labs/cultures • Must have glucagon, mannitol and IV glucose with patient at ALL times
  • 59.
    DKA Prevention • 50% DKAadmissions are in known diabetics • Failure of Physician-Patient relationship – non-compliance – Inappropriate intervention – Sick day rules need to be understood and followed – Availability is essential
  • 60.
    Typical Therapy -Fluids Improved Management ? • All patients given 20 cc/kg NS bolus over 30-45 minutes • Started on 0.1 units/kg/hour Insulin without bolus • Fluids - 2.5 x maintenance of 3/4 NS regardless of degree of dehydration • Glucose used to maintain insulin rate Pediatrics 108: 735-740; 2001
  • 61.
    Typical Therapy -Fluids Improved Management ? • Outcome – 23 % fewer fluid changes = decreased error risk – Mean total fluids in first 24 hours lower (5 vs 4 l/m2/day) – Dec time to resolve acidosis shorter (16 vs 12 hours) ?? – Reduced fluid cost ($1060 to $776) Pediatrics 108: 735-740; 2001
  • 62.
    “Typical” Setting….. • 7yo boy with 24 hour history of n/v/d. Diagnosed with IDDM 2 yrs ago. Woke up with moderate ketones and dstick of 350 mg/dl. – Is this DKA ? – What is your responsibility ? • 12 yo patient on CSII. Last 4 hours dsticks increasing from 120 to 450 mg/dl. Now complaining of headache and nausea. Large ketones on dip-stick.
  • 63.
    DKA • Acidosis – Primary buffer is intracellular protein – K+ moves out of cells and H+ moves in – In association with aldosterone (induced from hypovolemia) • Potentiates K+ wasting ²² Hypokalemia
  • 64.
    EKG Changes DuringDKA Normal Hi K Lo K
  • 65.
    DKA – CerebralEdema Other • Insulin associated activation of Na+/H+ pump – Not commonly found during initial treatment – As acidosis resolves, H+ diffuses out of brain cells and Na+ enters (along with H20) – Rabbit model - drop in glucose secondary to insulin administration vs. peritoneal dialysis results in cerebral edema
  • 66.
    1400 1200 1000 800 Glucose 600 400 200 0 12 1 2 3 4 5 6 7 8 7 6.5 6 5.5 5 K 4.5 4 3.5 3 12 1 2 3 4 5 6 7 8 8 7.5 7 pH 6.5 6 12 1 2 3 4 5 6 7 8