The document discusses company distribution policies to shareholders, including dividends and stock repurchases, examining investor preferences and the impact of taxes. It outlines various theories related to dividend relevance, signaling effects, and the residual distribution model, along with empirical evidence affecting dividend policies. The document also provides a comprehensive analysis of payout ratios across industries, trends over time, and the procedural aspects of dividend payments and stock repurchases.

![© 2020 Cengage Learning. All Rights Reserved. May not be
copied, scanned, or duplicated, in whole or in part, except for
use as permitted in a license distributed with a certain product
or service or otherwise on a password-protected website for
classroom use.
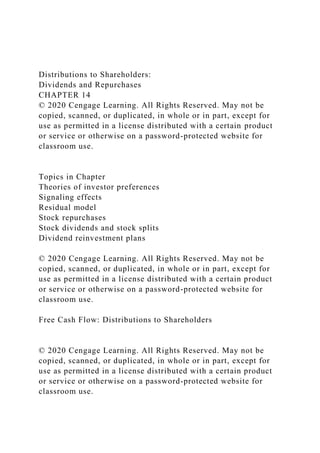
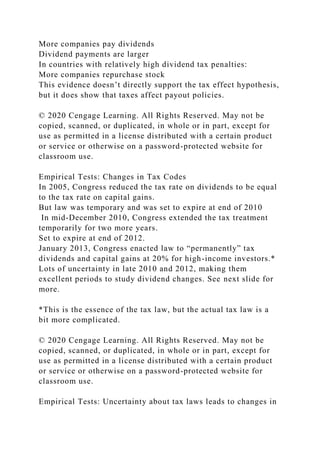
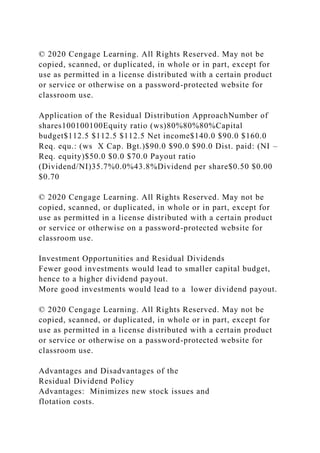
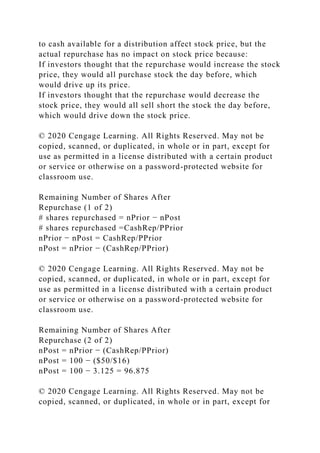
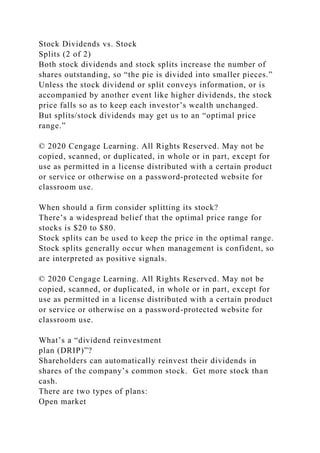
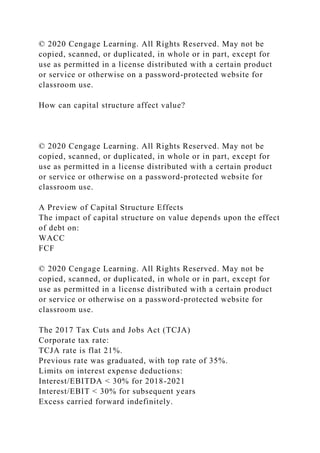
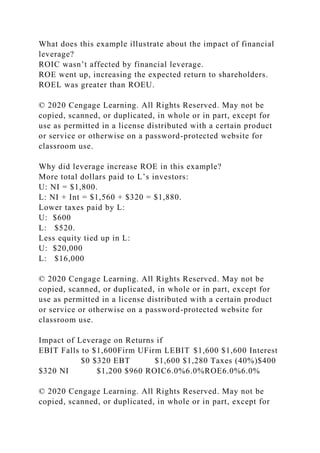
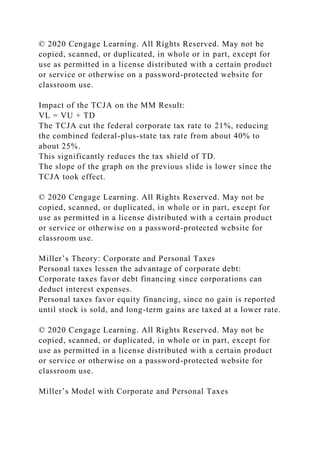
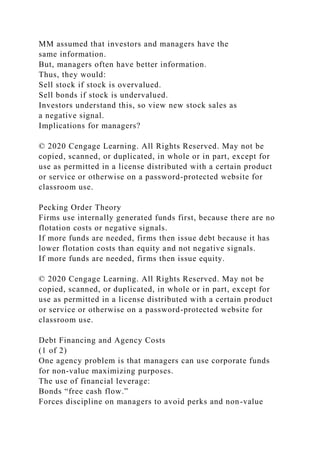
Choosing the Optimal Capital Structure: Example
b = 1.0; rRF = 6%; RPM = 6%.
Cost of equity using CAPM:
rs = rRF +b (RPM)= 6% + 1(6%) = 12%
Currently has no debt: wd = 0%.
WACC = rs = 12%.
Tax rate is T = 25%.
© 2020 Cengage Learning. All Rights Reserved. May not be
copied, scanned, or duplicated, in whole or in part, except for
use as permitted in a license distributed with a certain product
or service or otherwise on a password-protected website for
classroom use.
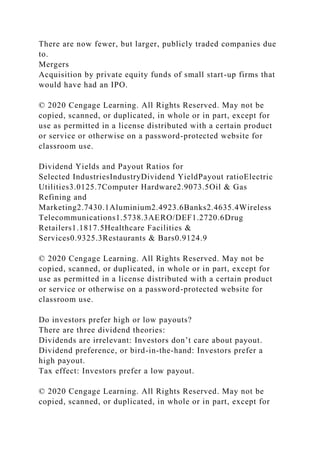
Current Value of Operations
Expected FCF = $90 million.
Firm expects zero growth: g = 0.
Vop = [FCF(1+g)]/(WACC − g)
Vop = [$90(1+0)]/(0.12 − 0)
Vop = $750 million.
© 2020 Cengage Learning. All Rights Reserved. May not be
copied, scanned, or duplicated, in whole or in part, except for
use as permitted in a license distributed with a certain product
or service or otherwise on a password-protected website for
classroom use.
Other Data for Valuation Analysis
Company has no ST investments.](https://image.slidesharecdn.com/distributionstoshareholdersdividendsandrepurchaseschapt-230104133714-692a1c2e/85/Distributions-to-ShareholdersDividends-and-RepurchasesCHAPT-docx-39-320.jpg)
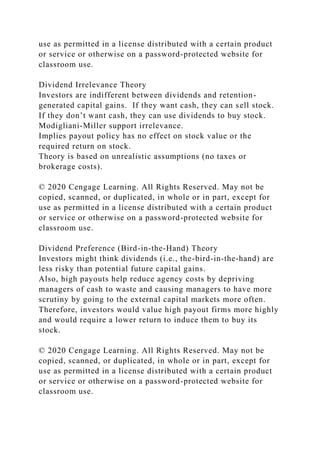
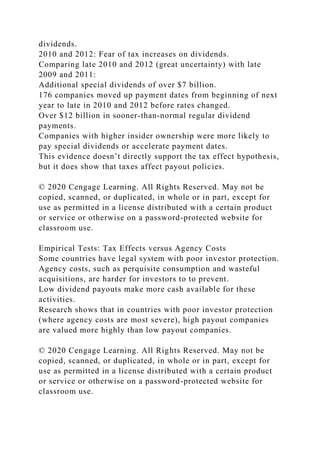
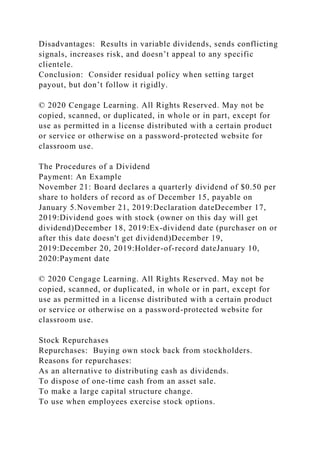
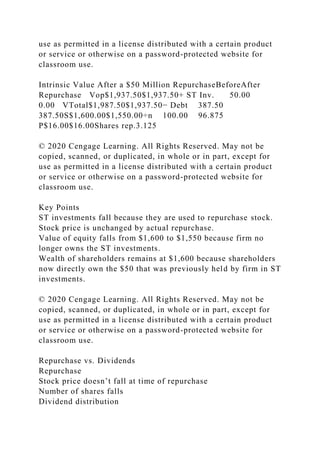
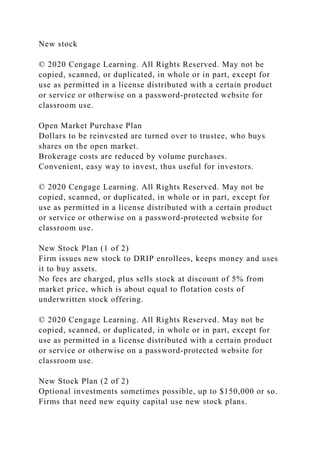
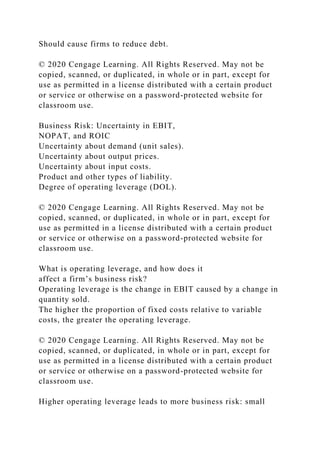
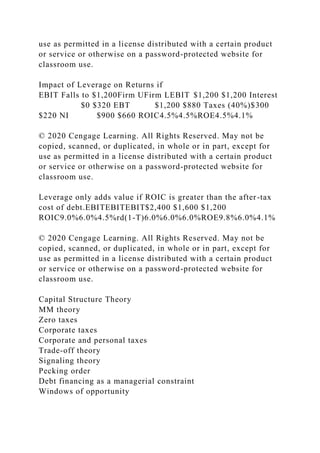
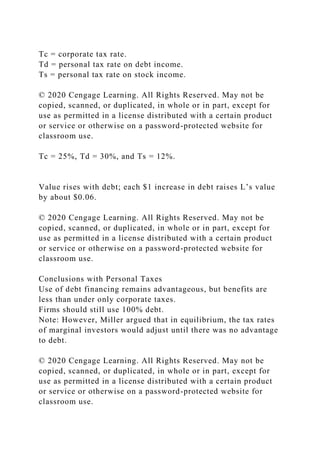
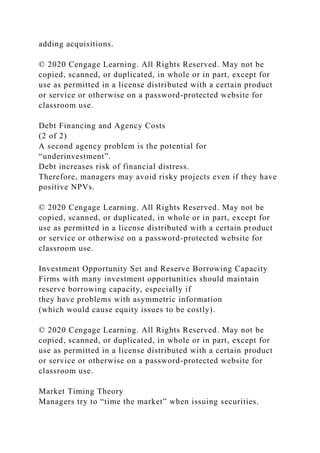
![Company has no preferred stock.
10 million shares outstanding
© 2020 Cengage Learning. All Rights Reserved. May not be
copied, scanned, or duplicated, in whole or in part, except for
use as permitted in a license distributed with a certain product
or service or otherwise on a password-protected website for
classroom use.
Current Valuation Analysis Vop$750 + ST Inv. 0
VTotal$750 − Debt 0S$750 ÷ n 10 P$75.00
© 2020 Cengage Learning. All Rights Reserved. May not be
copied, scanned, or duplicated, in whole or in part, except for
use as permitted in a license distributed with a certain product
or service or otherwise on a password-protected website for
classroom use.
Investment bankers provided estimates of rd for different
capital
structures.wd0%20%30%40%50%rd0.0%8.0%8.5%10.0%12.0%
If company recapitalizes, it will use proceeds from debt
issuance to repurchase stock.
© 2020 Cengage Learning. All Rights Reserved. May not be
copied, scanned, or duplicated, in whole or in part, except for
use as permitted in a license distributed with a certain product
or service or otherwise on a password-protected website for
classroom use.
The Cost of Equity at Different Levels of Debt: Hamada’s
Formula
MM theory implies that beta changes with leverage.
bU is the beta of a firm when it has no debt (the unlevered beta)
b = bU [1 + (1 - T)(wd/ws)]](https://image.slidesharecdn.com/distributionstoshareholdersdividendsandrepurchaseschapt-230104133714-692a1c2e/85/Distributions-to-ShareholdersDividends-and-RepurchasesCHAPT-docx-40-320.jpg)
![© 2020 Cengage Learning. All Rights Reserved. May not be
copied, scanned, or duplicated, in whole or in part, except for
use as permitted in a license distributed with a certain product
or service or otherwise on a password-protected website for
classroom use.
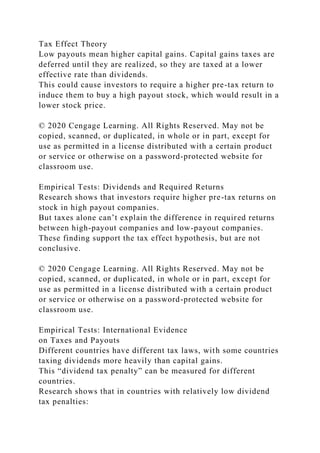
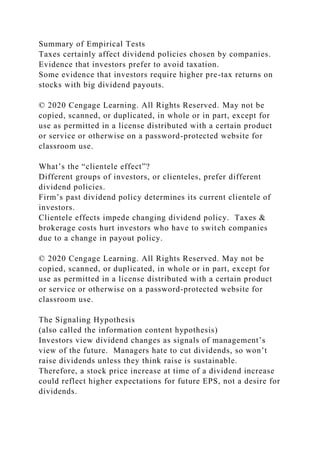
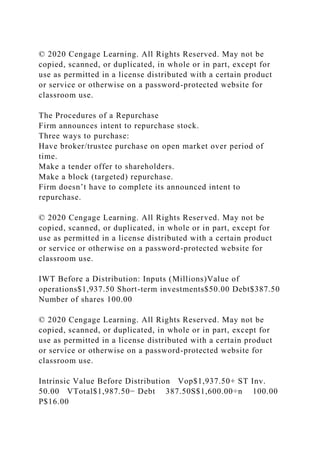
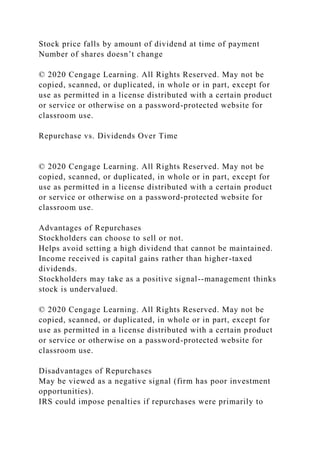
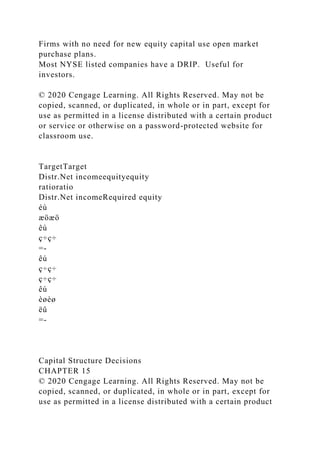
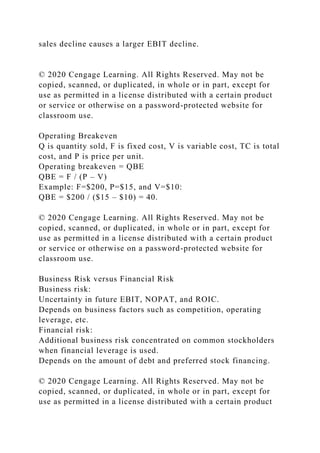
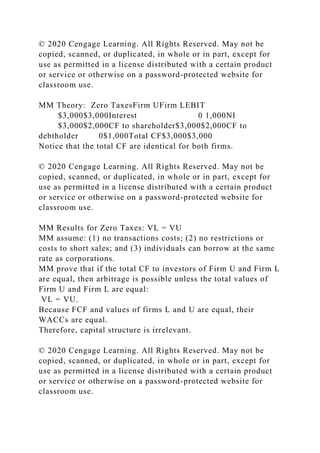
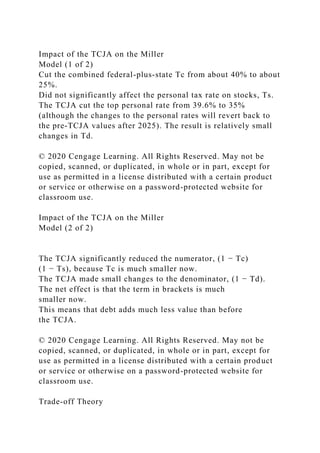
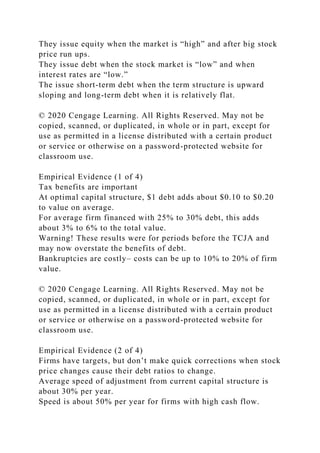
The Cost of Equity for wd = 20%
Use Hamada’s equation to find beta:
b = bU [1 + (1 - T)(wd/ws)]
= 1.0 [1 + (1-0.25) (20% / 80%) ]
= 1.188
Use CAPM to find the cost of equity:
rs= rRF + bL (RPM)
= 6% + 1.188 (6%) = 13.13%
© 2020 Cengage Learning. All Rights Reserved. May not be
copied, scanned, or duplicated, in whole or in part, except for
use as permitted in a license distributed with a certain product
or service or otherwise on a password-protected website for
classroom use.
The WACC for wd = 20%
WACC = wd (1-T) rd + ws rs
WACC =
0.2 (1 – 0.25) (8%) + 0.8 (13.13%)
WACC = 11.7%
Repeat this for all capital structures under consideration.
© 2020 Cengage Learning. All Rights Reserved. May not be
copied, scanned, or duplicated, in whole or in part, except for
use as permitted in a license distributed with a certain product
or service or otherwise on a password-protected website for
classroom use.
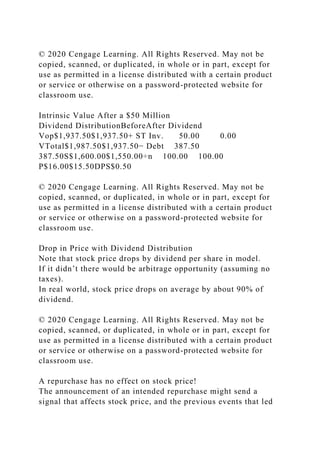
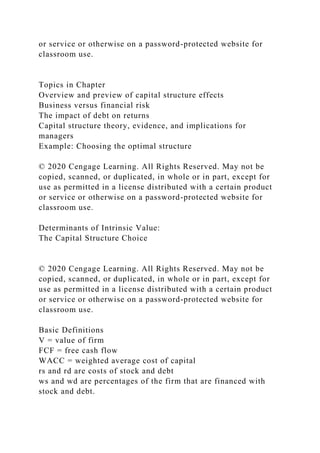
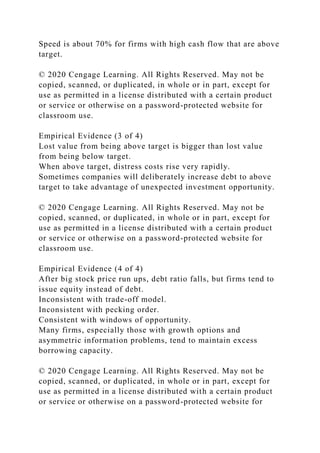
Beta, rs, and
WACCwd0%20%30%40%50%rd0.0%8.0%8.5%10.0%12.0%ws1](https://image.slidesharecdn.com/distributionstoshareholdersdividendsandrepurchaseschapt-230104133714-692a1c2e/85/Distributions-to-ShareholdersDividends-and-RepurchasesCHAPT-docx-41-320.jpg)
![00%80%70%60%50%b1.001.1881.321.501.75rs12.00%13.13%1
3.93%15.00%16.50%WACC12.00%11.70%11.66%12.00%12.75
%
The WACC is minimized for wd = 30%. This is the optimal
capital structure.
© 2020 Cengage Learning. All Rights Reserved. May not be
copied, scanned, or duplicated, in whole or in part, except for
use as permitted in a license distributed with a certain product
or service or otherwise on a password-protected website for
classroom use.
Corporate Value for wd = 20%
Vop = [FCF(1+g)]/(WACC − g)
Vop = [$90(1+0)]/(0.117 − 0)
Vop = $769.23 million.
Debt = DNew = wd …](https://image.slidesharecdn.com/distributionstoshareholdersdividendsandrepurchaseschapt-230104133714-692a1c2e/85/Distributions-to-ShareholdersDividends-and-RepurchasesCHAPT-docx-42-320.jpg)


![Fmch17[1]](https://cdn.slidesharecdn.com/ss_thumbnails/fmch171-211219052311-thumbnail.jpg?width=640&height=640&fit=bounds)


